Occupational Exposure and Environmental Release: The Case Study of Pouring TiO2 and Filler Materials for Paint Production

 , ,
, ,  , , and
  add
Show full author list
add
Show full author list
Abstract
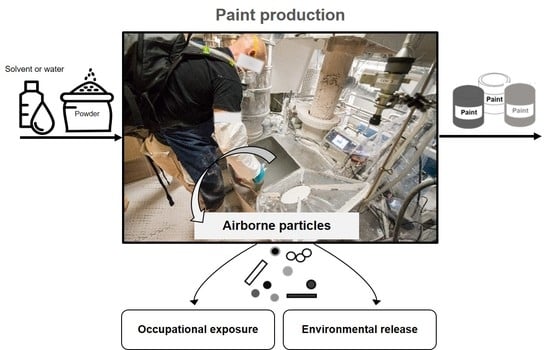
1. Introduction
2. Materials and Methods
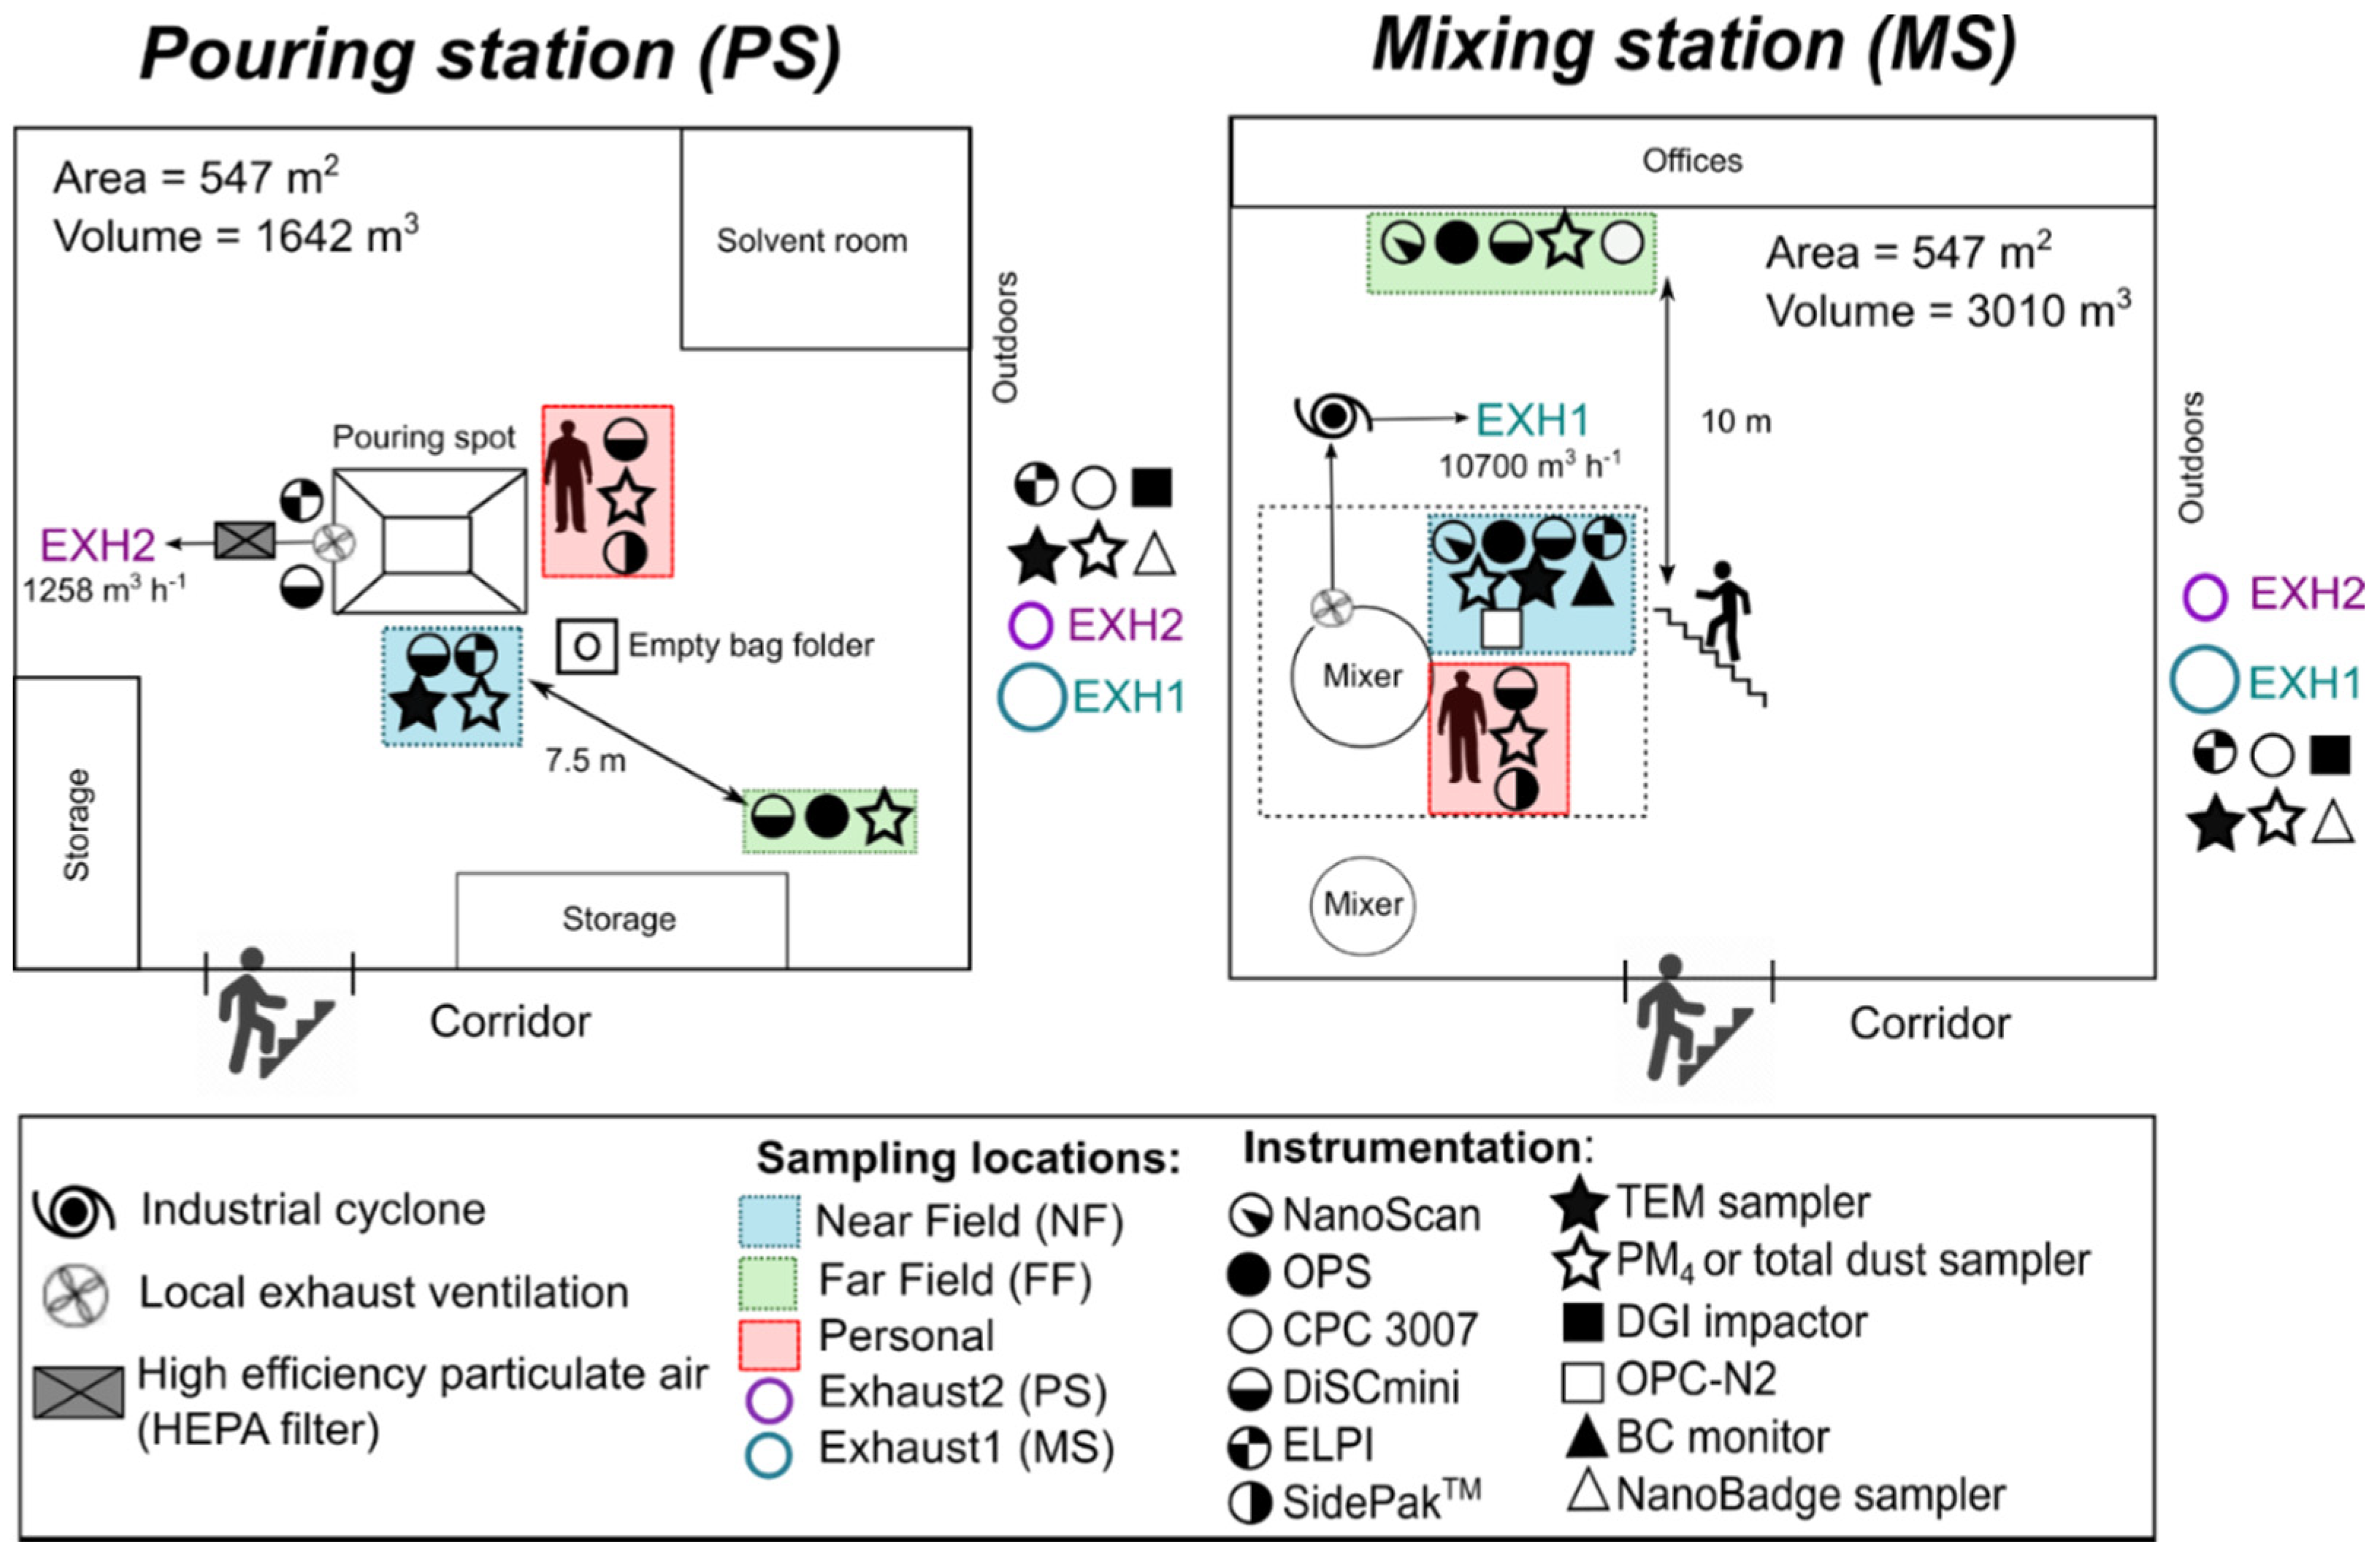
2.1. Work Environment and Measurement Locations
2.2. Raw Materials Characterization
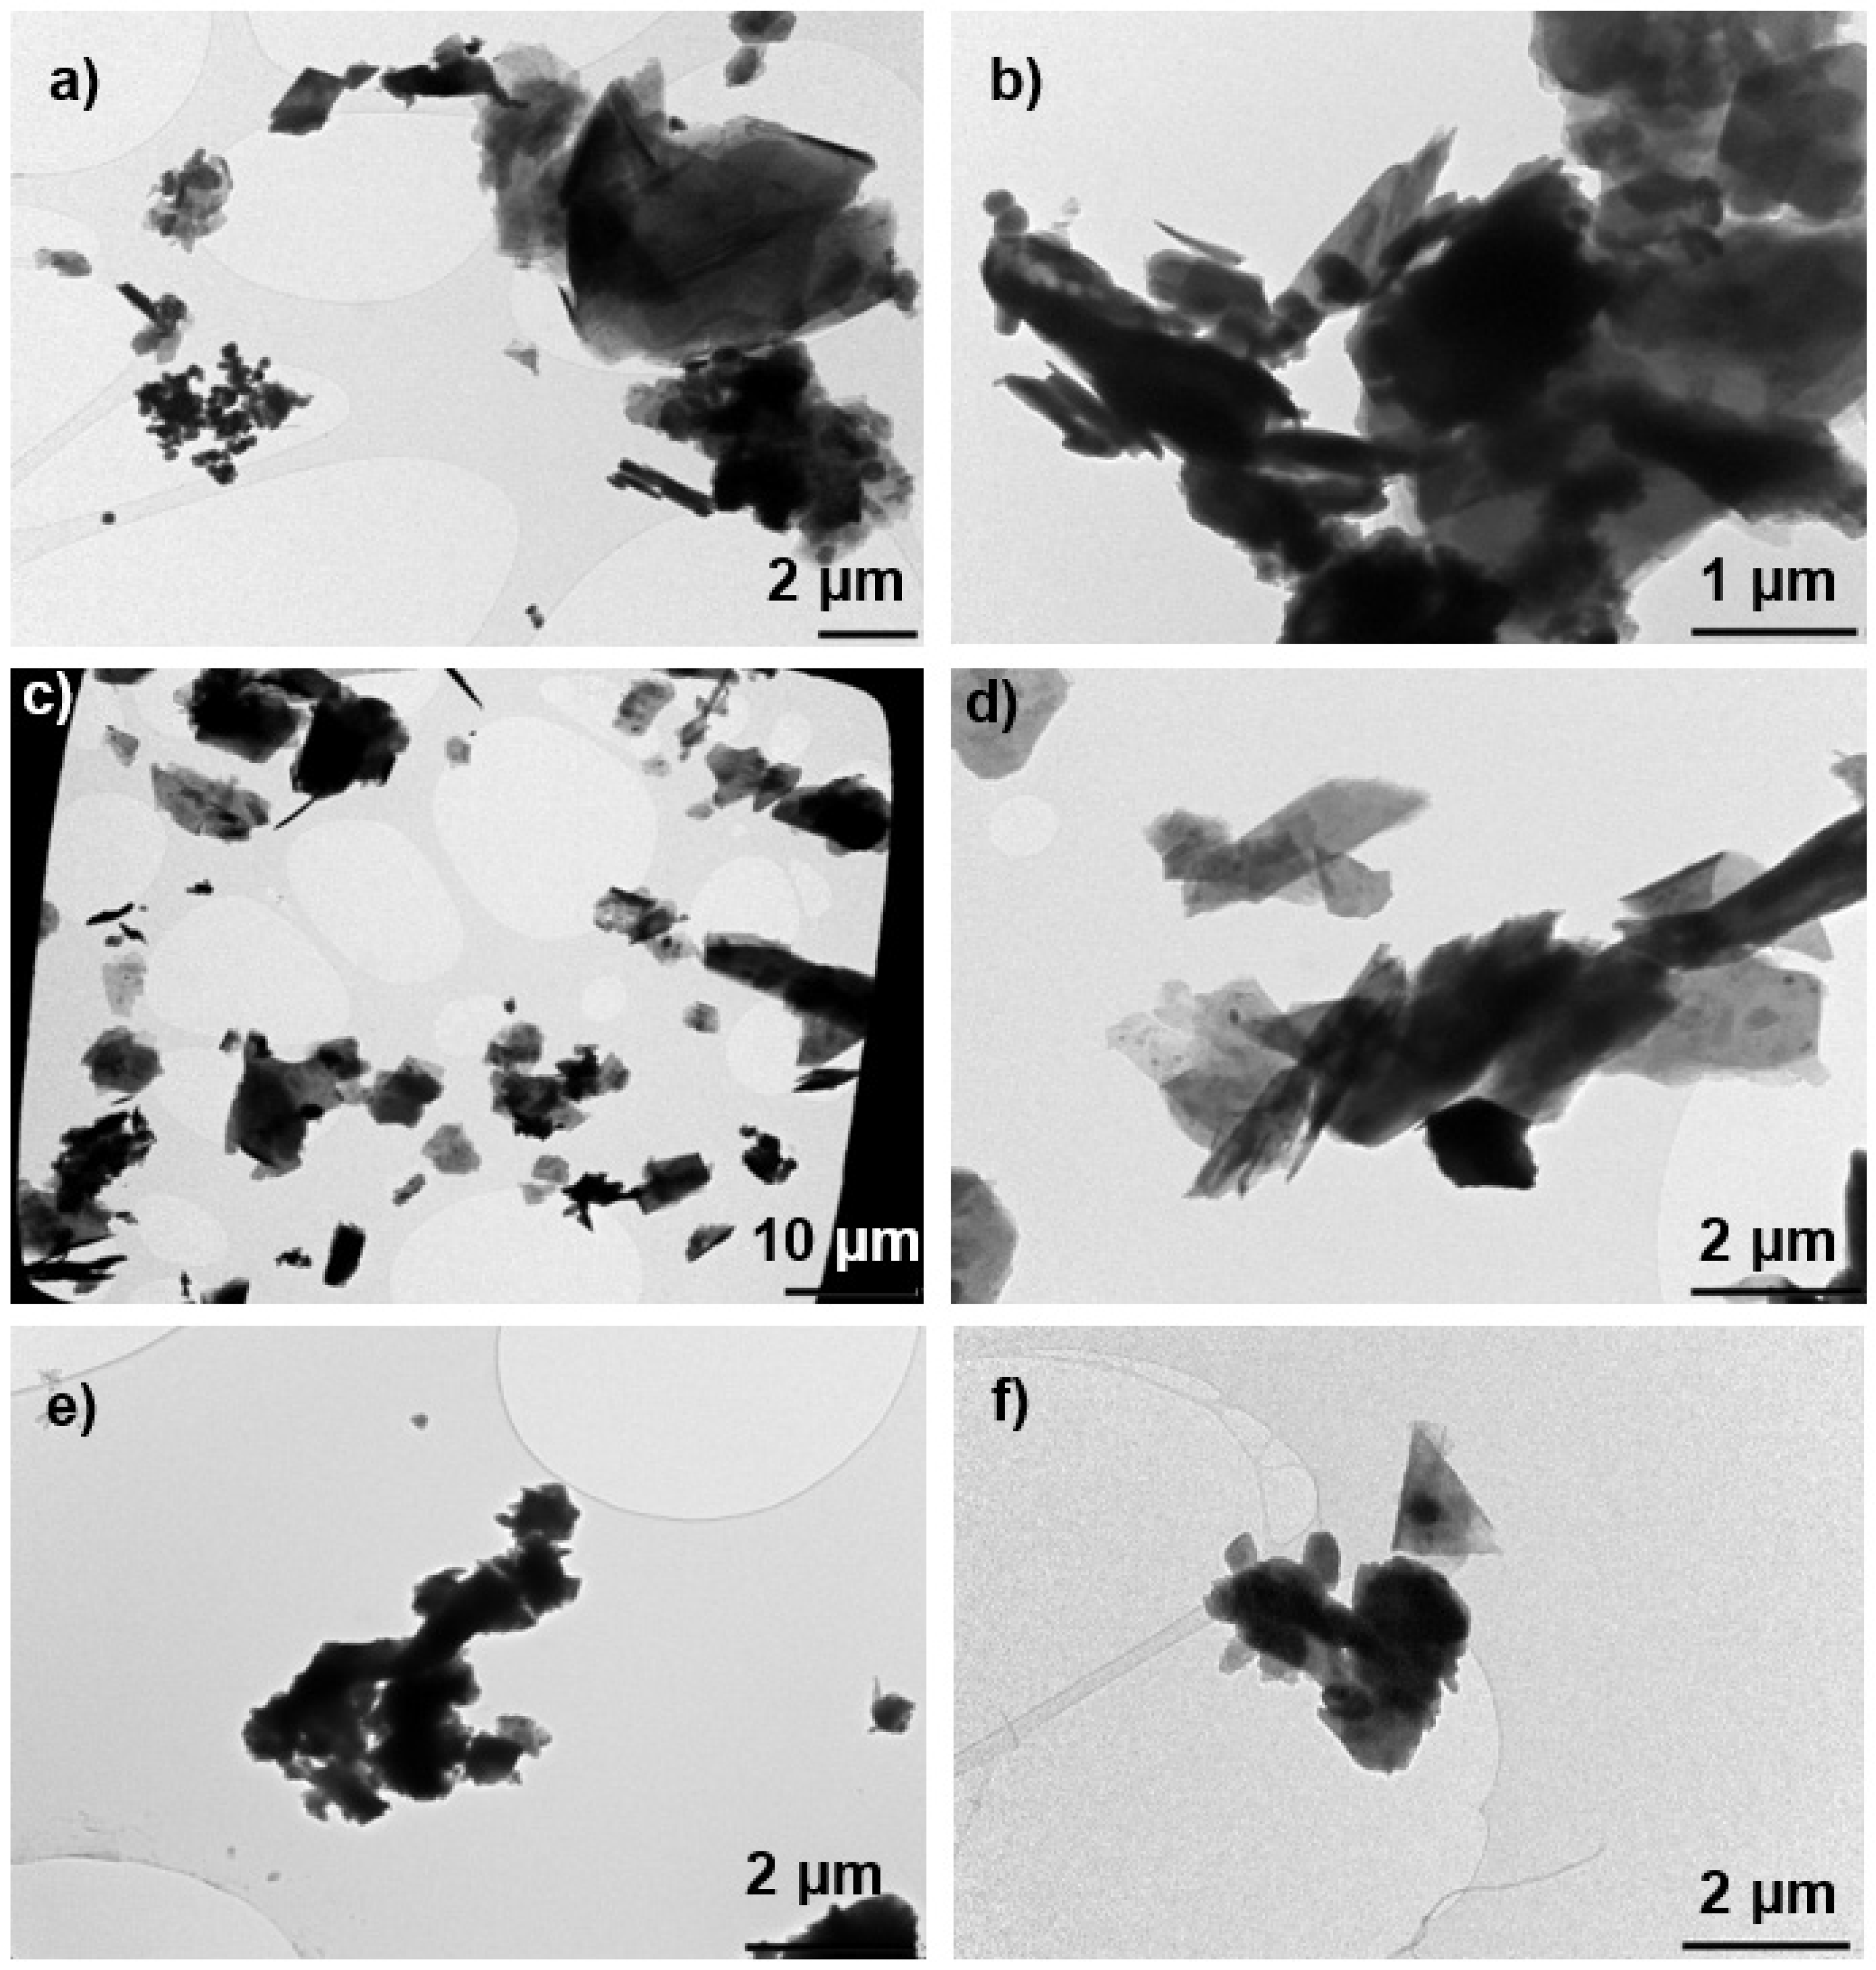
- Primary particle size, morphology, and elemental composition by scanning electron microscopy (SEM; using a FEI Quanta 200 microscope), operating at an accelerating voltage of 1–2 kV and at magnifications between 20,000× and 50,000×, and transmission electron microscopy (TEM; using a Jeol JEM 1400 Plus microscope), operating at an accelerating voltage of 120 kV, and coupled to an energy dispersive X-ray spectroscopy (EDS; AZTEC from Oxford Instruments). The powders were dispersed in aqueous media with a small amount of ethanol for deagglomeration and deposited on a Ni TEM grids;
- Specific surface area (SSA) analysis by using the Brunauer–Emmett–Teller (BET) method with nitrogen absorption using an Autosorb-1-MP (Quantachrome, Boynton Beach, FL, USA; [43]);
- Dustiness in terms of respirable mass fraction, by using the small rotating drum (SRD; EN17199-4:2019 [41]), respirable dust sampling using GK2.69 cyclone, and size distribution analysis using an electrical low-pressure impactor (ELPI; Dekati model ELPI and ELPI+, Dekati Ltd., Kangasala, Finland);
- Bulk density according to EN17199-1:2019 [44] using a measuring cylinder of known volume of 10 cm3 and an analytical balance with a resolution of 0.01 g.
2.3. Measurement Strategy
2.4. Particle Monitoring and Sampling Techniques
- Aerodynamic particle size distributions were measured using an electrical low-pressure impactor (ELPI; Dekati model ELPI and ELPI+, Dekati Ltd., Kangasala, Finland) in 14 size channels between 6 nm or 7 nm and 10 µm with 1 s intervals [52].
- Miniature diffusion size classifiers (DiSCmini (DM); Testo SE and Co. KGaA, Lenzkirch, Germany) were used to measure total particle number, mean particle diameter, and the lung deposited surface area (LDSA) of particles with modal diameter in the range of 10–300 nm with 1 s time resolution [55]. To avoid artifacts due to coarse particles, the DM was equipped with an inlet separator with a cutoff diameter of 700 nm.
- Aerosol black carbon detector (BC; Berkeley; [56]) and aethalometer AE33 (Magee Scientific, Berkeley, CA, USA) were used to measure BC mass concentration with 60 s intervals.
- Collection of respirable dust (d50 cut size of 4 µm) for gravimetric and inorganic chemical analysis by using Fluoropore™ (Millipore, Billerica, MA, USA) membrane filters 37-mm polytetrafluorethylene (PTFE) with a 0.8-μm pore size mounted in cyclones GK2.69 (BGI Inc., Waltham, MA, USA) or SCC1.062 (BGI Inc., Waltham, MA, USA), connected to portable sampling pumps (Apex2, Casella Inc., Bedford, UK) operating at 4.2 L min−1 or 1.05 L min−1, respectively [65].
- Note: Particle mass concentrations were gravimetrically determined by pre- and post-weighing the filters collected using an electronic microbalance (Mettler Toledo Model XP6) with ±1 μg sensitivity located in a climate-controlled weighing room (relative humidity (RH) = 50% T = 22 °C). Three blind filters were stored to be used as laboratory blanks to correct for handling and environmental factors.
- Collection of size-fractioned fine dust for gravimetric analysis by using a 4-stage cascade impactor, without pre separator mounted with 47-mm aluminum foils (Dekati® Gravimetric Impactor-DGI, model DGI-1571, Dekati Ltd., Kangasala, Finland) at a flow rate of 70 L min−1, which results in calculated d50 cut-off diameters of >2.5, 1.0–2.5, 0.5–1, and 0.2–0.5 μm. An after-filter collected particles <0.2 µm. Weighing was conducted as mentioned above.
- Isokinetic sampling on the quartz filter according to EN 13284-1 (reference method for characterization of TSP) for determination of TSP mass concentrations and combined with adsorption solutions according to EN 14385:2004 [66] (reference method for characterization of heavy metals in atmospheric emission of stationary sources). This filter is then analyzed together with the adsorption solutions in order to determine the concentration of 11 metals (As, Cd, Cr, Co, Cu, Mn, Ni, Pb, Sb, Ti, and V) by means of inductively coupled plasma—optical emission spectrometry (ICP-OES).
- Collection of airborne particles on 400-mesh Cu grids precoated with holey carbon film by using a mini-particle sampler (MPS; Ecomesure; [67]) connected to a pump (Apex2, Casella Inc., Bedford, UK) operating at 0.3 L min−1 during 2–5 min sampling time. Aerosol samples collected by MPS were analyzed by TEM (Jeol JEM 1400 Plus microscope), operating at an accelerating voltage of 120 kV, and coupled to an EDS system (AZTEC from Oxford Instruments, High Wycombe, UK). In situ EDS chemical analysis of agglomerates and individual particles were performed with an acquisition time of 100 s.
- Airborne gas-phase organic compounds ((S)VOC) were sampled on Tenax TA with GilAir5 pumps (Gilian, St. Petersburg, FL, USA) for 79–81 min with a flow of 93–110 mL min−1 resulting in sampled volumes of 7.9–9.6 L. The Tenax TA tubes were cleaned before sampling in a stream of pure nitrogen at 300 °C for 180 min and 340 °C for 30 min using a sample tube conditioning apparatus (TC-20, Markes International, Llantrisant, UK). The Tenax TA tubes were analyzed by thermal desorption gas chromatography and mass spectrometry (TD-GC–MS) using a Perkin Elmer Turbo Matrix 350 thermal desorber coupled to a Bruker SCION TQ GC-MS system (Bruker Daltonics, Bremen, Germany). Desorption was carried out in a He flow of 1 mL/min at 275 °C for 20 min and desorbed (S)VOCs collected in a cold trap at −20 °C, followed by flash desorption of the cold trap at 275 °C for 1.5 min transferring the (S)VOCs to the GC column. The column was a 5% phenyl polydimethylsiloxane of 30 m × 0.25 mm with 0.25 µm film thickness (VF-5MS, Agilent Technologies, CA, USA). The GC oven program was 40 °C for 2 min, then 20 °C/min to 150 °C hold for 10 min, then 5 °C/min to 275 °C hold for 6 min, and finally 3 °C/min to 300 °C hold for 1 min. The transfer line and the source were kept at 280 °C. The MS was operated with electron ionization (EI) in scan mode (mass range m/z 40–500). Tentative identification of the organic compounds was performed by MS Data Review, Version 8.0.1 (Bruker, Billerica, MA, USA), and NIST/EPA/NIH Mass Spectral Library Version 2.0g, 19 May 2011 (NIST, Gaithersburg, MD, USA). The terpenes were identified using authentic standards as well. The air concentrations of (S)VOCs were semi-quantified using n-decane as a calibration standard.
- Velocity measurements of local exhaust ventilation stacks were measured by a pitot tube.
2.5. Data Processing
3. Results
3.1. Raw Materials Characterization
3.2. Emissions and Exposure to Chemicals and Particles
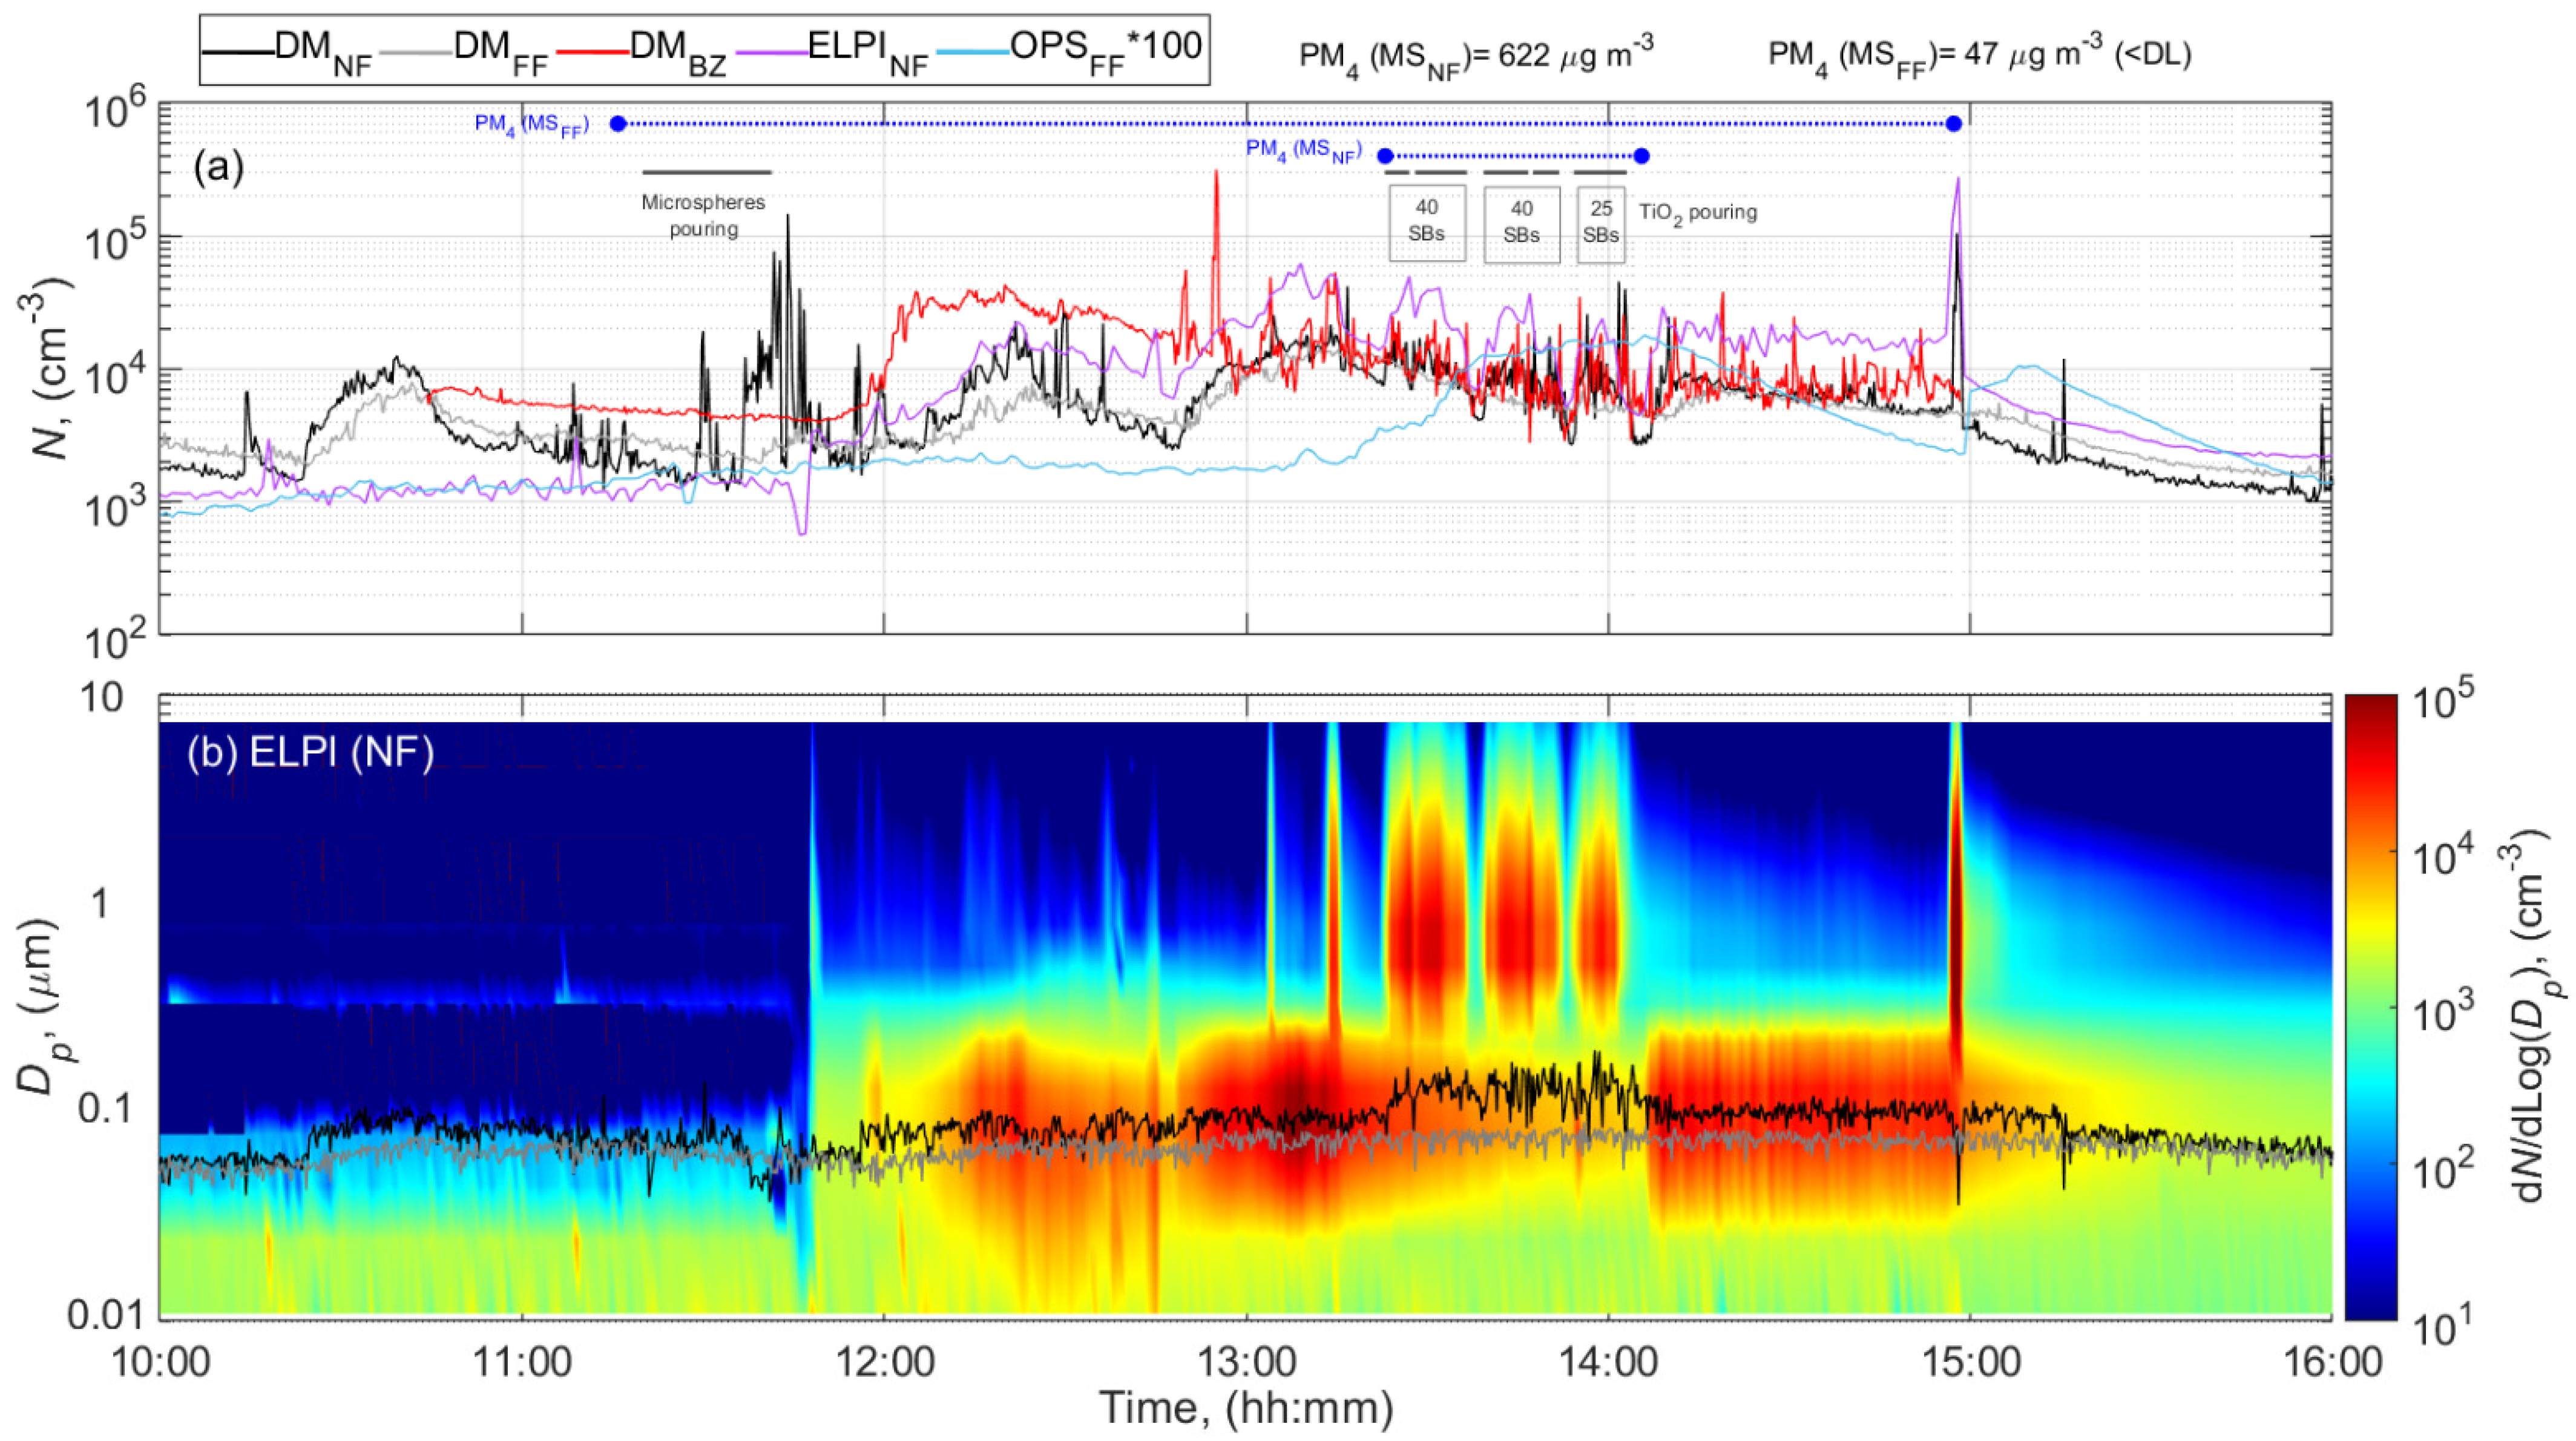
3.2.1. Pouring Activity at the Mixing Station
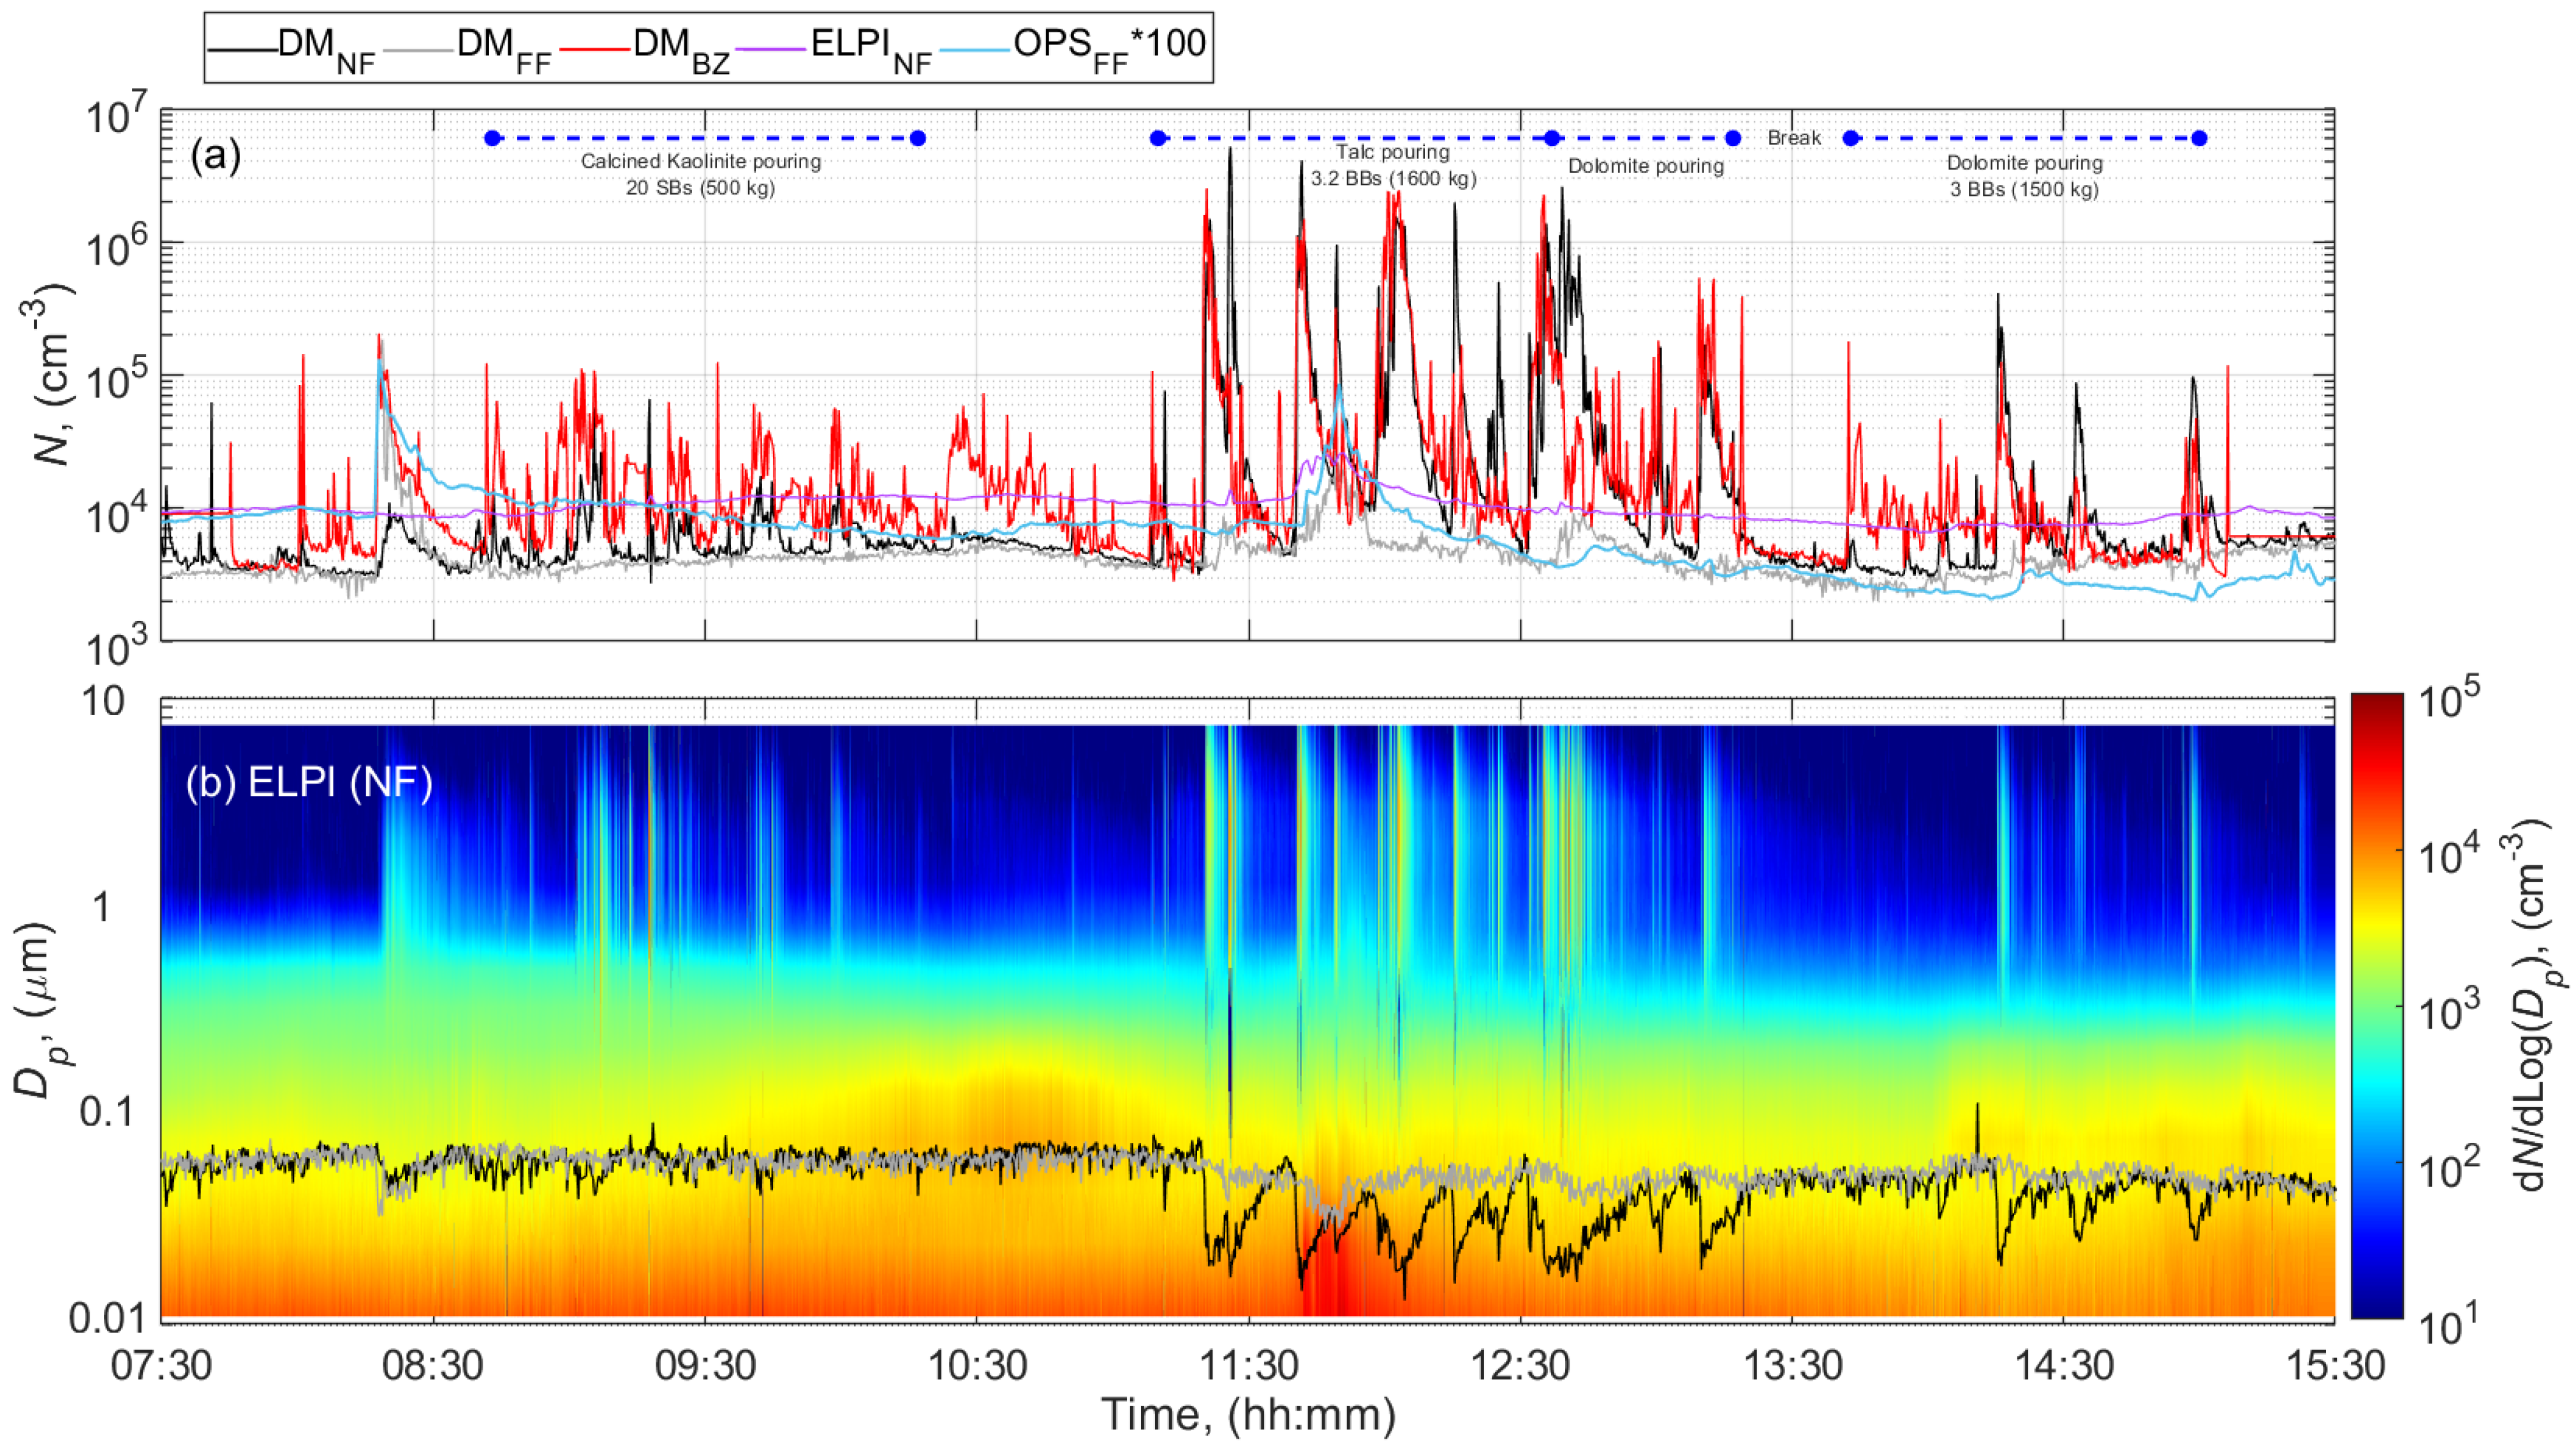
3.2.2. Pouring Activity at the Pouring Station
3.3. Comparison of Worker Exposure Concentrations with Recommended Exposure Limits
3.4. Environmental Release
4. Discussion
4.1. Material Characteristics and Propensity to Dust Release
4.2. Particle Emissions and Impact on Worker Exposure
4.3. Environmental Emissions
5. Conclusions
Supplementary Materials
Author Contributions
Funding
Institutional Review Board Statement
Informed Consent Statement
Data Availability Statement
Acknowledgments
Conflicts of Interest
References
- Viitanen, A.-K.; Uuksulainen, S.; Koivisto, A.J.; Hämeri, K.; Kauppinen, T. Workplace Measurements of Ultrafine Particles—A Literature Review. Ann. Work Expo. Health 2017, 61, 749–758. [Google Scholar] [CrossRef] [PubMed]
- Fonseca, A.S.; Viana, M.; Querol, X.; Moreno, N.; de Francisco, I.; Estepa, C.; de la Fuente, G.F. Workplace Exposure to Process-Generated Ultrafine and Nanoparticles in Ceramic Processes Using Laser Technology BT—Indoor and Outdoor Nanoparticles: Determinants of Release and Exposure Scenarios; Viana, M., Ed.; Springer International Publishing: Cham, Switzerland, 2016; pp. 159–179. [Google Scholar]
- Fonseca, A.S.; Maragkidou, A.; Viana, M.; Querol, X.; Hämeri, K.; de Francisco, I.; Estepa, C.; Borrell, C.; Lennikov, V.; de la Fuente, G.F. Process-Generated Nanoparticles from Ceramic Tile Sintering: Emissions, Exposure and Environmental Release. Sci. Total Environ. 2015, 565, 922–932. [Google Scholar] [CrossRef] [PubMed]
- Kling, K.I.; Levin, M.; Jensen, A.C.Ø.; Jensen, K.A.; Koponen, I.K. Size-Resolved Characterization of Particles and Fibers Released during Abrasion of Fiber-Reinforced Composite in a Workplace Influenced by Ambient Background Sources. Aerosol Air Qual. Res. 2016, 16, 11–24. [Google Scholar] [CrossRef]
- Van Broekhuizen, P.; Van Broekhuizen, F.; Cornelissen, R.; Reijnders, L. Workplace Exposure to Nanoparticles and the Application of Provisional Nanoreference Values in Times of Uncertain Risks. J. Nanopart. Res. 2012, 14, 770. [Google Scholar] [CrossRef]
- Buist, H.E.; Oosterwijk, M.T.T. Applicability of Provisional NRVs to PGNPs and FCNPs. 2017, Volume 49. Available online: https://www.researchgate.net/profile/Pieter_Broekhuizen/publication/318562315_Applicability_of_provisional_NRVs_to_PGNPs_and_FCNPs/links/597073dba6fdccc6c973a8e6/Applicability-of-provisional-NRVs-to-PGNPs-and-FCNPs.pdf (accessed on 17 February 2020).
- Statista. Paint and Coatings Industry—Statistics & Facts. 2019. Available online: https://www.statista.com/topics/4755/paint-and-coatings-industry/ (accessed on 17 February 2020).
- The Global Report Painting a Picture of the Industry. Available online: www.Akzonobel.com (accessed on 25 March 2020).
- Piccinno, F.; Gottschalk, F.; Seeger, S.; Nowack, B. Industrial Production Quantities and Uses of Ten Engineered Nanomaterials in Europe and the World. J. Nanopart.Res. 2012, 14, 1109. [Google Scholar] [CrossRef]
- Schurr, G.G. Paint. In Kirk-Othmer Encyclopedia OfChemical Technology, 3rd ed.; Mark, H.E., Othmer, D.E., Overberger, C.G., Seaborg, G., Grayson, M., Eds.; John Wiley & Sons: New York, NY, USA, 1981; Volume 16. [Google Scholar]
- ILO. Paint and Coating Manufacture. International Labour Organization. 2011. Available online: https://www.iloencyclopaedia.org/component/k2/item/380-paint-and-coating-manufacture (accessed on 17 February 2020).
- US EPA. Sector Performance Report 2008; EPA 100-R-08-002; US Environmental Protection Agency, Sector Strategies Division, Office of Cross Media Programs (1807T): Washington, DC, USA, 2008.
- Koponen, I.K.; Koivisto, A.J.; Jensen, K.A. Worker Exposure and High Time-Resolution Analyses of Process-Related Submicrometre Particle Concentrations at Mixing Stations in Two Paint Factories. Ann. Occup. Hyg. 2015, 59, 749–763. [Google Scholar] [CrossRef]
- Møller, P.; Wallin, H. Genotoxic Hazards of Azo Pigments and Other Colorants Related to 1-Phenylazo-2-Hydroxynaphthalene. Mutat. Res. Mutat. Res. 2000, 462, 13–30. [Google Scholar] [CrossRef]
- Saber, A.T.; Jensen, K.A.; Jacobsen, N.R.; Birkedal, R.; Mikkelsen, L.; Moller, P.; Loft, S.; Wallin, H.; Vogel, U. Inflammatory and Genotoxic Effects of Nanoparticles Designed for Inclusion in Paints and Lacquers. Nanotoxicology 2012, 6, 453–471. [Google Scholar] [CrossRef]
- Smulders, S.; Luyts, K.; Brabants, G.; Van Landuyt, K.; Kirschhock, C.; Smolders, E.; Golanski, L.; Vanoirbeek, J.; Hoet, P.H.M. Toxicity of Nanoparticles Embedded in Paints Compared with Pristine Nanoparticles in Mice. Toxicol. Sci. 2014, 141, 132–140. [Google Scholar] [CrossRef]
- Yanamala, N.; Farcas, M.T.; Hatfield, M.K.; Kisin, E.R.; Kagan, V.E.; Geraci, C.L.; Shvedova, A.A. In Vivo Evaluation of the Pulmonary Toxicity of Cellulose Nanocrystals: A Renewable and Sustainable Nanomaterial of the Future. ACS Sustain. Chem. Eng. 2014, 2, 1691–1698. [Google Scholar] [CrossRef]
- Wiemann, M.; Vennemann, A.; Wohlleben, W. Lung Toxicity Analysis of Nano-Sized Kaolin and Bentonite: Missing Indications for a Common Grouping. Nanomaterials 2020, 10, 204. [Google Scholar] [CrossRef] [PubMed]
- Stone, V.; Miller, M.R.; Clift, M.J.D.; Elder, A.; Mills, N.L.; Møller, P.; Schins, R.P.F.; Vogel, U.; Kreyling, W.G.; Jensen, K.A.; et al. Nanomaterials versus Ambient Ultrafine Particles: An Opportunity to Exchange Toxicology Knowledge. Environ. Health Perspect. 2017, 125, 1–17. [Google Scholar] [CrossRef] [PubMed]
- EU-OSHA. Workplace Exposure to Nanomaterials; European Agency for Safety and Health at Work: Bilbao, Spain, 2009. [Google Scholar]
- Gakidou, E.; Afshin, A.; Abajobir, A.A.; Abate, K.H.; Abbafati, C.; Abbas, K.M.; Abd-Allah, F.; Abdulle, A.M.; Abera, S.F.; Aboyans, V.; et al. Global, Regional, and National Comparative Risk Assessment of 84 Behavioural, Environmental and Occupational, and Metabolic Risks or Clusters of Risks, 1990–2016: A Systematic Analysis for the Global Burden of Disease Study 2016. Lancet 2017, 390, 1345–1422. [Google Scholar] [CrossRef]
- Kyung, S.Y.; Jeong, S.H. Adverse Health Effects of Particulate Matter. J. Korean Med. Assoc. 2017, 60, 391–398. [Google Scholar] [CrossRef]
- Landrigan, P.J.; Fuller, R.; Acosta, N.J.R.; Adeyi, O.; Arnold, R.; Basu, N.; Baldé, A.B.; Bertollini, R.; Bose-O’Reilly, S.; Boufford, J.I.; et al. The Lancet Commission on Pollution and Health. Lancet 2018, 391, 462–512. [Google Scholar] [CrossRef]
- Lee, B.J.; Kim, B.; Lee, K. Air Pollution Exposure and Cardiovascular Disease. Toxicol. Res. 2014, 30, 71–75. [Google Scholar] [CrossRef]
- World Health Organization. Ambient Air Pollution: A Global Assessment of Exposure and Burden of Disease; World Health Organization: Geneva, Switzerland, 2016. [Google Scholar]
- Health Effects Institute. State of Global Air 2018; Health Effects Institute: Cambridge, MA, USA, 2018. [Google Scholar]
- Alleman, L.Y.; Lamaison, L.; Perdrix, E.; Robache, A.; Galloo, J.-C. PM10 Metal Concentrations and Source Identification Using Positive Matrix Factorization and Wind Sectoring in a French Industrial Zone. Atmos. Res. 2010, 96, 612–625. [Google Scholar] [CrossRef]
- Setyan, A.; Flament, P.; Locoge, N.; Deboudt, K.; Riffault, V.; Alleman, L.Y.; Schoemaecker, C.; Arndt, J.; Augustin, P.; Healy, R.M.; et al. Investigation on the Near-Field Evolution of Industrial Plumes from Metalworking Activities. Sci. Total Environ. 2019, 668, 443–456. [Google Scholar] [CrossRef]
- Buteau, S.; Shekarrizfard, M.; Hatzopolou, M.; Gamache, P.; Liu, L.; Smargiassi, A. Air Pollution from Industries and Asthma Onset in Childhood: A Population-Based Birth Cohort Study Using Dispersion Modeling. Environ. Res. 2020, 185, 109180. [Google Scholar] [CrossRef]
- Manisalidis, I.; Stavropoulou, E.; Stavropoulos, A.; Bezirtzoglou, E. Environmental and Health Impacts of Air Pollution: A Review. Front. Public Health 2020, 8, 14. [Google Scholar] [CrossRef]
- ECHA. Guidance on Information Requirements and Chemical Safety Assessment Chapter R. 14: Occupational Exposure Assessment; European Chemicals Agency: Helsinki, Finland, 2016.
- Kuhlbusch, T.A.; Asbach, C.; Fissan, H.; Göhler, D.; Stintz, M. Nanoparticle Exposure at Nanotechnology Workplaces: A Review. Part. Fibre Toxicol. 2011, 8, 22. [Google Scholar] [CrossRef]
- Sørensen, S.N.; Baun, A.; Burkard, M.; Dal Maso, M.; Foss Hansen, S.; Harrison, S.; Hjorth, R.; Lofts, S.; Matzke, M.; Nowack, B.; et al. Evaluating Environmental Risk Assessment Models for Nanomaterials According to Requirements along the Product Innovation Stage-Gate Process. Environ. Sci. Nano 2019, 6, 505–518. [Google Scholar] [CrossRef]
- Fransman, W.; Van Tongeren, M.; Cherrie, J.W.; Tischer, M.; Schneider, T.; Schinkel, J.; Kromhout, H.; Warren, N.; Goede, H.; Tielemans, E. Advanced Reach Tool (ART): Development of the Mechanistic Model. Ann. Occup. Hyg. 2011, 55, 957–979. [Google Scholar] [PubMed]
- Koivisto, A.J.; Jensen, A.C.Ø.; Levin, M.; Kling, K.I.; Maso, M.D.; Nielsen, S.H.; Jensen, K.A.; Koponen, I.K. Testing the near Field/Far Field Model Performance for Prediction of Particulate Matter Emissions in a Paint Factory. Environ. Sci. Process. Impacts 2015, 17, 62–73. [Google Scholar] [CrossRef] [PubMed]
- Koivisto, A.J.; Kling, K.I.; Hänninen, O.; Jayjock, M.; Löndahl, J.; Wierzbicka, A.; Fonseca, A.S.; Uhrbrand, K.; Boor, B.E.; Jiménez, A.S.; et al. Source Specific Exposure and Risk Assessment for Indoor Aerosols. Sci. Total Environ. 2019, 668, 13–24. [Google Scholar] [CrossRef] [PubMed]
- Ribalta, C.; Viana, M.; López-Lilao, A.; Estupiñá, S.; Minguillón, M.C.; Mendoza, J.; Díaz, J.; Dahmann, D.; Monfort, E. On the Relationship between Exposure to Particles and Dustiness during Handling of Powders in Industrial Settings. Ann. Work Exp. Health 2019, 63, 107–123. [Google Scholar] [CrossRef]
- Ribalta, C.; López-Lilao, A.; Estupiñá, S.; Fonseca, A.S.; Tobías, A.; García-Cobos, A.; Minguillón, M.C.; Monfort, E.; Viana, M. Health Risk Assessment from Exposure to Particles during Packing in Working Environments. Sci. Total Environ. 2019, 671, 474–487. [Google Scholar] [CrossRef]
- Fonseca, A.S.; Koivisto, A.J.; Koponen, I.K.; Jensen, A.C.Ø.; Kling, K.I.; Levin, M.; Mackevica, A.; Van Tongeren, M.; Sanchez, A.; Fransman, W. Goodness of Dustiness Index for Predicting Human Exposure to Airborne Nanomaterials. In Proceedings of the New Tools and Approaches for Nanomaterial Safety Assessment Conference 2017, Malaga, Spain, 7–9 February 2017. [Google Scholar]
- Workplace Exposure—Measurement of Dustiness of Bulk Materials That Contain or Release Respirable Noaa or Other Respirable Particles—Part 3: Continuous Drop Method. Available online: https://standards.iteh.ai/catalog/standards/cen/dcbe76ba-cfe9-4e1e-9a4f-3bb891a8e919/en-17199-3-2019 (accessed on 17 February 2020).
- Workplace Exposure—Measurement of Dustiness of Bulk Materials That Contain or Release Respirable NOAA or Other Respirable Particles—Part 4: Small Rotating Drum Method. Available online: https://standards.iteh.ai/catalog/standards/cen/e0179504-3eca-4164-bbab-0cac33ba8c24/en-17199-4-2019 (accessed on 17 February 2020).
- The Ministry of Employment. Order on Limit Values for Substances and Materials [Danish]. Arbejdstilsynet, j.Nr. 20205200114, Denmark. 2020. Available online: https://at.dk/regler/bekendtgoerelser/graensevaerdier-stoffer-materialer-698/#Bilag (accessed on 26 May 2020).
- Brunauer, S.; Emmett, P.H.; Teller, E. Adsorption of Gases in Multimolecular Layers. J. Am. Chem. Soc. 1938, 60, 309–319. [Google Scholar] [CrossRef]
- Workplace Exposure—Measurement of Dustiness of Bulk Materials That Contain or Release Respirable NOAA and Other Respirable Particles—Part 1: Requirements and Choice of Test Methods. Available online: https://standards.iteh.ai/catalog/standards/cen/0f864553-5d38-4a7a-b613-b310eb5c7a2d/en-17199-1-2019 (accessed on 17 February 2020).
- OECD. Harmonized Tiered Approach to Measure and Assess the Potential Exposure to Airborne Emissions of Engineered Nano-Objects and Their Agglomerates and Aggregates at Workplaces. ENV/JM/MONO19 2015, 55, JT03378848. [Google Scholar]
- CEN. Workplace Exposure—Assessment of Exposure by Inhalation of Nano-Objects and Their Aggregates and Agglomerates; EN 17058:2018; European Committee for Standardization (CEN): Brussels, Belgium, 2018. [Google Scholar]
- Fonseca, A.S.; Viana, M.; Pérez, N.; Alastuey, A.; Querol, X.; Kaminski, H.; Todea, A.M.; Monz, C.; Asbach, C. Intercomparison of a Portable and Two Stationary Mobility Particle Sizers for Nanoscale Aerosol Measurements. Aerosol Sci. Technol. 2016, 50, 653–668. [Google Scholar] [CrossRef]
- Tritscher, T.; Beeston, M.; Zerrath, A.F.; Elzey, S.; Krinke, T.J.; Filimundi, E.; Bischof, O.F. NanoScan SMPS—A Novel, Portable Nanoparticle Sizing and Counting Instrument. J. Phys. Conf. Ser. 2013, 429, 012061. [Google Scholar] [CrossRef]
- Baron, P.A.; Willeke, K. Aerosol Measurement Principles, Techniques and Applications, 2nd ed.; Wiley: New York, NY, USA, 2001. [Google Scholar]
- McMurry, P.H. Chapter 17 A Review of Atmospheric Aerosol Measurements. Dev. Environ. Sci. 2002, 1, 443–517. [Google Scholar]
- Optical Particle Sizer Model 3330. 2012. Available online: http://www.tsi.com/uploadedFiles/_Site_Root/Products/Literature/Spec_Sheets/3330_5001323_Web.pdf (accessed on 25 June 2020).
- Keskinen, J.; Pietarinen, K.; Lehtimäki, M. Electrical Low Pressure Impactor. J. Aerosol Sci. 1992, 23, 353–360. [Google Scholar] [CrossRef]
- Matson, U.; Ekberg, L.E.; Afshari, A. Measurement of Ultrafine Particles: A Comparison of Two Handheld Condensation Particle Counters. Aerosol Sci. Technol. 2004, 38, 487–495. [Google Scholar] [CrossRef]
- Hand-Held Condensation Particle Counter Model 3007. 2007. Available online: http://www.tsi.com/uploadedFiles/Product_Information/Literature/Spec_Sheets/3007_1930032.pdf (accessed on 6 March 2020).
- Fierz, M.; Houle, C.; Steigmeier, P.; Burtscher, H. Design, Calibration, and Field Performance of a Miniature Diffusion Size Classifier. Aerosol Sci. Technol. 2011, 45, 1–10. [Google Scholar] [CrossRef]
- Caubel, J.J.; Cados, T.E.; Kirchstetter, T.W. A New Black Carbon Sensor for Dense Air Quality Monitoring Networks. Sensors 2018, 18, 738. [Google Scholar] [CrossRef]
- Sousan, S.; Koehler, K.; Hallett, L.; Peters, T.M. Evaluation of the Alphasense Optical Particle Counter (OPC-N2) and the Grimm Portable Aerosol Spectrometer (PAS-1.108). Aerosol Sci. Technol. 2016, 50, 1352–1365. [Google Scholar] [CrossRef]
- Alphasense Ltd. User Manual: OPC-N2 Optical Particle Counter, 072-0300, Issue 3; Alphasense, Ltd.: Braintree, UK, 2015. [Google Scholar]
- SIDEPAKTM AM520/AM520i Personal Aerosol Monitor Theory of Operation. Application Note EXPMN-010 Rev. B (10/18/2016). 2016. Available online: https://tsi.com/getmedia/8b08e494-6ed8-4fab-9c99-9e7ac2688543/EXPMN-010_AM520_Theory_of_Operation-A4-web?ext=.pdf (accessed on 6 March 2020).
- Differences in Mass Measurement Readings When Comparing Photometric Based Instruments. Application Note EXPMN-019 Rev.B (10/7/2019). 2019. Available online: https://www.tsi.com/getmedia/fc0e33ae-9ea0-444e-9f37-aaba26acda43/EXPMN-019_Photometer_Comparisons_A4-web?ext=.pdf (accessed on 6 March 2020).
- Asbach, C.; Kaminski, H.; Lamboy, Y.; Schneiderwind, U.; Fierz, M.; Todea, A.M. Silicone Sampling Tubes Can Cause Drastic Artifacts in Measurements with Aerosol Instrumentation Based on Unipolar Diffusion Charging. Aerosol Sci. Technol. 2016, 50, 1375–1384. [Google Scholar] [CrossRef]
- Cheng, Y.S. Condensation Detection and Diffusion Size Separation Techniques. In Aerosol Measurements: Principles, Techniques and Applications; Baron, P.A., Willeke, K., Eds.; Wiley-Interscience: New York, NY, USA, 2001. [Google Scholar]
- Mølgaard, B.; Ondráček, J.; Švová, P.; Džumbová, L.; Barták, M.; Hussein, T.; Smolík, J. Migration of Aerosol Particles inside a Two-Zone Apartment with Natural Ventilation: A Multi-Zone Validation of the Multi-Compartment and Size-Resolved Indoor Aerosol Model. Indoor Built Environ. 2014, 23, 742–756. [Google Scholar] [CrossRef]
- Pandis, S. Atmospheric Aerosol Processes. In Particulate Matter Science for Policy Makers—A Narsto Assessment; Cambridge University Press: Cambridge, UK, 2004. [Google Scholar]
- Stacey, P.; Lee, T.; Thorpe, A.; Roberts, P.; Frost, G.; Harper, M. Collection Efficiencies of High Flow Rate Personal Respirable Samplers When Measuring Arizona Road Dust and Analysis of Quartz by X-ray Diffraction. Ann. Occup. Hyg. 2014, 58, 512–523. [Google Scholar]
- EN 14385:2004. Stationary Source Emissions—Determination of the Total Emissions of As, Cd, Cr, Co, Cu, Mn, Ni, Pb, Sb, Ti and V; Beuth Verlag: Berlin, Germany, 2004. [Google Scholar]
- R’mili, B.; Le Bihan, O.L.C.; Dutouquet, C.; Aguerre-Charriol, O.; Frejafon, E. Particle Sampling by TEM Grid Filtration. Aerosol Sci. Technol. 2013, 47, 767–775. [Google Scholar] [CrossRef]
- Asbach, C.; Kuhlbusch, T.A.J.; Kaminski, H.; Plitzko, S.; Götz, U.; Voetz, M.; Dahmann, D. SOP-Tiered Approach Tiered Approach for the Assessment of Exposure to Airborne Nanoobjects in Workplaces 2012. Available online: https://iai-danaserv.iai.kit.edu/files/methodik/SOPs_aus_Projekten/nanoGEM-SOP_tiered-approach-exposure-assessment-workplace_2012.pdf (accessed on 25 April 2020).
- Kaminski, H.; Beyer, M.; Fissan, H.; Asbach, C.; Kuhlbusch, T.A.J. Measurements of Nanoscale TiO2 and Al2O3 in Industrial Workplace Environments? Methodology and Results. Aerosol Air Qual. Res. 2015, 15, 129–141. [Google Scholar] [CrossRef]
- López-Lilao, A.; Escrig, A.; Orts, M.J.; Mallol, G.; Monfort, E. Quartz Dustiness: A Key Factor in Controlling Exposure to Crystalline Silica in the Workplace. J. Occup. Environ. Hyg. 2016, 13, 817–828. [Google Scholar] [CrossRef] [PubMed]
- López-Lilao, A.; Forner, V.S.; Gasch, G.M.; Gimeno, E.M. Particle Size Distribution: A Key Factor in Estimating Powder Dustiness. J. Occup. Environ. Hyg. 2017, 14, 975–985. [Google Scholar] [CrossRef]
- López-Lilao, A.; Bruzi, M.; Sanfélix, V.; Gozalbo, A.; Mallol, G.; Monfort, E. Evaluation of the Dustiness of Different Kaolin Samples. J. Occup. Environ. Hyg. 2015, 12, 547–554. [Google Scholar] [CrossRef] [PubMed]
- Pensis, I.; Mareels, J.; Dahmann, D.; Mark, D. Comparative Evaluation of the Dustiness of Industrial Minerals According to European Standard En 15051, 2006. Ann. Occup. Hyg. 2010, 54, 204–216. [Google Scholar]
- European Union. Commission Regulation (EU) 2018/1881 of 3 December 2018 Amending Regulation (EC) No 1907/2006 of the European Parliament and of the Council on the Registration, Evaluation, Authorisation and Restriction of Chemicals (REACH) as Regards Annexes I, III, VI, V. Off. J. Eur. Union 2018, 61, 1–21. [Google Scholar]
- Wohlleben, W.; Mielke, J.; Bianchin, A.; Ghanem, A.; Freiberger, H.; Rauscher, H.; Gemeinert, M.; Hodoroaba, V.D. Reliable Nanomaterial Classification of Powders Using the Volume-Specific Surface Area Method. J. Nanopart. Res. 2017, 19, 61. [Google Scholar] [CrossRef]
- Koivisto, A.J.; Kling, K.I.; Levin, M.; Fransman, W.; Gosens, I.; Cassee, F.R.; Jensen, K.A. First Order Risk Assessment for Nanoparticle Inhalation Exposure during Injection Molding of Polypropylene Composites and Production of Tungsten-Carbide-Cobalt Fine Powder Based upon Pulmonary Inflammation and Surface Area Dose. NanoImpact 2017, 6, 30–38. [Google Scholar] [CrossRef]
- WHO. Determination of Airborne Fibre Number Concentrations; World Health Organization: Geneva, Switzerland, 1997; pp. 1–53. [Google Scholar]
- SER. Provisional Nano Reference Values for Engineered Nanomaterials; Advisory Report 12/01; Sociaal Economische Raad: Den Haag, The Netherlands, 2012. [Google Scholar]
- Van Broekhuizen, P.; Van Veelen, W.; Streekstra, W.H.; Schulte, P.; Reijnders, L. Exposure Limits for Nanoparticles: Report of an International Workshop on Nano Reference Values. Ann. Occup. Hyg. 2012, 56, 515–524. [Google Scholar]
- CDC-NIOSH. Current Intelligence Bulletin 63: Occupational Exposure to Titanium Dioxide; National Institute for Occupational Safety and Health: Cincinnati, OH, USA, 2011; pp. 1–140.
- Ruusunen, J.; Tapanainen, M.; Sippula, O.; Jalava, P.I.; Lamberg, H.; Nuutinen, K.; Tissari, J.; Ihalainen, M.; Kuuspalo, K.; Mäki-Paakkanen, J.; et al. A Novel Particle Sampling System for Physico-Chemical and Toxicological Characterization of Emissions. Anal. Bioanal. Chem. 2011, 401, 3183–3195. [Google Scholar] [CrossRef] [PubMed]
- Schneider, T.; Jensen, K.A. Relevance of Aerosol Dynamics and Dustiness for Personal Exposure to Manufactured Nanoparticles. J. Nanopart. Res. 2009, 11, 1637–1650. [Google Scholar] [CrossRef]
- Shandilya, N.; Kuijpers, E.; Tuinman, I.; Fransman, W. Powder Intrinsic Properties as Dustiness Predictor for an Efficient Exposure Assessment? Ann. Work Expo. Health 2019, 63, 1029–1045. [Google Scholar] [CrossRef] [PubMed]
- Chakravarty, S.; Fischer, M.; García-Tríñanes, P.; Parker, D.; Bihan, O.L.; Morgeneyer, M. Study of the Particle Motion Induced by a Vortex Shaker. Powder Technol. 2017, 322, 54–64. [Google Scholar] [CrossRef]
- Chakravarty, S.; Le Bihan, O.; Fischer, M.; Morgeneyer, M. Dust Generation in Powders: Effect of Particle Size Distribution. EPJ Web Conf. 2017, 140, 13018. [Google Scholar] [CrossRef]
- Jensen, K.A.; Levin, M.; Witschger, O. Chapter 10 Methods for Testing Dustiness. In Characterization of Nanomaterials: An Introduction; Tantra, R., Ed.; John Wiley & Sons: New York, NY, USA, 2016; pp. 209–230. [Google Scholar]
- Le Bihan, O.L.C.; Ustache, A.; Bernard, D.; Aguerre-Chariol, O.; Morgeneyer, M. Experimental Study of the Aerosolization from a Carbon Nanotube Bulk by a Vortex Shaker. J. Nanomater. 2014, 2014, 193154. [Google Scholar] [CrossRef]
- Levin, M.; Rojas, E.; Vanhala, E.; Vippola, M.; Liguori, B.; Kling, K.; Koponen, I.; Molhave, K. Influence of Relative Humidity and Physical Load during Storage on Dustiness of Inorganic Nanomaterials: Implications for Testing and Risk Assessment. J. Nanopart. Res. 2015, 17, 337. [Google Scholar] [CrossRef]
- Morgeneyer, M.; Le Bihan, O.; Ustache, A.; Aguerre-Chariol, O. Experimental Study of the Aerosolization of Fine Alumina Particles from Bulk by a Vortex Shaker. Powder Technol. 2013, 246, 583–589. [Google Scholar] [CrossRef]
- Jensen, K.A.; Koponen, I.K.; Clausen, P.A.; Schneider, T. Dustiness Behaviour of Loose and Compacted Bentonite and Organoclay Powders: What Is the Difference in Exposure Risk? J. Nanopart. Res. 2009, 11, 133–146. [Google Scholar] [CrossRef]
- Beekmann, M.; Prévôt, A.S.H.; Drewnick, F.; Sciare, J.; Pandis, S.N.; Denier van der Gon, H.A.C.; Crippa, M.; Freutel, F.; Poulain, L.; Ghersi, V.; et al. In Situ, Satellite Measurement and Model Evidence on the Dominant Regional Contribution to Fine Particulate Matter Levels in the Paris Megacity. Atmos. Chem. Phys. 2015, 15, 9577–9591. [Google Scholar] [CrossRef]
- Reche, C.; Querol, X.; Alastuey, A.; Viana, M.; Pey, J.; Moreno, T.; Rodríguez, S.; González, Y.; Fernández-Camacho, R.; de la Rosa, J.; et al. New Considerations for PM, Black Carbon and Particle Number Concentration for Air Quality Monitoring across Different European Cities. Atmos. Chem. Phys. 2011, 11, 6207–6227. [Google Scholar] [CrossRef]
- Tielemans, E.; Noy, D.; Schinkel, J.; Heussen, H.; Van Der Schaaf, D.; West, J.; Fransman, W. Stoffenmanager Exposure Model: Development of a Quantitative Algorithm. Ann. Occup. Hyg. 2008, 52, 443–454. [Google Scholar] [PubMed]
- Tielemans, E.; Schneider, T.; Goede, H.; Tischer, M.; Warren, N.; Kromhout, H.; Van Tongeren, M.; Van Hemmen, J.; Cherrie, J.W. Conceptual Model for Assessment of Inhalation Exposure: Defining Modifying Factors. Ann. Occup. Hyg. 2008, 52, 577–586. [Google Scholar]
- Fonseca, A.S.; Kuijpers, E.; Kling, K.I.; Levin, M.; Koivisto, A.J.; Nielsen, S.H.; Fransman, W.; Yu, Y.F.; Antipov, A.; Jensen, K.A.; et al. Particle Release and Control of Worker Exposure during Laboratory-Scale Synthesis, Handling and Simulated Spills of Manufactured Nanomaterials in Fume-Hoods. J. Nanopart. Res. 2018, 20, 48. [Google Scholar] [CrossRef] [PubMed]
- Workplace Exposure—Measurement of Exposure by Inhalation to Chemical Agents—Strategy for Testing Compliance with Occupational Exposure Limit Values. Available online: https://infostore.saiglobal.com/en-us/standards/EN-689-2018-346556_SAIG_CEN_CEN_792425/ (accessed on 18 May 2020).
- NIOSH. General Safe Practices for Working with Engineered Nanomaterials in Research Laboratories; DHHS (NIOSH) Publication No. 2012-147; National Institute for Occupational Safety and Health: Cincinnati, OH, USA, 2012.


| Pouring Activity Description | Material Characteristics | OEL d | |||||||||
|---|---|---|---|---|---|---|---|---|---|---|---|
| Material Name | Location | Paint Batch | Measurement Day | d50 (µm) ¥ | Chemical Composition a | Shape a | Bulk Density ± σ (g cm−3) b | BET-SSA ± σ (m2 g−1) | VSSA (m2 cm−3) | DISRD ± σ (mg kg−1) c | (mg m−3) |
| TiO2 pigment (93% rutile), (Tioxid TR81; CAS-Nr. 13463-67-7) | MS | #1 | 30 January 2018 | 0.25 | Major: Ti, O Minor: Si, Al, Zr, P, and organic coating | Sphere | 0.94 ± 0.03 | 12.7 ± 1.3 | 53.2 | 3.0 * ± 1.3 | 6 e |
| #2 | 31 January 2018 | ||||||||||
| #3 | 1 February 2018 | ||||||||||
| Functionalized alumino-silicate clay (Al2Si2O5, OpTiMat® 2550; CAS No. 93763-70-3) | MS | #1 | 29 January 2018 | 25 | Major: Si, O Minor: Al, K, Na, and organic coating | Plate | 0.16 ± 0.001 | 5.2 ± 4.0 | 13.6 | 149.9 ± 10.8 | 2 |
| Thermoplastic microspheres (Expancel 461 WE 20 d36; CAS-No. 75-28-5) | MS | #1 | 29 January 2018 | 20–30 | Organic (2%) | Sphere | N/A | N/A | N/A | 155.6 ± 66.3 | 5 f |
| #3 | 1 February 2018 | ||||||||||
| Calcined clay (Al2Si2O5; PoleStar™ 200P; CAS No. 92704-41-1) | PS | #1 | 30 January 2018 | 2 | Major: Si, O, Al Minor: K, Fe | Plate | 0.52 ± 0.01 | 10.4 ± 0.05 | 27.0 | 13.3 ± 0.2 | 2 |
| Calcined kaolinite (Al2Si2O5(OH)4; Ultrex 96; CAS No. 92704-41-1) | PS | #2 | 31 January 2018 | 0.8 | Major: Si, O, Al Minor: Fe, Na, Ti | Plate | 0.35 ± 0.01 | 6.2 ± 0.01 | 16.0 | 7.1 ± 0.4 | 2 |
| Dolomite (CaMg(CO3)2; Microdol 1; CAS Nr. 16389-88-1) | PS | #1 | 30 January 2018 | 7.5 | Major: Ca, O, Mg Minor: Si, S | Sphere | 1.09 ± 0.04 | 3.2 ± 0.3 | 9.7 | 23.3 ± 1.2 | 5 f |
| #2 | 31 January 2018 | ||||||||||
| Talc (Mg3Si4O10(OH)2; Finntalc M15; CAS No. 14807-96-6) | PS | #1 | 30 January 2018 | 5 (Particles < 2 μm: 20%) | >96% Talc (Mg-Silicate with residue magnesite and chlorite); MgO; SiO2; Al2O3 and FeO) | Plate | 0.46 ± 0.01 | 5.6 ± 0.2 | 15.1 | 69.1 ± 4.9 | 5 f |
| #2 | 31 January 2018 | ||||||||||
| Calcite (CaCO3, Socal® P2, Fine Grades, calcium carbonate >= 98%; CAS No. 471-34-1) | PS | #3 | 1 February 2018 | N/A | Major: Ca, O. Minor: Si, S, Mg | Rod | 0.57 ± 0.01 | 6.7 ± 0.6 | 18.2 | 0.6 * ± 0.4 | 5 f |
| Variables | Amount Poured (kg) | Pouring Rate (kg min−1) | N (cm−3) | LDSA (µm2 cm−3) | Respirable Dust/PM10 (µg m−3) | |||||||||||||
|---|---|---|---|---|---|---|---|---|---|---|---|---|---|---|---|---|---|---|
| BZ | NF | FF | BZ | NF | FF | |||||||||||||
| Mean | ±σ | Mean | ±σ | Mean | ±σ | Mean | ±σ | Mean | ±σ | Mean | ±σ | BZ | NF | FF | ||||
| Non-working hours (14 h of measurements) | - | - | N/A | 4.8 × 10³ | 3.0 × 10³ | 6.7 × 10³ | 3.7 × 10³ | N/A | 35.7 | 21.8 | 34.1 | 22.8 | N/A | 76/N/A | 25/N/A | |||
| TiO2 pigment | Batch #1 (55 min) | 2150 kg (86 SBs × 25 kg) | 39.1 | 8.3 × 10³ | 2.6 × 10⁴ | 1.1 × 10⁴ | 2.1 × 10⁴ | 5.8 × 10³ | 3.4 × 10³ | 37.2 | 55.7 | 57.6 | 53.9 | 22.9 | 14.3 | N/A | 1450 ** | 76.4/N/A |
| Batch #2 (24 min) | 1475 kg (59 SBs × 25 kg) | 61.5 | 1.9 × 10⁴ | 1.9 × 10⁴ | 1.5 × 10⁴ | 1.2 × 10⁴ | 1.0 × 10⁴ | 2.3 × 10³ | 86.1 | 68.3 | 78.5 | 52.1 | 40.7 | 15.5 | N/A | 467.9/1150 ** | 60.3/N/A | |
| Batch #3 (42 min) | 2625 kg (105 SBs × 25 kg) | 62.5 | 9.6 × 10³ | 1.1 × 10⁴ | 9.2 × 10³ | 1.1 × 10⁴ | 6.7 × 10³ | 2.0 × 10³ | 53.8 | 39.1 | 65.3 | 45.3 | 27.6 | 11.5 | N/A/1624 * | 621.8/1060 ** | 47.3 (<DL) | |
| Functionalized alumino-silicate clay (Al2Si2O5, OpTiMat® 2550) | Batch #1 (14 min) | N/A | N/A | N/A | 5.3 × 10³ | 9.2 × 10³ | 6.4 × 10³ | 4.4 × 10⁴ | N/A | 28.0 | 36.3 | 12.2 | 37.3 | N/A | 57.6/482 ** | 34.1 (<DL) | ||
| Microspheres (Expancel) | Batch #1 (17 min) | N/A | N/A | N/A | 3.2 × 10⁴ | 4.6 × 10⁴ | 1.6 × 10³ | 6.0 × 10² | N/A | 57.7 | 77.0 | 4.2 | 1.5 | N/A | 457.7/1050 ** | N/A | ||
| Batch #3 (21 min) | N/A | N/A | 4.5 × 10³ | 3.1 × 10² | 4.1 × 10³ | 5.5 × 10³ | 2.4 × 10³ | 3.8 × 10² | 11.6 | 0.4 | 12.4 | 14.3 | 8.2 | 2.52 | N/A | N/A | 47.3 (<DL) | |
| Calcined clay (PoleStar™ 200P) | Batch #1 (75 min) | 925 kg (37 SBs × 25 kg) | 12.3 | 6.3 × 10⁴ | 4.5 × 10⁵ | 1.1 × 10⁴ | 1.9 × 10⁴ | 3.4 × 10³ | 9.6 × 10² | 61.7 | 221.4 | 19.3 | 0.2 | 6.3 | 0.01 | N/A/1120 * | N/A/630 * | N/A |
| Calcined kaolinite (Ultrex 96) | Batch #2 (94 min) | 500 kg (20 SBs × 25 kg) | 5.3 | 1.7 × 10⁴ | 2.4 × 10⁴ | 6.4 × 10³ | 7.3 × 10³ | 4.0 × 10³ | 5.6 × 10² | 44.2 | 49.7 | 22.0 | 0.2 | 14.4 | 0.01 | N/A/2140 * | N/A/650 * | N/A |
| Dolomite (Microdol 1) | Batch #1 (122 min) | 1500 kg (3 BBs × 500 kg) | 12.3 | 3.6 × 10⁴ | 1.3 × 10⁵ | 2.8 × 10⁴ | 8.2 × 10⁴ | 4.8 × 10³ | 2.3 × 10³ | 63.5 | 187.2 | 33.5 | 0.7 | 9.1 | 0.03 | N/A/1040 * | N/A/610 * | N/A |
| Batch #2 (117 min) | 1500 kg (3 BBs × 500 kg) | 12.8 | 2.3 × 10⁴ | 6.4 × 10⁴ | 5.0 × 10⁴ | 2.1 × 10⁵ | 3.9 × 10³ | 1.3 × 10³ | 44.2 | 90.5 | 56.5 | 1.7 | 11.2 | 0.03 | N/A/1750 * | N/A/1260 * | N/A | |
| Talc (Finntalc M15) | Batch #1 (64 min) | 1200 (2.4 BBs × 500) | 18.5 | 2.7 × 10⁵ | 6.2 × 10⁵ | 4.0 × 10⁵ | 1.1 × 10⁶ | 8.1 × 10³ | 6.0 × 10³ | 449.4 | 981.5 | 327.6 | 7.9 | 13.1 | 0.08 | N/A/5630 * | N/A/4880 * | N/A |
| Batch #2 (87 min) | 1600 (3.2 BBs × 500) | 18.4 | 1.9 × 10⁵ | 5.0 × 10⁵ | 1.9 × 10⁵ | 6.3 × 10⁵ | 5.9 × 10³ | 3.3 × 10³ | 313.9 | 810.4 | 185.6 | 4.5 | 16.1 | 0.06 | N/A/6510 * | N/A/2930 * | N/A | |
| Calcite (Socal® P2) | Batch #3 (43 min) | 333 (13.3 SBs × 25 kg) | 7.7 | 8.4 × 10³ | 5.8 × 10³ | 6.9 × 10³ | 4.9 × 10³ | 4.3 × 10³ | 6.4 × 10² | 21.4 | 10.4 | 17.0 | 0.1 | 11.1 | 0.02 | N/A/300 * | N/A/299 * | N/A |
| Day | N8h-TWA | NRV8h-TWA (cm−3) | N8h-TWA/ | PM10 8h-TWA | PEL8h-TWA (mg m−3) | PM10 8h-TWA/ |
|---|---|---|---|---|---|---|
| (cm−3) | [78] | NRV8h-TWA | (mg m−3) | [42] | PEL8h-TWA | |
| Day 1 | 3.7 × 10³ | 0.1 | 1.4 | 0.1 | ||
| Day 2 | 6.0 × 10³ | 4.0 × 10⁴ | 0.2 | 2.1 | 10 | 0.2 |
| Day 3 | 5.1 × 10³ | 0.1 | 0.3 | 0.03 |
| Variables | ELPI | DGI Sampler | TSP Reference Method [66] | |||||
|---|---|---|---|---|---|---|---|---|
| N total × 103 (cm−3) | PM2.5 + >2.5 µm (mg m−3) | PM2.5 (mg m−3) | PM1 (mg m−3) | PM0.5 (mg m−3) | PM0.2 (mg m−3) | (mg m−3) | ||
| Mixing station | Concentration batch #2 (7:33–12:43; TiO2 pouring) | 2.69 | 0.38 | 0.34 | 0.28 | 0.18 | 0.16 | 0.55 |
| Flow (g h−1/g ton−1) | - | 4.0/14 | 3.7/13 | 3.0/10.5 | 2.0/7.0 | 1.7/6.0 | 5.8/20.3 | |
| Pouring station | Concentration batch #1 (7:30–12:32) | 4.78 | * | * | * | * | * | 9.67 |
| Concentration batch #2 (13:00–14:40) | 5.15 | 2.85 | 1.87 | 0.89 | 0.47 | 0.26 | - | |
| Concentration batch #3 (12:13–14:57) | 9.13 | 3.49 | 2.29 | 1.07 | 0.44 | 0.30 | 4.19 | |
| Average | 6.35 | 3.17 | 2.08 | 0.98 | 0.46 | 0.28 | 6.93 | |
| Flow batch #1 (g h−1/g ton−1) | - | - | - | - | - | - | 12.0/16.7 | |
| Flow batch #2 (g h−1/g ton−1) | - | 3.6/4.0 | 2.3/2.6 | 1.1/1.2 | 0.6/0.7 | 0.3/0.3 | 5.2/5.8 | |
| Flow batch #3 (g h−1/g ton−1) | - | 4.4/23 | 2.9/15.2 | 1.3/6.8 | 0.6/3.1 | 0.4/2.1 | - | |
| Average (g h−1/g ton−1) | - | 4.0/13.5 | 2.6/8.9 | 1.2/4.0 | 0.6/1.9 | 0.4/1.2 | 8.6/11.3 | |
Publisher’s Note: MDPI stays neutral with regard to jurisdictional claims in published maps and institutional affiliations. |
© 2021 by the authors. Licensee MDPI, Basel, Switzerland. This article is an open access article distributed under the terms and conditions of the Creative Commons Attribution (CC BY) license (http://creativecommons.org/licenses/by/4.0/).
Share and Cite
Fonseca, A.S.; Viitanen, A.-K.; Kanerva, T.; Säämänen, A.; Aguerre-Chariol, O.; Fable, S.; Dermigny, A.; Karoski, N.; Fraboulet, I.; Koponen, I.K.; et al. Occupational Exposure and Environmental Release: The Case Study of Pouring TiO2 and Filler Materials for Paint Production. Int. J. Environ. Res. Public Health 2021, 18, 418. https://doi.org/10.3390/ijerph18020418
Fonseca AS, Viitanen A-K, Kanerva T, Säämänen A, Aguerre-Chariol O, Fable S, Dermigny A, Karoski N, Fraboulet I, Koponen IK, et al. Occupational Exposure and Environmental Release: The Case Study of Pouring TiO2 and Filler Materials for Paint Production. International Journal of Environmental Research and Public Health. 2021; 18(2):418. https://doi.org/10.3390/ijerph18020418
Chicago/Turabian StyleFonseca, Ana Sofia, Anna-Kaisa Viitanen, Tomi Kanerva, Arto Säämänen, Olivier Aguerre-Chariol, Sebastien Fable, Adrien Dermigny, Nicolas Karoski, Isaline Fraboulet, Ismo Kalevi Koponen, and et al. 2021. "Occupational Exposure and Environmental Release: The Case Study of Pouring TiO2 and Filler Materials for Paint Production" International Journal of Environmental Research and Public Health 18, no. 2: 418. https://doi.org/10.3390/ijerph18020418
APA StyleFonseca, A. S., Viitanen, A.-K., Kanerva, T., Säämänen, A., Aguerre-Chariol, O., Fable, S., Dermigny, A., Karoski, N., Fraboulet, I., Koponen, I. K., Delpivo, C., Vilchez Villalba, A., Vázquez-Campos, S., Østerskov Jensen, A. C., Hjortkjær Nielsen, S., Sahlgren, N., Clausen, P. A., Xuan Nguyen Larsen, B., Kofoed-Sørensen, V., ... Koivisto, J. (2021). Occupational Exposure and Environmental Release: The Case Study of Pouring TiO2 and Filler Materials for Paint Production. International Journal of Environmental Research and Public Health, 18(2), 418. https://doi.org/10.3390/ijerph18020418