Article

Exploring the Relationship between Mumps and Meteorological Factors in Shandong Province, China Based on a Two-Stage Model

1
Department of Biostatistics, School of Public Health, Cheeloo College of Medicine, Shandong University, Jinan 250012, China
2
Heze Center for Disease Control and Prevention, Heze 274003, China
3
MRC Clinical Trials Unit at UCL, Institute of Clinical Trials and Methodology, 90 High Holborn, London WC1V 6LJ, UK
4
Shandong Center for Disease Control and Prevention, Jinan 250012, China
5
School of Public Health, Faculty of Medicine and Health, University of Sydney, Camperdown, NSW 2006, Australia
*
Author to whom correspondence should be addressed.
Contributed equally.
Int. J. Environ. Res. Public Health 2021, 18(19), 10359; https://doi.org/10.3390/ijerph181910359
Submission received: 8 September 2021 / Revised: 27 September 2021 / Accepted: 28 September 2021 / Published: 1 October 2021

Abstract

:
Background: Small-scale studies have identified temperature and other meteorological factors as risk factors for human health. However, only a few have quantified the specific impact of meteorological factors on mumps. A quantitative examination of the exposure–response relationship between meteorological factors and mumps is needed to provide new insights for multi-city analysis. Methods: The daily recorded number of mumps cases and meteorological data in 17 cities of Shandong Province from 2009 to 2017 were collected. A two-stage model was built to explore the relationship between meteorological factors and mumps. Results: A total of 104,685 cases of mumps were recorded from 2009 to 2017. After controlling for seasonality and long-term trends, the effect of low temperature on mumps was significant at the provincial level, with a cumulative RR of 1.035 (95%CI: 1.002–1.069) with a 1-day lagged effect. The proportion of primary and middle school students was determined as an effect modifier, which had a significant impact on mumps (Stat = 8.374, p = 0.039). There was heterogeneity in the combined effect of temperature on mumps (Q = 95.447, p = 0.000), and its size was I2 = 49.7%. Conclusions: We have identified a non-linear relationship between mumps and temperature in Shandong Province. In particular, low temperatures could bring more cases of mumps, with certain lagged effects. More public health measures should be taken to reduce the risks when temperatures are low, especially for cities with a high proportion of primary and secondary school students.

1. Introduction

Mumps is an acute respiratory infectious disease caused by the mumps virus [1]. In most cases, the onset is mild and the prognosis is good, but it can also cause serious complications [2]. Mumps can be prevented by vaccines [3]. The incidence of mumps in China dropped significantly after implementing the Mumps Vaccine (MuCV) [3,4]. However, there still have been outbreaks or increased incidence of mumps [5,6,7,8,9,10]. For example, in Shandong Province, China, the incidence of mumps increased significantly in 2012 and 2013, reaching 25.33/100,000 and 24.45/100,000 respectively [11]. After 2014, the number of mumps cases declined, but the incidence is still much higher than that of other respiratory infectious diseases (such as measles) [12]. Therefore, mumps is still an urgent public health problem in Shandong Province.
Although MuCV is effective, the incidence of mumps still has obvious seasonality [1], suggesting that climate or weather changes may have an impact on the occurrence of mumps. Many studies have also shown that meteorological factors are related to the occurrence of mumps, but the effects of meteorological factors varied in different studies [1,13,14,15,16,17]. For example, Wu et al. found that both extreme high-temperature and low-temperature weather will affect the risk of mumps, but Lin et al. found that the upper and lower thresholds of average temperature are 1.2 and 24.5 °C. Only when within this range, the number of mumps cases increased with temperatures within this range [15,16]. Some studies ignored the lag time of environmental variables on the health effects, or simply including the lag time manually led to biased conclusions [16], and some studies were not able to explore the non-linear relationship between environmental variables and mumps [18]. Furthermore, different analysis methods and different study areas may have a certain impact on the results [19,20,21,22].
In recent years, the two-stage model has been widely used to explore the impact of variables on the occurrence of diseases on a larger scale [23,24,25,26], especially in the field of environmental health [19,22,27,28,29]. When the study area is large (such as a province in China), whether the exposure–response relationship between meteorological factors and mumps shows different results in different cities has not yet been clarified. Although simply averaging the data of all cities can represent the level of the entire province [13], due to the large span of different cities, the mean value may not reflect the difference in impact factors, so that it may not be possible to draw real conclusions.
This study collected meteorological data and recorded cases of mumps in Shandong Province and built a two-stage model to examine the exposure–response relationship between meteorological factors and mumps in each city. By taking geographical, demographic, and socio-economic factors as potential influencing factors, our model can be used further explore the potential source of heterogeneity of city-specific effects. Our study can provide constructive suggestions for preventing and controlling mumps in Shandong Province.

2. Materials and Methods
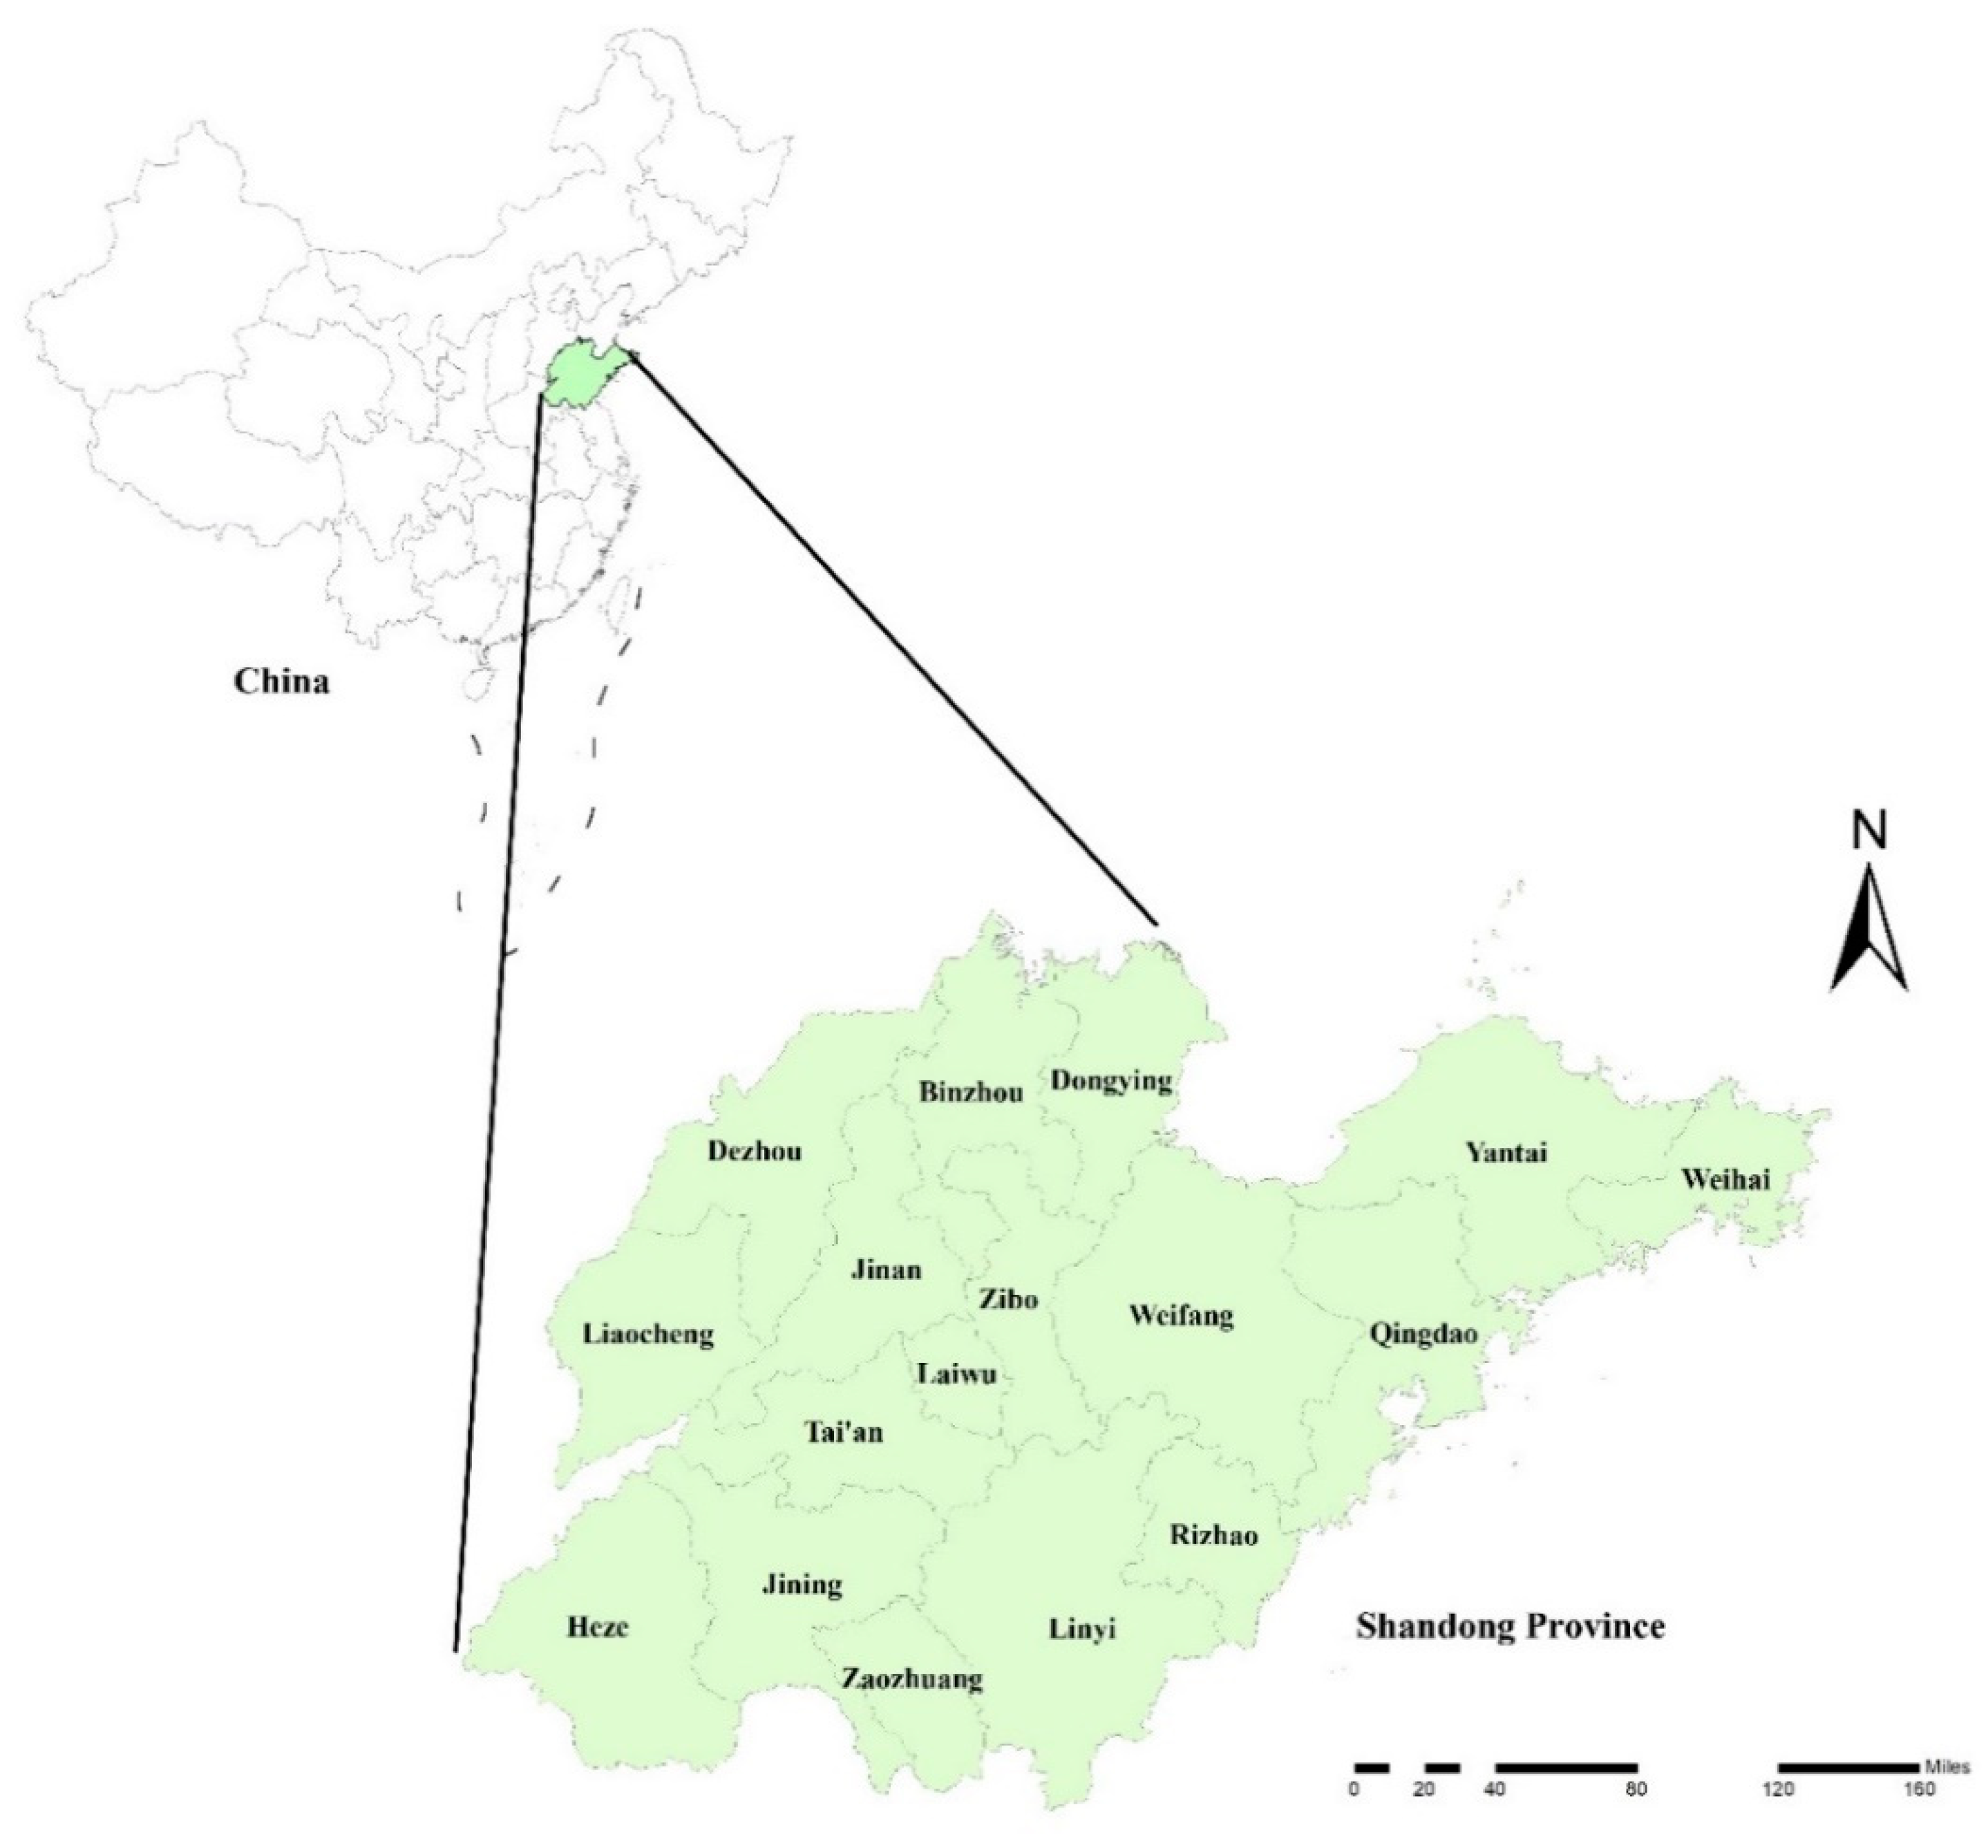
2.1. Study Location

The study was conducted in Shandong Province, which is located on the east coast of China, between latitudes 34°25′ and 38°23′ N and longitudes 114°36′ and 122°43′ E (Figure 1). As of 2017, Laiwu City is not included in Jinan City. This study still divided Shandong Province into 17 cities.

2.2. Data Collection

The daily recorded data of mumps cases in 17 cities from 1 January 2009 to 31 December 2017 were collected from the Information System of the Shandong Center for Disease Control and Prevention. The daily meteorological data of 17 cities in Shandong Province were obtained from the China Meteorological Science Data Sharing Service System (http://data.cma.cn/, accessed on 27 September 2021), including the daily maximum temperature (°C) and daily average temperature (°C), daily minimum temperature (°C), daily average relative humidity (%), daily average precipitation (mm), sunshine hours (h), daily average wind speed (m/s), and daily average atmospheric pressure (hPa). The population density (person/km2), urbanization rate (%), GDP per capita (yuan), and the proportion of primary and middle school students (person/10,000) of each city were all derived from the Statistical Yearbook of Shandong Provincial Bureau of Statistics (http://tjj.shandong.gov.cn/tjnj, accessed on 27 September 2021).
The diagnosis of mumps is mainly based on the “Diagnostic Criteria for Mumps”, issued by the Ministry of Health of the People’s Republic of China in 2007 (http://www.nhc.gov.cn/wjw/s9491/200704/38797.shtml, accessed on 27 September2021). The epidemiological history and acute swelling of the parotid glands and (or) other salivary glands, except for parotid swelling caused by other causes, were used to make a diagnosis. Confirmed cases require laboratory-specific tests. The diagnostic criteria were consistent during the study period.

2.3. Two-Stage Model

In this study, the Distributed Lag Non-linear Model (DLNM) was used in the first stage to examine the non-linear relationship and the lag effects between meteorological factors and mumps by using cross-basis functions [24,27]. Meta-regression was used in the second stage to detect real exposure–response relationship at a provincial level to avoid simply averaging the data of each city.
In the first stage, quasi-Poisson was used as the connection function, and confounding factors, including long-term trend, seasonality, and day of the week, were adjusted at the same time. Spearman correlation analysis was used to test various meteorological factors to avoid multicollinearity (we excluded variables with higher correlations (r > 0.8) to avoid collinearity). The final model was established as follows:
g [ E ( Y t ) ] = α + β T e m p t , l + N S ( H u m t , l , 3 ) + N S ( W i n d t , l , 3 ) + N S ( S u n t , l , 3 ) + N S ( R a i n t , l , 3 ) + N S ( P r e s t , l , 3 ) + a s . f a c t o r ( m o n t h ) + a s . f a c t o r ( d o w )
where Y t represented the number of mumps cases on the t-th day, T e m p t , l was the matrix obtained by applying the basis function to the daily average temperature, and β was the coefficient. N S ( · ) was the natural cubic spline function, and H u m t , l , W i n d t , l , S u n t , l , R a i n t , l and P r e s t , l represented the daily average relative humidity, daily average relative wind speed, daily average sunshine hours, daily average precipitation, daily average precipitation, and daily average relative atmospheric pressure, respectively.
Based on the principle of minimizing the sum of Q-AIC for every city, the degrees of freedom of each variable were 3, 3, 3, 3 and 3. m o n t h was a date variable and was included to control seasonality and long-term trends. d o w was the day of the week and was used to control the day of the week. The maximum number of lag days in the model was determined by the incubation period of mumps and the principle of the minimum sum of Q-AICs in 17 cities.
In order to further explore the exposure–response relationships of multiple cities and to determine the potential sources of heterogeneity among cities, we adopted the meta-regression method in the second stage [30,31]. The heterogeneity test of meta-regression results employed Cochran’s Q test [30,32], and we used I2 to quantify the heterogeneity of the results. When p < 0.05 or I2 > 50%, it was considered that there was heterogeneity in each study. The independent variables were the attributes of each city included in the multivariate meta-regression, including population density, latitude, longitude, urbanization rate, GDP per capita, and proportion of students. The Wald test was used to test the influence of modifiers on the provincial effect in the meta-analysis to try to find the source of heterogeneity.

2.4. Model Evaluation and Sensitivity Analysis

The model residual graph was used to evaluate the fit of DLNM. We changed the degree of freedom of meteorological factors (df = 2–7), the maximum lag time of daily average temperature (14, 21, 30) and the degree of freedom (df = 6–9) of time variables, which were used to control long-term and seasonal trends for sensitivity analysis and to test the robustness of the model established by the parameters.

3. Results

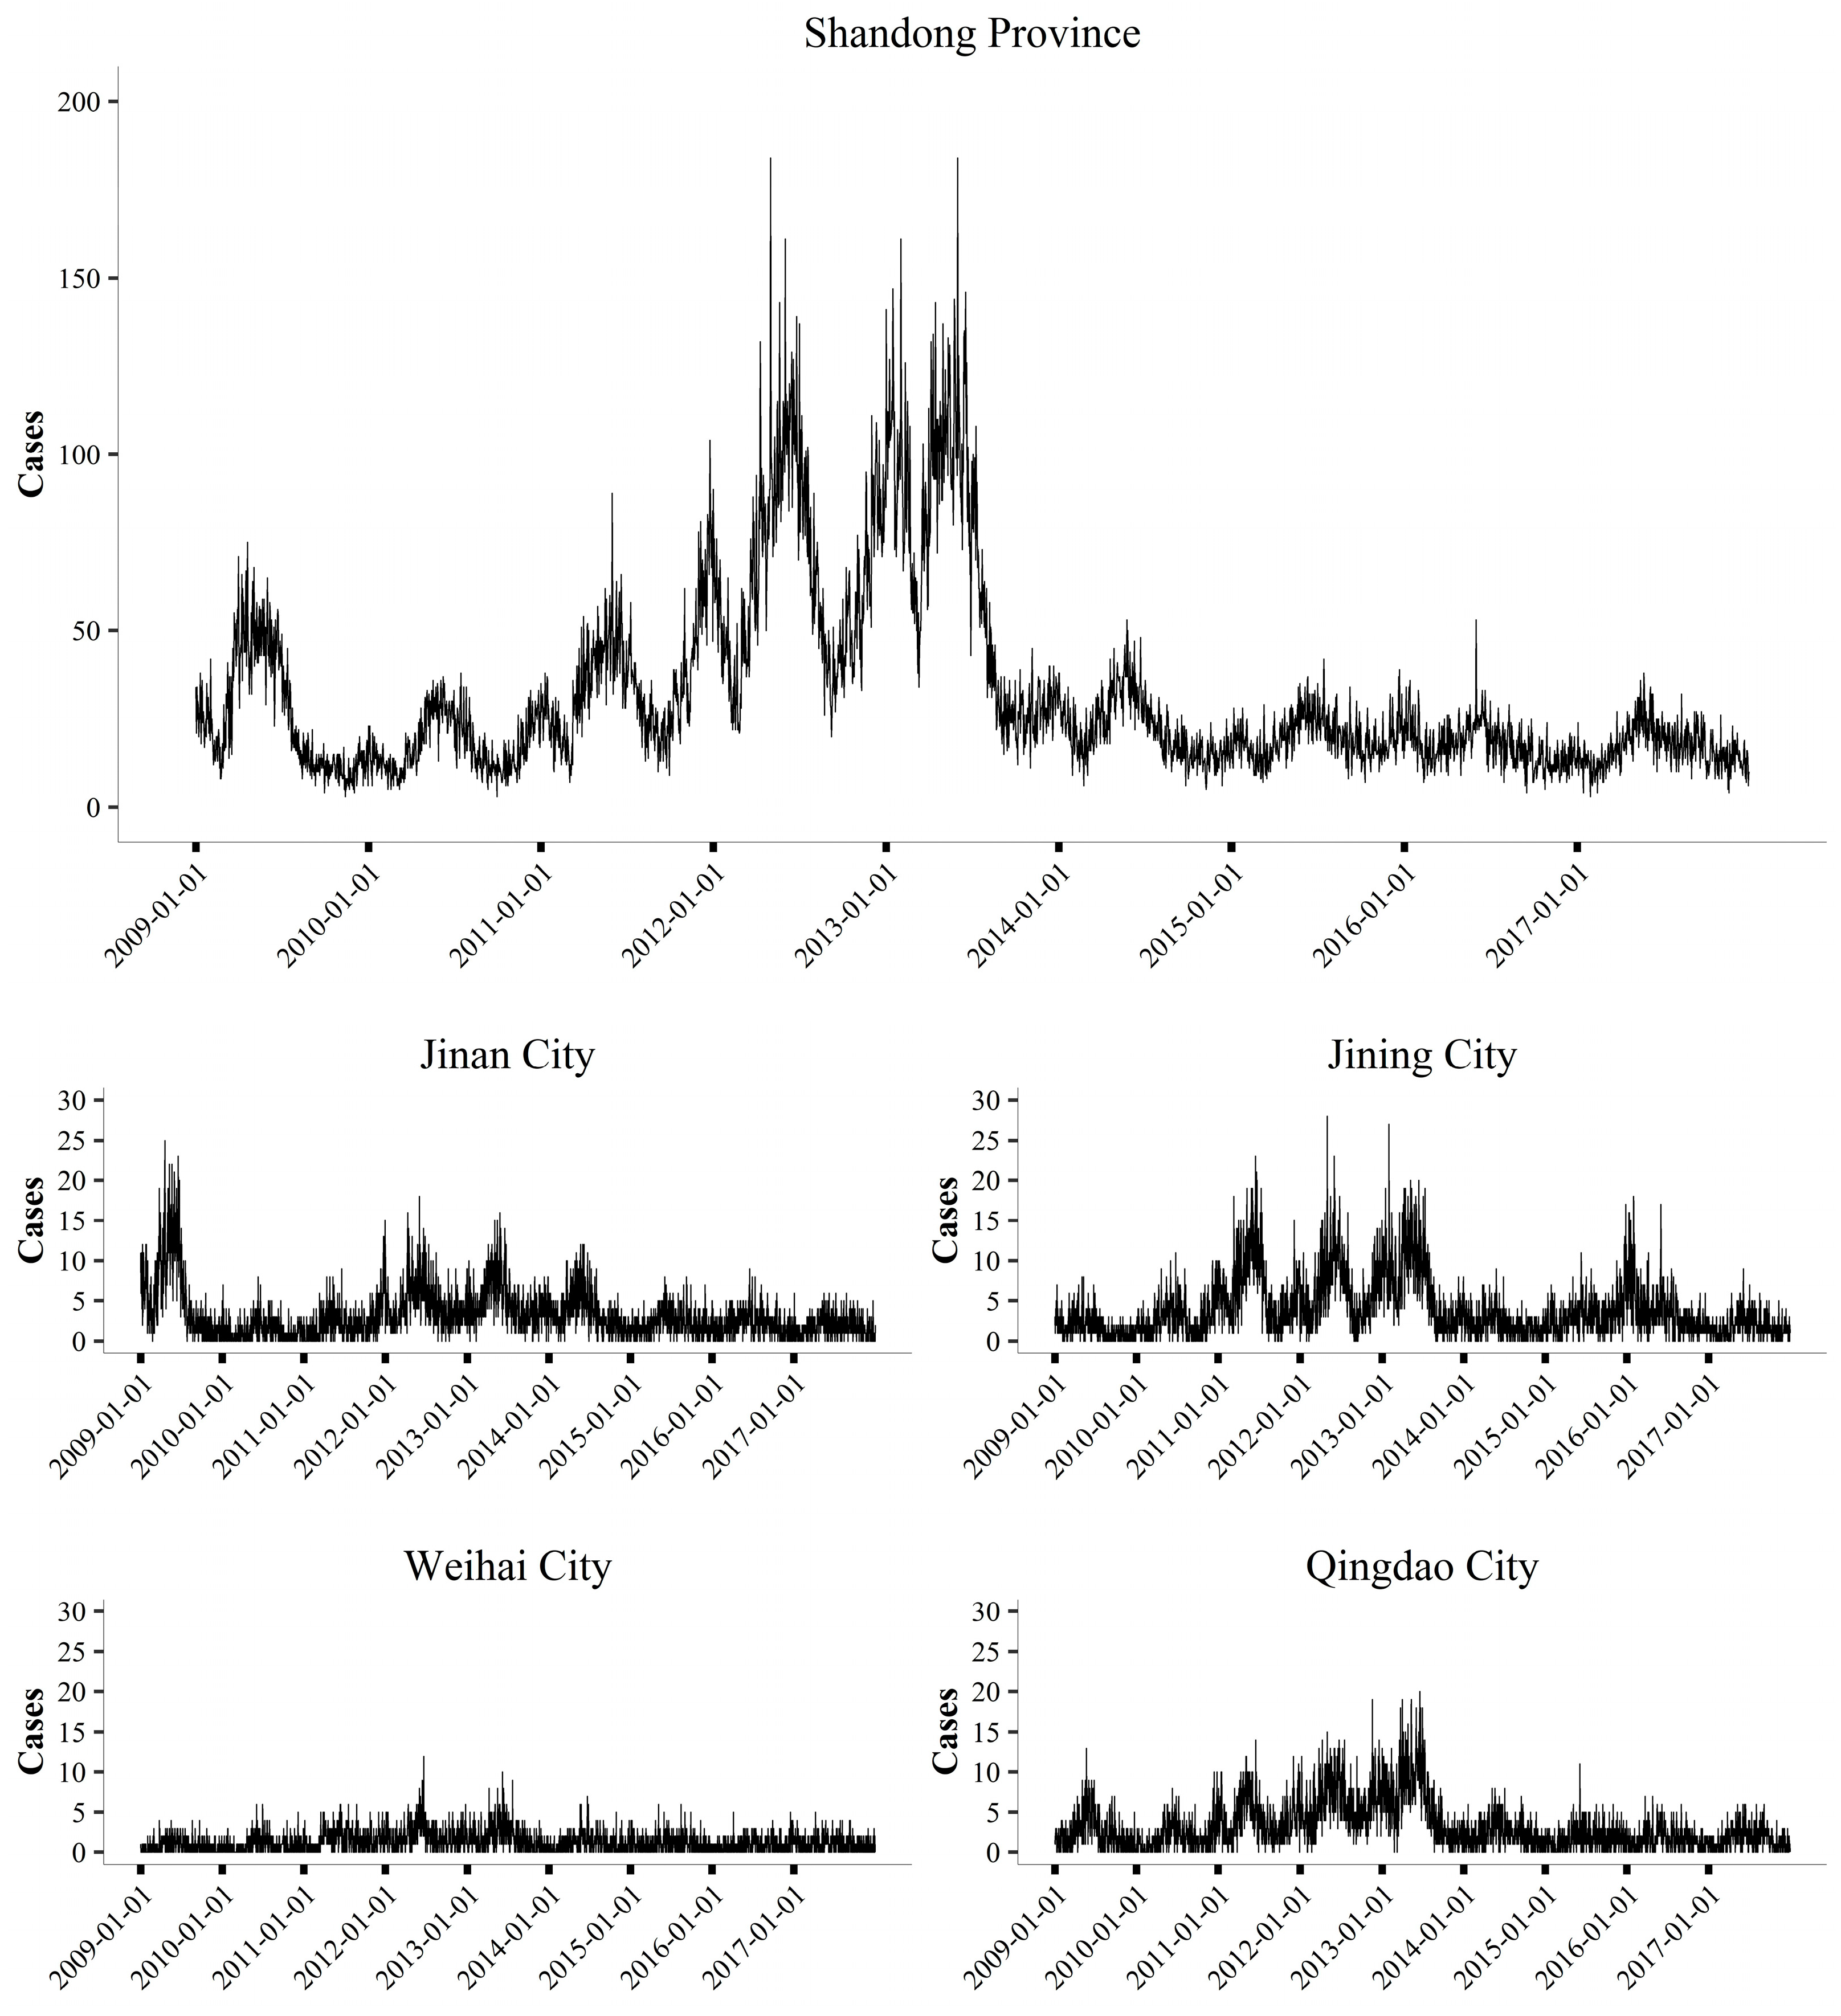
3.1. Description of the Meteorological Factors, Modifiers, and Mumps Data

From 2009 to 2017, a total of 104,685 cases of mumps were recorded in 17 cities in Shandong Province. The overall number of cases slightly dropped before the peak values were reached in 2012/13, and then declined again (Figure 2). The temporal distribution of the cases varied greatly in different cities, but all showed a clear seasonality, with two peak periods each year (the larger peak period was from April to July, and the smaller one was from December to January).
The daily average temperatures in Shandong Province and the cities in the study period are shown in Table 1. The daily average temperatures of Shandong Province ranged from −22.80 °C to 35.00 °C, with an average of 13.37 °C. The geographic, demographic, and socioeconomic information in Shandong Province and the cities is shown in Table S1. The proportion of primary and middle school students in Heze City, Linyi City, Liaocheng City, and Zaozhuang City was higher than that at the provincial level.

3.2. Correlation Analysis between Meteorological Factors and Other Modifiers

The Spearman rank correlation analysis between meteorological factors and other modifiers in Shandong Province and the number of mumps cases from 2009 to 2017 is shown in Table S2. The daily cases of mumps were correlated with all meteorological factors (p < 0.05). According to Table S2, daily maximum temperature and daily minimum temperature were excluded to avoid collinearity due to the higher correlation coefficient (r > 0.80). In particular, the urbanization rate and per capita GDP were separately included in the meta-regression. Therefore, despite their high correlation (r > 0.8), they were not excluded.

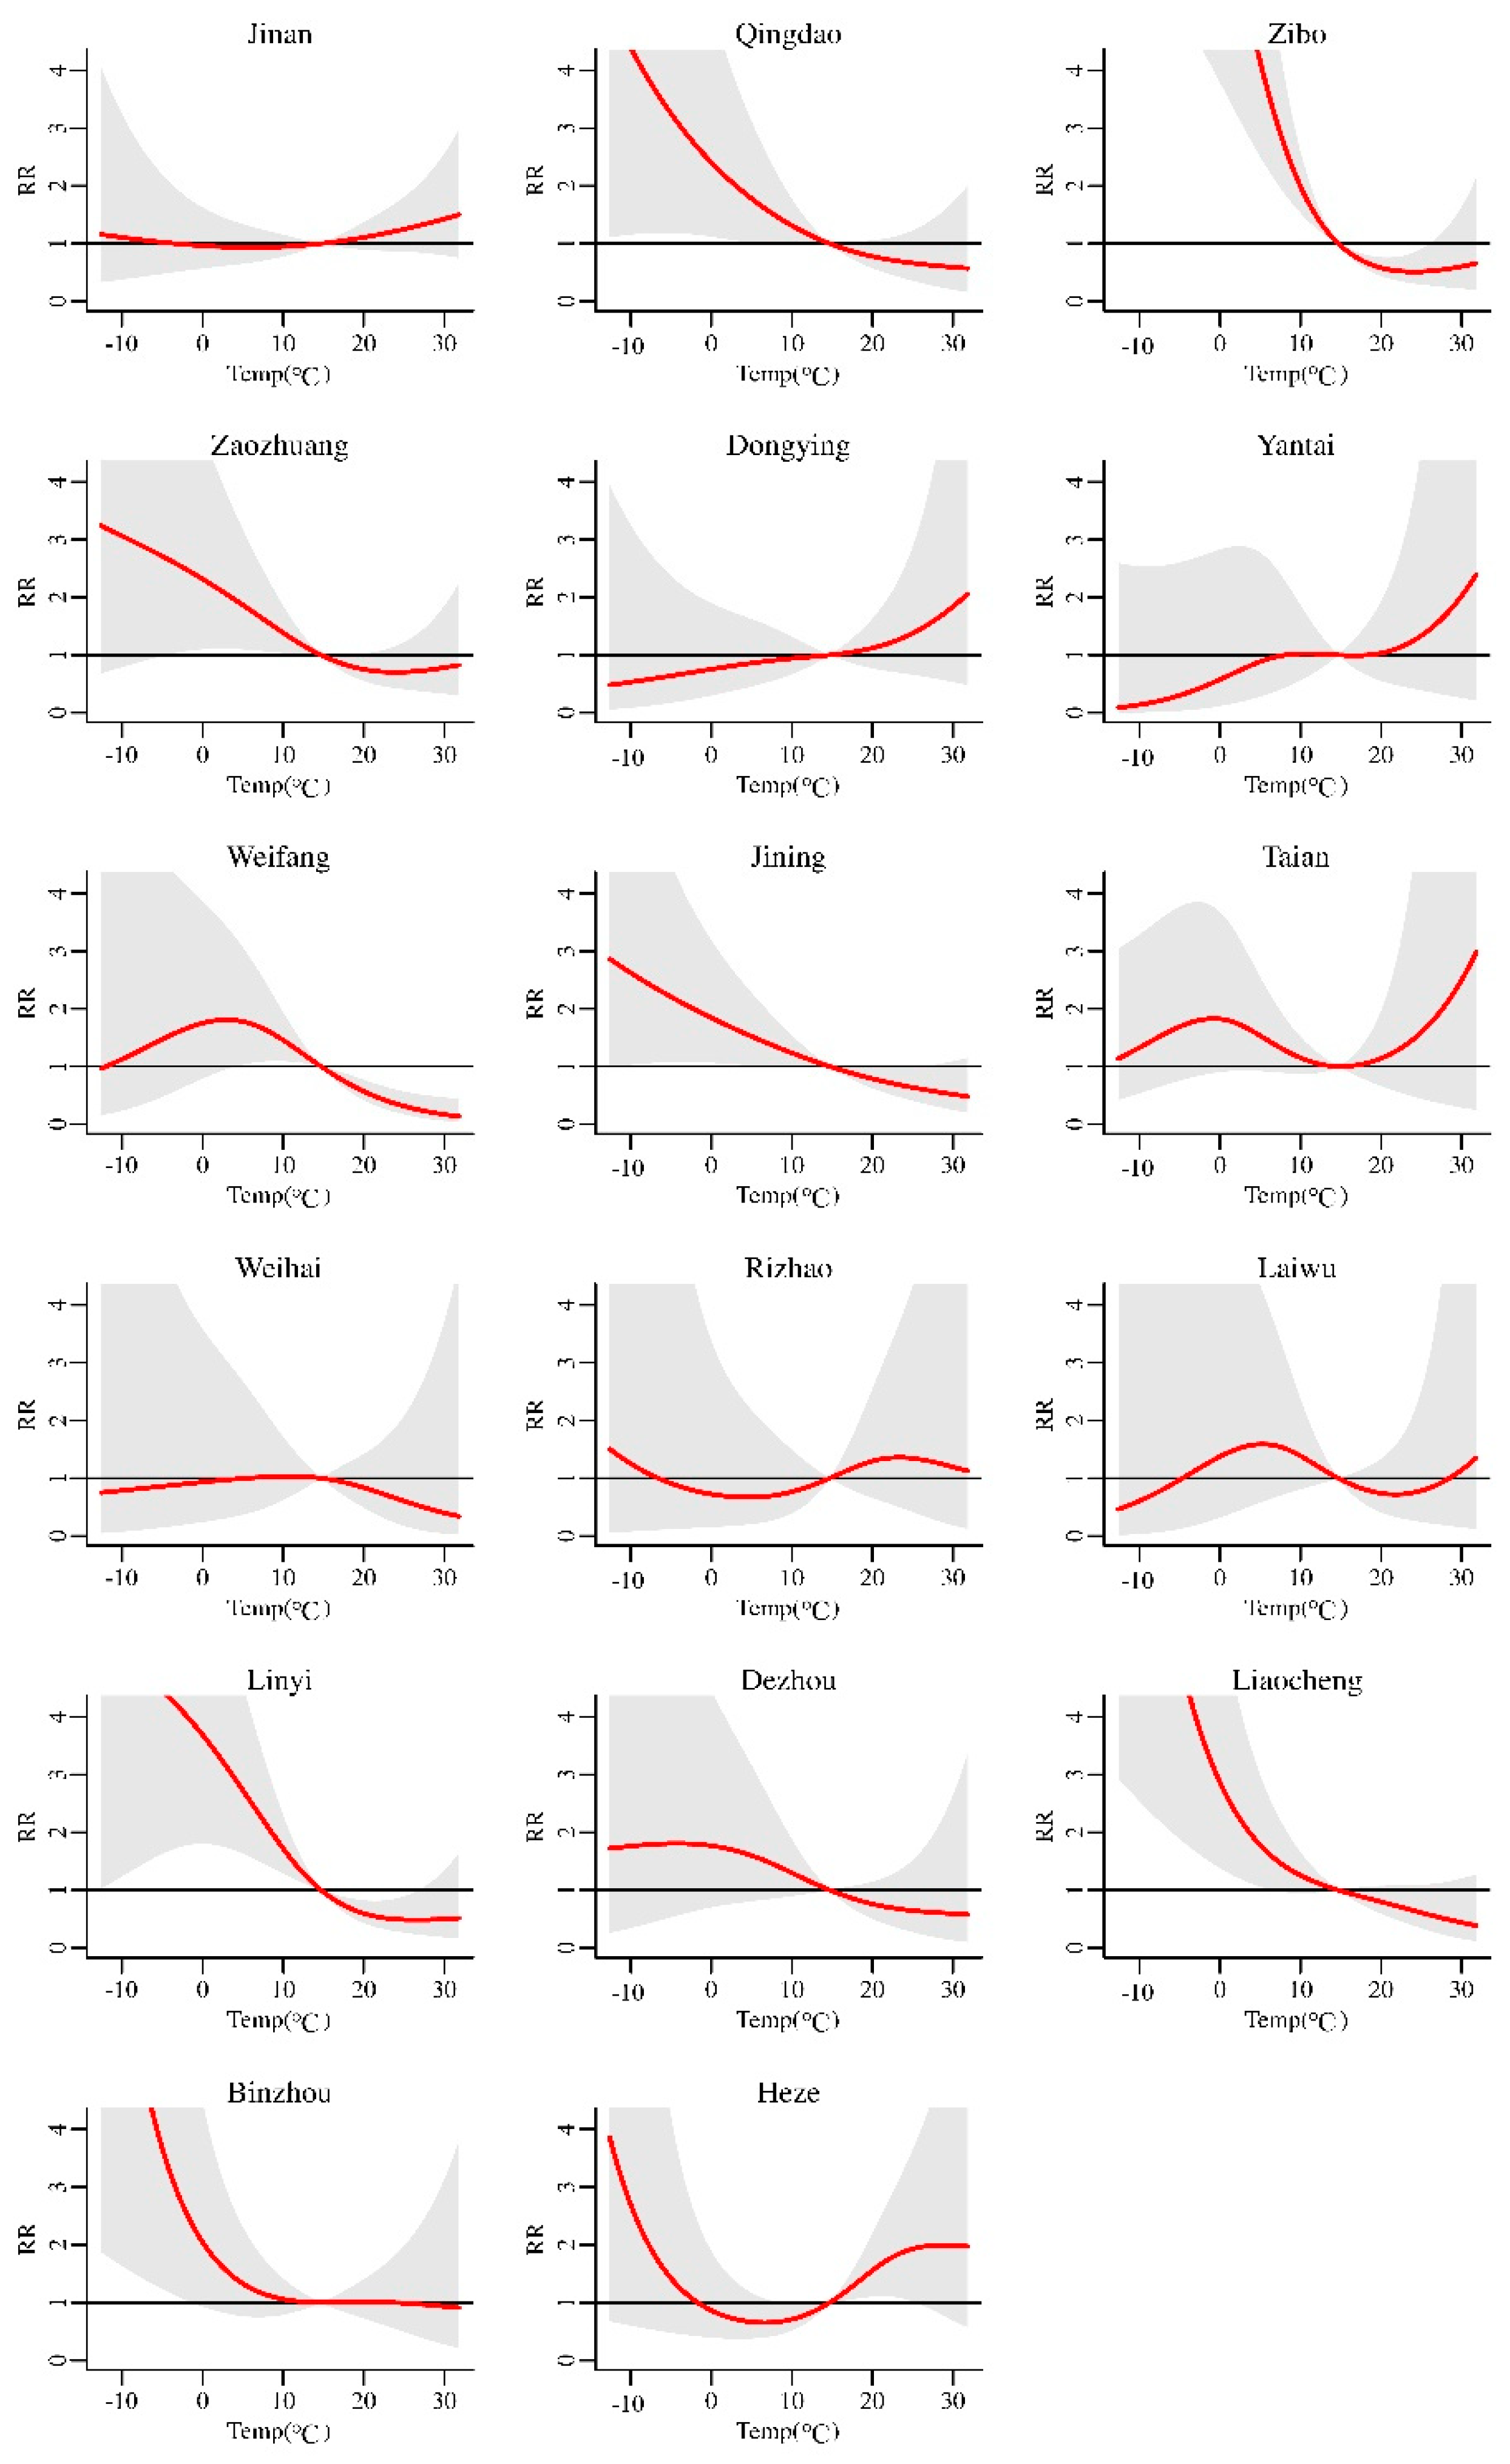
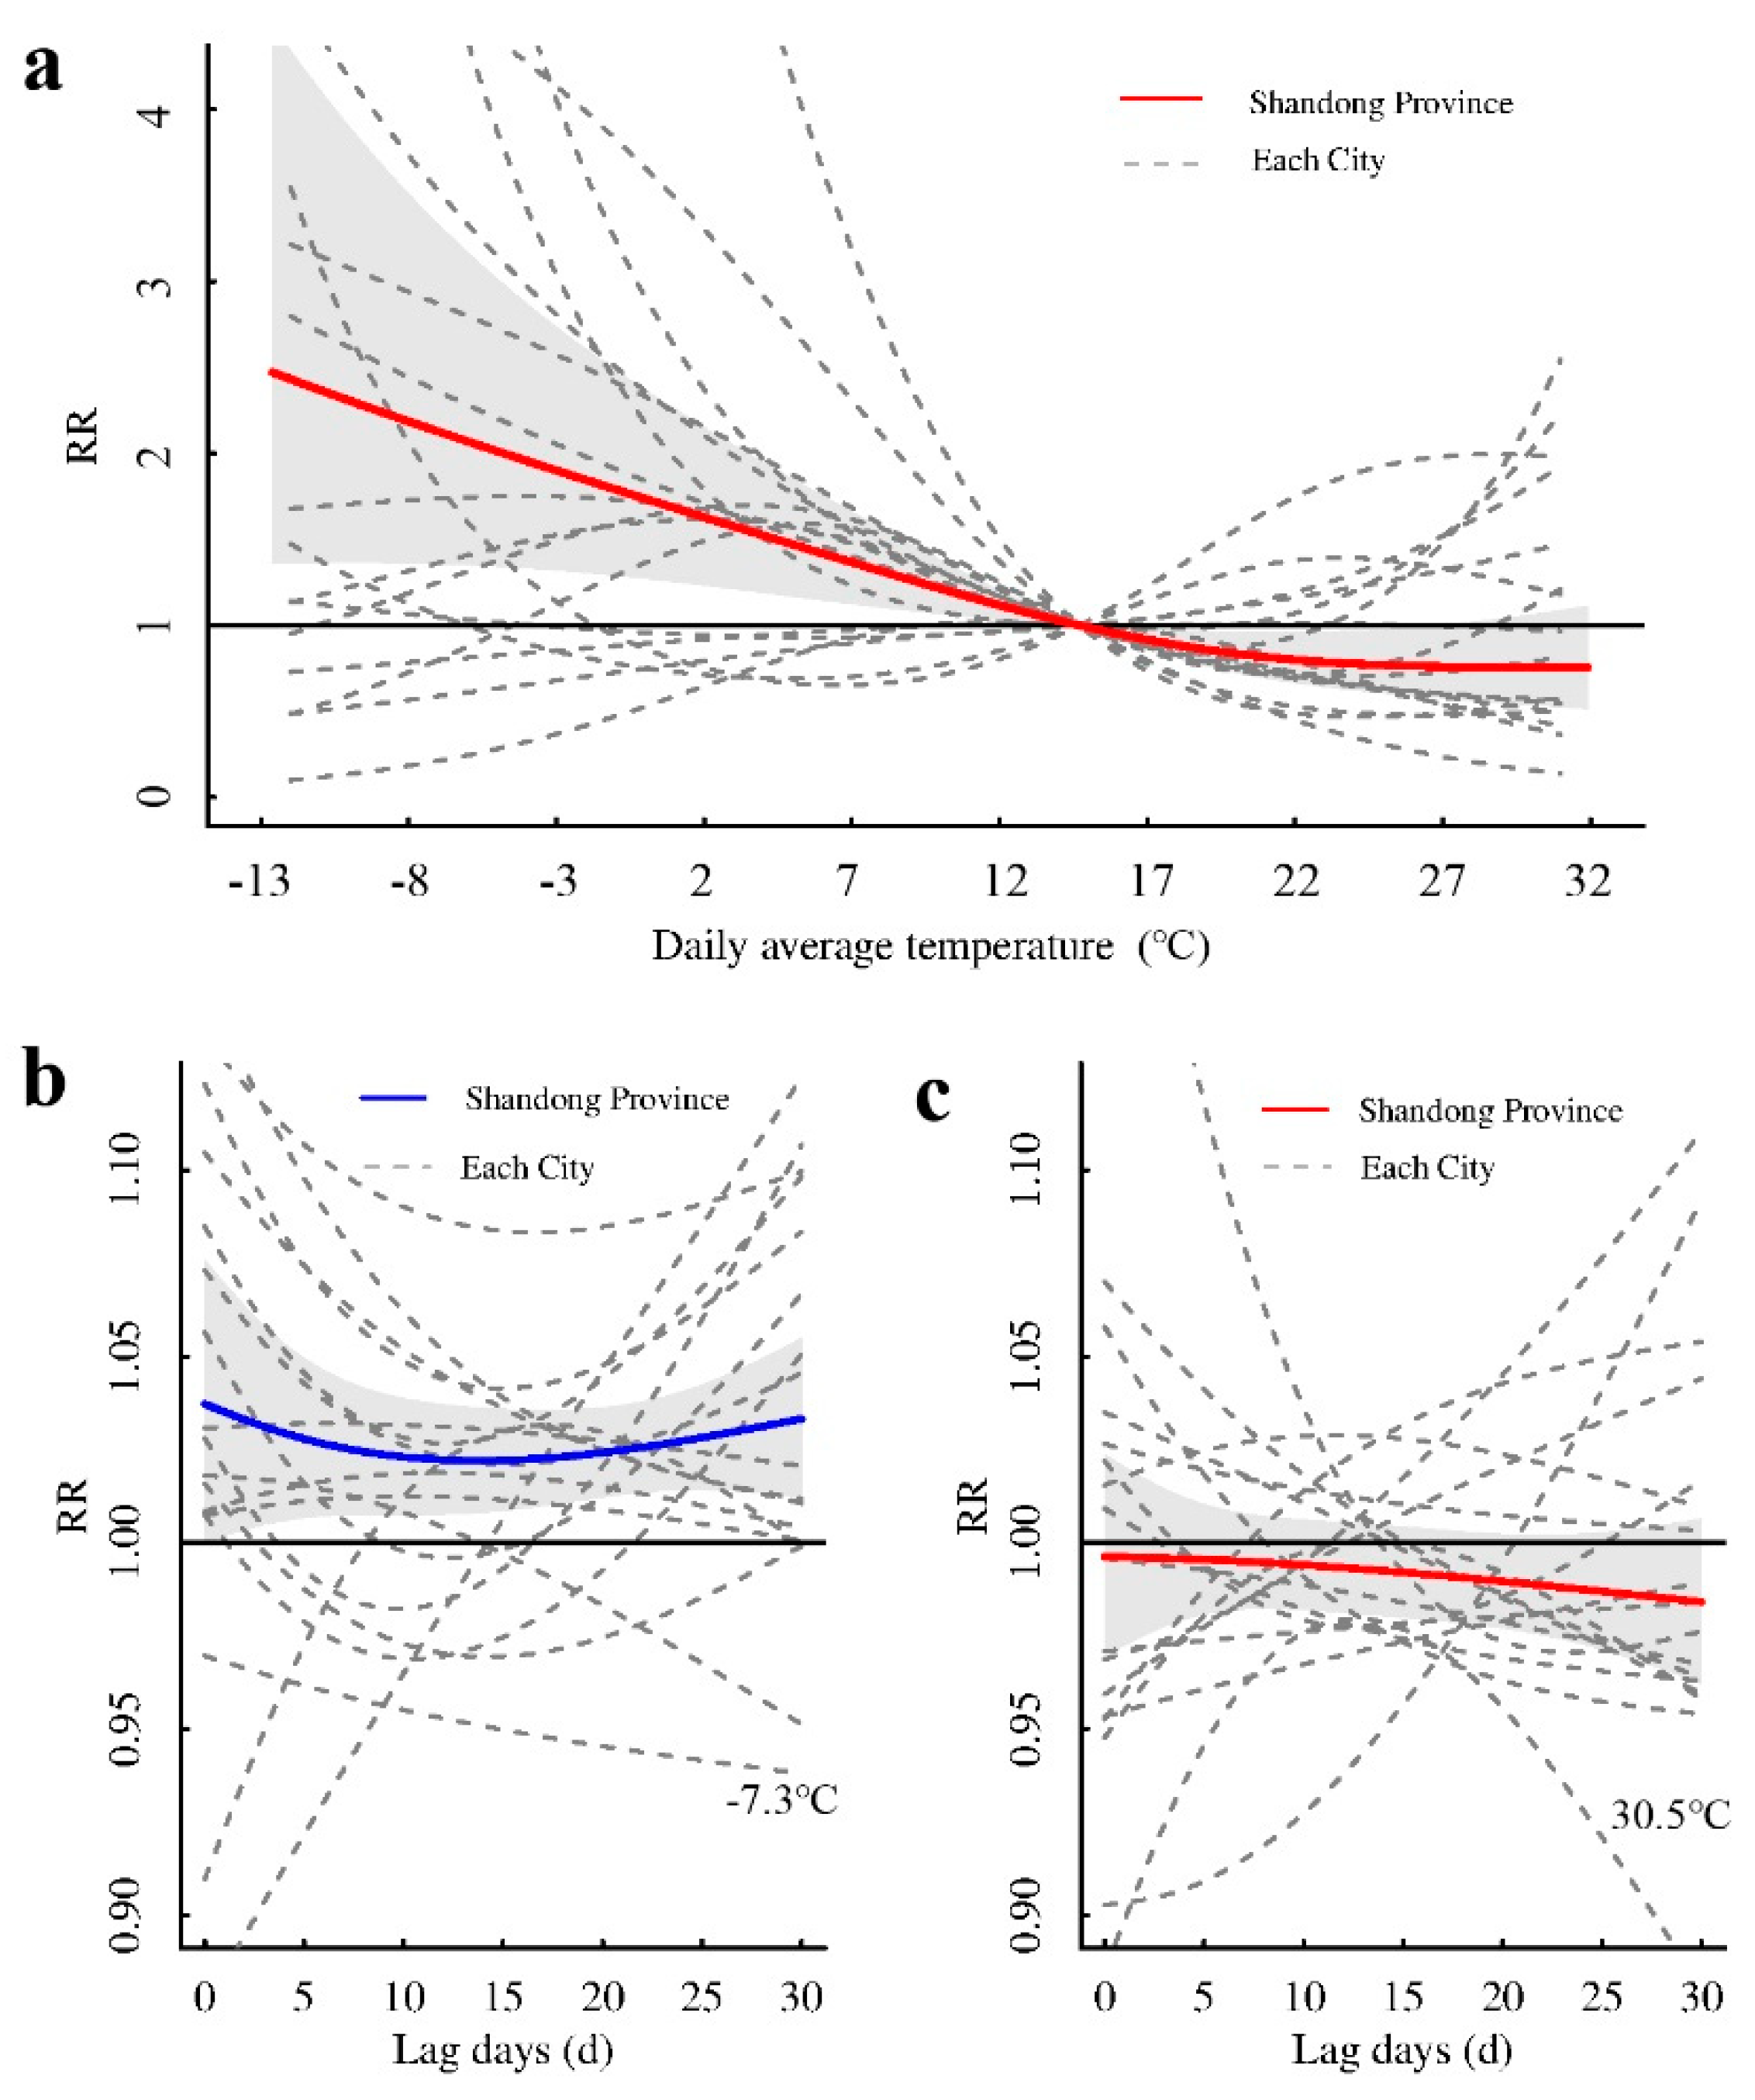
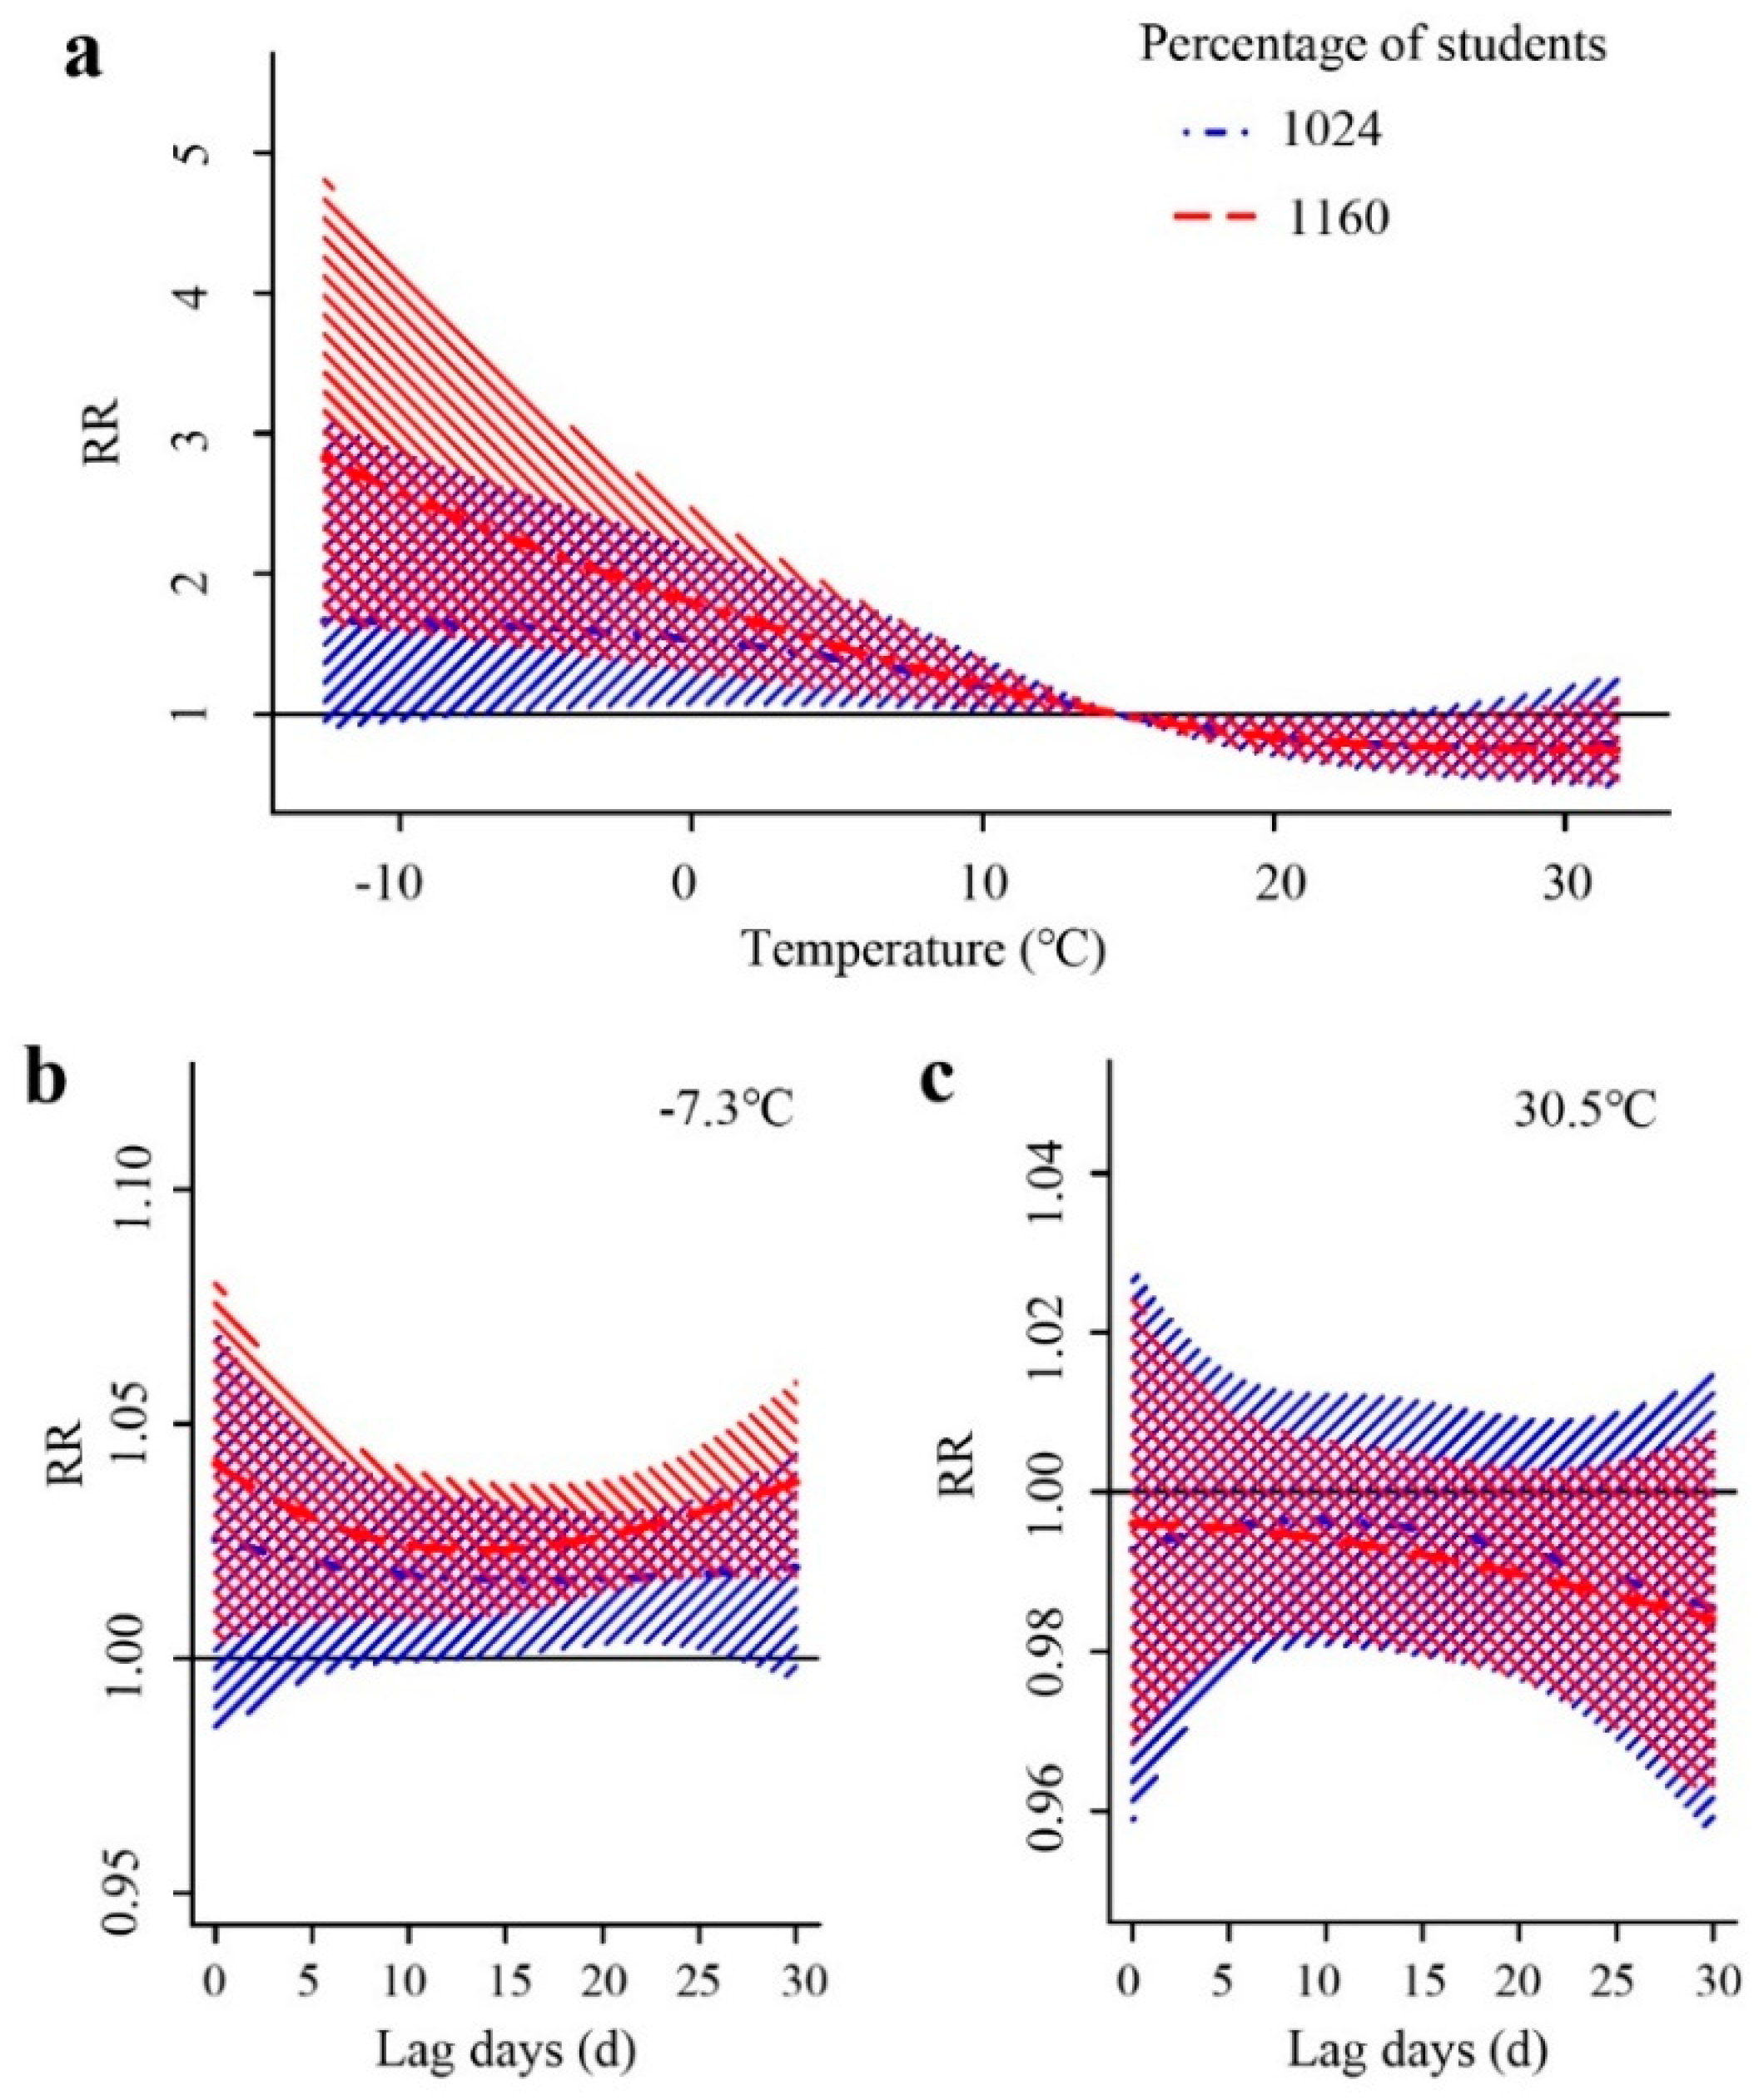
3.3. The Effect of Daily Mean Temperature on Mumps

In the first stage, we obtained the exposure–response relationship between the daily average temperature and the cumulative relative risk (RR) of mumps in 17 cities in Shandong Province, with different lag days. The exposure–response relationship when the lag time was 30 days is shown in Figure 3. It can be seen that RR changed with temperature (we take 14.7 °C as the reference temperature), and the exposure–response relationship varied from city to city. Most of the curves were “V”-, “L”-, or “S”-shaped. The cumulative RR was highest when the temperature was −12.6 °C, with an RR of 2.429 (95%CI: 1.339–4.407). As the daily average temperature gradually increased, the cumulative RR of mumps decreased. When the temperature was 29.7 °C, the cumulative RR was reduced to the lowest (RR = 0.759, 95%CI: 0.545–1.056), which was not statistically significant (Figure 4a).
We used P1 (1st percentile: −7.3 °C) and P99 (99th percentile: 30.5 °C) to calculate the RR, representing the effects of low and high temperatures on mumps, respectively. The effects of temperature on mumps at different lag times were all risk effects when the temperature was low, and there was a certain delay in the risk of onset. It appeared that when the lag time was one day, the risk was the highest (RR = 1.035, 95%CI: 1.002–1.069). With an increase in the lag time, the effect gradually decreased. When the lag time was 14 days, the effect value reached the minimum (RR = 1.022, 95%CI: 1.008–1.036), and then gradually rose (Figure 4b). The overall effect of temperature on mumps with different lag times at high temperatures was a protective effect. The longer the lag time was, the greater the protection effect. However, under different lag values (<30 days), the protective effect of high temperature on mumps was not statistically significant (Figure 4c).
In the second stage, modifying factors such as longitude and population density (Table S1) were included in the meta-regression analysis of the heterogeneity to explore the source and size of heterogeneity among cities. The heterogeneity test of the meta-regression results showed that there was heterogeneity (Q = 95.447, p = 0.000), and the size of heterogeneity was I2 = 49.7%. The results of the Wald test showed that the source of heterogeneity was the proportion of primary and secondary school students (Stat = 8.374, p = 0.039). After adding this variable in the meta-analysis, the heterogeneity dropped to 45.4%. The Wald test for the other five variables was not statistically significant (Table 2).
Based on the meta-regression model, we used P25 (1024/10,000) and P75 (1160/10,000) to represent the low and high proportions of primary and secondary school students, respectively. The exposure–response relationship of RR to temperature was different when the proportion of primary and secondary school students was different (Figure 5a). Compared with the median temperature of 14.7 °C, as the temperature increased, areas with a high proportion of primary and middle school students had a higher risk of mumps than areas with a low proportion. Areas with a high proportion of students had a greater risk at low temperatures, reaching a maximum value at −12.6 °C (RR = 2.778, 95%CI: 1.631–4.730), and then gradually decreased. The areas with a low proportion of students also had the highest risk (RR = 1.633, 95%CI: 0.88–3.004) at −12.6 °C, but this was not statistically significant.
When the temperature was low, cities with a high proportion of students had a greater risk than cities with a low proportion of students. There was no hysteresis in the effect of temperature on mumps, and there was no significant difference (Stat = 5.471, p = 0.140, Figure 5b). At high temperatures, the effect of the proportion of primary and middle school students at different lag times was not statistically significant (Stat = 0.441, p = 0.932, Figure 5c).

3.4. Model Residuals and Sensitivity Analysis

The residual distribution of the developed model had stationary random white noise, indicating that the fitting result was good (Figure S2). The results of the sensitivity analysis showed that the model established by the parameters in this study was robust and could produce credible results (Table S3). It can be seen that when we changed the degree of freedom of meteorological factors (df = 2–7) and the maximum lag time of daily average temperature (14, 21, 30), and the degrees of freedom of time variables were used to control long-term trends and seasonal trends (df = 6–9), the estimated values of the effects were all stable.

4. Discussion

This study found that at the provincial level, when the daily average temperature is low, the cumulative risk of mumps is higher, and the cumulative risk is low when the daily average temperature is high. The exposure–response curve of temperature to mumps differs from city to city, but most cities are similar to the provincial level. The combined effect of daily average temperature on mumps is heterogeneous. When the temperature is low, cities with a high proportion of primary and middle school students have a higher risk of mumps.
The two-stage model effectively solves the problem of loss of information by simply averaging the data, so the combined effect of daily average temperature on mumps is more accurate. However, the second stage of the two-stage model is based on the effects obtained in the first stage, so it is necessary to ensure the accuracy of the first-stage parameter estimation. In addition, the effect modifiers included in the second stage will play an important role in the results, and ignoring important effect modifiers will also bias the results. We will further explore the above issues in a future study.
The impact of temperature on mumps may vary depending on the study areas and analysis methods [19,20,21]. Onozuka et al., Ho et al., and Zhang et al. all found that temperature can affect the incidence of mumps [1,14,33]. Onozuka et al. concluded that there is a positive linear correlation between temperature and mumps. Both Ho et al. and Zhang et al. found a non-linear relationship between temperature and mumps, but the non-linear relationship that they obtained was not consistent. Ho et al. used Poisson regression to research Taiwan Province, China, but they did not consider the impact of lag time. Zhang et al. used Boosting Regression Tree (BRT) to research Jining City, China, but the dependent variable of the study was the months with high incidence of mumps rather than the number of cases. Different study areas and analysis methods may be the reasons behind the different conclusions.
This study has found that the exposure–response relationship between the daily average temperature and the cumulative relative risk of mumps at the provincial level is approximately “L”-shaped. This means that when the temperature is low, the risk of mumps is high. The biological mechanism of the effect of low temperature on mumps is unclear. However, the study of Eccles et al. has shown that cooling air increases the viscosity of the mucus layer covering the surface of the nasal mucosa and reduces the frequency of cilia swinging, which is not conducive to the excretion of adsorbed dust, harmful bacteria, viruses, etc., and easily causes nasal mucosal infection. Another possibility is that the cooling of the mucosal layer makes the virus residing in the upper respiratory tract more stable and increases the chance of infection [34]. Moreover, individuals are less likely to go outside when the temperature is low. A confined environment may increase the possibility of virus transmission. At a high temperature, the decline in incidence may be due to the inability of the mumps virus to withstand high temperatures [2], which affects the transcription and replication of the virus. Therefore, relevant government departments should strengthen the prevention and control of mumps when the temperature is low.
By adding potential influencing factors to our analysis, we found that when the temperature is low, the impact of daily average temperature on mumps is significantly higher in cities with a higher proportion of primary and middle school students than in cities with a lower proportion. Primary and middle school students are often situated in densely populated places such as classrooms with poor air circulation, which is conducive to the spread of the virus. Cities with a higher proportion of primary and middle school students mean more susceptible people. Exposure and contact between susceptible people increase the risk of mumps. On the other hand, with the improvement of the social economy and people’s living standards, the physique of Chinese children and adolescents has improved significantly, but the physical development has been relatively slow or even decreased [35]. Therefore, it is necessary to implement early warnings and early interventions in areas with a high proportion of primary and secondary school students during the epidemic season of mumps. Strengthening school health education and enhancing the physical fitness of primary and secondary school students can effectively reduce clusters of cases or outbreaks.
It is worth noting that the proportion of primary and middle school students can only explain part of the heterogeneity of cities, and limitations exist in the analyses. The unexplainable heterogeneity may be attributed to the following reasons. First, the city-specific features are not enough to fully represent their modification effect. For example, the GDP per capita was analyzed using only annual data, which provided limited information for the time series analysis. Second, there may be other important effect modifiers that we did not consider. For example, local lifestyles, public health interventions, and differences in data quality are also important factors that explain some parts of the heterogeneity [36]. Third, we used the number of daily recorded cases of mumps, which would increase the noise of the data. Although we used a variety of methods to control this in the model, it may still have had a certain impact. In addition, if we can obtain more information about the sociodemographic structure of the population, we can obtain a clearer result by excluding cities with large differences in the sociodemographic structure of the population.
One more factor that may influence the number of mumps cases is the MuCV vaccination rate of children. During the study period, Shandong Province actively implemented child immunization procedures in the National Immunization Program [37]. All the children were required to be vaccinated, except for those who could not be vaccinated due to special reasons. According to the report of the Shandong Center for Disease Control and Prevention, the vaccination rate of MuCV in children with one dose of Shandong Province was above 95% in almost all the years [38]. Therefore, considering that the children’s MuCV vaccination rate was less variable throughout the study period, it was excluded when fitting the models in the current study.
In the context of climate change, the frequency of extreme weather is increasing, and meteorological factors such as temperature will increase the risk of mumps. Future work should pay more attention to mumps when the temperature is low, especially cities with a high proportion of primary and secondary school students. Specifically, first, while routine immunization has been implemented, it is necessary to pay attention to leak detection. The enrollment vaccination certificate of all the students should be inspected when the new semester begins. Second, the mumps antibody-positive rate of citizens, especially children aged 1–15, could be spot-checked regularly. Once a low mumps antibody-positive rate is detected in some specific populations, replanting work should be implemented [38]. Third, in the cold season, namely in the autumn and winter, teachers should organize outdoor activities for students. When the students are in a closed environment (such as classrooms), the windows should be opened regularly to enhance air circulation. Finally, knowledge popularization activities could be carried out for elementary and middle school students to increase their awareness about protective measures such as maintaining social distancing, strengthening their physical fitness, etc.

5. Conclusions

In Shandong Province, China, there is a non-linear relationship between the cumulative relative risk of mumps and daily average temperature, with different lagged effects. At the provincial level, low temperatures could bring more cases of mumps with certain lagged effects. More public health measures should be taken to reduce the risks when temperatures are low, especially for cities with a high proportion of primary and secondary school students.

Supplementary Materials

The following are available online at https://www.mdpi.com/article/10.3390/ijerph181910359/s1, Table S1: Geography, population, and socioeconomic variables in Shandong Province and 17 cities. Table S2: Spearman rank correlation analysis of meteorological, demographic, and other factors and the incidence of mumps in Shandong Province from 2009 to 2017. Table S3: Sensitivity analysis (relative risk RR). Figure S1: The daily cases of mumps from 2009 to 2017 in 17 cities, Shandong Province. Figure S2: The residual graph of DLNM.

Author Contributions

Methodology, visualization, and writing—original draft preparation, Y.Z. (Yuchen Zhu); data curation, Y.Z. (Yuchen Zhu), Y.J., K.S., D.Z. and T.L.; conceptualization, D.Z.; formal analysis, D.Z. and Y.Z. (Yuchen Zhu); writing—review and editing, X.L., Y.Z. (Ying Zhang), and Y.H.; validation, C.L.; supervision, X.L.; funding acquisition, X.L. and Q.X. All authors have read and agreed to the published version of the manuscript.

Funding

This research was funded by the National Key Research and Development Program of China, grant numbers: 2019YFC1200500, 2019YFC1200502; the General Administration of Customs, P.R. China, grant number: 2019HK125; and the National Natural Science Foundation of China, grant number: 81673238.

Institutional Review Board Statement

Not applicable.

Informed Consent Statement

Not applicable.

Data Availability Statement

The daily recorded data of mumps cases in 17 cities from 1 January 2009 to 31 December 2017 were collected from the Information System of the Shandong Center for Disease Control and Prevention. The daily meteorological data of 17 cities in Shandong Province were obtained from the China Meteorological Science Data Sharing Service System (http://data.cma.cn/, accessed on 27 September 2021). The socioeconomic factors of each city were all from the Statistical Yearbook of Shandong Provincial Bureau of Statistics (http://tjj.shandong.gov.cn/tjnj, accessed on 27 September 2021).

Acknowledgments

We are grateful to the National Natural Science Foundation of China and all partners who have contributed to this research.

Conflicts of Interest

The authors declare no conflict of interest. The funders had no role in the design of the study; in the collection, analyses or interpretation of data; in the writing of the manuscript or in the decision to publish the results.

References

  1. Ho, Y.-C.; Su, B.-H.; Su, H.-J.; Chang, H.-L.; Lin, C.-Y.; Chen, H.; Chen, K.-T. The Association between the Incidence of Mumps and Meteorological Parameters in Taiwan. Hum. Vaccin. Immunother. 2015, 11, 1406–1412. [Google Scholar] [CrossRef] [Green Version]
  2. Li, L.; Ren, H. Infectious Diseases, 9th ed.; People’s Medical Publishing House: Beijing, China, 2018. [Google Scholar]
  3. Beleni, A.-I.; Borgmann, S. Mumps in the Vaccination Age: Global Epidemiology and the Situation in Germany. Int. J. Environ. Res. Public Health 2018, 15, 1618. [Google Scholar] [CrossRef] [Green Version]
  4. Sabbe, M.; Vandermeulen, C. The Resurgence of Mumps and Pertussis. Hum. Vaccin. Immunother. 2016, 12, 955–959. [Google Scholar] [CrossRef] [Green Version]
  5. Chee, K.; Workman, C.; Irvine, S.; Ferson, M.J. Mumps Outbreak in a Rugby League Team despite Pre-Existing Immunity. Med. J. Aust. 2020, 213, 225–226. [Google Scholar] [CrossRef]
  6. Dyer, O. Mumps Epidemic in North America Proves Unusually Stubborn. BMJ 2017, 359, j5305. [Google Scholar] [CrossRef]
  7. Indenbaum, V.; Hübschen, J.M.; Stein-Zamir, C.; Mendelson, E.; Sofer, D.; Hindiyeh, M.; Anis, E.; Abramson, N.; Haas, E.J.; Yosef, Y.; et al. Ongoing Mumps Outbreak in Israel, January to August 2017. Eurosurveillance 2017, 22, 30605. [Google Scholar] [CrossRef] [Green Version]
  8. Koeller, S.; Meyer, D.; Shearer, M.P.; Hosangadi, D.; Snyder, M.; Nuzzo, J.B. Responding to a Mumps Outbreak Impacting Immigrants and Low-English-Proficiency Populations. J. Public Health Manag. Pract. 2020, 26, 124–130. [Google Scholar] [CrossRef] [PubMed]
  9. Lu, J.; Yang, Z.; Ma, X.; Ma, M.; Zhang, Z. The Role of Meteorological Factors on Mumps Incidence among Children in Guangzhou, Southern China. PLoS ONE 2020, 15, e0232273. [Google Scholar] [CrossRef] [PubMed]
  10. Rajčević, S.; Šeguljev, Z.; Petrovic, V.; Medić, S.; Nedelijković, J.; Milošević, V.; Turo, L.; Ristić, M. Ongoing Mumps Outbreak in Novi Sad, the Autonomous Province of Vojvodina, Serbia, January to April 2012. Eurosurveillance 2012, 17, 20169. [Google Scholar] [CrossRef] [PubMed]
  11. Qing, X.; Ping, X.; Xueqiang, F.; Xiaodong, L.; Changyin, W.; Lizhi, S.; Aiqiang, X. Evaluation on the short term effectiveness of two doses mumps-containing vaccine policy in Shandong, China. Chin. J. Prev. Med. 2018, 52, 265–270. [Google Scholar] [CrossRef]
  12. Li, S.; Ma, C.; Hao, L.; Su, Q.; An, Z.; Ma, F.; Xie, S.; Xu, A.; Zhang, Y.; Ding, Z.; et al. Demographic Transition and the Dynamics of Measles in Six Provinces in China: A Modeling Study. PLoS Med. 2017, 14, e1002255. [Google Scholar] [CrossRef] [PubMed] [Green Version]
  13. Hu, W.; Li, Y.; Han, W.; Xue, L.; Zhang, W.; Ma, W.; Bi, P. Meteorological Factors and the Incidence of Mumps in Fujian Province, China, 2005-2013: Non-Linear Effects. Sci. Total Environ. 2018, 619–620, 1286–1298. [Google Scholar] [CrossRef] [PubMed]
  14. Onozuka, D.; Hashizume, M. Effect of Weather Variability on the Incidence of Mumps in Children: A Time-Series Analysis. Epidemiol. Infect. 2011, 139, 1692–1700. [Google Scholar] [CrossRef] [Green Version]
  15. Lin, S.; Ruan, S.; Geng, X.; Song, K.; Cui, L.; Liu, X.; Zhang, Y.; Cao, M.; Zhang, Y. Non-Linear Relationships and Interactions of Meteorological Factors on Mumps in Jinan, China. Int. J. Biometeorol. 2021, 65, 555–563. [Google Scholar] [CrossRef] [PubMed]
  16. Wu, H.; You, E.; Jiang, C.; Yang, Y.; Wang, L.; Niu, Q.; Lu, X.; Huang, F. Effects of Extreme Meteorological Factors on Daily Mumps Cases in Hefei, China, during 2011–2016. Environ. Sci. Pollut. Res. 2020, 27, 4489–4501. [Google Scholar] [CrossRef]
  17. Li, R.; Zhang, T.; Liang, Y.; Luo, C.; Jiang, Z.; Zhu, Q.; Xue, F.; Liu, Y.; Li, X. Association between Incidence of Mumps and Meteorological Factors in Ji’ning. J. Environ. Health 2016, 33, 381–384. [Google Scholar] [CrossRef]
  18. Zha, W.; Li, W.; Zhou, N.; Zhu, J.; Feng, R.; Li, T.; Du, Y.; Liu, Y.; Hong, X.; Lv, Y. Effects of Meteorological Factors on the Incidence of Mumps and Models for Prediction, China. BMC Infect. Dis. 2020, 20, 468. [Google Scholar] [CrossRef] [PubMed]
  19. Li, R.; Lin, H.; Liang, Y.; Zhang, T.; Luo, C.; Jiang, Z.; Xu, Q.; Xue, F.; Liu, Y.; Li, X. The Short-Term Association between Meteorological Factors and Mumps in Jining, China. Sci. Total Environ. 2016, 568, 1069–1075. [Google Scholar] [CrossRef] [PubMed]
  20. Yang, Q.; Yang, Z.; Ding, H.; Zhang, X.; Dong, Z.; Hu, W.; Liu, X.; Wang, M.; Hu, G.; Fu, C. The Relationship between Meteorological Factors and Mumps Incidence in Guangzhou, China, 2005–2012. Hum. Vaccin. Immunother. 2014, 10, 2421–2432. [Google Scholar] [CrossRef] [Green Version]
  21. Hao, Y.; Wang, R.-R.; Han, L.; Wang, H.; Zhang, X.; Tang, Q.-L.; Yan, L.; He, J. Time Series Analysis of Mumps and Meteorological Factors in Beijing, China. BMC Infect. Dis. 2019, 19, 435. [Google Scholar] [CrossRef]
  22. Yu, G.; Yang, R.; Yu, D.; Cai, J.; Tang, J.; Zhai, W.; Wei, Y.; Chen, S.; Chen, Q.; Zhong, G.; et al. Impact of Meteorological Factors on Mumps and Potential Effect Modifiers: An Analysis of 10 Cities in Guangxi, Southern China. Environ. Res. 2018, 166, 577–587. [Google Scholar] [CrossRef]
  23. Liu, Z.; Zhang, F.; Zhang, Y.; Li, J.; Liu, X.; Ding, G.; Zhang, C.; Liu, Q.; Jiang, B. Association between Floods and Infectious Diarrhea and Their Effect Modifiers in Hunan Province, China: A Two-Stage Model. Sci. Total Environ. 2018, 626, 630–637. [Google Scholar] [CrossRef] [PubMed]
  24. Wu, W.; Xiao, Y.; Li, G.; Zeng, W.; Lin, H.; Rutherford, S.; Xu, Y.; Luo, Y.; Xu, X.; Chu, C.; et al. Temperature-Mortality Relationship in Four Subtropical Chinese Cities: A Time-Series Study Using a Distributed Lag Non-Linear Model. Sci. Total Environ. 2013, 449, 355–362. [Google Scholar] [CrossRef] [PubMed]
  25. Yang, J.; Yin, P.; Zhou, M.; Ou, C.-Q.; Li, M.; Liu, Y.; Gao, J.; Chen, B.; Liu, J.; Bai, L.; et al. The Effect of Ambient Temperature on Diabetes Mortality in China: A Multi-City Time Series Study. Sci. Total Environ. 2016, 543, 75–82. [Google Scholar] [CrossRef] [PubMed]
  26. Zhan, Z.; Zhao, Y.; Pang, S.; Zhong, X.; Wu, C.; Ding, Z. Temperature Change between Neighboring Days and Mortality in United States: A Nationwide Study. Sci. Total Environ. 2017, 584–585, 1152–1161. [Google Scholar] [CrossRef]
  27. Gasparrini, A.; Armstrong, B.; Kenward, M.G. Distributed Lag Non-Linear Models. Stat. Med. 2010, 29, 2224–2234. [Google Scholar] [CrossRef] [Green Version]
  28. Zhang, D.; Wang, X.; Xu, Q.; Zheng, Z.; Wang, P.; Li, J.; Liu, J.; Xu, Q.; Li, X. Effect of Temperature on the Incidence of Mumps in Heze City and Weihai City. J. Shandong Univ. Health Sci. 2018, 56, 88–94. [Google Scholar] [CrossRef]
  29. Zhang, J.; Wang, W.; Zhang, C. Distributed Lag Effects in the Relationship between Daily Mean Temperature and Mortality in Taian. J. Jining Med. Univ. 2015, 38, 381–388. [Google Scholar] [CrossRef]
  30. Gasparrini, A.; Armstrong, B.; Kenward, M.G. Multivariate Meta-Analysis for Non-Linear and Other Multi-Parameter Associations. Stat. Med. 2012, 31, 3821–3839. [Google Scholar] [CrossRef] [Green Version]
  31. Jackson, D.; Riley, R.; White, I.R. Multivariate Meta-Analysis: Potential and Promise. Stat. Med. 2011, 30, 2481–2498. [Google Scholar] [CrossRef] [Green Version]
  32. Ettehad, D.; Emdin, C.A.; Kiran, A.; Anderson, S.G.; Callender, T.; Emberson, J.; Chalmers, J.; Rodgers, A.; Rahimi, K. Blood Pressure Lowering for Prevention of Cardiovascular Disease and Death: A Systematic Review and Meta-Analysis. Lancet 2016, 387, 957–967. [Google Scholar] [CrossRef] [Green Version]
  33. Zhang, D.; Guo, Y.; Rutherford, S.; Qi, C.; Wang, X.; Wang, P.; Zheng, Z.; Xu, Q.; Li, X. The Relationship between Meteorological Factors and Mumps Based on Boosted Regression Tree Model. Sci. Total Environ. 2019, 695, 133758. [Google Scholar] [CrossRef]
  34. Eccles, R. An Explanation for the Seasonality of Acute Upper Respiratory Tract Viral Infections. Acta Otolaryngol. 2002, 122, 183–191. [Google Scholar] [CrossRef] [PubMed]
  35. Zhu, Z.; Tang, Y.; Zhuang, J.; Liu, Y.; Wu, X.; Cai, Y.; Wang, L.; Cao, Z.-B.; Chen, P. Physical Activity, Screen Viewing Time, and Overweight/Obesity among Chinese Children and Adolescents: An Update from the 2017 Physical Activity and Fitness in China—The Youth Study. BMC Public Health 2019, 19, 197. [Google Scholar] [CrossRef] [PubMed] [Green Version]
  36. Xiao, X.; Gasparrini, A.; Huang, J.; Liao, Q.; Liu, F.; Yin, F.; Yu, H.; Li, X. The Exposure-Response Relationship between Temperature and Childhood Hand, Foot and Mouth Disease: A Multicity Study from Mainland China. Environ. Int. 2017, 100, 102–109. [Google Scholar] [CrossRef] [PubMed]
  37. Xiong, P.; Zhang, W.; Liu, X.; Liu, Y.; Wang, C.; Fang, X.; Xu, A.; Xu, Q. Epidemiological characteristics of mumps in Shandong Province during different periods of immunization strategy. China Vaccines Immun. 2018, 24, 648–653. [Google Scholar]
  38. Notice of the National Health Commission on Issuing the National Immunization Program Vaccine Child Immunization Procedures and Instructions (2021 Edition). Available online: http://www.nhc.gov.cn/jkj/s3581/202103/590a8c7915054aa682a8d2ae8199e222.shtml (accessed on 27 September 2021).
Figure 1. Location of the study area in China.
Ijerph 18 10359 g001
Figure 2. The daily cases of mumps from 2009 to 2017. The top panel represents the epidemic curve of Shandong Province, and the bottom panels represent the epidemic curves of Jinan City, Jining City, Weihai City, and Qingdao City, respectively. These four cities represent different regions of Shandong Province, China (inland and coastal cities). The epidemic curves of 17 cities are shown in the Supplementary Figure S1.
Ijerph 18 10359 g002
Figure 3. The cumulative RR of temperature on mumps with a 30-day lag in 17 cities in Shandong Province from 2009 to 2017.
Ijerph 18 10359 g003
Figure 4. The effect of temperature on mumps. (a) The cumulative RR of temperature on mumps in Shandong Province and other cities with a 30-day lag. (b,c) represent the effects of low and high temperatures, respectively, in Shandong Province and 17 cities on mumps under different lag times.
Ijerph 18 10359 g004
Figure 5. The effect of temperature on mumps when the proportion of primary and secondary school students is high (P75(1160/10,000), red) and when the proportion of primary and secondary school students is low (P25(1024/10,000), blue). (a) represents the effect of daily average temperature on mumps. (b,c) represent the effects of temperature on mumps at different lag times.
Ijerph 18 10359 g005
Table 1. Daily average temperatures in Shandong Province and 17 cities from 2009 to 2017.
City/ProvinceDaily Average Temperature (°C)
x ¯ MinP25MP75Max
Jinan14.92−12.405.4016.6024.1035.00
Qingdao13.36−11.504.8014.5021.8031.20
Zibo13.22−13.103.6014.9022.8032.00
Zaozhuang14.49−11.705.1016.0023.7032.80
Dongying14.03−13.203.7015.8024.1034.30
Yantai12.87−11.603.5514.1022.0030.90
Weifang13.72−13.003.7015.3023.5033.40
Jining14.22−10.274.7015.7023.6032.70
Taian6.30−22.80−2.308.0015.1023.00
Weihai11.90−10.403.6512.7020.3027.70
Rizhao13.87−11.405.1015.0022.3533.10
Laiwu14.37−13.104.6016.2024.0033.70
Linyi14.35−11.005.3015.7023.2032.50
Dezhou13.44−14.303.3015.1023.2032.60
Liaocheng14.21−10.904.6015.7023.6032.90
Binzhou13.49−15.303.3015.2023.4032.90
Heze14.46−9.205.3015.9023.4032.00
Shandong13.37−22.804.0014.7022.6035.00
Note: Min, P25, M, P75, and Max represent the minimum, 25th percentile, median, 75th percentile, and maximum value, respectively.
Table 2. The heterogeneity test and Wald test results of the meta-analysis for the effect of daily average temperature on mumps.
Cochran Q TestI2Information CriterionWald Test
Qdfp(%)AICBICStatdfp
Intercept95.447480.00049.7177.271194.112---
Longitude88.007450.00048.9183.815205.4954.02630.259
latitude89.833450.00049.9185.137206.8122.82630.419
Population density94.459450.00052.4214.426236.1061.80330.614
Urbanization rate90.732450.00050.4193.855215.5353.68430.298
GDP per capita91.648450.00050.9245.327267.0073.14930.369
Proportion of students *82.442450.00145.4209.639231.3198.37430.039
Note: * The proportion of students represents the proportion of primary and secondary school students in the entire population.
Publisher’s Note: MDPI stays neutral with regard to jurisdictional claims in published maps and institutional affiliations.

