Article

Tracking Fecal Bacterial Dispersion from Municipal Wastewater to Peri-Urban Farms during Monsoon Rains in Hue City, Vietnam

1
United Graduate School of Agricultural Sciences, Iwate University, 18-8 Ueda 3-Chome, Morioka 020-8850, Japan
2
Department of Food, Life and Environmental Sciences, Faculty of Agriculture, Yamagata University, 1-23 Wakaba-Machi, Tsuruoka 997-8555, Japan
3
Faculty of Environmental Science, University of Sciences, Hue University, 77 Nguyen Hue St., Hue City 49100, Vietnam
*
Authors to whom correspondence should be addressed.
Int. J. Environ. Res. Public Health 2021, 18(18), 9580; https://doi.org/10.3390/ijerph18189580
Submission received: 3 August 2021 / Revised: 8 September 2021 / Accepted: 8 September 2021 / Published: 11 September 2021

Abstract

:
Disease outbreaks attributed to monsoon flood-induced pathogen exposure are frequently reported, especially in developing cities with poor sanitation. Contamination levels have been monitored in past studies, yet the sources, routes, and extents of contamination are not always clear. We evaluated pollution from municipal wastewater (MWW) discharge and investigated fecal contamination by Escherichia coli (E. coli) in three agricultural fields on the outskirts of Hue City, Vietnam. After E. coli concentration was determined in irrigation water (IRW), MWW, soil, vegetables (VEG), and manure, its dispersion from MWW was tracked using multilocus sequence typing (MLST) and phylogenetic analyses during the wet and dry seasons. IRW was severely contaminated; 94% of the samples were positive with E. coli exceeding the stipulated standards, while VEG contamination was very low in both seasons. The confirmed total number of isolates was comparable between the seasons; however, results from MLST and phylogenetic clustering revealed more links between the sites and samples to MWW during the wet season. The wet season had four mixed clusters of E. coli isolates from multiple locations and samples linked to MWW, while only one mixed cluster also linking MWW to IRW was observed during the dry season. The most prevalent sequence type (ST) complex 10 and two others (40 and 155) have been associated with disease outbreaks, while other STs have links to major pathotypes. Irrigation canals are significant routes for E. coli dispersion through direct links to the urban drainage-infested river. This study clarified the genotype of E. coli in Hue city, and the numerous links between the samples and sites revealed MWW discharge as the source of E. coli contamination that was enhanced by flooding.

1. Introduction

Extreme flooding is a major cause of weather-related infectious disease outbreaks with strong links to diarrheal diseases [1,2]. The frequency and intensity of extreme precipitation events are projected to increase [1,3,4]; thus, floods and the associated impacts will increase. Flooding overwhelms drainage systems and, in some cases, allows the mixing of waste from different sources [1,5]. Degraded water quality, waterborne disease, and infectious diarrhea remain prominent and persistent problems worldwide, and they are expected to worsen under future climate change projections [2]. Environmental pollution associated with floods leads to health problems as enteric pathogens are mobilized and dispersed to surrounding areas during flooding [3,6]. Various studies by de Man et al. [7], ten Veldhuis et al. [8], and Yu et al. [6] have revealed the presence of high numbers of both Escherichia coli and intestinal enterococci in floodwater [9].
Extreme rainfall events have been shown to trigger waterborne disease outbreaks via infrastructural inundation, hydrological short-circuiting/preferential flow, and the subsequent consumption of contaminated water [3]. Past studies revealed increased rates of diarrhea and other illnesses after heavy rainfalls and flooding, suggesting an increase in post-flooding microbial loads, yet the individual pathogens present in the water [9] and the extent of microbial dissemination have not been explored. Further, floodwater can contaminate widely across flooded areas, including the sources of domestic water supplies and agricultural fields, and the pathogens carried in floodwater can persist for long periods after flooding has ceased [10,11,12], including up to 238 days in agricultural soils [13]. The flooding of agricultural fields is a known source of contamination, though microbiological contamination in fields has been infrequently measured [10,13]. The lack of data on the levels, extents, and spatial patterns of contamination, which can vary greatly, hinders remediation efforts. Such information is important for understanding the remediation time required to reduce contamination to safe levels [14]. Regardless of the route of transmission, exposure to pathogens in floodwater poses a severe public health risk and contributes to the global disease burden and preventable mortality [11,15].
Southeast Asia is prone to flooding due to seasonal rains induced by the passage of the East Asian Monsoon. Out of 161 extreme flood disasters reported worldwide in 2016, 43% occurred in Asia [16]. Vietnam is one of the most flood-prone countries, and coastal Hue City is among the cities most vulnerable to seasonal flooding from monsoon rains [17]. Hue city features a tropical monsoon climate with high temperatures, plentiful radiation, and a distinctive rainfall regime [18]. It is one of the areas that receive the highest rainfall in Vietnam: heavy rainfall occurs from October to December, with an average precipitation of ~2682 mm per year (climate data available online: http://en.climate-data.org (accessed on 14 February 2021)). Hue City and several other cities in Vietnam were struck by floods in December of 2018 (EM-DAT, available online: http://emdat.be (accessed on 28 January 2020). When flooding occurs, floodwaters flow directly downstream along the Perfume River, likely carrying contaminants to the lower floodplain. In Vietnam, approximately 92% of the urban wastewater collection is conducted via combined sewerage and drainage systems, collecting stormwater and wastewater via pipeline networks. Like many cities in Vietnam, Hue city does not have a WWTP; instead, wastewater from homesteads is mainly pretreated in household septic tanks combined with the toilet effluent before being discharged into sewer systems and then into water bodies [18]. The contaminated water is withdrawn for irrigation through irrigation canals that connect directly to the water bodies, specifically the Perfume River in Hue city, which receives the most sewer drainage.
Understanding the impacts of different extreme water-related weather events on waterborne diseases is an essential step toward mitigating the associated risks [15]. Therefore, assessing the level and extent of contamination under changing weather conditions is crucial. The monitoring of indicator organisms is a common approach used to quantify pathogen contamination loads. However, with microbial source tracking, it is also possible to trace the spread and assess the extent of contamination [19]. E. coli is a ubiquitous commensal in the human gastrointestinal tract [20]. Usually, the commensal E. coli and its host can co-exist mutually benefiting one another; however, several highly adapted E. coli clones have acquired specific virulence traits that allow them to adapt to new niches and cause a broad spectrum of disease in their hosts [21,22]. Opportunistic pathogenic E. coli can cause a range of diseases based on the strains, which are classified into pathotypes [21,22,23]. All pathotypes have an enormous potential to cause diseases, including diarrheal, which is a serious public health concern because of its morbidity and mortality in children and global outbreaks [23]. The major pathotypes are: (i) extra-intestinal pathogenic E. coli (ExPEC), which is associated with neonatal meningitis (NMEC), and urinary tract infections caused by uropathogenic E. coli (UPEC), and also includes the bird and avian pathogenic E. coli (APEC); (ii) diarrhea and intestinal pathogenic E. coli (InPEC), which is associated with diarrheal diseases and is sub-divided into enteropathogenic E. coli (EPEC), enterohemorrhagic E.coli [EHEC] (e.g., Shiga toxin-producing E. coli (STEC)), Shigella/enteroinvasive E. coli (EIEC), enteroaggregative E. coli (EAEC), diffusely adherent E. coli (DAEC), enterotoxigenic E. coli (ETEC), and adherent invasive E. coli (AIEC) [21,22,23].
Contamination with fecal bacterial and protozoan parasites has been reported in vegetables on sale in Hue City [24,25]. All vegetable samples examined by Ho et al. [25] were highly contaminated with aerobic bacteria and E. coli, ranging from 6.84–8.40 log CFU/g and 5.47–6.88 log CFU/g, respectively [25]. High foodborne illness and food poisoning occurrences in Vietnam have raised concerns about food safety, especially in the vegetable sector [26]. Most recently, Salmonella with antibiotic resistance traits was isolated from vegetables on retail in a neighboring city [27]. Unfortunately, the sources, levels, and spread of pathogens in Hue City, Vietnam, have never been explored, yet this area experiences several floods every year. The partially treated wastewater from urban discharge and frequent flooding leads to fecal bacterial contamination in the urban area and the outskirts including agricultural fields. Agricultural areas are at a high risk of contamination from floods and irrigation water drawn from the Perfume River. The aim of this study was to trace and identify the source of microbial contamination and examine the impact of flooding on microbial spreading to peri-urban agricultural farms. We investigated bacterial contamination in agricultural fields located on the outskirts of Hue City using E. coli as the indicator organisms to determine the level of contamination during the dry and wet seasons. We further applied multilocus sequence typing (MLST) to examine the links between the contaminated agricultural sites, samples, and urban drainage—the suspected contaminant source. Our findings are expected to provide insights into the contamination of peri-urban farmlands, which serve as vital sources of food and economic development and are also key in foodborne disease outbreaks in the region.

2. Materials and Methods

2.1. Sampling

This study was conducted from May of 2018 to April of 2019. A total of 331 samples, consisting of 2 municipal wastewater (MWW), 121 irrigation water (IRW), 68 vegetables (VEG), 142 soil (SOL), and 2 manure (MNR) samples, were collected from Thien Hue province in central Vietnam for E. coli enumeration during monthly campaigns. The samples were grouped into two seasons—dry and wet—and the designated months were used as seasonal representatives (i.e., June and July for the dry season and November and December for the wet season) for source tracking. During the sampling period, total precipitation in the study area was 2304.8 mm with the highest amount received in December (745.1 mm) [28]. The onset of flooding usually occurs with heavy rainfall (>700 mm); however, the cumulative precipitation together with other factors such as the duration will induce downstream flooding. The total amount of rainfall received during the wet season was 6.5 times higher than in the dry season. Municipal wastewater samples were taken from a wastewater drainage pipe in the Toa Kham (TK) area of Hue City, while IRW, SOL, VEG, and MNR samples were collected from agricultural areas in three communes—Huong Chu (HC), Phu Mau (PM), and Quang Thanh (QT)—surrounding the city (Figure 1).
The farms were selected based on: (1) the location, i.e., in the upstream not influenced by MWW (HC), downstream with MWW influence close and far away from the city (PM and QT, respectively), (2) source of IRW, (3) farmer’s permission, and (4) the type of vegetables grown. We selected lettuce, which is the most grown vegetable in Hue province, for our study. Lettuce is grown all year round except during low temperatures (<15 °C) and heavy floods. Mature leaves which were ready for harvest at the time of sampling were picked from the plant by hand (during the growing season) and stored in polyethylene bags before transporting to the laboratory on ice. Soil samples (0–10 cm) were collected using a sterile scope from three sampling points in one lettuce row and thoroughly mixed to make a composite for analysis. After sampling, all samples were transported to the laboratory on ice in a cooler box and microbial analysis was started immediately i.e., within 6 h of sample collection.
In each commune, five SOL and VEG sampling sites were selected, including one upstream of the IRW inlet, which was designated as a control for SOL samples. Meanwhile, IRW sites were three, four, and one from PM, QT, and HC, respectively, based on the VEG samples and the supply canal. Manure was only collected from two sites at PM and QT since it was not applied in HC. During the growing season, farmers sometimes use manure that is either commercially composted or prepared locally by mixing chicken and pig muck, cow dung, rice straw, and husks. The mixture is then piled and covered with canvas and left to compost for about 3–4 months without probiotics. If probiotics, mainly Trichoderma or Bacillus sp, are used, the total composting time reduces to 45 days.

2.2. Counting and Isolation of E. coli

E. coli was isolated on a Chromocult® Coliform Agar medium (Merck & Co., Inc., Darmstadt, Germany). One mL of MWW and IRW samples were separately taken and diluted with 9 mL sterile saline (0.85% NaCl, total volume: 10 mL) to obtained dilution up to 10−2. Next, 100 μL of MWW and IRW samples (original, 10−1, and 10−2 diluted) were poured directly onto the surface of the medium. For solids (SOL and MNR) and VEG samples, 1 and 20 g were rinsed with 9 and 100 mL of sterile saline, respectively [29]. 100 μL of the rinsed mixtures were then poured and spread on the aforementioned media. The inoculated media were incubated at 37 ºC for 24 h, and the blue colonies suspected to be E. coli were counted and isolated for further testing. The number of E. coli for each of the samples was determined from the mean colony forming units (CFU) on three replicate Chromocult® Coliform Agar media. E. coli for seasonal representative months (June and July for the dry season and November and December for wet season) were processed for further analysis

2.3. Identification of E. coli Isolates

Suspected E. coli isolates were confirmed by detecting the uidA gene via polymerase chain reaction (PCR) [30]. The DNA of suspected isolates was extracted using the InstaGene Matrix (Bio-Rad Laboratories, Inc., Hercules, CA, USA) and used as the DNA template. Polymerase chain reaction analyses were conducted using the KAPA Taq Extra PCR Kit (KAPA Biosystems, Inc., Boston, MA, USA) and a primer set consisting of the forward primer uidA-F (5′TGGTAATTACCGACGAAAACGGC3′) and reverse primer uidA-R (5′ACGCGTGGTTACAGTCTTGCG3′). The PCR conditions were as follows: three minutes at 95 °C for initial denaturation, 35 cycles of 30 s each at 95 °C for denaturation, 30 s at 58 °C, and one minute at 72 °C for elongation, followed by ten minutes at 72 °C for final elongation. The presence of a 162-base pair (bp) band was confirmed via gel electrophoresis of the PCR products, indicating the presence of the uidA gene.

2.4. Multilocus Sequence Typing

As a genetic-based tracing method, multilocus sequence typing (MLST) analyses using the Achtman scheme were employed to the confirmed E. coli isolates [31]. MLST identifies the internal nucleotide sequences of multiple locus-encoding housekeeping genes, or fragments of them, where unique sequences are assigned a random integer number and a unique combination of alleles at each locus (or “allelic profile”), specifying the sequence type (ST) [32,33]. Whole-genome sequencing has higher discrimination power for comparing allelic profiles; however, MLST can attain similar levels of discrimination with fewer loci using just seven housekeeping genes [32]. Furthermore, MLST can identify and track the global spread of pathogens [34] and is, therefore, beneficial and recommended for assessing microbial contamination.
Seven E. coli housekeeping genes (adk, fumC, gyrB, icd, mdh, purA, and recA) were individually amplified by PCR using the KAPA Taq Extra PCR Kit. The PCR conditions were set as two minutes at 95 °C for initial denaturation, 30 cycles of one minute at 95 °C for denaturation, two minutes at an annealing temperature for each primer set, as shown in Table 1, two minutes at 72 °C for elongation, and five minutes at 72 °C for final elongation. Overall, we used MLST standard protocols [31], including the primers for the housekeeping genes, which were adopted with modifications at the annealing temperatures for some primers to minimize the primer–dimer and the undesired non-target amplification.
The PCR products were analyzed with 2% agarose gel electrophoresis, followed by purification using ExoSAP-IT™ PCR Product Cleanup (Applied Biosystems, Foster City, CA, USA). Sequencing was performed at FASMAC Co., Ltd. (Atsugi, Kanagawa, Japan) using ABI Genetic Analyzer 3130XL or ABI DNA Analyzer 3730xL (Applied Biosystems, Foster City, Japan) and BigDye Terminator v3.1 Cycle Sequencing Kits (Applied Biosystems). Primers shown in Table 1 were used for sequencing, and the sequences of each housekeeping gene were read from both ends. Sequence chromatographs were edited with a SequencherTM software, ver. 5.4.6 (Gene Code Corporation, Ann Arbor, MI, USA). The data of each of the housekeeping genes sequenced from both ends were assembled. The consensus sequence of housekeeping genes, with specific lengths for each allele, were plotted into the MLST database at Enterobase to identify each allele [35]. The sequence type (ST) and ST complex (STc) of each E. coli isolate were determined from the combination of the seven allelic identities. The Enterobase database was further checked for the phylogroup of all isolates.

2.5. GrapeTree Analysis

Seven allelic profiles of each isolate obtained from Enterobase were also used in the GrapeTree analysis to visualize the relationship among STs of each isolate in dry and wet seasons. These allelic profiles together with their metadata, which include information of STs and the sample type of isolates, were analyzed using GrapeTree software with the novel minimum spanning tree (MSTreeV2) method to construct the GrapeTree [36].

2.6. Phylogenetic and Diversity Analysis

Phylogenetic and nucleotide diversity using the seven alleles combined for MLST (adkfumCgyrBicdmdhpurArecA) were performed to determine the relatedness of each E. coli strain using MEGA X software [37]. Phylogenetic trees were constructed via neighbor-joining using the Kimura-2 parameter algorithm, while the bootstrap method with 500 replications was used for nucleotide diversity. The resulting clusters were identified and the pathogenicity of isolates forming the clusters was then identified from the Enterobase if available. These analyses were applied to the isolates of E. coli collected during the dry and wet seasons separately to compare the spread of each E. coli strain in the study area between the two seasons.

2.7. Data Analysis

Wilcoxon signed-rank tests were performed to identify any significant differences in the E. coli concentrations of VEG, SOL, and IRW samples between the dry and wet seasons. Statistical analyses were conducted using R v. 3.6.3 [38] at an α-level of p ≤ 0.05. The results were compared to the Vietnamese standards [39,40] and to the United States Food and Drug Administration regulations [41] to evaluate the level of contamination in IRW, VEG, SOL, and MNR samples.

3. Results

3.1. Concentration of E. coli

The highest concentration of E. coli was noted in the MWW sample from TK at 39,500 CFU/mL or 4.6 log10 CFU/mL and 1344 CFU/mL or 3.1 log10 CFU/mL during the dry and wet season, respectively (Table S1). The MNR representative samples collected from the compositing area during the wet season from PM and QT had E. coli counts of 1585 CFU/g or 3.2 log10 CFU/g and 13 CFU/g or 1.1 log10 CFU/g, respectively (Table S1).
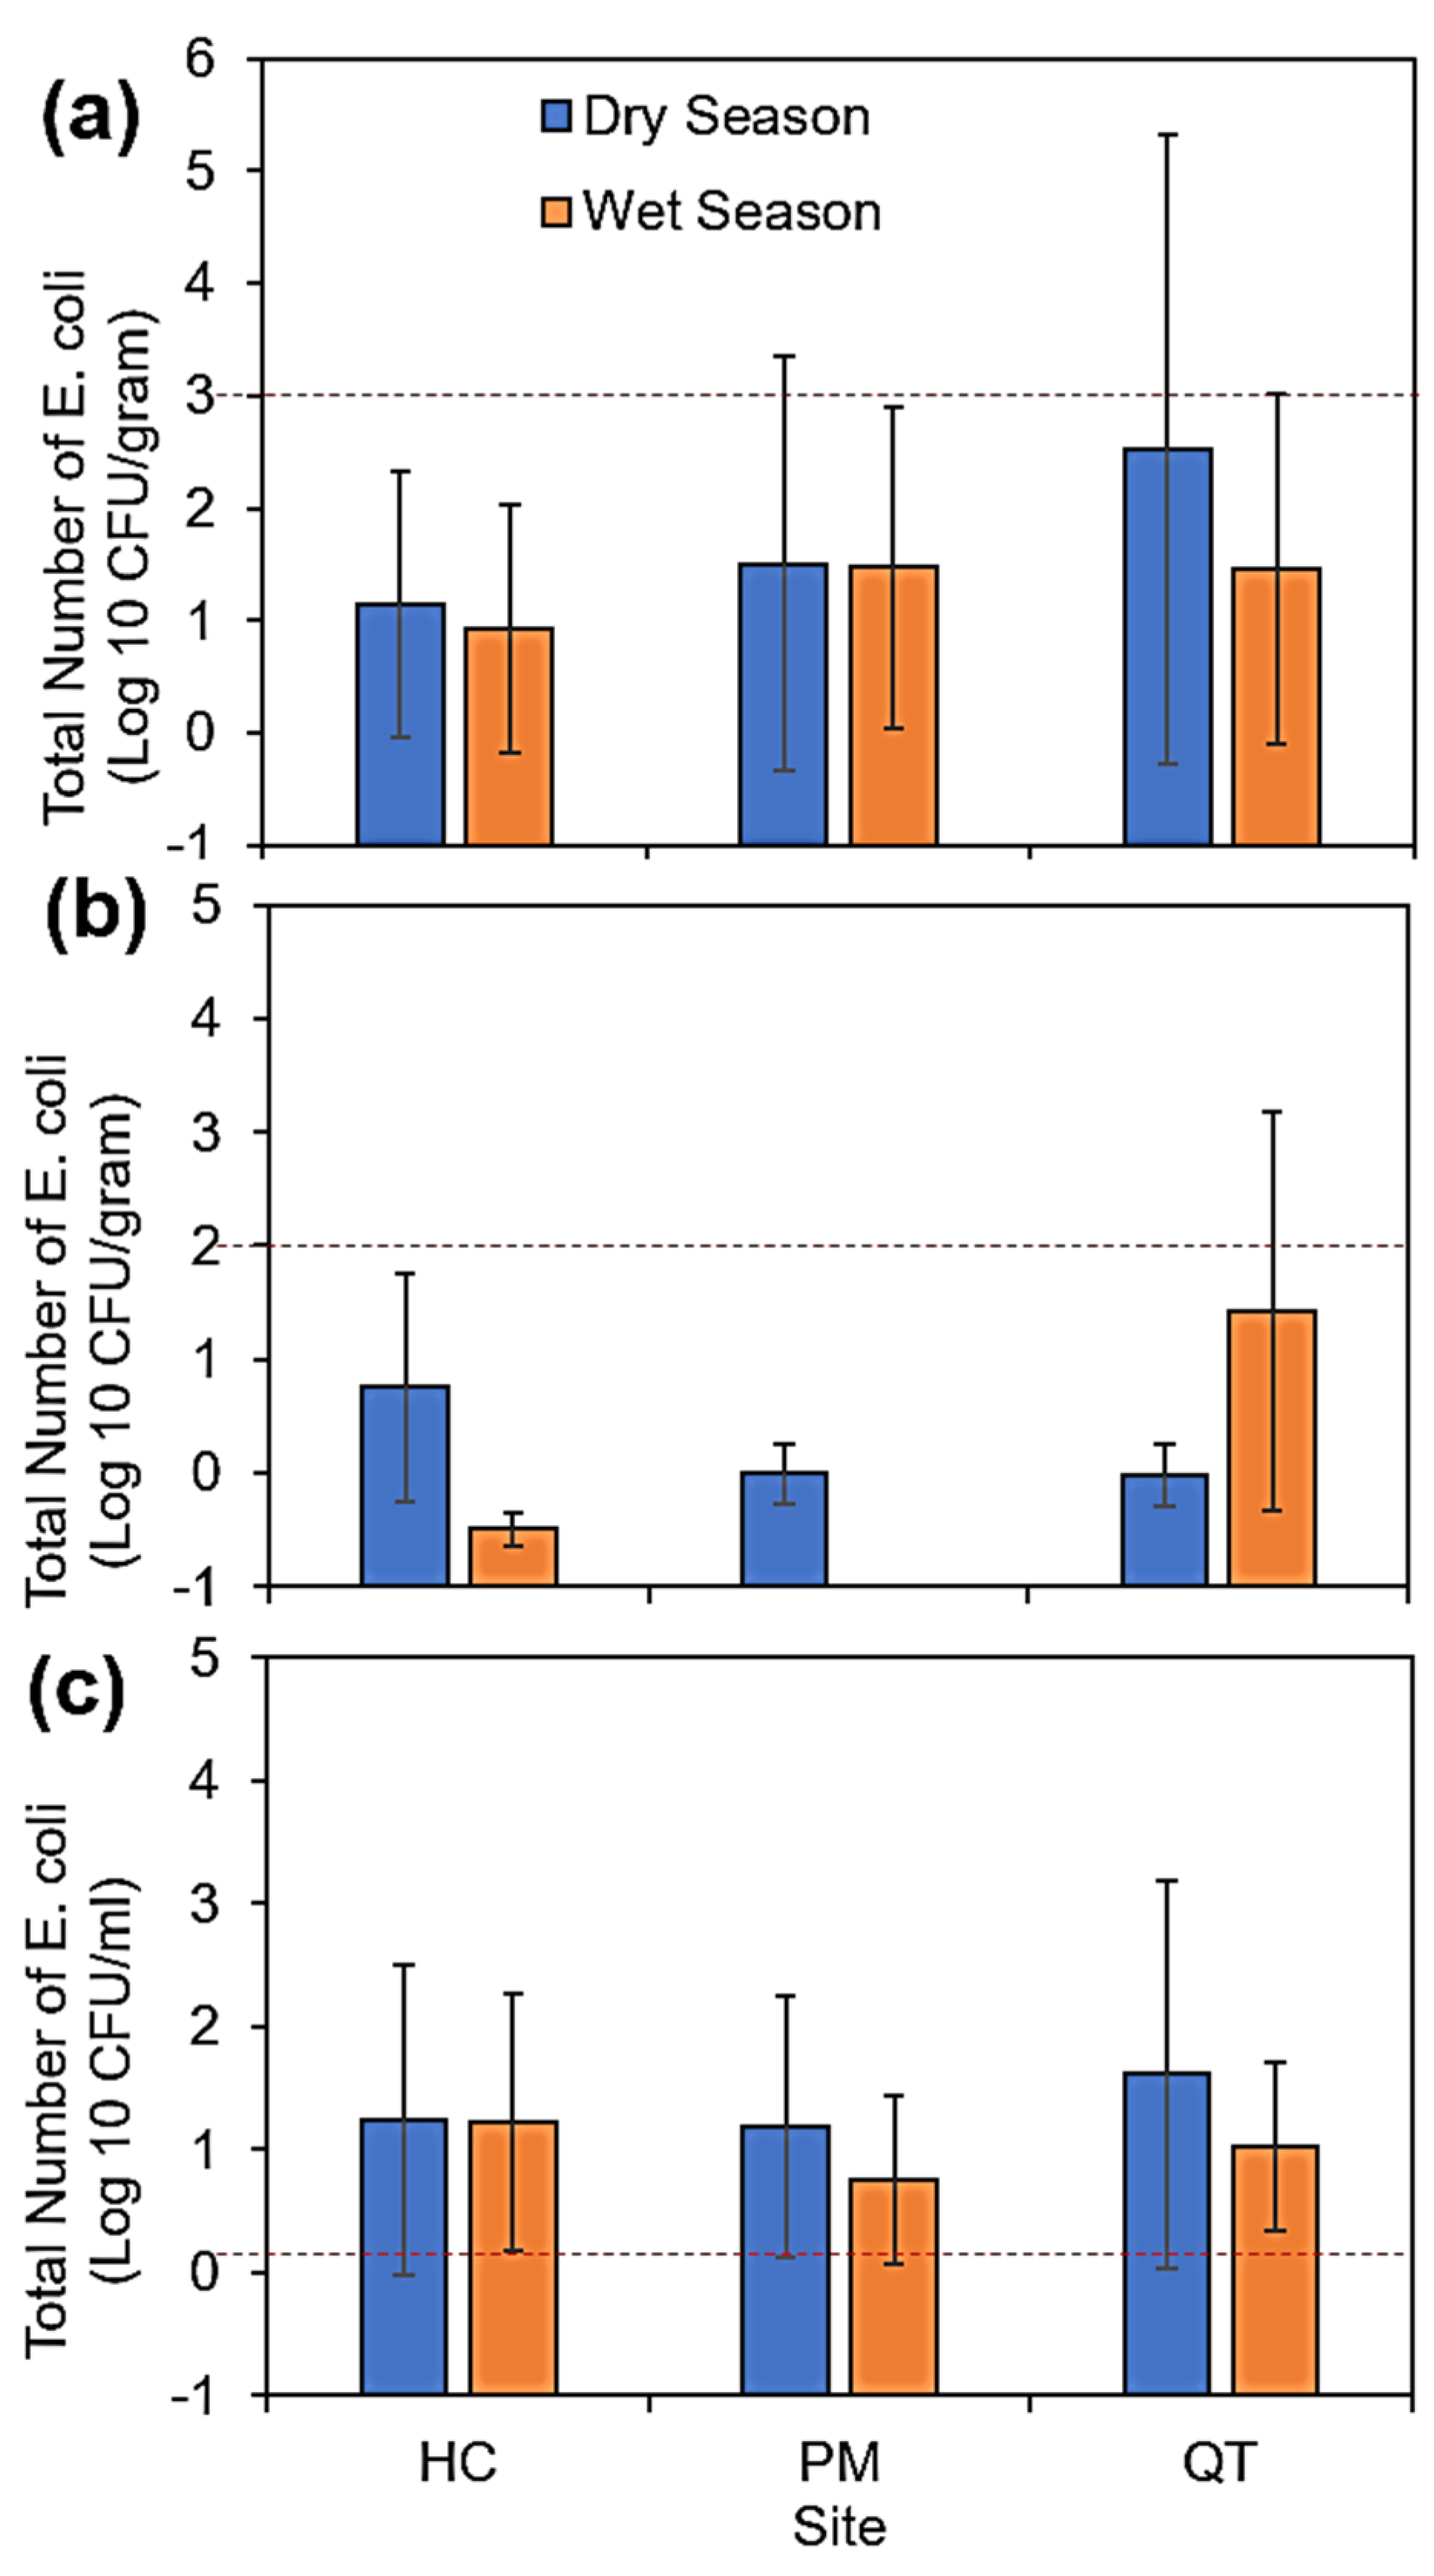
As shown in Figure 2, higher concentrations of E. coli were found in SOL and IRW samples during the dry season. The counts showed extreme monthly fluctuations, especially in VEG samples, as indicated by the high standard deviation. The seasonally averaged bacterial counts for VEG, SOL, and IRW samples are shown in Figure 2. In the dry season, high E. coli were recorded for both SOL and IRW samples at all sites and for VEG samples at the HC and PM sites (Figure S1). The IRW was highly contaminated, with the highest frequency of detection among all samples; 97.2% (n = 35/36) E. coli positive samples, of which 94.3% (n = 33/35) had concentrations exceeding 2.0 CFU/mL—the maximum permissible limit under Vietnamese [39]. A small proportion of VEG samples (22%, 8/36) were positive for E. coli, but the level was within the acceptable limit of 2 log10 CFU/g according to national regulations for inspecting vegetables on the market [40]. However, the E. coli counts in VEG from QT were higher during the wet season than those from HC and PM. Among SOL samples, 69.4% (n = 25/36) were positive for E. coli, and only one sample had a concentration exceeding the US−FDA stipulated standard of 1000 MPN (3 log10 CFU/g [41]. It should be noted that this soil standard (US−FDA) [41] is based on the most probable number method rather than the total plate count method, with the colony-forming unit used in this study. Despite the detection frequency, no significant differences were observed among samples or the two seasons (Figure 2). Moreover, seasonal peak month observations (December (wet) and June (dry)) also did not reveal any significant differences.

3.2. E. coli Isolates

A total of 177 isolates collected from four sampling locations were confirmed as E. coli. Ninety isolates (50.9%) were collected during the dry season, and 87 (49.1%) were collected during the wet season (Table 2).

3.3. Sequence Type Identities of E. coli Isolates

Multilocus sequence typing identified a total of 138 unique STs from the 177 confirmed E. coli isolates (Figure 3); 75.1% were singletons, while the remaining 24.9% were associated with STcs (Table S2). The STs were highly diverse with only 5.1% (7/138) of the unique STs shared between the two seasons.
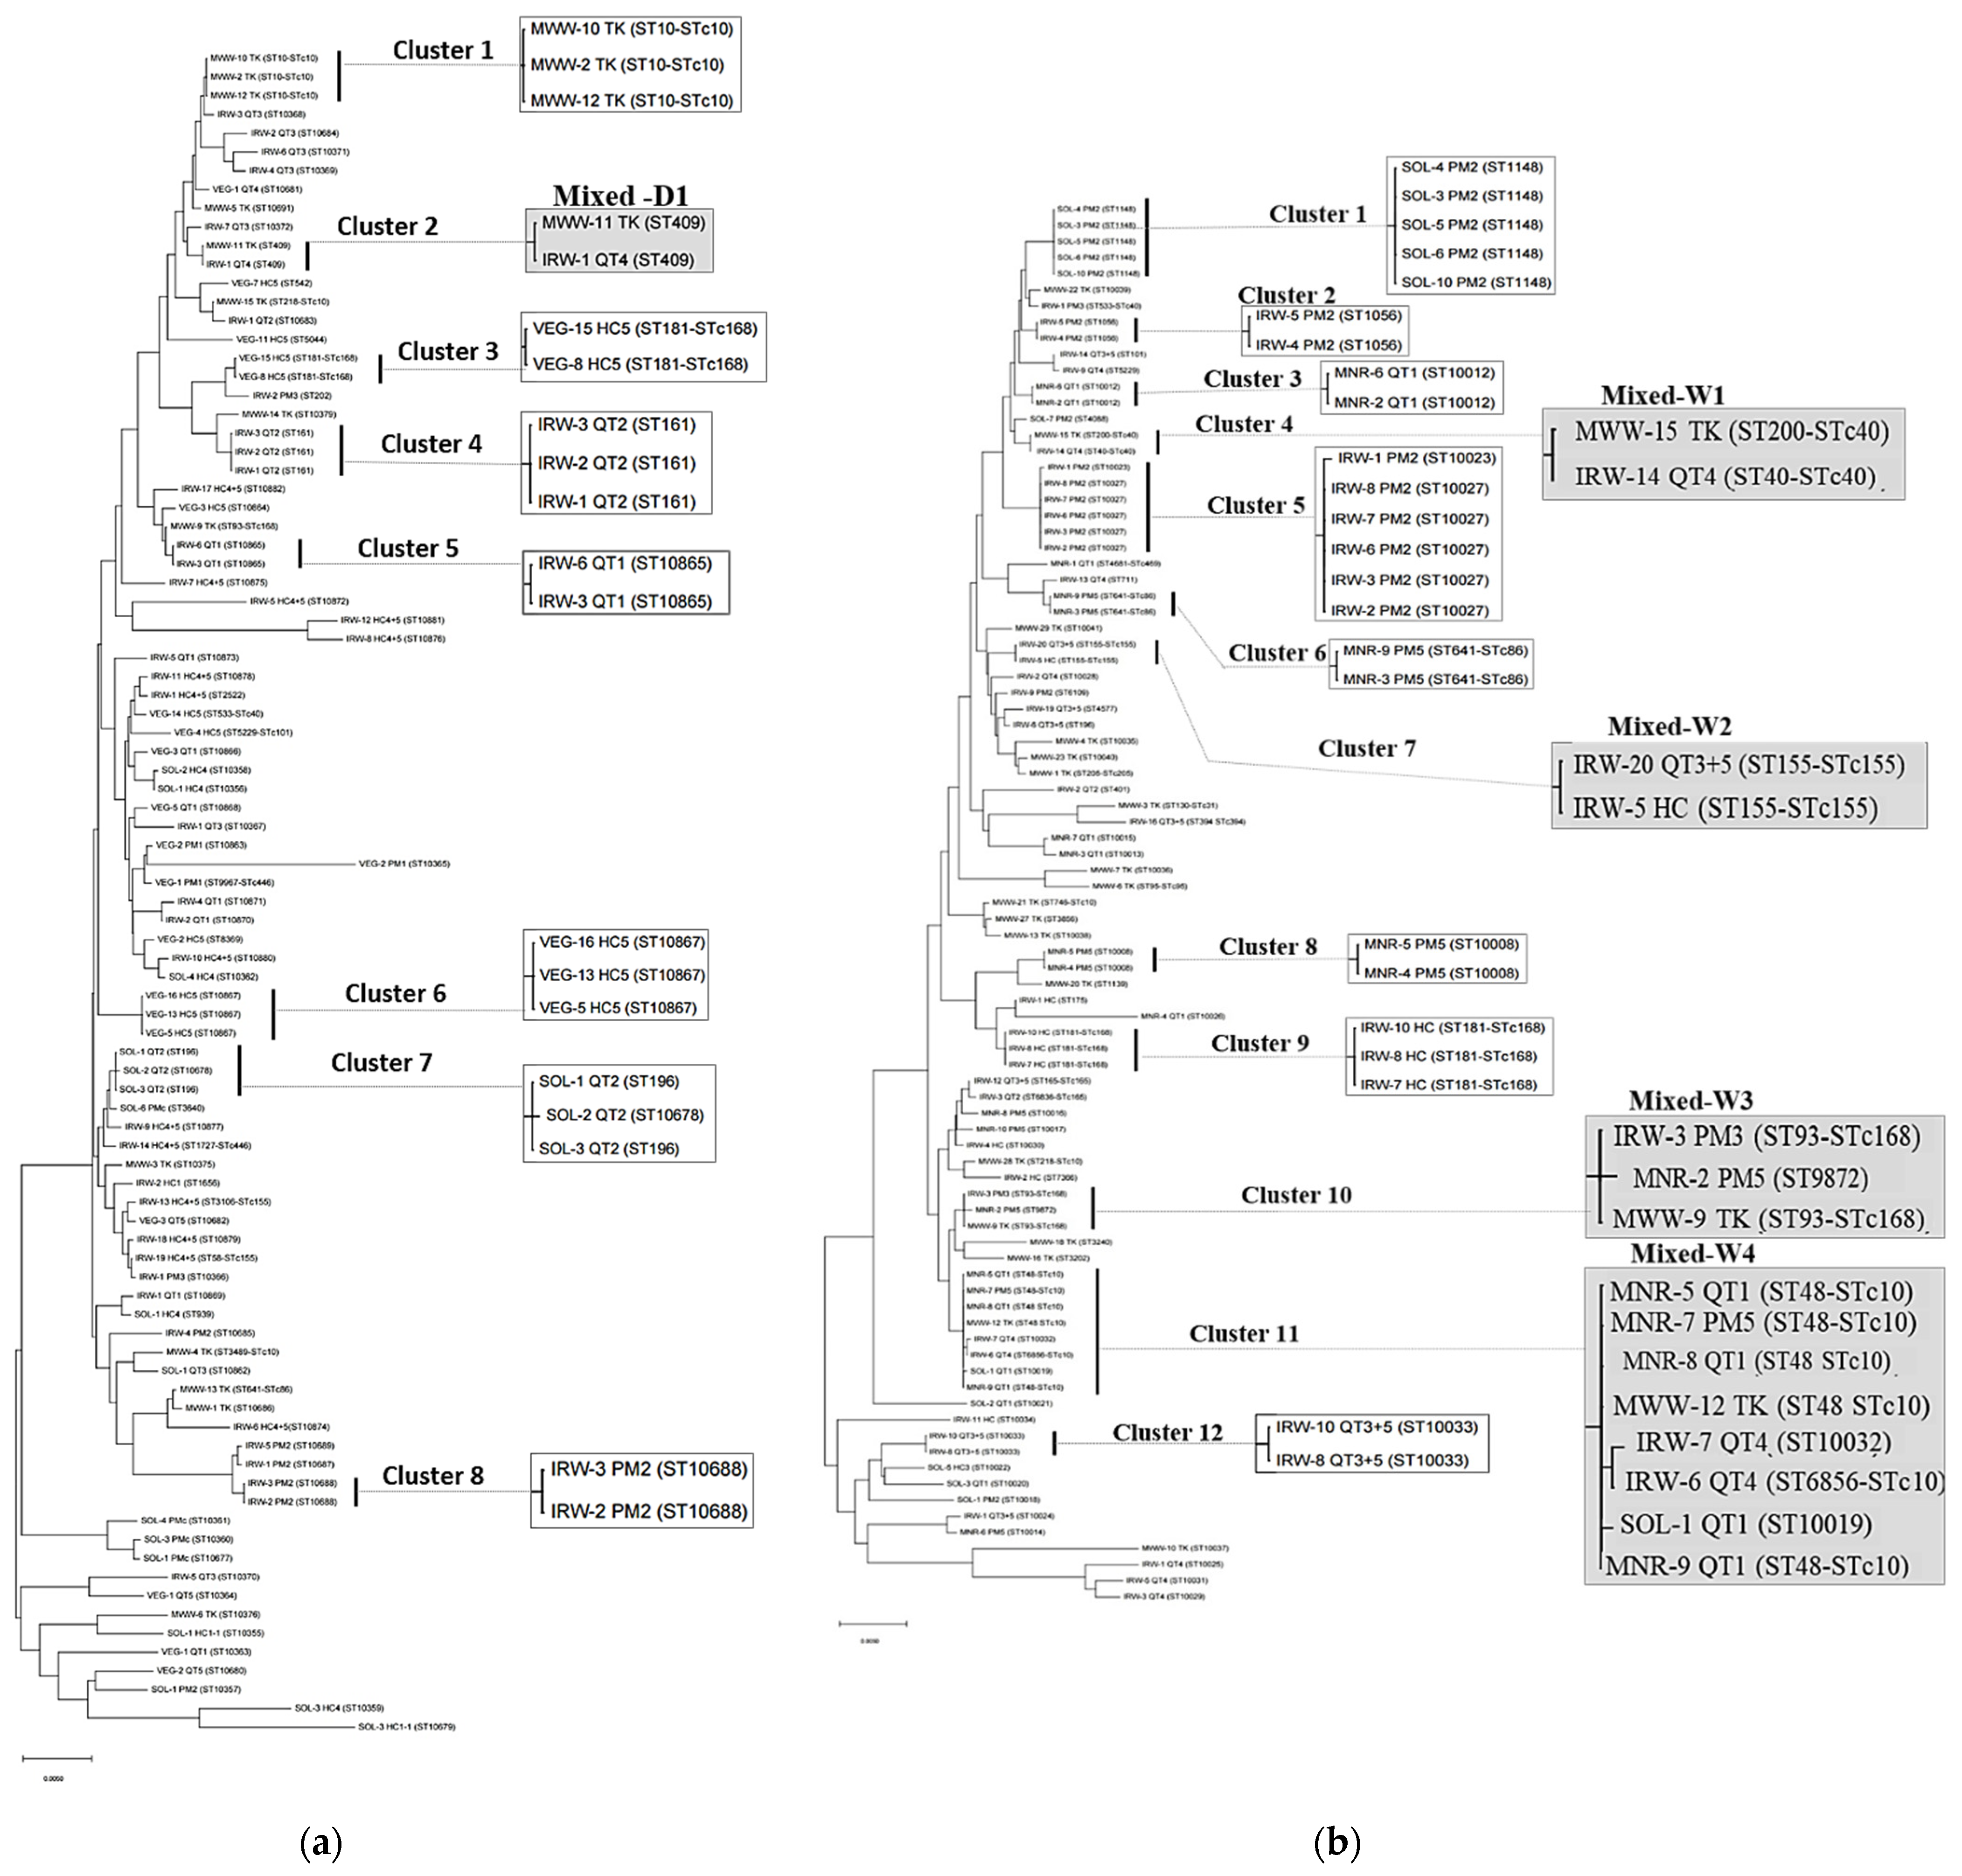
In the dry season, the 90 confirmed E. coli isolates comprised seventy-nine STs, of which eight (ST10, ST161, ST10867, ST181, ST196, ST409, ST10865, and ST10688) were shared among two or more isolates (Figure 3a, Table S2). The predominant STs were ST10, ST161, and ST10867, which were found in three isolates from MWW, IRW, and VEG samples, respectively. Notably, all STs, except for ST409, which was present in both MWW (TK) and IRW (QT), were localized to a single sample type in a specific commune (i.e., ST181 was detected twice in VEG from HC, ST196 was identified in two SOL isolates from QT, and ST10865 and ST10688 strains were exclusive to IRW isolates from QT and PM, respectively).
Only 66 STs were identified from the wet season isolates (Table S2), 11 of which were shared among 32 isolates, and 43.9% of these STs had a corresponding STc dominated by STc 10. The most common STs among the isolates, ST48, ST1148, and ST10027, were detected in IRW at PM (ST10027), SOL (ST1148) from PM, MNR (ST48) from PM and QT, and in MWW. Similar to ST48, ST93 was also found in two isolates (IRW from PM and MWW), while ST155 was identified in the IRW of two communes, HC and QT. The most widespread isolates (ST48–STc10) were identified in MWW from TK, two IRW samples and MNR from QT, and IRW from PM. All isolates with shared STs included MWW isolates, indicating the transport of E. coli via wastewater. These isolates included: ST93 (MWW and IRW), ST181–STc 181 (two VEG samples in the dry season and three IRW samples from HC), ST53–STc 40 (VEG samples in the dry season from HC and IRW in the wet season from PM), ST641–STc 86 (MWW in the dry season and two MNR samples in the wet season), and ST5229–STc 101 (VEG samples from HC and IRW from QT during the wet season).

3.4. Relatedness of E. coli Isolates

The results of the phylogenetic analyses are shown in Figure 4. The phylogenetic tree for the dry season showed eight clusters with only one mixed (cluster D1, Figure 4a) composed of MWW (TK) and IRW (QT) isolates. In contrast, twelve clusters with four mixed clusters were identified in the wet season (W1–W4, Figure 4b). The first mixed cluster (W1) consisted of isolates from MWW from TK and IRW from QT. Mixed cluster W2 was composed of two isolates from IRW collected from two different communes (HC and QT). The third mixed cluster (W3) had three isolates from MWW samples (TK), IRW and MNR samples from the PM sites, while the fourth and largest mixed cluster (W4) included IRW, SOL, and MNR isolates from two communes (QT and PM) and MWW from TK. The three mixed clusters (W1, W3, and W4) encompassed MWW isolates from TK, which was the suspected source of the E. coli strains in the studied farms. The only mixed cluster in the dry season (D1) showed resemblance to the wet season cluster (W2), which was also comprised two isolates from MWW at TK and IRW at QT (Figure 4). The results from nucleotide diversity did not show clear differences between the seasons (data not shown).
From the previous studies, only 42.9% (76/177) of the isolates in our study were classified as phylogroup from the Enterobase. The isolates were mainly classified into phylogroup A, comprising 37 isolates and B with 38 B1 isolates and one B2 (Table 3 and Table S2). The pathotypes indicated some STs associated with various disease outbreaks, and the predominant pathotypes were EAEC, UPEC, ExPEC, and APEC (Table 3). Although the available information in the database was not enough to make comprehensive comparisons, MWW had diverse E. coli from A, B1, B2, and E dominated with phylogroup A, while both A and B were equally abundant (IRW Table 3).

4. Discussion

The levels and seasonal variations in E. coli concentrations observed in this study reflect the source and extent of the contamination. The high loads above permissible limits in IRW result from the direct connection to the Perfume River, which receives partially treated MWW discharged from the city. The low traces of vegetable contamination, less than previously reported by Ho et al. [25], may be attributed to the sampling time and technique as well as the amount of precipitation. During sampling, only mature leaves were picked from the plant during the farming period, which varies from most of the previous studies that examined already harvested produce. The scale of contamination in any flood depends on several factors, including the extent and severity of flooding, sediment load in the floodwater, and other characteristics specific to the storm, waterway, soil, and farm management practices [14]. The heavy precipitation from monsoon rainfall comes with surface run-off and always triggers floods in and around Hue city. The highly contaminated urban drainage mixes with stormwater and run-off as the water level increases; the contaminants in river water and IRW are then dispersed into the agricultural farms. In addition, the harvested vegetables are always washed and sprayed with water from the closest available source (usually canal or river) to stay fresh for sale in the local markets [24]. This practice will transfer the contaminants from the water to the vegetables contributing to the high level of E. coli as observed in the previous study by Ho et al. [25].
The lower abundance of E. coli during the wet season in most samples was due to dilution by precipitation and floodwater since rainfall increases stormwater while flushing accumulated pathogens into surface waters or dispersing them to the surrounding environment through run-off [10]. Contamination related to urban drainage will therefore be widespread during the wet season regardless of the low E. coli concentrations. Although E. coli are enteric bacteria, some strains can survive and even regrow (multiply) outside of an animal host in secondary environments [10,42,43]. The status of the Perfume River and the IRW canals characterized by high nutrients loads from agricultural run-off and fish culturing activities downstream presents a conducive environment for E. coli growth and multiplication
We suspected partially treated wastewater from urban drainage as the source of fecal contamination. However, the high amount of E. coli in both MWW and MNR samples indicated that both sources could be the source of farm contamination. The high loads noted in VEG samples from HC and QT, regardless of the correspondingly low E. coli counts in SOL samples, along with the high detection frequency in IRW, points to MWW as the major source for E. coli dispersion, as these two sites had no or very low loads in their MNR samples. In addition, MNR samples were obtained from the composting site, which may not reflect the exact composition at the time of the application. At the time of manure application, E. coli levels are expected to have drastically decreased, as noted from the differences in the two MNR samples. The high variation in E. coli concentrations observed between the downstream area (PM), which directly connects to the IRW through the Perfume River and is closer to the city and the upstream site (HC), reinforced our assumption of MWW as the main source of contamination. In this study, site location, as well as the E. coli loads in soil, highlighted the relevance of urban drainage and flooding. We noted differences between SOL and VEG contamination levels among the sites, specifically high loads at QT during the wet season. The location and soil ecosystem are important since the soil ecosystems are shaped by several factors, such as the nature, acidity, and alkalinity of the soil, and water levels which influence the occurrence and dissemination of microbes/pathogens [44]. Areas downstream are prone to microbial contamination from temporal rainfall even when IRW is not used during the wet season. The long rainy season and extreme rainfall associated with the monsoon usually results in flooding. During low rainfall intensity and at the beginning of the wet season, excess water is easily removed via conventional drainage networks, but these get challenged when extreme rainfall events increase [45]. The overwhelmed drainage system, which links to the farms via irrigation canals and the Perfume River, overflows spreading the contaminants, hence the high loads in SOL at QT.
The ST identities of each E. coli strain in samples from both seasons revealed that the genetic diversity varied seasonally, with only a few STs being common between the seasons. The E. coli based on STs were more widespread in the wet season than in the dry season. The heavy rainfall received in Thua Thien Hue (November–December of 2018) resulted in the spread of E. coli discharged from wastewater. From the shared STs, it can be inferred that E. coli spread across the three communes to MNR, IRW, and SOL, as revealed by the wet season isolate clusters. Three mixed clusters containing MWW isolates from TK among MNR, IRW, and SOL isolates revealed their relatedness to MWW, which is believed to be the primary source of microbial contamination to the Perfume River. One cluster in the wet season (W2) showed similarities with mixed cluster D1, as opposed to the other three clusters (W1, W3, and W4), and clusters W1, W3, and W4 likely resulted from intensified rainfall carrying contaminants in floodwaters downstream to the QT and PM communes. One key route for spreading bacteria besides flooding is IRW [46], and in this study, IRW had both high E. coli loads and diverse isolates. The high contamination of IRW was attributed to the canals that directly connect to the contamination source (i.e., MWW), thereby transmitting waterborne pathogens to crops in the field. Weller et al. [47] suggested that IRW is a point source for Listeria contamination in spinach farms and that rain increases its prevalence through non-point source mechanisms. Although the application of MNR may be another source, some isolates in the mixed clusters were collected from sites without MNR. Moreover, the location (direction and elevation) of both PM and QT from MWW hinders backflow toward the city; hence, the relatedness and shared clustering with MWW confirms that the drainage of MWW is the source of E. coli contamination in this study.
The direction and spread of E. coli from the Perfume River were inclined toward QT since more isolates were recovered from this site, yet PM is closer to the city. We expected PM to have a higher level of contamination than QT due to its proximity; however, the results showed the opposite. The most probable route of exposure to E. coli is through irrigation canals, which connect directly to the Perfume River in QT, while in PM, the IRW is withdrawn from a secondary canal. Most STs in IRW samples showed relatedness to MWW isolates from TK, confirming the Perfume River as the route of E. coli dissemination.
The genetic diversity of E. coli in the environment fluctuates due to various seasonal and annual environmental factors, and the occurrence and population structure of this species vary seasonally [48]. Shifts in the diversity of E. coli by season were also noted from the 5.1% of the total STs shared between the wet and dry seasons. A wide range of E. coli strains were detected in this study, with STs that have not been identified elsewhere (Table S2). Some of these strains may be of direct concern to human health, while others may be free-living [20]. Although this study focused on the dispersion of E. coli as an indicator of fecal bacteria, neither tested pathogenicity nor antimicrobial resistance, some STs and their associated STcs, which were identified here, have been classified as pathogenic and have been found to harbor antibiotic resistance (e.g., ST 48 and STc 10 and 23) [49] while others are potential carriers (e.g., STc 10, 40, and 155) or disease-causing agents (ST 93 and STc 31) [50,51]. EAEC, UPEC, ExPEC, STEC, and APEC pathologies were associated with our results; moreover, STc 95, a classical ExPEC, is known for over half of NMEC and a predominant APEC causing ST was also found in this study [22]. The dominant phylogroups A and B1 have been implicated in a number of pathotypes; however, there is no clear-cut grouping of certain phylogroups with certain pathotypes [22,23]. Furthermore, the largest mixed cluster in the wet season (MNR, MWW, and IRW isolates) had six isolates with the ST10 complex and was closely related to ST10019 and ST10032 (cluster W4, Figure 2b). Strains with STc 10 were the most detected and widespread, with eight isolates from MWW, five from MNR, and one identified in IRW. The highest rates of mutation and recombination were found in STc 10 [50], which may explain the results of cluster W4. Moreover, STc 10 has also been associated with diarrhea in children ten months and older in Nigeria [52]. However, it should be noted that the association of STs with either disease or antibiotic resistance may vary regionally, as observed by Nadimpalli et al. [53].
Floods directly change the transport of contaminants, can affect existing water and sanitation infrastructure [2,7,15] and may extend into agricultural areas [54,55]. The evidence of infection risk following flood events was well documented by Paterson et al. [16]. The effects of floods may appear weeks to months after a flood event, depending on the routes of transmission and exposure. In this study, E. coli was isolated from vegetables grown in peri-urban farms during the dry season, indicating that there is a risk of contamination weeks after the flooding. From the results, irrigation canals are significant routes for E. coli dispersion through the direct link to the highly contaminated river which receives urban drainage. The STs in IRW were closely related to those in MWW isolates, indicating wastewater and urban drainage as the source of E. coli.

5. Conclusions

Although rainfall events reduce pathogen concentrations through dilution, the heightened spread of microbial contaminants during the wet season of the East Asian Monsoon presents great public health risks due to infections caused by the pathogens carried in the stormwater and run-off. In this study, variations in E. coli concentrations between the dry and wet seasons were negligible. Despite the low concentrations resulting from dilution, E. coli strains with links to MWW were more widespread during the wet season. Moreover, IRW from the Perfume River was highly contaminated with E. coli, and evidence of contaminant transfer was also found at low levels in VEG samples. Although our results are based on sampling for only two months per season and two rainfall events, we were able to demonstrate the enhanced spread of E. coli—an indicator of fecal contamination—from Hue City to surrounding agricultural areas during the wet season. This enhanced dispersion signifies a substantial bacterial spread that poses a risk to farmers and farm contamination. These findings may improve our understanding of the impacts of MWW discharge and seasonal flooding on the contamination of peri-urban agricultural areas and highlights the pathogenic strains present in the Perfume River. The high diversity in E. coli with links to MWW calls for measures to treat and monitor urban drainage before discharge to water bodies. Our results are particularly important for the planning and installation of flood prevention and wastewater treatment infrastructure.

Supplementary Materials

The following are available online at https://www.mdpi.com/article/10.3390/ijerph18189580/s1, Figure S1: E.coli loads in soil, vegetable, and irrigation water from all the sites throughout the sampling season. The open circles are for soil control samples plotted on the secondary axis, Table S1: Average number of E. coli in the soil, vegetables, irrigation water, manure and municipal wastewater from Huong Chu (HC), Phu Mau (PM), Quang Thanh (QT), and Toa Kham (TK) communes during a year (May 2018 to April 2019), Table S2: Sequence type (ST) and sequence type complex (ST Complex) identity of E. coli isolates collected during the study and their reported phylogroup.

Author Contributions

Conceptualization, methodology, investigation, formal analysis, writing—original draft, writing—review and editing, W.P.; conceptualization, methodology, investigation, resources, project administration, formal analysis, writing—review and editing, M.N.; methodology, formal analysis, writing—original draft, writing—review and editing, S.P.; conceptualization, investigation, formal analysis, project administration, writing—review and editing, D.V.P.; methodology, investigation, writing—review and editing, H.V.D.; methodology, investigation, writing—review and editing, L.K.P.; methodology, investigation, project administration, writing—review and editing, L.T.T.D.; conceptualization, methodology, resources, writing—review and editing, supervision, T.W. All authors have read and agreed to the published version of the manuscript.

Funding

This work was supported by the Sumitomo Foundation, SEI Group CSR Foundation, JSPS KAKENHI [Grant Number 19H01144], and JSPS Core-to-Core Program.

Data Availability Statement

Data will be shared on request.

Acknowledgments

We are grateful to all the students and staff from the Faculty of Sciences (Hue University, Vietnam) and Faculty of Agriculture, Yamagata University, who contributed to the successful completion of this study. We also would like to thank the anonymous reviewers for helping us improve the manuscript.

Conflicts of Interest

The authors declare that they have no known competing financial interests or personal relationships that could have appeared to influence the work reported in this paper.

References

  1. Talbot, C.J.; Bennett, E.M.; Cassell, K.; Hanes, D.M.; Minor, E.C.; Paerl, H.; Raymond, P.A.; Vargas, R.; Vidon, P.G.; Wollheim, W.; et al. The Impact of Flooding on Aquatic Ecosystem Services. Biogeochemistry 2018, 141, 439–461. [Google Scholar] [CrossRef] [PubMed] [Green Version]
  2. Alexander, K.A.; Heaney, A.K.; Shaman, J. Hydrometeorology and Flood Pulse Dynamics Drive Diarrheal Disease Outbreaks and Increase Vulnerability to Climate Change in Surface-Water-Dependent Populations: A Retrospective Analysis. PLoS Med. 2018, 15, e1002688. [Google Scholar] [CrossRef] [PubMed] [Green Version]
  3. Andrade, L.; O’Dwyer, J.; O’Neill, E.; Hynds, P. Surface Water Flooding, Groundwater Contamination, and Enteric Disease in Developed Countries: A Scoping Review of Connections and Consequences. Environ. Pollut. 2018, 236, 540–549. [Google Scholar] [CrossRef] [PubMed]
  4. Lowe, D.; Ebi, K.; Forsberg, B. Factors Increasing Vulnerability to Health Effects before, during and after Floods. Int. J. Environ. Res. Public Health 2013, 10, 7015–7067. [Google Scholar] [CrossRef]
  5. Okaka, F.O.; Odhiambo, B.D.O. Relationship between Flooding and Out Break of Infectious Diseasesin Kenya: A Review of the Literature. J. Environ. Public Health 2018, 2018, 1–8. [Google Scholar] [CrossRef] [Green Version]
  6. Yu, P.; Zaleski, A.; Li, Q.; He, Y.; Mapili, K.; Pruden, A.; Alvarez, P.J.J.; Stadler, L.B. Elevated Levels of Pathogenic Indicator Bacteria and Antibiotic Resistance Genes after Hurricane Harvey’s Flooding in Houston. Environ. Sci. Technol. Lett. 2018, 5, 481–486. [Google Scholar] [CrossRef]
  7. De Man, H.; van den Berg, H.H.J.L.; Leenen, E.J.T.M.; Schijven, J.F.; Schets, F.M.; van der Vliet, J.C.; van Knapen, F.; de Roda Husman, A.M. Quantitative Assessment of Infection Risk from Exposure to Waterborne Pathogens in Urban Floodwater. Water Res. 2014, 48, 90–99. [Google Scholar] [CrossRef]
  8. Ten Veldhuis, J.A.E.; Clemens, F.H.L.R.; Sterk, G.; Berends, B.R. Microbial Risks Associated with Exposure to Pathogens in Contaminated Urban Flood Water. Water Res. 2010, 44, 2910–2918. [Google Scholar] [CrossRef]
  9. Yard, E.E.; Murphy, M.W.; Schneeberger, C.; Narayanan, J.; Hoo, E.; Freiman, A.; Lewis, L.S.; Hill, V.R. Microbial and Chemical Contamination during and after Flooding in the Ohio River—Kentucky, 2011. J. Environ. Sci. Health Part A 2014, 49, 1236–1243. [Google Scholar] [CrossRef]
  10. Carlton, E.J.; Eisenberg, J.N.S.; Goldstick, J.; Cevallos, W.; Trostle, J.; Levy, K. Heavy Rainfall Events and Diarrhea Incidence: The Role of Social and Environmental Factors. Am. J. Epidemiol. 2014, 179, 344–352. [Google Scholar] [CrossRef] [PubMed] [Green Version]
  11. Hasegawa, K.; Yoshino, H.; Yanagi, U.; Azuma, K.; Osawa, H.; Kagi, N.; Shinohara, N.; Hasegawa, A. Indoor Environmental Problems and Health Status in Water-Damaged Homes Due to Tsunami Disaster in Japan. Build. Environ. 2015, 93, 24–34. [Google Scholar] [CrossRef]
  12. Masciopinto, C.; De Giglio, O.; Scrascia, M.; Fortunato, F.; La Rosa, G.; Suffredini, E.; Pazzani, C.; Prato, R.; Montagna, M.T. Human Health Risk Assessment for the Occurrence of Enteric Viruses in Drinking Water from Wells: Role of Flood Runoff Injections. Sci. Total Environ. 2019, 666, 559–571. [Google Scholar] [CrossRef]
  13. Taylor, J.; Davies, M.; Canales, M.; Lai, K.-M. The Persistence of Flood-Borne Pathogens on Building Surfaces under Drying Conditions. Int. J. Hyg. Environ. Health 2013, 216, 91–99. [Google Scholar] [CrossRef] [PubMed]
  14. Bergholz, P.W.; Strawn, L.K.; Ryan, G.T.; Warchocki, S.; Wiedmann, M. Spatiotemporal Analysis of Microbiological Contamination in New York State Produce Fields Following Extensive Flooding from Hurricane Irene, August 2011. J. Food Prot. 2016, 79, 384–391. [Google Scholar] [CrossRef]
  15. Cann, K.F.; Thomas, D.R.; Salmon, R.L.; Wyn-Jones, A.P.; Kay, D. Extreme Water-Related Weather Events and Waterborne Disease. Epidemiol. Infect. 2013, 141, 671–686. [Google Scholar] [CrossRef] [PubMed]
  16. Paterson, D.L.; Wright, H.; Harris, P.N.A. Health Risks of Flood Disasters. Clin. Infect. Dis. 2018, 67, 1450–1454. [Google Scholar] [CrossRef] [PubMed]
  17. Anh, Tran Nguyen Quynh. ‘Characterization of Domestic Wastewater Discharge and Its Impact on Material Flows in Urban Hue, Vietnam’, 191. 2016. Available online: https://repository.kulib.kyoto-u.ac.jp/dspace/bitstream/2433/217214/2/dtikk00155.pdf (accessed on 27 May 2021).
  18. Tran, P.; Marincioni, F.; Shaw, R.; Sarti, M.; Van An, L. Flood Risk Management in Central Viet Nam: Challenges and Potentials. Nat. Hazards 2008, 46, 119–138. [Google Scholar] [CrossRef]
  19. Pandey, P.K.; Kass, P.H.; Soupir, M.L.; Biswas, S.; Singh, V.P. Contamination of Water Resources by Pathogenic Bacteria. AMB Expr. 2014, 4, 51. [Google Scholar] [CrossRef] [Green Version]
  20. Blyton, M.D.J.; Gordon, D.M. Genetic Attributes of E. coli Isolates from Chlorinated Drinking Water. PLoS ONE 2017, 12, e0169445. [Google Scholar] [CrossRef]
  21. Kaper, J.B.; Nataro, J.P.; Mobley, H.L.T. Pathogenic Escherichia coli. Nat. Rev. Microbiol. 2004, 2, 123–140. [Google Scholar] [CrossRef]
  22. Denamur, E.; Clermont, O.; Bonacorsi, S.; Gordon, D. The Population Genetics of Pathogenic Escherichia coli. Nat. Rev. Microbiol. 2021, 19, 37–54. [Google Scholar] [CrossRef]
  23. Yu, F.; Chen, X.; Zheng, S.; Han, D.; Wang, Y.; Wang, R.; Wang, B.; Chen, Y. Prevalence and Genetic Diversity of Human Diarrheagenic Escherichia coli Isolates by Multilocus Sequence Typing. Int. J. Infect. Dis. 2018, 67, 7–13. [Google Scholar] [CrossRef] [PubMed] [Green Version]
  24. Tram, N.T.; Dalsgaard, A. Water Used to Moisten Vegetables Is a Source of Escherichia Coli and Protozoan Parasite Contamination at Markets in Hanoi, Vietnam. J. Water Health 2014, 12, 896–900. [Google Scholar] [CrossRef] [PubMed]
  25. Ho, L.Q.C.; Ho, T.T.; Nguyen, V.C.; Pham, H.S.H.; Vu, V.H.; Le, V.A.; Fujieda, A.; Ueru, T.; Akamatsu, M. Microbial and Parasitic Contamination on Fresh Vegetables Sold in Traditional Markets in Hue City, Vietnam. J. Food Nutr. 2014, 2, 959–964. [Google Scholar] [CrossRef] [Green Version]
  26. Ngo, H.M.; Liu, R.; Moritaka, M.; Fukuda, S. Urban Consumer Trust in Safe Vegetables in Vietnam: The Role of Brand Trust and the Impact of Consumer Worry about Vegetable Safety. Food Control. 2020, 108, 106856. [Google Scholar] [CrossRef]
  27. Nguyen, T.K.; Bui, H.T.; Truong, T.A.; Lam, D.N.; Ikeuchi, S.; Ly, L.K.T.; Hara-Kudo, Y.; Taniguchi, T.; Hayashidani, H. Retail Fresh Vegetables as a Potential Source of Salmonella Infection in the Mekong Delta, Vietnam. Int. J. Food Microbiol. 2021, 341, 109049. [Google Scholar] [CrossRef]
  28. Statistics Office of Hue City (SOH). Statistical Yearbook; Statistical Publishing House: Hue City, Vietnam, 2019. [Google Scholar]
  29. Antony, A.; Paul, M.; Silvester, R.; Aneesa, P.A.; Suresh, K.; Divya, P.S.; Paul, S.; Fathima, P.A.; Abdulla, M. Comparative Evaluation of EMB Agar and Hicrome, E. coli Agar for Differentiation of Green Metallic Sheen Producing Non, E. coli and Typical, E. Coli Colonies from Food and Environmental Samples. J. Pure. Appl. Microbio. 2016, 10, 2863–2870. [Google Scholar] [CrossRef]
  30. Molina, F.; López-Acedo, E.; Tabla, R.; Roa, I.; Gómez, A.; Rebollo, J.E. Improved detection of Escherichia coli and coliform bacteria by multiplex PCR. BMC Biotechnol. 2015, 15, 1–9. [Google Scholar] [CrossRef] [PubMed] [Green Version]
  31. Wirth, T.; Falush, D.; Lan, R.; Colles, F.; Mensa, P.; Wieler, L.H.; Karch, H.; Reeves, P.R.; Maiden, M.C.J.; Ochman, H.; et al. Sex and Virulence in Escherichia coli: An Evolutionary Perspective. Mol. Microbiol. 2006, 60, 1136–1151. [Google Scholar] [CrossRef] [Green Version]
  32. Maiden, M.C. Multilocus Sequence Typing of Bacteria. Annu. Rev. Microbiol. 2006, 60, 561–588. [Google Scholar] [CrossRef]
  33. Larsen, M.V.; Cosentino, S.; Rasmussen, S.; Friis, C.; Hasman, H.; Marvig, R.L.; Jelsbak, L.; Sicheritz-Pontén, T.; Ussery, D.W.; Aarestrup, F.M.; et al. Multilocus Sequence Typing of Total-Genome-Sequenced Bacteria. J. Clin. Microbiol. 2012, 50, 1355. [Google Scholar] [CrossRef] [PubMed] [Green Version]
  34. Enright, M.C.; Spratt, B.G. Multilocus Sequence Typing. Trends Microbiol. 1999, 7, 6. [Google Scholar] [CrossRef]
  35. Zhou, Z.; Alikhan, N.-F.; Mohamed, K.; Fan, Y.; the Agama Study Group; Achtman, M. The EnteroBase User’s Guide, with Case Studies on Salmonella Transmissions, Yersinia Pestis Phylogeny, and Escherichia Core Genomic Diversity. Genome Res. 2020, 30, 138–152. [Google Scholar] [CrossRef] [Green Version]
  36. Zhou, Z.; Alikhan, N.-F.; Sergeant, M.J.; Luhmann, N.; Vaz, C.; Francisco, A.P.; Carriço, J.A.; Achtman, M. GrapeTree: Visualization of Core Genomic Relationships among 100,000 Bacterial Pathogens. Genome Res. 2018, 28, 1395–1404. [Google Scholar] [CrossRef] [Green Version]
  37. Kumar, S.; Stecher, G.; Li, M.; Knyaz, C.; Tamura, K. MEGA X: Molecular Evolutionary Genetics Analysis across computing platforms. Mol. Biol. Evol. 2018, 35, 1547–1549. [Google Scholar] [CrossRef]
  38. R Core Team. R: A Language and Environment for Statistical Computing; R Foundation for Statistical Computing: Vienna, Austria, 2020. [Google Scholar]
  39. Ministry of Natural Resources and Environment. National technical regulation on surface water quality 2015 (QCVN 08-MT:2015/BTNMT). Available online: http://cem.gov.vn/storage/documents/5d6f3ecb26484qcvn-08-mt2015btnmt.pdf (accessed on 22 August 2019).
  40. Ministry of Health. National technical Regulation on Microbiological Contamination in Food 2012 (QCVN 8-3: 2012/BYT). Available online: http://www.fsi.org.vn/pic/files/qcvn-8-3_2011-byt-to-many-micro-vat-intp_bia_merged.pdf (accessed on 22 August 2019). (In Vietnamese).
  41. US-FDA. Code of Federal Regulations Title 21, 2020, Volume 2 (21CFR112.55). Available online: https://www.accessdata.fda.gov/scripts/cdrh/cfdocs/cfCFR/CFRSearch.cfm?fr=112.55 (accessed on 10 January 2021).
  42. Lyautey, E.; Lu, Z.; Lapen, D.R.; Wilkes, G.; Scott, A.; Berkers, T.; Edge, T.A.; Topp, E. Distribution and Diversity of Escherichia coli Populations in the South Nation River Drainage Basin, Eastern Ontario, Canada. Appl. Environ. Microbiol. 2010, 76, 1486–1496. [Google Scholar] [CrossRef] [Green Version]
  43. Byappanahalli, M.N.; Nevers, M.B.; Korajkic, A.; Staley, Z.R.; Harwood, V.J. Enterococci in the Environment. Microbiol. Mol. Biol. Rev. 2012, 76, 685–706. [Google Scholar] [CrossRef] [PubMed] [Green Version]
  44. Iwu, C.D.; Okoh, A.I. Preharvest Transmission routes of Fresh Produce Associated Bacterial Pathogens with Outbreak Potentials: A review. Int. J. Environ. Res. Public Health 2019, 16, 4407. [Google Scholar] [CrossRef] [PubMed] [Green Version]
  45. Mu, D.; Luo, P.; Lyu, J.; Zhou, M.; Huo, A.; Duan, W.; Nover, D.; He, B.; Zhao, X. Impact of Temporal Rainfall Patterns on Flash Floods in Hue City, Vietnam. J. Flood Risk Manag. 2021, 14. [Google Scholar] [CrossRef]
  46. Allard, S.M.; Callahan, M.T.; Bui, A.; Ferelli, A.M.C.; Chopyk, J.; Chattopadhyay, S.; Mongodin, E.F.; Micallef, S.A.; Sapkota, A.R. Creek to Table: Tracking Fecal Indicator Bacteria, Bacterial Pathogens, and Total Bacterial Communities from Irrigation Water to Kale and Radish Crops. Sci. Total Environ. 2019, 666, 461–471. [Google Scholar] [CrossRef]
  47. Weller, D.; Wiedmann, M.; Strawn, L.K. Spatial and Temporal Factors Associated with an Increased Prevalence of Listeria monocytogenes in Spinach Fields in New York State. Appl. Environ. Microbiol. 2015, 81, 6059–6069. [Google Scholar] [CrossRef] [Green Version]
  48. Chandran, A.; Mazumder, A. Pathogenic Potential, Genetic Diversity, and Population Structure of Escherichia Coli Strains Isolated from a Forest-Dominated Watershed (Comox Lake) in British Columbia, Canada. Appl. Environ. Microbiol. 2015, 81, 1788–1798. [Google Scholar] [CrossRef]
  49. Aibinu, I.; Odugbemi, T.; Koenig, W.; Ghebremedhin, B. Sequence Type ST131 and ST10 Complex (ST617) Predominant among CTX-M-15-Producing Escherichia coli Isolates from Nigeria* *This Study Has Been Partially Presented during the 51st Interscience Conference on Antimicrobial Agents and Chemotherapy (ICAAC) in Chicago, IL, September 2011. Clin. Microbiol. Infect. 2012, 18, E49–E51. [Google Scholar] [CrossRef] [PubMed] [Green Version]
  50. Chattaway, M.A.; Jenkins, C.; Rajendram, D.; Cravioto, A.; Talukder, K.A.; Dallman, T.; Underwood, A.; Platt, S.; Okeke, I.N.; Wain, J. Enteroaggregative Escherichia coli Have Evolved Independently as Distinct Complexes within the E. coli Population with Varying Ability to Cause Disease. PLoS ONE 2014, 9, e112967. [Google Scholar] [CrossRef]
  51. Manges, A.R. Escherichia coli and Urinary Tract Infections: The Role of Poultry-Meat. Clinical Microbiology and Infection 2016, 22, 122–129. [Google Scholar] [CrossRef] [PubMed] [Green Version]
  52. Okeke, I.N.; Wallace-Gadsden, F.; Simons, H.R.; Matthews, N.; Labar, A.S.; Hwang, J.; Wain, J. Multi-Locus Sequence Typing of Enteroaggregative Escherichia coli Isolates from Nigerian Children Uncovers Multiple Lineages. PLoS ONE 2010, 5, e14093. [Google Scholar] [CrossRef] [Green Version]
  53. Nadimpalli, M.L.; Marks, S.J.; Montealegre, M.C.; Gilman, R.H.; Pajuelo, M.J.; Saito, M.; Tsukayama, P.; Njenga, S.M.; Kiiru, J.; Swarthout, J.; et al. Urban Informal Settlements as Hotspots of Antimicrobial Resistance and the Need to Curb Environmental Transmission. Nat Microbiol 2020, 5, 787–795. [Google Scholar] [CrossRef] [PubMed]
  54. Shiraz, S.; Djebbi-Simmons, D.; Alhejaili, M.; Danos, K.; Janes, M.; Fontenot, K.; Xu, W. Evaluation of the Microbial Safety and Quality of Louisiana Strawberries after Flooding. Food Control. 2020, 110, 106970. [Google Scholar] [CrossRef]
  55. Unger, I.M.; Kennedy, A.C.; Muzika, R.-M. Flooding Effects on Soil Microbial Communities. Appl. Soil Ecol. 2009, 42, 1–8. [Google Scholar] [CrossRef]
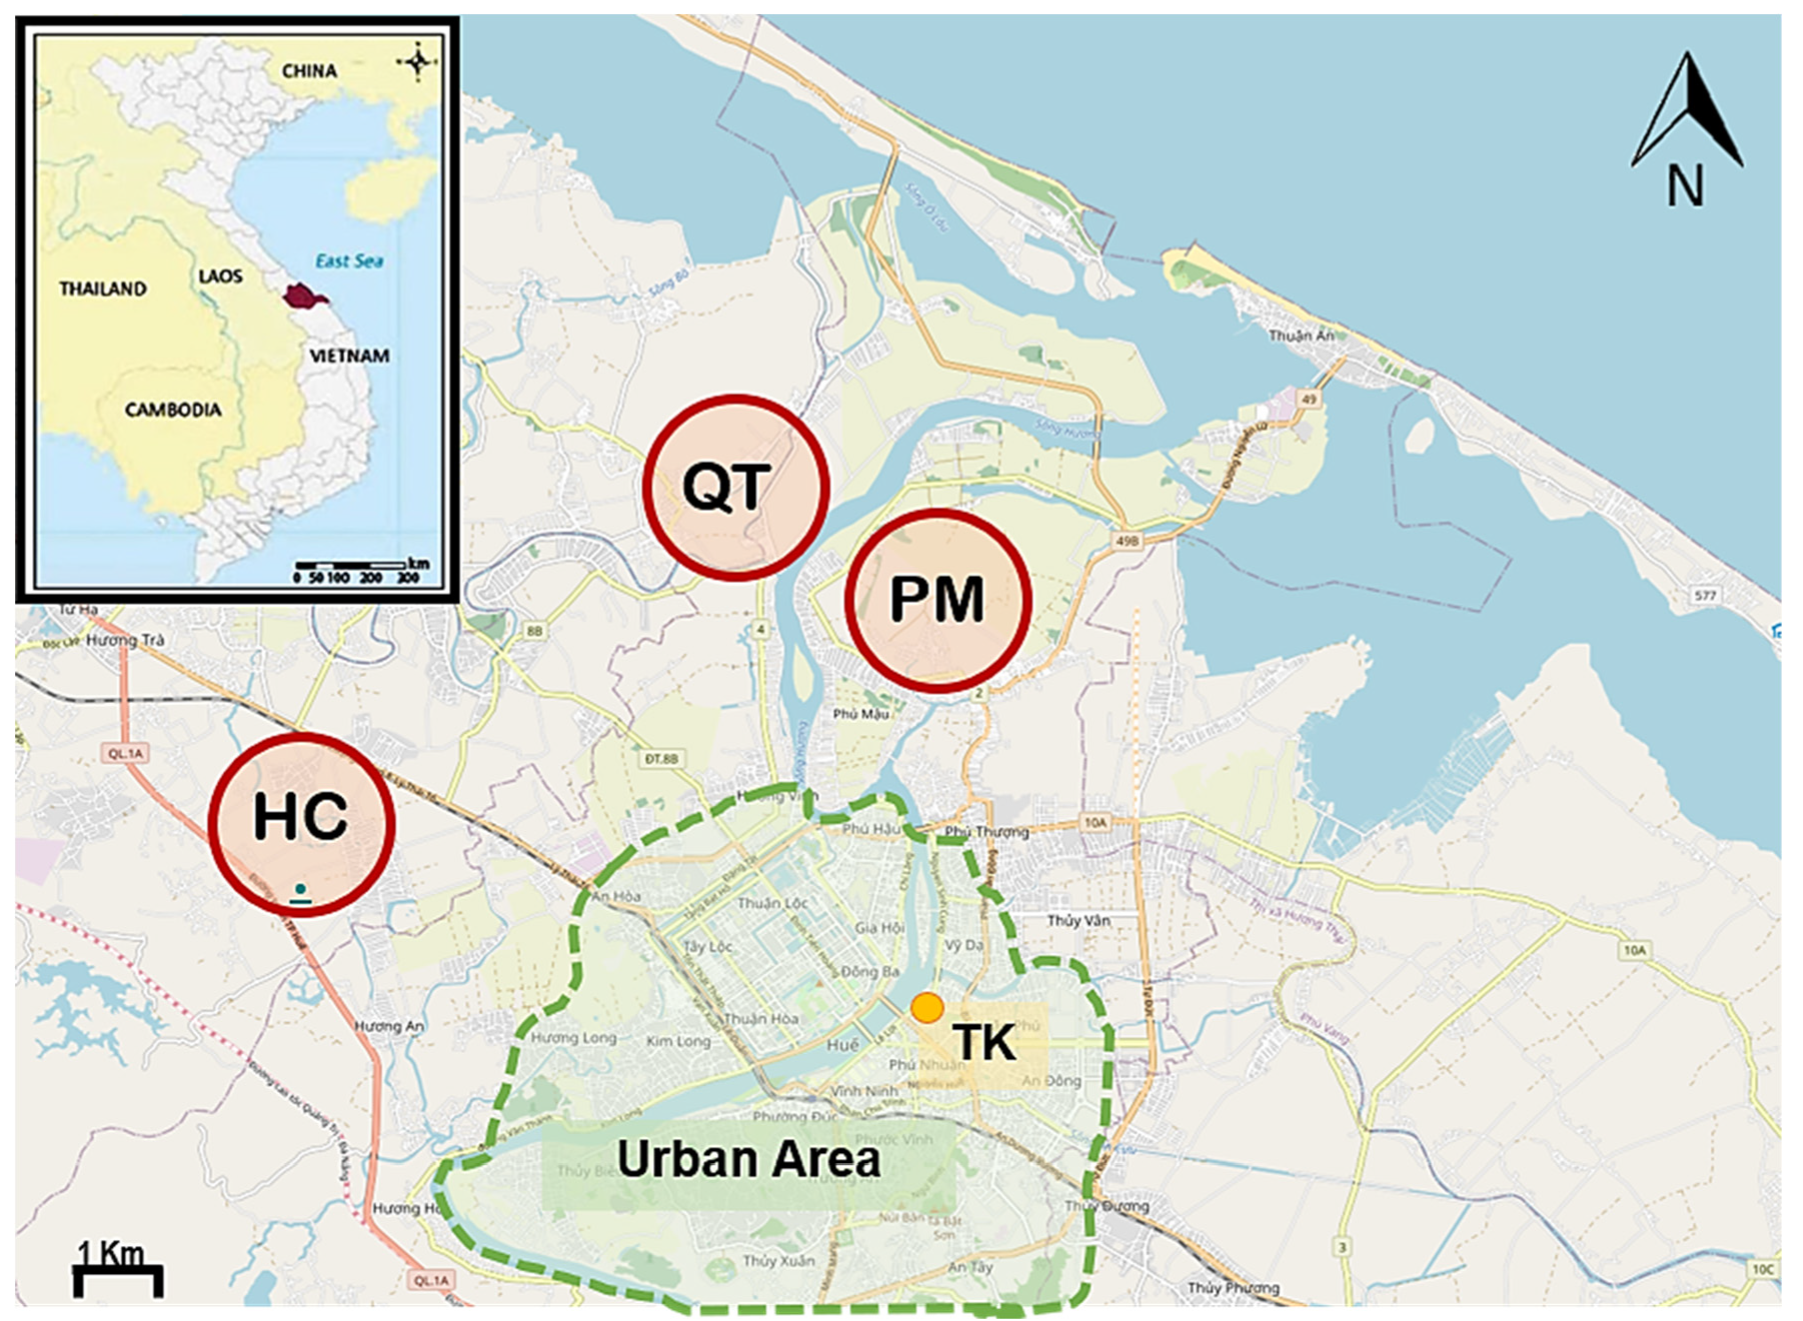
Figure 1. Location of sampling in Hue, Vietnam. Irrigation water (IRW), soil (SOL), and manure (MNR) samples were taken from Huong Chu (HC), Phu Mau (PM), and Quang Thanh (QT) communes in red circles. Municipal wastewater (MWW) samples were collected from the drainage pipe at Toa Kham (TK) (orange dot). The light-green shaded area shows extent of the city; however, only the northeast section drainage flows through TK.
Ijerph 18 09580 g001
Figure 2. Mean concentrations of E. coli in (a) SOL, (b) VEG, and (c) IRW samples from Huong Chu (HC), Phu Mau (PM), and Quang Thanh (QT) communes. The dotted lines show recommended standards for SOL (US −FDA, 2020) and VEG and IRW (Vietnamese standards) (Ministry of Health, 2012; Ministry of Natural Resources and Environment, 2015). Statistical analysis using Wilcoxon signed-rank test did not show significant differences between the sites and seasons (p > 0.05).
Ijerph 18 09580 g002
Figure 3. GrapeTree phylogeny constructed using sequence types (STs) identified by multilocus sequence typing during (a) the dry season and (b) the wet season and their relation in different samples. Each node represents a single ST, the number is the ST identity. The size of the node relates to the number of the isolates for each ST, i.e., the more the isolates with the same ST the bigger the size, and the color shows the sample type.
Ijerph 18 09580 g003
Figure 4. Phylogenetic tree constructed using the neighbor-joining tree method with Kimura 2-parameter model for E. coli isolates from (a) municipal wastewater (MWW), irrigation water (IRW), soil (SOL), and vegetable (VEG) samples collected during the dry season; (b) MWW, IRW, SOL, and manure (MNR) samples collected during the wet season taken from Huong Chu (HC), Phu Mau (PM), and Quang Thanh (QT) communes. Mixed clusters are highlighted in grey. For the two unrooted trees we constructed using MEGA-X software, the scale bars show a 5% difference between sequences aimed at finding the relationship among isolates without any need to depict the common ancestor.
Ijerph 18 09580 g004
Table 1. Primer and the annealing temperature settings for MLST analysis (adapted from [31]).
Target GenePrimerSequenceProduct SizeAnnealing
Temperature
adkadk-FTCATCATCTGCACTTTCCGC766 bp54 °C
adk-RCCAGATCAGCGCGAACTTCA
fumCfumC-FTCACAGGTCGCCAGCGCTTC806 bp65 °C
fumC-RGTACGCAGCGAAAAAGATTC
gyrBgyrB-FTCGGCGACACGGATGACGGC815 bp60 °C
gyrB-RGTCCATGTAGGCGTTCAGGG
icdicd-FATGGAAAGTAAAGTAGTTGTTCCGGCACA878 bp62 °C
icd-RGGACGCAGCAGGATCTGTT
mdhmdh-FAGCGCGTTCTGTTCAAATGC799 bp56 °C
mdh-RCAGGTTCAGAACTCTCTCTGT
purApurA-FTCGGTAACGGTGTTGTGCTG845 bp58 °C
purA-RCATACGGTAAGCCACGCAGA
recArecA-FCGCATTCGCTTTACCCTGACC734 bp58 °C
recA-RTCGTCGAAATCTACGGACCGGA
Table 2. Number of E. coli isolates for samples collected during the dry and wet season in 2018.
Sample TypeNumber of E. coli Isolates
Dry SeasonWet Season
Manure (MNR)-18
Soil (SOL)1611
Irrigation water (IRW)4039
Wastewater (MWW)1319
Vegetable (VEG)21ND
Total9087
- No sample; ND—Isolates were not included in MLST analysis.
Table 3. Previously reported pathotype and phylogroups associated sequence types in clusters formed from phylogenic analysis.
SeasonClusterSTST ComplexPathotype aPhylogroup a
(Clermont)
Phylogroup a
(EzClermont)
Sample
Dry110STc10UPEC, STEC, VTEC, NMEC,
ExPEC, ETEC, EPEC, EAEC, APEC,
Non-pathogen
E or clade
I, C, A
U, cryptic, C, AMWW
2409NonePathogen
(Unknown)
B1 and AAMWW, IRW
3181STc168Unknown, Non-pathogenAAVEG
4161NonePathogenAAIRW
510,865NoneNA IRW
610,867NoneNA VEG
7196NoneUPEC,
Non-pathogen
B1B1 and ASOL
10,678NoneNA SOL
810,688NoneNA IRW
Wet11148NonePathogen,
Non-pathogen
B1B1SOL
21056NoneNAB1B1IRW
310,012NoneNA MNR
4200STc40VTEC, EHEC, EAEC, 
Non-pathogen
B1B1MWW
40STEC, EPEC, EAEC, 
Non-pathogen
B1B1IRW
510,023NoneNA IRW
10,027NoneNA IRW
6641STc86ExPEC,
Non-pathogen
D, B1, AU, D, B1, AMNR
7155STc155UPEC, STEC, ExPEC, ETEC, EAEC, APEC, Non-pathogenB1, AU, B1, AIRW
810,008NoneNA MNR
9181STc168Non-pathogenAAIRW
1093168UPEC,
ExPEC, ETEC, DAEC, APEC, Non-pathogen
E, D, A D, AIRW, MWW, MNR
9872NoneNA
114810UPEC,
ExPEC, EAEC, APEC,
Non-pathogen
E, ACryptic, E, AMNR, MWW, IRW, SOL
10,032NoneNA No Database
685610NAAA
10,019NoneNA
1210,033NoneNA IRW
Phylogroup
Summary Sample AB1B2E
MNR34
VEG53
SOL19
IRW 1815
MWW14311
Underline—most prevalence, NA—not available, EPEC: Enteropathogenic E. coli, ETEC: Enterotoxigenic E. coli, EAEC: Enteroaggregative E. coli, EHEC: Enterohaemorrhagic E. coli, EIEC: Enteroinvasive E. coli, ExPEC: Extraintestinal Pathogenic E. coli, DAEC: Diffusely Adherent E. coli, STEC: Shiga Toxin-producing E. coli, UPEC: Uropathogenic E. coli, APEC: Avian Pathogenic E. coli, VTEC: Verotoxigenic E. coli, NMEC: Neonatal Meningitis E. coli. a result from the Enterobase [33].
Publisher’s Note: MDPI stays neutral with regard to jurisdictional claims in published maps and institutional affiliations.