
Validation and Psychometric Properties of the Spanish Version of the Hopkins Symptom Checklist-25 Scale for Depression Detection in Primary Care

 , ,
, ,  , , and
Abstract
:1. Introduction
2. Methods
2.1. Study Design
2.2. Participants
2.3. Recruitment and Sample Size
- A 0.742 AUC to identify cases of depression (according to Nettelbladt et al. [20]).
- A type I error of 5% and a power of 95% were selected. Thus, 87 cases and 174 controls were needed (new AUC test: 0.80, standard AUC test: 0.74; case/control ratio: 2).
2.4. Variables
2.5. Hopkins Symptom Checklist-25 (HSCL-25)
2.6. Composite International Diagnostic Interview (CIDI)
2.7. Patient Health Questionnaire (PHQ)
2.8. Statistical Analysis
2.8.1. Missing Data
2.8.2. Responding Process and Item Analysis
2.8.3. Internal Structure
2.8.4. Criterion Validity
2.8.5. Internal Consistency
2.8.6. Test–Retest Reliability
3. Results
3.1. Participants
3.2. Responding Process and Item Analysis
3.3. Internal Structure: Confirmatory Factorial Analysis
3.4. Criterion Validity: Relationship with the Gold-Standard CIDI
3.5. Criterion Validity: Relationship with PHQ-9 External Criteria
3.6. Reliability: Internal Consistency and Test–Retest Reliability
4. Discussion
5. Conclusions
Supplementary Materials
Author Contributions
Funding
Institutional Review Board Statement
Informed Consent Statement
Data Availability Statement
Conflicts of Interest
References
- James, S.L.; Abate, D.; Abate, K.H.; Abay, S.M.; Abbafati, C.; Abbasi, N.; Abbastabar, H.; Abd-Allah, F.; Abdela, J.; Abdelalim, A.; et al. Global, regional, and national incidence, prevalence, and years lived with disability for 354 diseases and injuries for 195 countries and territories, 1990–2017: A systematic analysis for the Global Burden of Disease Study 2017. Lancet 2018, 392, 1789–1858. [Google Scholar] [CrossRef] [Green Version]
- Vos, T.; Allen, C.; Arora, M.; Barber, R.M.; Bhutta, Z.A.; Brown, A.; Carter, A.; Casey, D.C.; Charlson, F.J.; Chen, A.Z.; et al. Global, regional, and national incidence, prevalence, and years lived with disability for 310 diseases and injuries, 1990–2015: A systematic analysis for the Global Burden of Disease Study 2015. Lancet 2016, 388, 1545–1602. [Google Scholar] [CrossRef] [Green Version]
- Serrano-Blanco, A.; Palao, D.; Luciano, J.V.; Pinto-Meza, A.; Lujan-Barroso, L.; Fernandez, A.; Roura, P.; Bertsch, J.; Mercader, M.; Haro, J.M. Prevalence of mental disorders in primary care: Results from the diagnosis and treatment of mental disorders in primary care study (DASMAP). Soc. Psychiatry Psychiatr. Epidemiol. 2009, 45, 201–210. [Google Scholar] [CrossRef] [PubMed]
- King, M.; Nazareth, I.; Levy, G.; Walker, C.; Morris, R.; Weich, S.; Bellón-Saameño, J.; Moreno, B.; Švab, I.; Rotar, D.; et al. Prevalence of common mental disorders in general practice attendees across Europe. Br. J. Psychiatry 2008, 192, 362–367. [Google Scholar] [CrossRef]
- Portellano-Ortiz, C.; Garre-Olmo, J.; Calvó-Perxas, L.; Conde-Sala, J.L. Depression and associated variables in people over 50 years in Spain. Rev. Psiquiatr. Salud Ment. 2018, 11, 216–226. [Google Scholar] [CrossRef] [PubMed] [Green Version]
- Gabilondo, A.; Vilagut, G.; Pinto-Meza, A.; Haro, J.M.; Alonso, J. Comorbidity of major depressive episode and chronic physical conditions in Spain, a country with low prevalence of depression. Gen. Hosp. Psychiatry 2012, 34, 510–517. [Google Scholar] [CrossRef] [PubMed]
- Nabbe, P.; Le Reste, J.; Chiron, B.; Le Prielec, A.; Munoz, M.; Claveria, A. The FPDM (family practice depression and Multimorbidity) Study: Project for systematic review of literature to find tools for depression diagnosis used in primary care. In Proceedings of the 72nd European General Practice Research Network Meeting, Niza, France, 16 May 2011; p. 25. [Google Scholar]
- Nabbe, P.; Le Reste, J.; Guillou-Landreat, M.; Perez, M.M.; Argyriadou, S.; Clavería, A.; Fernandez-San-Martin, M.I.; Czachowski, S.; Lingner, H.; Lygidakis, C.; et al. Which DSM validated tools for diagnosing depression are usable in primary care research? A systematic literature review. Eur. Psychiatry 2017, 39, 99–105. [Google Scholar] [CrossRef] [PubMed]
- Nabbe, P.; Le Reste, J.Y.; Guillou-Landreat, M.; Beck-Robert, E.; Assenova, R.; Lazic, D.; Czachowski, S.; Stojanović-Špehar, S.; Hasanagic, M.; Lingner, H.; et al. One consensual depression diagnosis tool to serve many countries: A challenge! A RAND/UCLA methodology. BMC Res. Notes 2018, 11, 1–8. [Google Scholar] [CrossRef] [PubMed] [Green Version]
- Derogatis, L.R.; Lipman, R.S.; Rickels, K.; Uhlenhuth, E.H.; Covi, L. The Hopkins Symptom Checklist (HSCL): A self-report symptom inventory. Syst. Res. Behav. Sci. 1974, 19, 1–15. [Google Scholar] [CrossRef]
- Nabbe, P.; Le Reste, J.; le Floch, B.; Sowinska, A.; Czachowski, S.; Doer, C. FPDM (Family Practice Depression and Multimorbidity): The Hopkins Symptoms Checklist-25 items (HSCL-25), completed translation in 10 European languages. In Proceedings of the 81st European General Practice Research Network Meeting, Edirne, Turkey, 17 October 2015; p. 66. [Google Scholar]
- Clavería, A.; Rodríguez-Barragán, M.; Fernández-San-Martín, M.I.; Nabbe, P.; Le Reste, J.Y.; Miguéns-Blanco, I.; Cossio-Gil, Y. Translation and cross-cultural adaptation into Spanish, Catalan and Galician of the Hopkins Symptom Checklist-25 to identify depression in Primary Care. Aten Primaria 2020, 52, 539–547. [Google Scholar] [CrossRef] [PubMed]
- Nabbe, P.; Le Reste, J.Y.; Guillou-Landreat, M.; Gatineau, F.; Le Floch, B.; Montier, T.; Van Marwijk, H.; Van Royen, P. The French version of the HSCL-25 has now been validated for use in primary care. PLoS ONE 2019, 14, e0214804. [Google Scholar] [CrossRef] [PubMed]
- Mokkink, L.B.; De Vet, H.C.W.; Prinsen, C.A.C.; Patrick, D.L.; Alonso, J.; Bouter, L.; Terwee, C.B. COSMIN Risk of Bias checklist for systematic reviews of Patient-Reported Outcome Measures. Qual. Life Res. 2017, 27, 1171–1179. [Google Scholar] [CrossRef] [PubMed] [Green Version]
- Glaesmer, H.; Braehler, E.; Grande, G.; Hinz, A.; Petermann, F.; Romppel, M. The German Version of the Hopkins Symptoms Checklist-25 (HSCL-25)—Factorial structure, psychometric properties, and population-based norms. Compr. Psychiatry 2014, 55, 396–403. [Google Scholar] [CrossRef] [PubMed]
- Lundin, A.; Hallgren, M.; Forsell, Y. The validity of the symptom checklist depression and anxiety subscales: A general population study in Sweden. J. Affect. Disord. 2015, 183, 247–252. [Google Scholar] [CrossRef] [PubMed]
- Veijola, J.; Jokelainen, J.; Läksy, K.; Kantojärvi, L.; Kokkonen, P.; Järvelin, M.-R.; Joukamaa, M. The Hopkins Symptom Checklist-25 in screening DSM-III-R axis-I disorders. Nord. J. Psychiatry 2003, 57, 119–123. [Google Scholar] [CrossRef] [PubMed]
- Lee, B.; Kaaya, S.; Mbwambo, J.K.; Smith-Fawzi, M.C.; Leshabari, M.T. Detecting Depressive Disorder With the Hopkins Symptom Checklist-25 in Tanzania. Int. J. Soc. Psychiatry 2008, 54, 7–20. [Google Scholar] [CrossRef] [PubMed]
- Al-Turkait, F.A.; Ohaeri, J.U.; El-Abbasi, A.-H.M.; Naguy, A. Relationship between Symptoms of Anxiety and Depression in a Sample of Arab College Students Using the Hopkins Symptom Checklist 25. Psychopathology 2011, 44, 230–241. [Google Scholar] [CrossRef] [PubMed]
- Nettelbladt, P.; Hansson, L.; Stefansson, C.G.; Borgquist, L.; Nordström, G. Test characteristics of the Hopkins Symptom Check List-25 (HSCL-25) in Sweden, using the Present State Examination (PSE-9) as a caseness criterion. Soc. Psychiatry Psychiatr Epidemiol. 1993, 28, 130–133. [Google Scholar] [CrossRef] [PubMed]
- Fröjdh, K.; Håkansson, A.; Karlsson, I. The Hopkins Symptom Cheklist-25 is a sensitive case-finder of clinically important depressive states in elderly people in primary care. Int. J. Geriatr. Psychiatry 2004, 19, 386–390. [Google Scholar] [CrossRef] [PubMed]
- Zabaleta-del-Olmo, E.; Pombo, H.; Pons-Vigués, M.; Casajuana-Closas, M.; Pujol-Ribera, E.; López-Jiménez, T.; Cabezas-Peña, C.; Martín-Borràs, C.; Serrano-Blanco, A.; Rubio-Valera, M.; et al. Complex multiple risk intervention to promote healthy behaviours in people between 45 to 75 years attended in primary health care (EIRA study): Study protocol for a hybrid trial. BMC Public Health 2018, 18, 874. [Google Scholar]
- Mokkink, L.B.; Prinsen, C.A.C.; Patrick, D.L.; Alonso, J.; Bouter, L.M.; de Vet, H.C.W.; Terwee, C.B. COSMIN Study Design Checklist for Patient-Reported Outcome Measurement Instruments. 2019. Available online: www.cosmin.nl (accessed on 19 April 2021).
- Terwee, C.B.; Bot, S.D.; de Boer, M.; van der Windt, D.A.; Knol, D.L.; Dekker, J.; Bouter, L.; de Vet, H.C. Quality criteria were proposed for measurement properties of health status questionnaires. J. Clin. Epidemiol. 2007, 60, 34–42. [Google Scholar] [CrossRef] [PubMed] [Green Version]
- Sandanger, I.; Moum, T.; Ingebrigtsen, G.; Dalgard, O.S.; Sørensen, T.; Bruusgaard, D. Concordance between symptom screening and diagnostic procedure: The Hopkins Symptom Checklist-25 and the Composite International Diagnostic Interview I. Soc. Psychiatry Psychiatr. Epidemiol. 1998, 33, 345–354. [Google Scholar] [CrossRef]
- Kessler, R.C.; Üstün, T.B. The World Mental Health (WMH) Survey Initiative version of the World Health Organization (WHO) Composite International Diagnostic Interview (CIDI). Int. J. Methods Psychiatr. Res. 2004, 13, 93–121. [Google Scholar] [CrossRef] [PubMed]
- Haro, J.M.; Arbabzadeh-Bouchez, S.; Brugha, T.S.; de Girolamo, G.; Guyer, M.E.; Jin, R.; Lepine, J.P.; Mazzi, F.; Reneses, B.; Vilagut, G.; et al. Concordance of the Composite International Diagnostic Interview Version 3.0 (CIDI 3.0) with standardized clinical assessments in the WHO World Mental Health Surveys. Int. J. Methods Psychiatr. Res. 2006, 15, 167–180. [Google Scholar] [CrossRef] [PubMed]
- Harkness, J.; Pennell, B.E.; Villar, A.; Gebler, N.; Aguilar-Gaxiola, S.; Bilgen, I. Translation procedures and translation assessment in the World Mental Health Survey Initiative. In The WHO World Mental Health Surveys: Global Perspectives on the Epidemiology of Mental Disorders; Kessler, R.C., Bedirhan üstün, T., Eds.; Cambridge University Press: New York, NY, USA; World Health Organization: Geneva, Switzerland, 2008; pp. 91–113. [Google Scholar]
- Kroenke, K. The Phq-9. J. Gen. Intern. Med. 2001, 16, 606–613. [Google Scholar] [CrossRef]
- Diez-Quevedo, C.; Rangil, T.; Sanchez-Planell, L.; Kroenke, K.; Spitzer, R.L. Validation and Utility of the Patient Health Questionnaire in Diagnosing Mental Disorders in 1003 General Hospital Spanish Inpatients. Psychosom. Med. 2001, 63, 679–686. [Google Scholar] [CrossRef] [PubMed]
- American Psychiatric Association. Manual Diagnóstico y Estadístico de los Trastornos Mentales DSM-5, 5th ed.; Editorial Médica Panamericana: Madrid, Spain, 2014; 1100p. [Google Scholar]
- Skogen, J.C.; Øverland, S.; Smith, O.R.; Aarø, L.E. The factor structure of the Hopkins Symptoms Checklist (HSCL-25) in a student population: A cautionary tale. Scand. J. Public Health 2017, 45, 357–365. [Google Scholar] [CrossRef] [PubMed]
- Ashaba, S.; Kakuhikire, B.; Vořechovská, D.; Perkins, J.M.; Cooper-Vince, C.E.; Maling, S.; Bangsberg, D.R.; Tsai, A.C. Reliability, Validity, and Factor Structure of the Hopkins Symptom Checklist-25: Population-Based Study of Persons Living with HIV in Rural Uganda. AIDS Behav. 2017, 22, 1467–1474. [Google Scholar] [CrossRef] [PubMed]
- Bendixen, A.B.; Engedal, K. Anxiety among older psychiatric patients: A hidden comorbidity? Aging Ment. Health 2016, 20, 1131–1138. [Google Scholar] [CrossRef]
- Martinussen, L.J.; Benth, J.Š.; Almdahl, I.S.; Borza, T.; Selbæk, G.; Mcpherson, B.; Korsnes, M.S. The effect of anxiety on cognition in older adult inpatients with depression: Results from a multicenter observational study. Heliyon 2019, 5, e02235. [Google Scholar] [CrossRef] [PubMed] [Green Version]
- Bantjes, J.; Kagee, A.; Saal, W. The Utility of the Hopkins Symptom Checklist as a Trans-Diagnostic Screening Instrument for Common Mental Disorders Among Persons Seeking HIV Testing. AIDS Behav. 2019, 24, 629–636. [Google Scholar] [CrossRef] [PubMed]
- Mattisson, C.; Bogren, M.; Horstmann, V. Correspondence between clinical diagnoses of depressive and anxiety disorders and diagnostic screening via the Hopkins Symptom Check List-25 in the Lundby Study. Nord. J. Psychiatry 2012, 67, 204–213. [Google Scholar] [CrossRef] [PubMed]
- Reuland, D.S.; Cherrington, A.; Watkins, G.S.; Bradford, D.W.; Blanco, R.A.; Gaynes, B.N. Diagnostic Accuracy of Spanish Language Depression-Screening Instruments. Ann. Fam. Med. 2009, 7, 455–462. [Google Scholar] [CrossRef] [PubMed] [Green Version]
- Nunnally, J.C. Psychometric Theory, 2nd ed.; McGraw-Hill: New York, NY, USA, 1978. [Google Scholar]
- Schmalbach, B.; Zenger, M.; Tibubos, A.N.; Kliem, S.; Petrowski, K.; Brähler, E. Psychometric Properties of Two Brief Versions of the Hopkins Symptom Checklist: HSCL-5 and HSCL-10. Assessment 2019, 28, 617–631. [Google Scholar] [CrossRef] [PubMed]
- Strand, B.H.; Dalgard, O.S.; Tambs, K.; Rognerud, M. Measuring the mental health status of the Norwegian population: A comparison of the instruments SCL-25, SCL-10, SCL-5 and MHI-5 (SF-36). Nord. J. Psychiatry 2003, 57, 113–118. [Google Scholar] [CrossRef] [PubMed]


| Sociodemographic Variables | Male | Female | Total | p | |||
|---|---|---|---|---|---|---|---|
| n | % | n | % | n | % | ||
| 350 | 45.6 | 417 | 54.4 | 767 | |||
| Marital status | |||||||
| Married/with a partner | 259 | 74.0 | 291 | 69.8 | 550 | 71.7 | 0.001 |
| Single | 31 | 8.9 | 25 | 6.0 | 56 | 7.3 | |
| Separated/divorced | 48 | 13.7 | 55 | 13.2 | 103 | 13.4 | |
| Widow(er) | 11 | 3.1 | 46 | 11.3 | 57 | 7.4 | |
| Others (religious…) | 1 | 0.3 | 0 | 0 | 1 | 0.1 | |
| Education | |||||||
| Secondary or higher | 178 | 50.9 | 190 | 45.6 | 368 | 48.0 | 0.153 |
| Primary or lower | 172 | 49.1 | 226 | 54.2 | 398 | 51.9 | |
| No response | 0 | 0 | 1 | 0.2 | 1 | 0.1 | |
| Current employment | |||||||
| Employed | 153 | 43.7 | 160 | 38.4 | 313 | 40.8 | <0.001 |
| Housewife | 2 | 0.6 | 109 | 26.1 | 111 | 14.5 | |
| Unemployed | 45 | 12.9 | 38 | 9.1 | 83 | 10.8 | |
| Retired | 128 | 36.6 | 81 | 19.4 | 209 | 27.3 | |
| Others (student, sick leave, disability) | 20 | 5.7 | 28 | 6.7 | 48 | 6.3 | |
| No response | 2 | 0.6 | 1 | 0.2 | 3 | 0.4 | |
| Item | Response Values (n = 790) | Score | DI | ||||||||||
|---|---|---|---|---|---|---|---|---|---|---|---|---|---|
| Missing Values | Not at All | A Little | Quite a Bit | Extremely | Male (n = 350) | Female (n = 417) | Total (n = 767) | p | |||||
| % | % | % | % | % | Mean | SD | Mean | SD | Mean | SD | |||
| 1. Being scared for no reason | 2.8 | 75.6 | 18.1 | 4.8 | 1.3 | 1.14 | 0.41 | 1.46 | 0.73 | 1.32 | 0.63 | <0.001 | 0.61 |
| 2. Feeling fearful | 3.3 | 67.5 | 25.0 | 5.7 | 1.7 | 1.27 | 0.51 | 1.54 | 0.77 | 1.42 | 0.68 | <0.001 | 0.77 |
| 3. Faintness | 3.2 | 54.4 | 35.1 | 8.5 | 2.1 | 1.47 | 0.65 | 1.68 | 0.79 | 1.58 | 0.73 | <0.001 | 1.01 |
| 4. Nervousness | 2.9 | 31.8 | 40.0 | 21.1 | 7.0 | 1.81 | 0.84 | 2.23 | 0.91 | 2.03 | 0.90 | <0.001 | 1.43 |
| 5. Heart racing | 3.2 | 62.1 | 29.3 | 6.3 | 2.4 | 1.36 | 0.60 | 1.59 | 0.79 | 1.49 | 0.72 | <0.001 | 0.84 |
| 6. Trembling | 3.2 | 76.5 | 18.0 | 3.9 | 1.6 | 1.28 | 0.58 | 1.33 | 0.65 | 1.31 | 0.62 | 0.253 | 0.59 |
| 7. Feeling tense | 3.4 | 42.5 | 39.6 | 12.7 | 5.2 | 1.64 | 0.75 | 1.94 | 0.91 | 1.81 | 0.85 | <0.001 | 1.26 |
| 8. Headache | 3.3 | 59.3 | 26.7 | 9.9 | 4.0 | 1.43 | 0.72 | 1.72 | 0.89 | 1.59 | 0.83 | <0.001 | 0.77 |
| 9. Feeling panic | 3.2 | 87.0 | 9.7 | 2.5 | 0.9 | 1.13 | 0.43 | 1.21 | 0.55 | 1.17 | 0.50 | 0.046 | 0.39 |
| 10. Feeling restless | 2.9 | 40.8 | 44.5 | 11.9 | 2.9 | 1.67 | 0.72 | 1.85 | 0.80 | 1.77 | 0.77 | <0.001 | 1.10 |
| 11. Feeling low in energy | 3.0 | 37.6 | 40.8 | 15.1 | 6.5 | 1.70 | 0.75 | 2.08 | 0.95 | 1.91 | 0.88 | <0.001 | 1.34 |
| 12. Blaming oneself | 3.0 | 61.2 | 27.5 | 8.0 | 3.4 | 1.43 | 0.65 | 1.62 | 0.87 | 1.54 | 0.78 | <0.001 | 0.94 |
| 13. Crying easily | 3.3 | 48.2 | 31.0 | 12.8 | 8.0 | 1.57 | 0.80 | 2.00 | 1.01 | 1.80 | 0.94 | <0.001 | 1.04 |
| 14. Losing sexual interest | 3.3 | 48.9 | 24.0 | 14.2 | 12.9 | 1.51 | 0.82 | 2.24 | 1.14 | 1.91 | 1.07 | <0.001 | 1.29 |
| 15. Feeling lonely | 2.9 | 65.6 | 23.3 | 6.1 | 5.0 | 1.32 | 0.66 | 1.66 | 0.90 | 1.50 | 0.82 | <0.001 | 1.02 |
| 16. Feeling hopeless | 3.3 | 75.9 | 16.0 | 4.7 | 3.4 | 1.23 | 0.57 | 1.46 | 0.82 | 1.36 | 0.73 | <0.001 | 0.82 |
| 17. Feeling blue | 3.2 | 52.3 | 34.4 | 8.6 | 4.7 | 1.40 | 0.66 | 1.87 | 0.89 | 1.66 | 0.82 | <0.001 | 1.31 |
| 18. Thinking of ending one’s life | 3.2 | 93.6 | 4.4 | 1.7 | 0.3 | 1.06 | 0.31 | 1.11 | 0.40 | 1.09 | 0.36 | 0.041 | 0.22 |
| 19. Feeling trapped | 3.0 | 72.9 | 17.3 | 6.8 | 3.0 | 1.32 | 0.65 | 1.47 | 0.81 | 1.40 | 0.75 | <0.001 | 0.88 |
| 20. Worrying too much | 3.2 | 27.9 | 39.0 | 24.6 | 8.5 | 1.95 | 0.83 | 2.29 | 0.96 | 2.14 | 0.92 | <0.001 | 1.29 |
| 21. Feeling no interest | 3.5 | 79.1 | 14.6 | 4.3 | 2.0 | 1.20 | 0.51 | 1.37 | 0.72 | 1.29 | 0.64 | <0.001 | 0.69 |
| 22. Feeling that everything is an effort | 2.9 | 48.6 | 36.9 | 9.8 | 4.7 | 1.56 | 0.67 | 1.83 | 0.92 | 1.71 | 0.83 | <0.001 | 1.18 |
| 23. Worthless feeling | 2.8 | 81.4 | 12.1 | 4.7 | 1.8 | 1.17 | 0.51 | 1.35 | 0.71 | 1.27 | 0.63 | <0.001 | 0.59 |
| 24. Poor appetite | 2.9 | 83.3 | 11.2 | 3.7 | 1.8 | 1.23 | 0.58 | 1.25 | 0.63 | 1.24 | 0.60 | 0.723 | 0.43 |
| 25. Sleep disturbance | 2.9 | 47.5 | 28.2 | 13.6 | 10.8 | 1.74 | 0.93 | 2.00 | 1.07 | 1.88 | 1.01 | <0.001 | 1.21 |
| Total | 3.1 | 60.9 | 25.9 | 9.0 | 4.2 | 1.42 | 0.64 | 1.69 | 0.82 | 1.57 | 0.76 | <0.001 | |
| Model | X2_SB (df) | p | CFI_SB | TLI_SB | RMSEA (90% CI) | p Close | RMSEA_SB | SRMR | CD |
|---|---|---|---|---|---|---|---|---|---|
| One factor | 1600.3 (275) | <0.001 | 0.828 | 0.812 | 0.079 (0.076–0.083) | <0.001 | 0.061 | 0.059 | 0.931 |
| Two correlated factors | 899.5 (274) | <0.001 | 0.862 | 0.849 | 0.072 (0.068–0.076) | <0.001 | 0.055 | 0.055 | 0.970 |
| Item | One Factor | Two Correlated Factors | |
|---|---|---|---|
| Anxiety | Depression | ||
| 1. Being scared for no reason | 0.45 | 0.49 | |
| 2. Feeling fearful | 0.52 | 0.56 | |
| 3. Faintness | 0.60 | 0.59 | |
| 4. Nervousness | 0.67 | 0.75 | |
| 5. Heart racing | 0.53 | 0.57 | |
| 6. Trembling | 0.43 | 0.48 | |
| 7. Feeling tense | 0.68 | 0.74 | |
| 8. Headache | 0.39 | 0.41 | |
| 9. Feeling panic | 0.40 | 0.44 | |
| 10. Feeling restless | 0.65 | 0.70 | |
| 11. Feeling low in energy | 0.67 | 0.66 | |
| 12. Blaming oneself | 0.57 | 0.58 | |
| 13. Crying easily | 0.51 | 0.50 | |
| 14. Losing sexual interest | 0.51 | 0.52 | |
| 15. Feeling lonely | 0.65 | 0.68 | |
| 16. Feeling hopeless | 0.61 | 0.65 | |
| 17. Feeling blue | 0.82 | 0.84 | |
| 18. Thinking of ending one’s life | 0.43 | 0.44 | |
| 19. Feeling trapped | 0.60 | 0.62 | |
| 20. Worrying too much | 0.58 | 0.56 | |
| 21. Feeling no interest | 0.62 | 0.65 | |
| 22. Feeling that everything is an effort | 0.68 | 0.69 | |
| 23. Worthless feeling | 0.53 | 0.56 | |
| 24. Poor appetite | 0.30 | 0.30 | |
| 25. Sleep disturbance | 0.48 | 0.47 | |
| Factor correlation | 0.84 | ||
| Calculated for | Index | Male (n = 341) | Female (n = 395) | Total (n = 736) | ||||||
|---|---|---|---|---|---|---|---|---|---|---|
| Value | CI 95%, Lower Limit | CI 95%, Upper Limit | Value | CI 95%, Lower Limit | CI 95%, Upper Limit | Value | CI 95%, Lower Limit | CI 95%, Upper Limit | ||
| Original cutoff, 1.75 | Sensitivity | 87.5 | 61.7 | 98.4 | 88.4 | 74.9 | 96.1 | 88.1 | 77.1 | 95.1 |
| Specificity | 86.8 | 82.6 | 90.3 | 67.3 | 62.2 | 72.2 | 76.7 | 73.3 | 79.8 | |
| PPV | 24.6 | 14.1 | 37.8 | 18.3 | 12.5 | 25.4 | 24.8 | 19.1 | 31.2 | |
| NPV | 99.3 | 97.5 | 99.9 | 97.9 | 95.2 | 99.3 | 98.7 | 97.3 | 99.5 | |
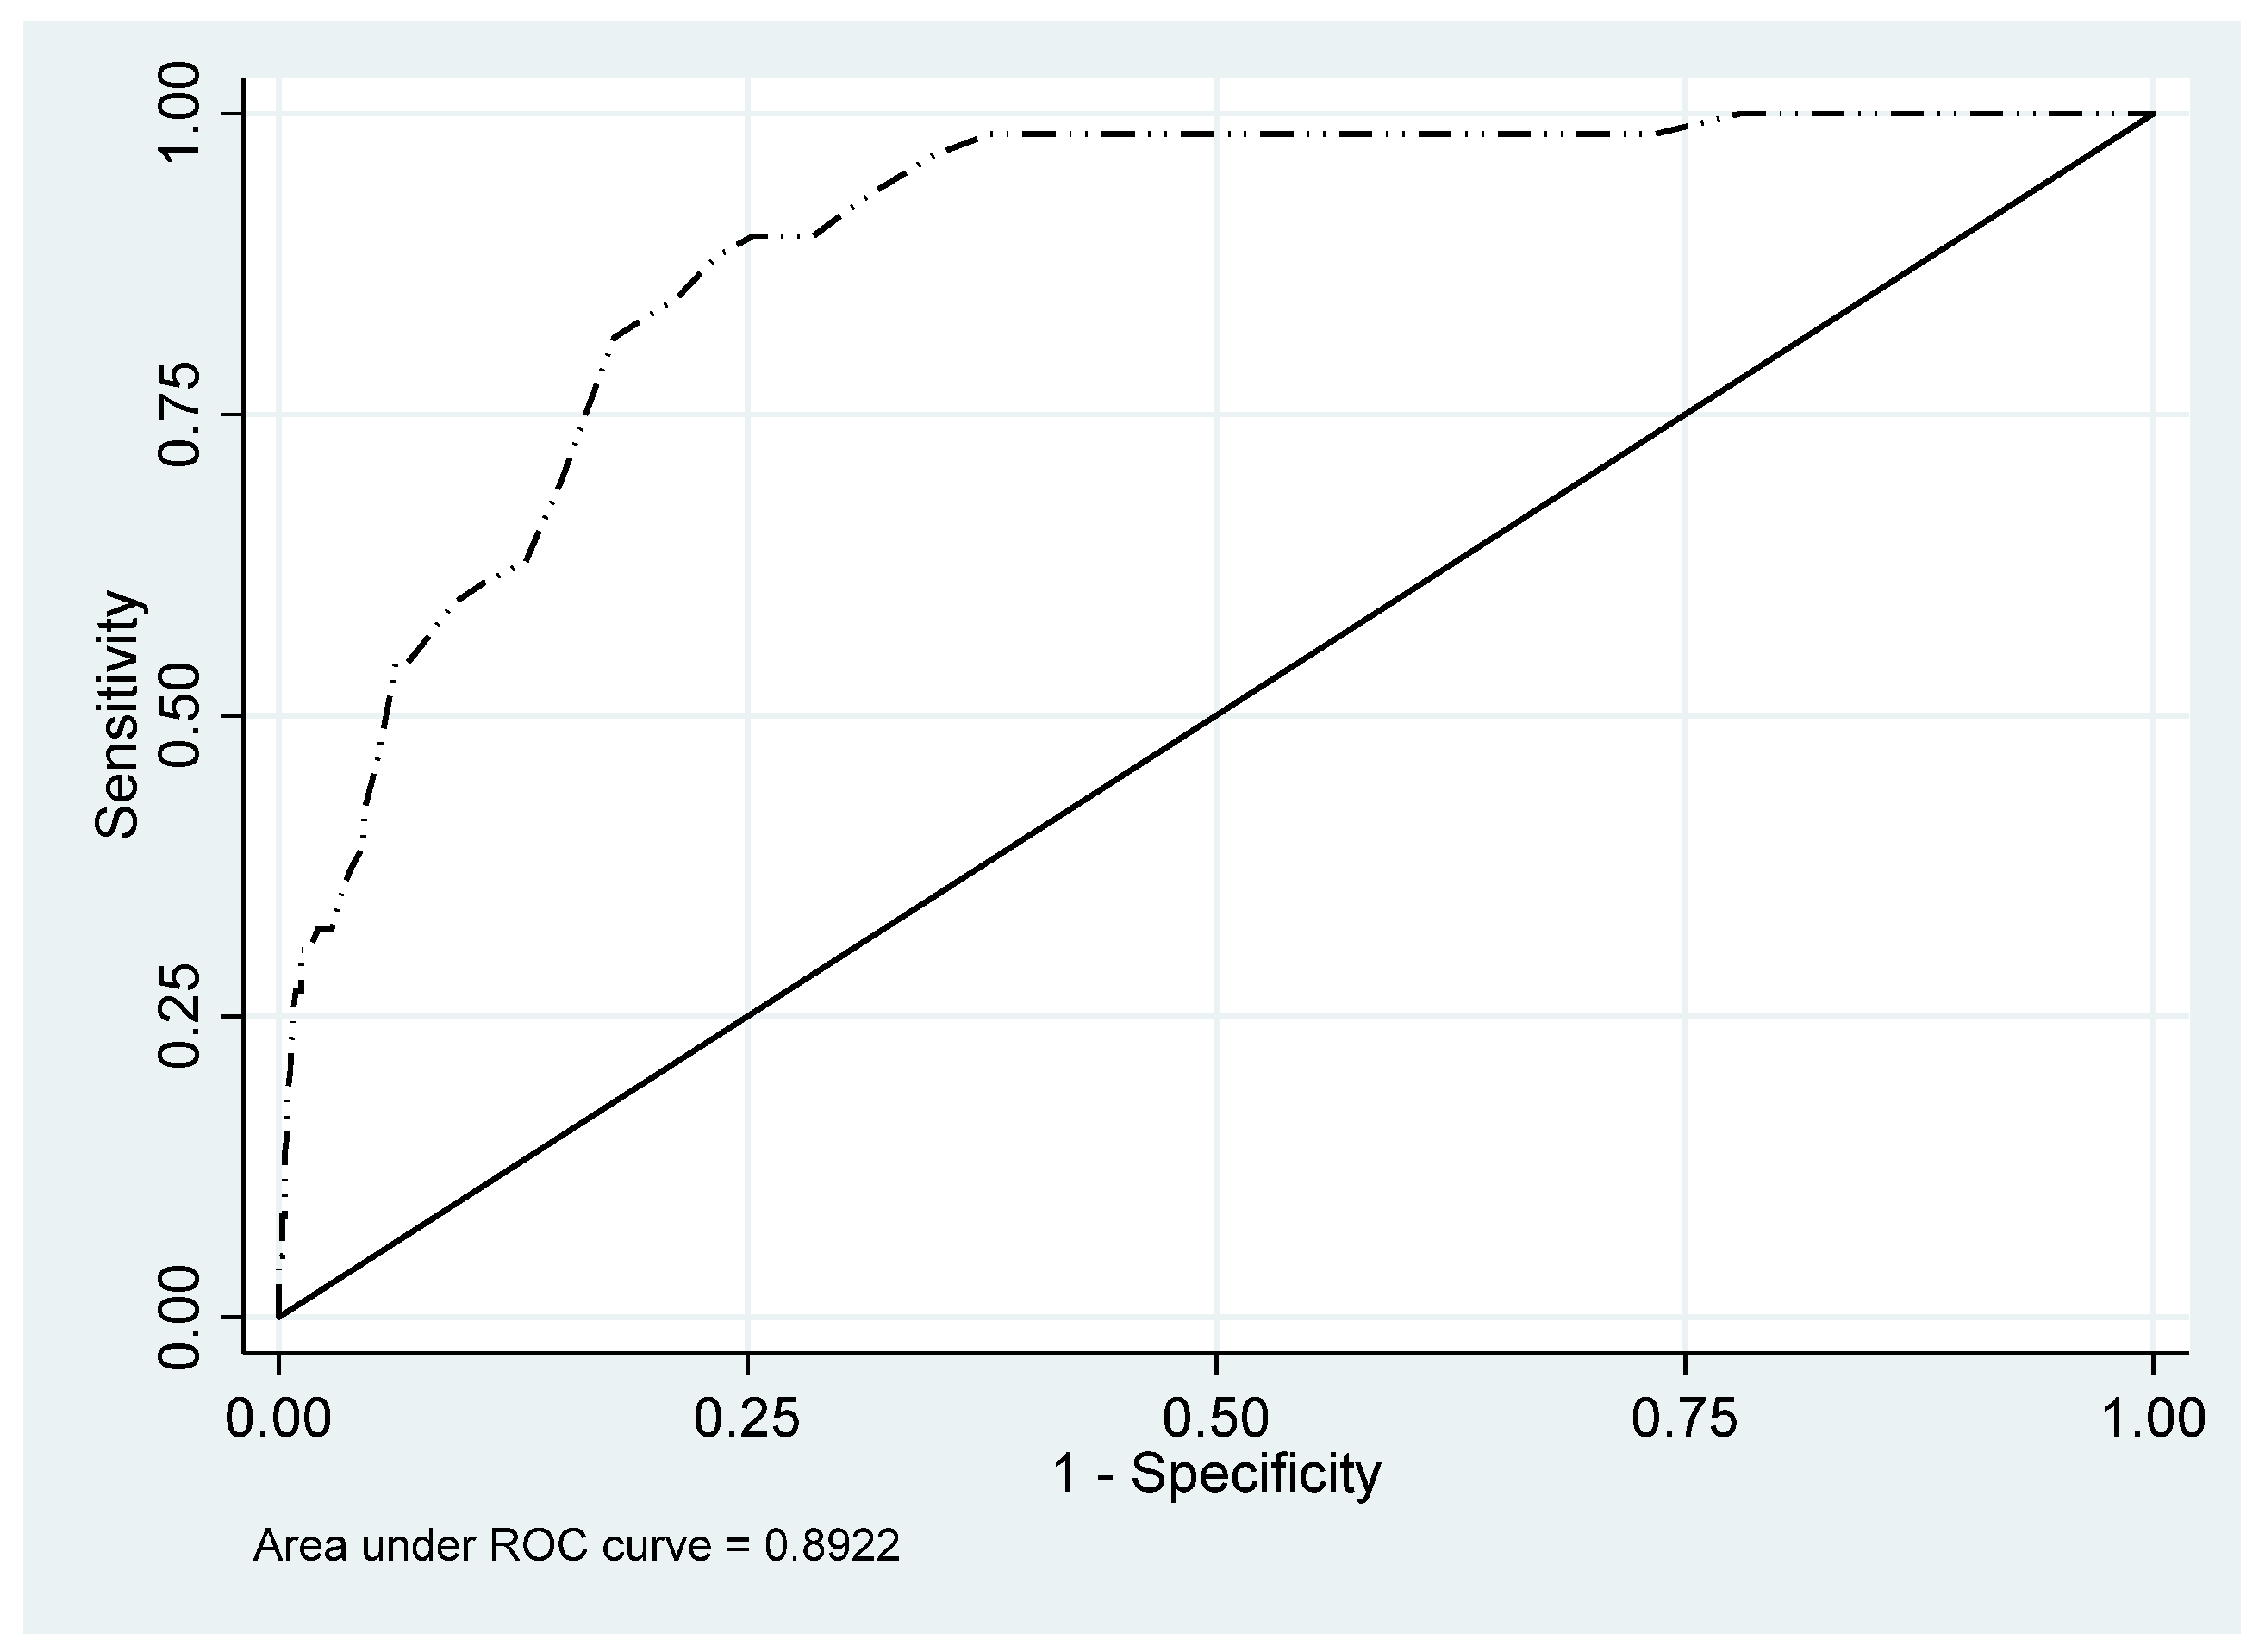
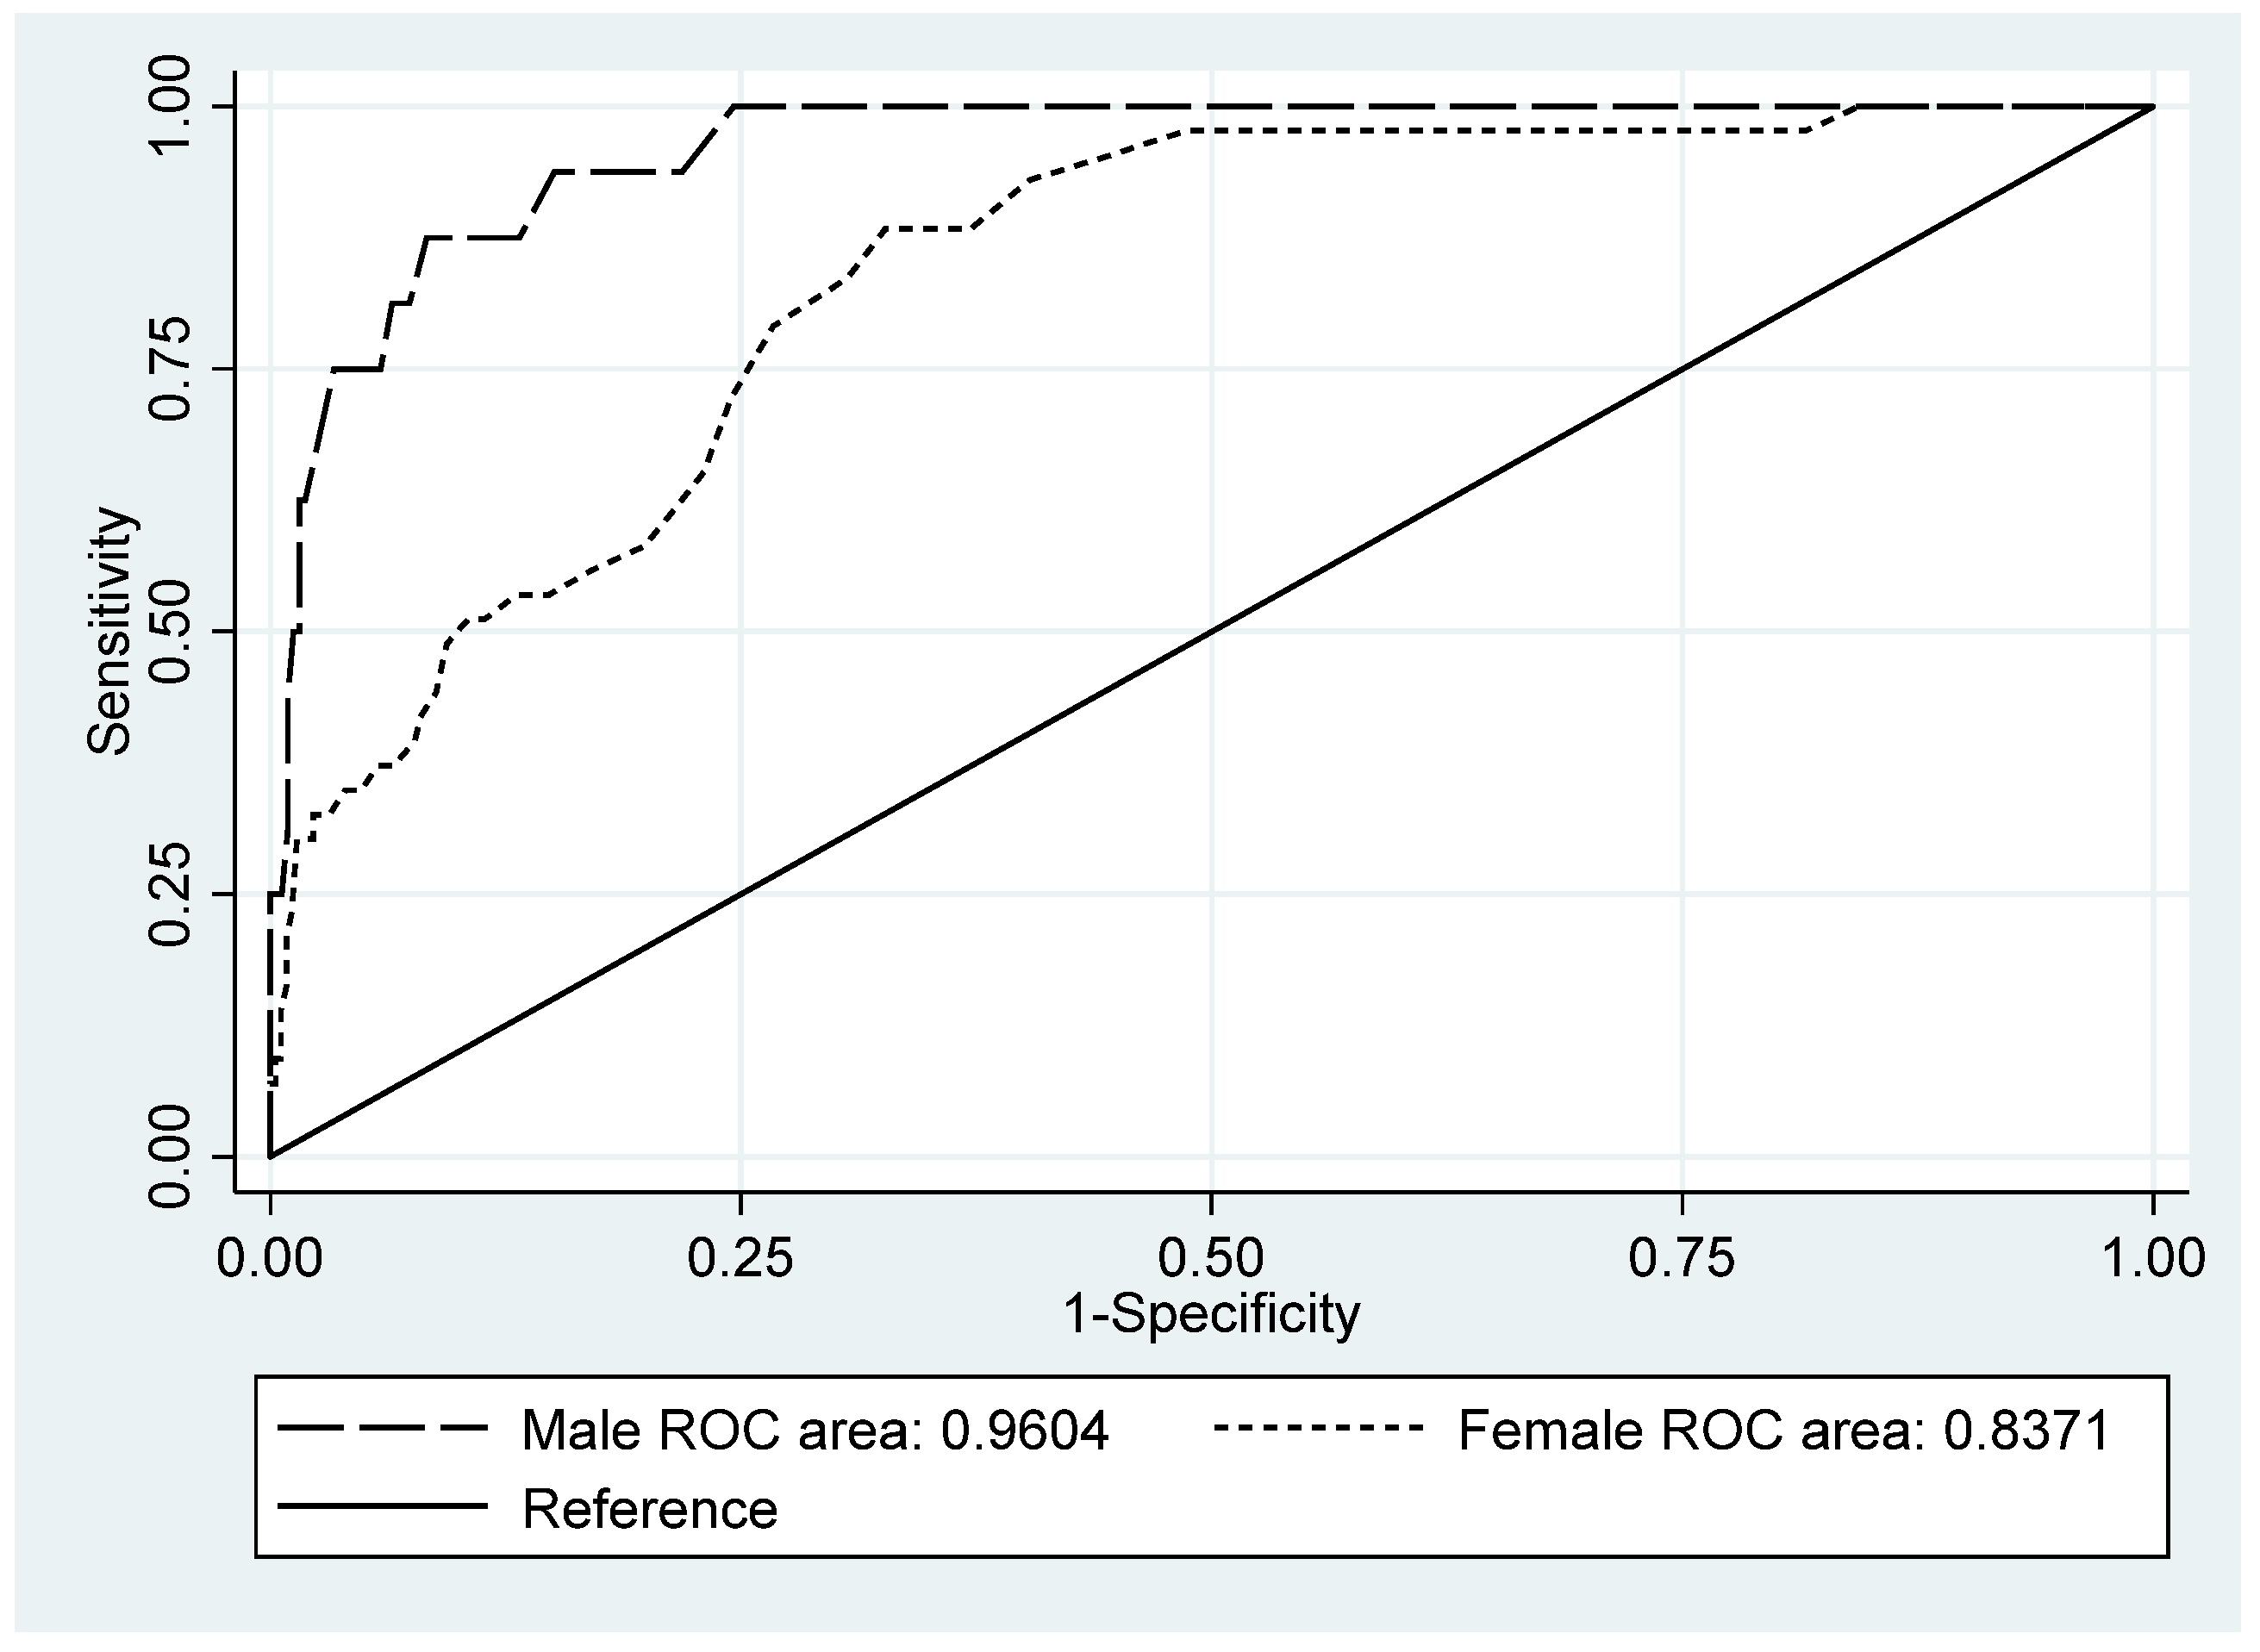
| AUC | 0.960 | 0.927 | 0.994 | 0.837 | 0.781 | 0.893 | 0.892 | 0.856 | 0.928 | |
| Optimal cutoff point | 1.84 | 1.76 | 1.76 | |||||||
| Optimal cutoff point | Sensitivity | 87.5 | 61.7 | 98.4 | 83.7 | 69.3 | 93.2 | 84.7 | 73.0 | 92.8 |
| Specificity | 91.7 | 88.1 | 94.5 | 69.3 | 64.2 | 74.1 | 78.7 | 75.5 | 81.8 | |
| PPV | 34.1 | 20.1 | 50.6 | 25.0 | 18.2 | 32.9 | 25.8 | 19.8 | 32.5 | |
| NPV | 99.3 | 97.6 | 99.9 | 97.2 | 94.3 | 98.9 | 98.3 | 96.9 | 99.2 | |
| Item | Item-Total Correlation | Cronbach’s Alpha | R2 |
|---|---|---|---|
| 1. Being scared for no reason | 0.4466 | 0.9148 | 0.3697 |
| 2. Feeling fearful | 0.5140 | 0.9137 | 0.4154 |
| 3. Faintness | 0.5724 | 0.9127 | 0.4640 |
| 4. Nervousness | 0.6545 | 0.9109 | 0.5250 |
| 5. Heart racing | 0.5172 | 0.9136 | 0.3657 |
| 6. Trembling | 0.4226 | 0.9151 | 0.3413 |
| 7. Feeling tense | 0.6536 | 0.9109 | 0.5220 |
| 8. Headache | 0.3760 | 0.9163 | 0.2462 |
| 9. Feeling panic | 0.3907 | 0.9156 | 0.2939 |
| 10. Feeling restless | 0.6206 | 0.9117 | 0.4805 |
| 11. Feeling low in energy | 0.6472 | 0.9110 | 0.5439 |
| 12. Blaming oneself | 0.5454 | 0.9131 | 0.3385 |
| 13. Crying easily | 0.4881 | 0.9145 | 0.2909 |
| 14. Losing sexual interest | 0.4832 | 0.9153 | 0.2866 |
| 15. Feeling lonely | 0.5973 | 0.9121 | 0.4857 |
| 16. Feeling hopeless | 0.5728 | 0.9127 | 0.4842 |
| 17. Feeling blue | 0.7799 | 0.9085 | 0.6677 |
| 18. Thinking of ending one’s life | 0.4033 | 0.9159 | 0.2747 |
| 19. Feeling trapped | 0.5577 | 0.9129 | 0.4085 |
| 20. Worrying too much | 0.5592 | 0.9129 | 0.3770 |
| 21. Feeling no interest | 0.5752 | 0.9129 | 0.4460 |
| 22. Feeling that everything is an effort | 0.6432 | 0.9112 | 0.5494 |
| 23. Worthless feeling | 0.4995 | 0.9140 | 0.3552 |
| 24. Poor appetite | 0.3065 | 0.9167 | 0.1568 |
| 25. Sleep disturbance | 0.4747 | 0.9152 | 0.2776 |
| Total | 0.9166 | ||
| Anxiety subscale (items 1–10) | 0.8306 | ||
| Depression subscale (items 11–25) | 0.8784 |
Publisher’s Note: MDPI stays neutral with regard to jurisdictional claims in published maps and institutional affiliations. |
© 2021 by the authors. Licensee MDPI, Basel, Switzerland. This article is an open access article distributed under the terms and conditions of the Creative Commons Attribution (CC BY) license (https://creativecommons.org/licenses/by/4.0/).
Share and Cite
Rodríguez-Barragán, M.; Fernández-San-Martín, M.I.; Clavería-Fontán, A.; Aldecoa-Landesa, S.; Casajuana-Closas, M.; Llobera, J.; Oliván-Blázquez, B.; Peguero-Rodríguez, E. Validation and Psychometric Properties of the Spanish Version of the Hopkins Symptom Checklist-25 Scale for Depression Detection in Primary Care. Int. J. Environ. Res. Public Health 2021, 18, 7843. https://doi.org/10.3390/ijerph18157843
Rodríguez-Barragán M, Fernández-San-Martín MI, Clavería-Fontán A, Aldecoa-Landesa S, Casajuana-Closas M, Llobera J, Oliván-Blázquez B, Peguero-Rodríguez E. Validation and Psychometric Properties of the Spanish Version of the Hopkins Symptom Checklist-25 Scale for Depression Detection in Primary Care. International Journal of Environmental Research and Public Health. 2021; 18(15):7843. https://doi.org/10.3390/ijerph18157843
Chicago/Turabian StyleRodríguez-Barragán, María, María Isabel Fernández-San-Martín, Ana Clavería-Fontán, Susana Aldecoa-Landesa, Marc Casajuana-Closas, Joan Llobera, Bárbara Oliván-Blázquez, and Eva Peguero-Rodríguez. 2021. "Validation and Psychometric Properties of the Spanish Version of the Hopkins Symptom Checklist-25 Scale for Depression Detection in Primary Care" International Journal of Environmental Research and Public Health 18, no. 15: 7843. https://doi.org/10.3390/ijerph18157843
APA StyleRodríguez-Barragán, M., Fernández-San-Martín, M. I., Clavería-Fontán, A., Aldecoa-Landesa, S., Casajuana-Closas, M., Llobera, J., Oliván-Blázquez, B., & Peguero-Rodríguez, E. (2021). Validation and Psychometric Properties of the Spanish Version of the Hopkins Symptom Checklist-25 Scale for Depression Detection in Primary Care. International Journal of Environmental Research and Public Health, 18(15), 7843. https://doi.org/10.3390/ijerph18157843