Article

Correlation between Elderly Migrants’ Needs and Environmental Adaptability: A Discussion Based on Human Urbanization Features

Institute of Architectural Design and Theoretical Research, Zhejiang University, Hangzhou 310000, China
*
Author to whom correspondence should be addressed.
Int. J. Environ. Res. Public Health 2021, 18(10), 5068; https://doi.org/10.3390/ijerph18105068
Submission received: 11 March 2021 / Revised: 4 May 2021 / Accepted: 7 May 2021 / Published: 11 May 2021

Abstract

:
Building concentrated resettlement community in small towns is mostly used to deal with resettlement construction for rural migrants in economically developed regions in China, which leads to migrants’ living environment changing from rural settlements where production and living are intertwined to an urban community that only supports living functions. However, the urbanized environment is contrary to elderly migrants’ behavior, resulting in contradictions or conflicts between migrants and resettlement communities, reflecting a lack of urbanization synchronization between migrants and resettlement community environments. Further, elderly migrants are also equipped with different degrees and types of urbanization characteristics, thus reflecting different abilities to adapt to the urban community environment. Based on the corresponding relationship between people’s different production and living needs and urbanization, this research starts by investigating the production and living needs of elderly migrants, and further clarifies the environmental adaptability of elderly migrants by sorting the types and characteristics of urbanization of elderly migrants to provide a reference basis for the planning and construction of future resettlement areas. The research uses questionnaires and semi-structured interviews to investigate the population attributes and characteristics of elderly migrants, as well as their different needs for production and living. The research uses hierarchical cluster analysis, the one-way ANOVA test and Chi-square test to constructed a four-quadrant model on human urbanization features: an Urban Group with both living and production urbanized (Group H-H); a Half-urban-half-rural Group with only living needs urbanized (Group H-L); a Half-urban-Half-rural Group with only production needs urbanized (Group L-H); and a Rural group with both living and production needs not urbanized (Group L-L). Finally, based on the results, this research proposed three elderly environment construction orientations of “Promote the Supply Level of Urban Public Services”, “Create a Place That Embodies the Spirit of Immigrants’ Homeland”, and “Moderate Consideration of Agricultural Production Needs” for residential planning.

1. Introduction

Facing development-forced displacement and resettlement brought about by project construction and ecological exploitation during the new urbanization period, China has conducted diverse forms of urbanization resettlement practices in areas having different economic development levels [1,2,3,4]. For example, its economically developed regions, represented by the Yangtze River Delta, mostly build urban-mode resettlement communities in small towns because of high urbanization and land scarcity. There, China promotes non-agricultural production resettlement for migrants through technical training or industrial park construction due to loss of land. Migrants’ living space is transformed from villages on rural collective land to resettlement communities on urban residential land, where public services follow urban community standards, while non-agricultural production activities are located outside resettlement areas. As a result, resettlement communities support only living activities. This resettlement method has already reached the “environment” of urbanization in terms of natural land, planning modes, spatial patterns, and preset production methods.
However, due to elderly migrants’ production and living habits, rural traditions, and high degree of aging, there is a disconnect between the urbanized environment and elderly migrants’ behavior. Firstly, elderly migrants are mainly engaged in primitive agriculture before relocation, which makes elderly migrants lack experience and skills to earn a living in towns. Secondly, the village spatial structure presents organically intertwined production- and living-functions, leading to a huge difference in environmental perception and usage patterns between elderly migrants and urban residents [5,6,7]. Some studies have found a widespread “adapted use” phenomenon in resettlement communities, meaning living space is “occupied and transformed by rural-like living activities” and “requisitioned for production activities,” resulting in contradictions or conflicts between migrants’ needs and resettlement communities’ planning and control [8]. This runs contrary to the principle of “people-centered” development, reflecting a lack of urbanization synchronization between migrants and resettlement community environments.
Focusing on the problem that the environment is not synchronized with human beings in urbanization, existing studies are mostly based on the environment and tend to change people’s production and lifestyles to adapt to urbanization environment transformation, for instance, to cultural adaptation [9,10], social integration [11], ecological dependence [12], and so on. With popularization of the people-centered concept in Chinese society, studies have gradually turned to achieving mutual coordination between the environment and people by regulating the “environment”, in this case, through spatial production theory that explains processes and mechanisms of how external factors such as power, capital, and social class influence the environment. However, environmental-behavior theory posits that people’s cognitive characteristics, as an internal factor, play a more important role in environmental regulation [13,14]. In the process of Chinese urbanization, the object of this study—elderly migrants—is also evolving gradually because individual features lead to different abilities to adapt to the urban community environment, thus reflecting different degrees and types of urbanization characteristics. Therefore, clarifying correlation between cognitive characteristics and elderly migrants’ environmental adaptability is necessary, when taking human beings’ urbanization characteristics as a pre-condition of resettlement community planning and providing a theoretical basis for a new “people-centered” urbanization resettlement strategy.

2. Literature Review and Research Methods

2.1. Extraction of Urbanization Indicators for Elderly Migrants

Different from the view taking the mutual coordination between human and environment as the standard of one’s environmental adaptability in classic environmental behavior research, in the urbanization development background with strong top-down government intervention in China, the environment is regarded as a fixed feature, and the degree of one affected by environment, or the degree of urbanization, reflects one’s environment adaptability [15]. Academic research on human urbanization covers many fields, but traditional studies have focused on the household registration (hukou) system and the urban status of migrant people [16]. In recent years, the issue of human cognitive differences has also gradually gained attention [17]; for example, public health service utilization [18], educational assortative mating in marriage [19], and risk information-seeking behavior [20]. Through a literature review, this study found that elderly migrants reflect various cognitive characteristics of production and living needs. However, current studies on elderly migrants’ needs focus mainly on certain aspects of living, such as medical care and leisure, but take production participation as only a content of life experience [21]. This study attends not only to living needs reflected by “encroachment and transformation of living space in rural areas” but also to production needs reflected by “directional expropriation of living space for production activities [8].” Therefore, a dual-dimensional demand system of production and living is constructed as an evaluation criterion to measure elderly migrants’ characteristics of urbanization.
For living needs, the Chinese government has established a rights-protection system for the elderly through the Law on Protection of the Elderly’s Rights and Interests, which emphasizes living care, health care, lifelong education, social participation, and spiritual support [22]. From the perspective of equity, urbanization resettlement guarantees elderly migrants’ rights to access public services, for example, basic medical care and livelihood security [23,24]. With improved living standards, some elderly migrants have changed their lifestyle to “urban elderly” and begun to pursue all aspects of high-quality public services [25,26]. In addition, elderly migrants also seek spiritual satisfaction in collective activities and neighborhood interaction through rural traditions [27,28]. Therefore, this paper proposes “health care,” “living care,” “cultural entertainment,” and “spiritual consolation” to construct a living needs system for elderly migrants.
On production needs, compared with a single-agriculture model in their original villages, elderly migrants in resettlement communities adopt a compound-production model based on agriculture but supplemented by handicrafts, self-employment, labor hire, and other industrial and commercial activities. Although urbanization promotes transfer of rural surplus labor to secondary and tertiary industries [29], elderly migrants universally lack urban livelihood skills due to limitations on working abilities and low educational levels [30,31]. This means that only a few elderly migrants can increase their personal incomes through industrial and commercial activities, while others are still accustomed to agricultural production methods, resulting in frequent agricultural use of public space in resettlement communities. Therefore, this paper proposes “agriculture” as well as “handmade and business” to describe elderly migrants’ production-needs system.

2.2. Evaluation and Investigation of Environmental Adaptability

2.2.1. Sample

This study intended to find a resettlement community where migrants’ adaptation and transformation to an urban environment have stabilized. In the Reservoir-L project in Zhejiang Province, the government adopted centralized resettlement for surrounding farmers, selected residential land in Town-D, and built Community-L in 2007. Community-L is constructed as an apartment block combined with some shops on side streets [8,32]. Migrants’ adaptation to the urban environment tends to be stable, and various rural behaviors are presented, thus meeting this study’s requirements. For evaluation of the degree of human urbanization, a questionnaire was designed to collect data on production and living needs, with 24 indicators in six dimensions (Table 1). Each indicator was evaluated using a 5-point Likert scale, which is widely used in social surveys to understand the degree of agreement or disagreement with a set of statements related to the measurement subject, with the degree of needs gradually increasing from 1 to 5 [33].
In China, most people are considered elderly at 55 years old, influenced by women’s retirement policy, so this study conducted a questionnaire survey for those 55 and over. In addition, other research has found that age, gender, health status, financial status, marital status, labor ability, and educational level will influence the environmental adaptability [34,35]. Therefore, this study proposes eight dimensions: age, gender, physical condition, pension, housing condition, marital status, work capacity, and educational level, to evaluate the demographic characteristics of the interviewees.

2.2.2. Investigation Process

The official data shows that there are about 300 elderly migrants over 55 years old living in Community-L, which including two types of more active and more disabled. The first one’s main daily activities are walking, chatting, and working in the community, and their need is more comprehensive with medical care, economy, entertainment, dignity, and value realization. The second one’s main activities are limited to the indoor space due to the limitations of cognitive and activity ability [36,37]. Because this research is aimed at a more comprehensive survey of production and living needs at community level, the more disabled elderly are excluded, and the more active elderly who can independently active in public space are included. The survey was conducted in a working day and a rest day in early July 2018, when the weather conditions were suitable for outdoor activities for the elderly, by a 12-person research team. The investigator randomly approached the elderly by walking within a designated area. Due to elderly migrants’ low overall literacy and low prevalence of Mandarin in Town-D, any respondent who failed to understand the questionnaire after repeated communication was eliminated by the investigator on the spot. Among the 120 questionnaires collected, 4 questionnaires with incomplete information were removed and 116 questionnaires were obtained. Table 2 displays distribution of sample population attributes.

2.3. Analytical Framework

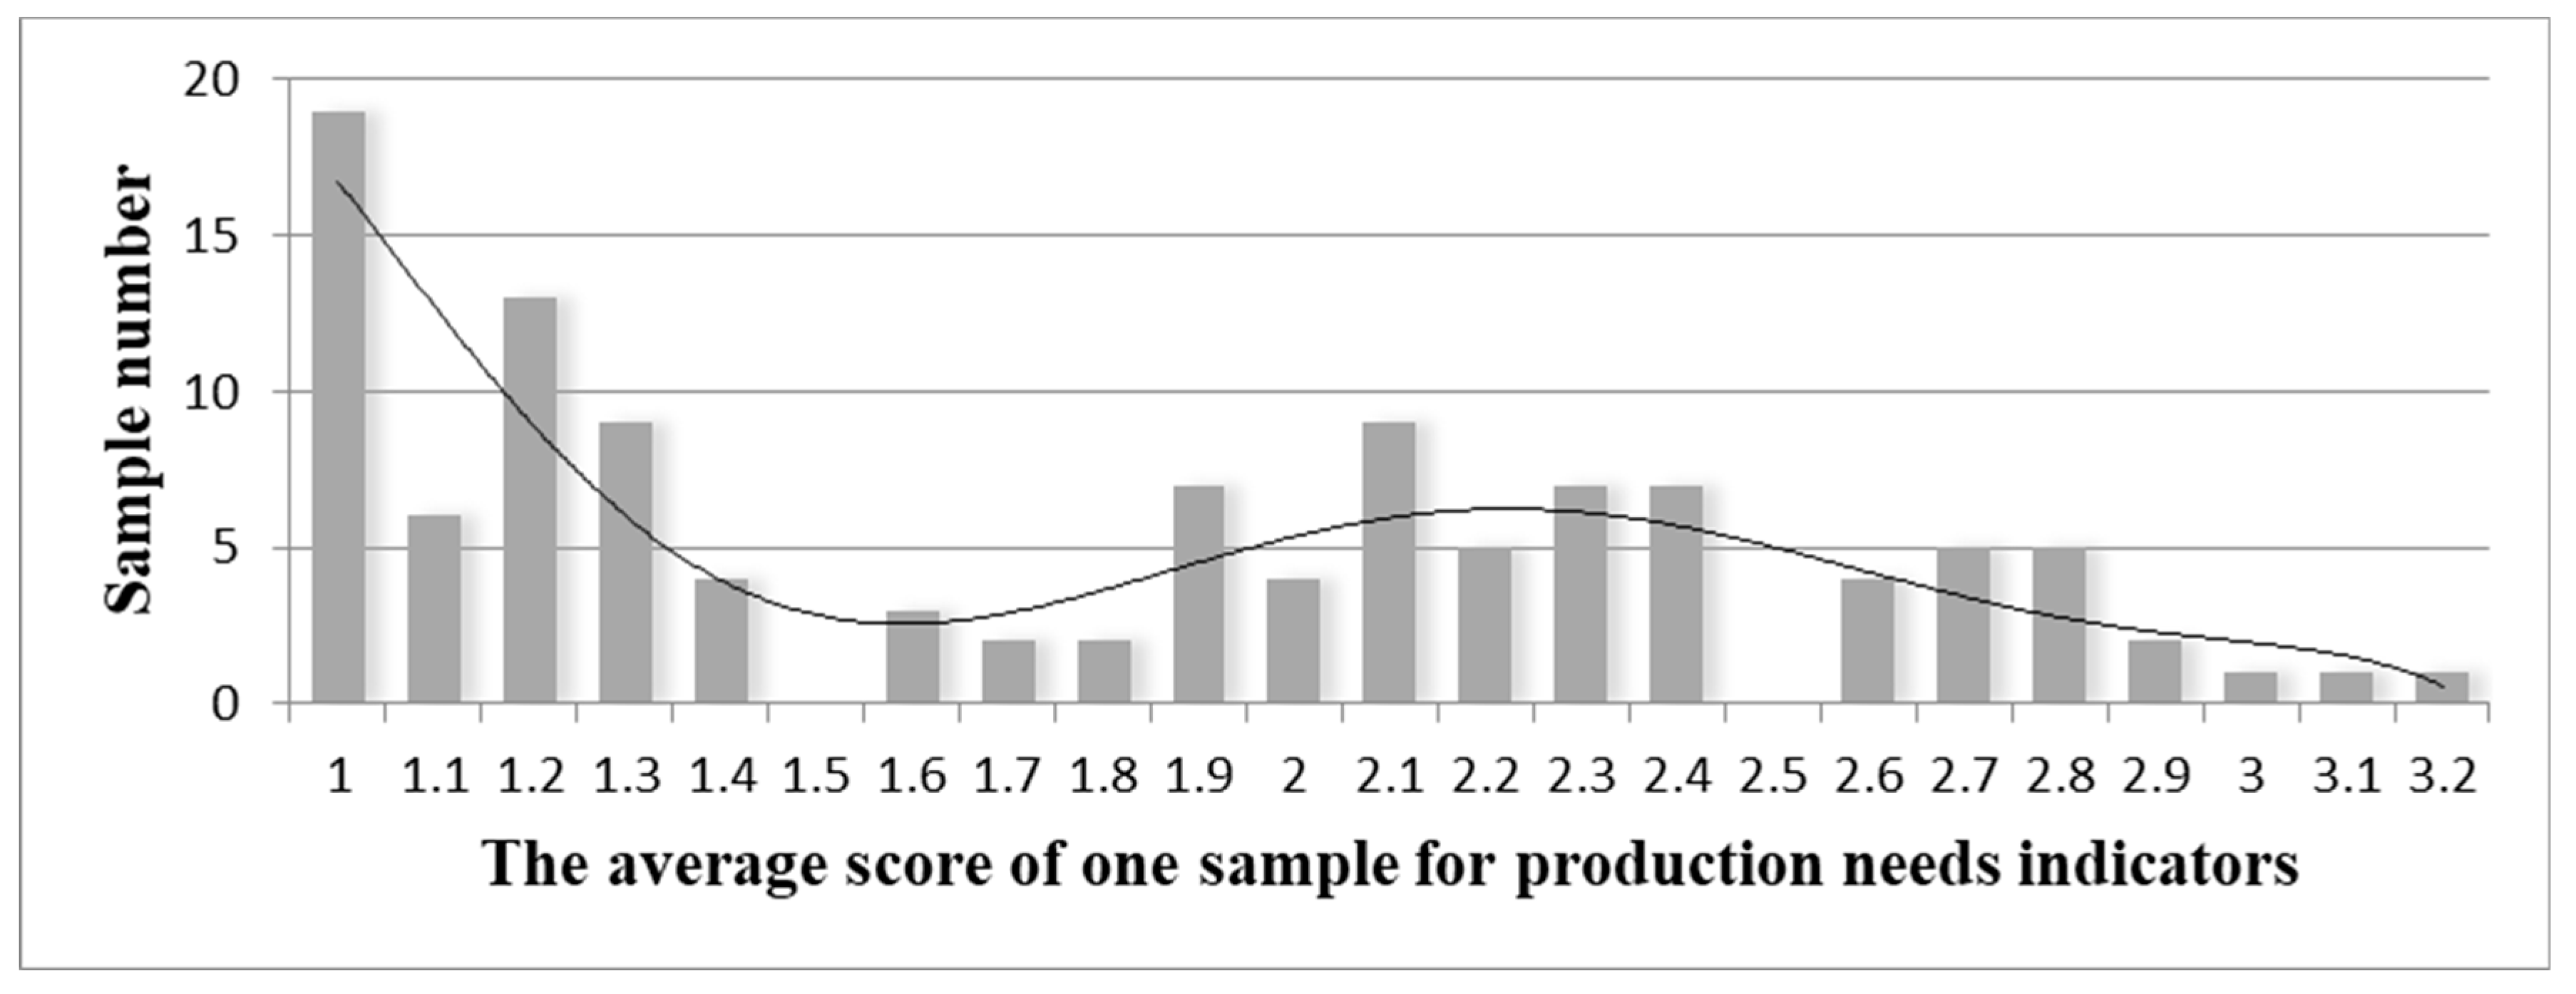
The study begins with frequency distribution of the 116 samples’ average scores for production—and living-needs characteristics (Figure 1 and Figure 2). The average score represents the sample’s urgency for the needs. Living needs reflects a low-need sample set within the range of 1.8–2.3 and a high-need sample set within the range of 2.4–3.9. Production needs reflects a low-need sample set within the range of 1–1.5 and a high-need sample set within the range of 1.6–3.2. Since a single indicator’s average score cannot describe the sample’s pattern of urbanization characteristics, the study requires still more in-depth statistical analysis.
The distribution based on the average score of one sample suggests that there are two categories of high need and low need both in production and living dimensions, which means it is necessary to classify and discuss the sample. To explore further comprehensive differences in production- and living-needs indicators among urbanization samples, the study designed an analytical framework, with calculation steps of hierarchical cluster analysis, one-way ANOVA test and Chi-square test performed by SPSS 23.0 (IBM Corporation, Armonk, NY, USA) for Windows and calculation results judged statistically significant at p < 0.05:
  • Using hierarchical cluster analysis, which can classify samples according to the closeness degree without prior knowledge; with squared Euclidean distance and between-groups linkage, samples were respectively divided into two groups according to production and living need indicators. Taking the one-way ANOVA test, which can find whether the different levels of a control variable have a significant impact on the observed variable, to find need indicators with significant differences; comparing the average scores of the indicators with significant differences to determine which group is urbanized respectively in living and production dimension, and to assign urbanized values to the samples.
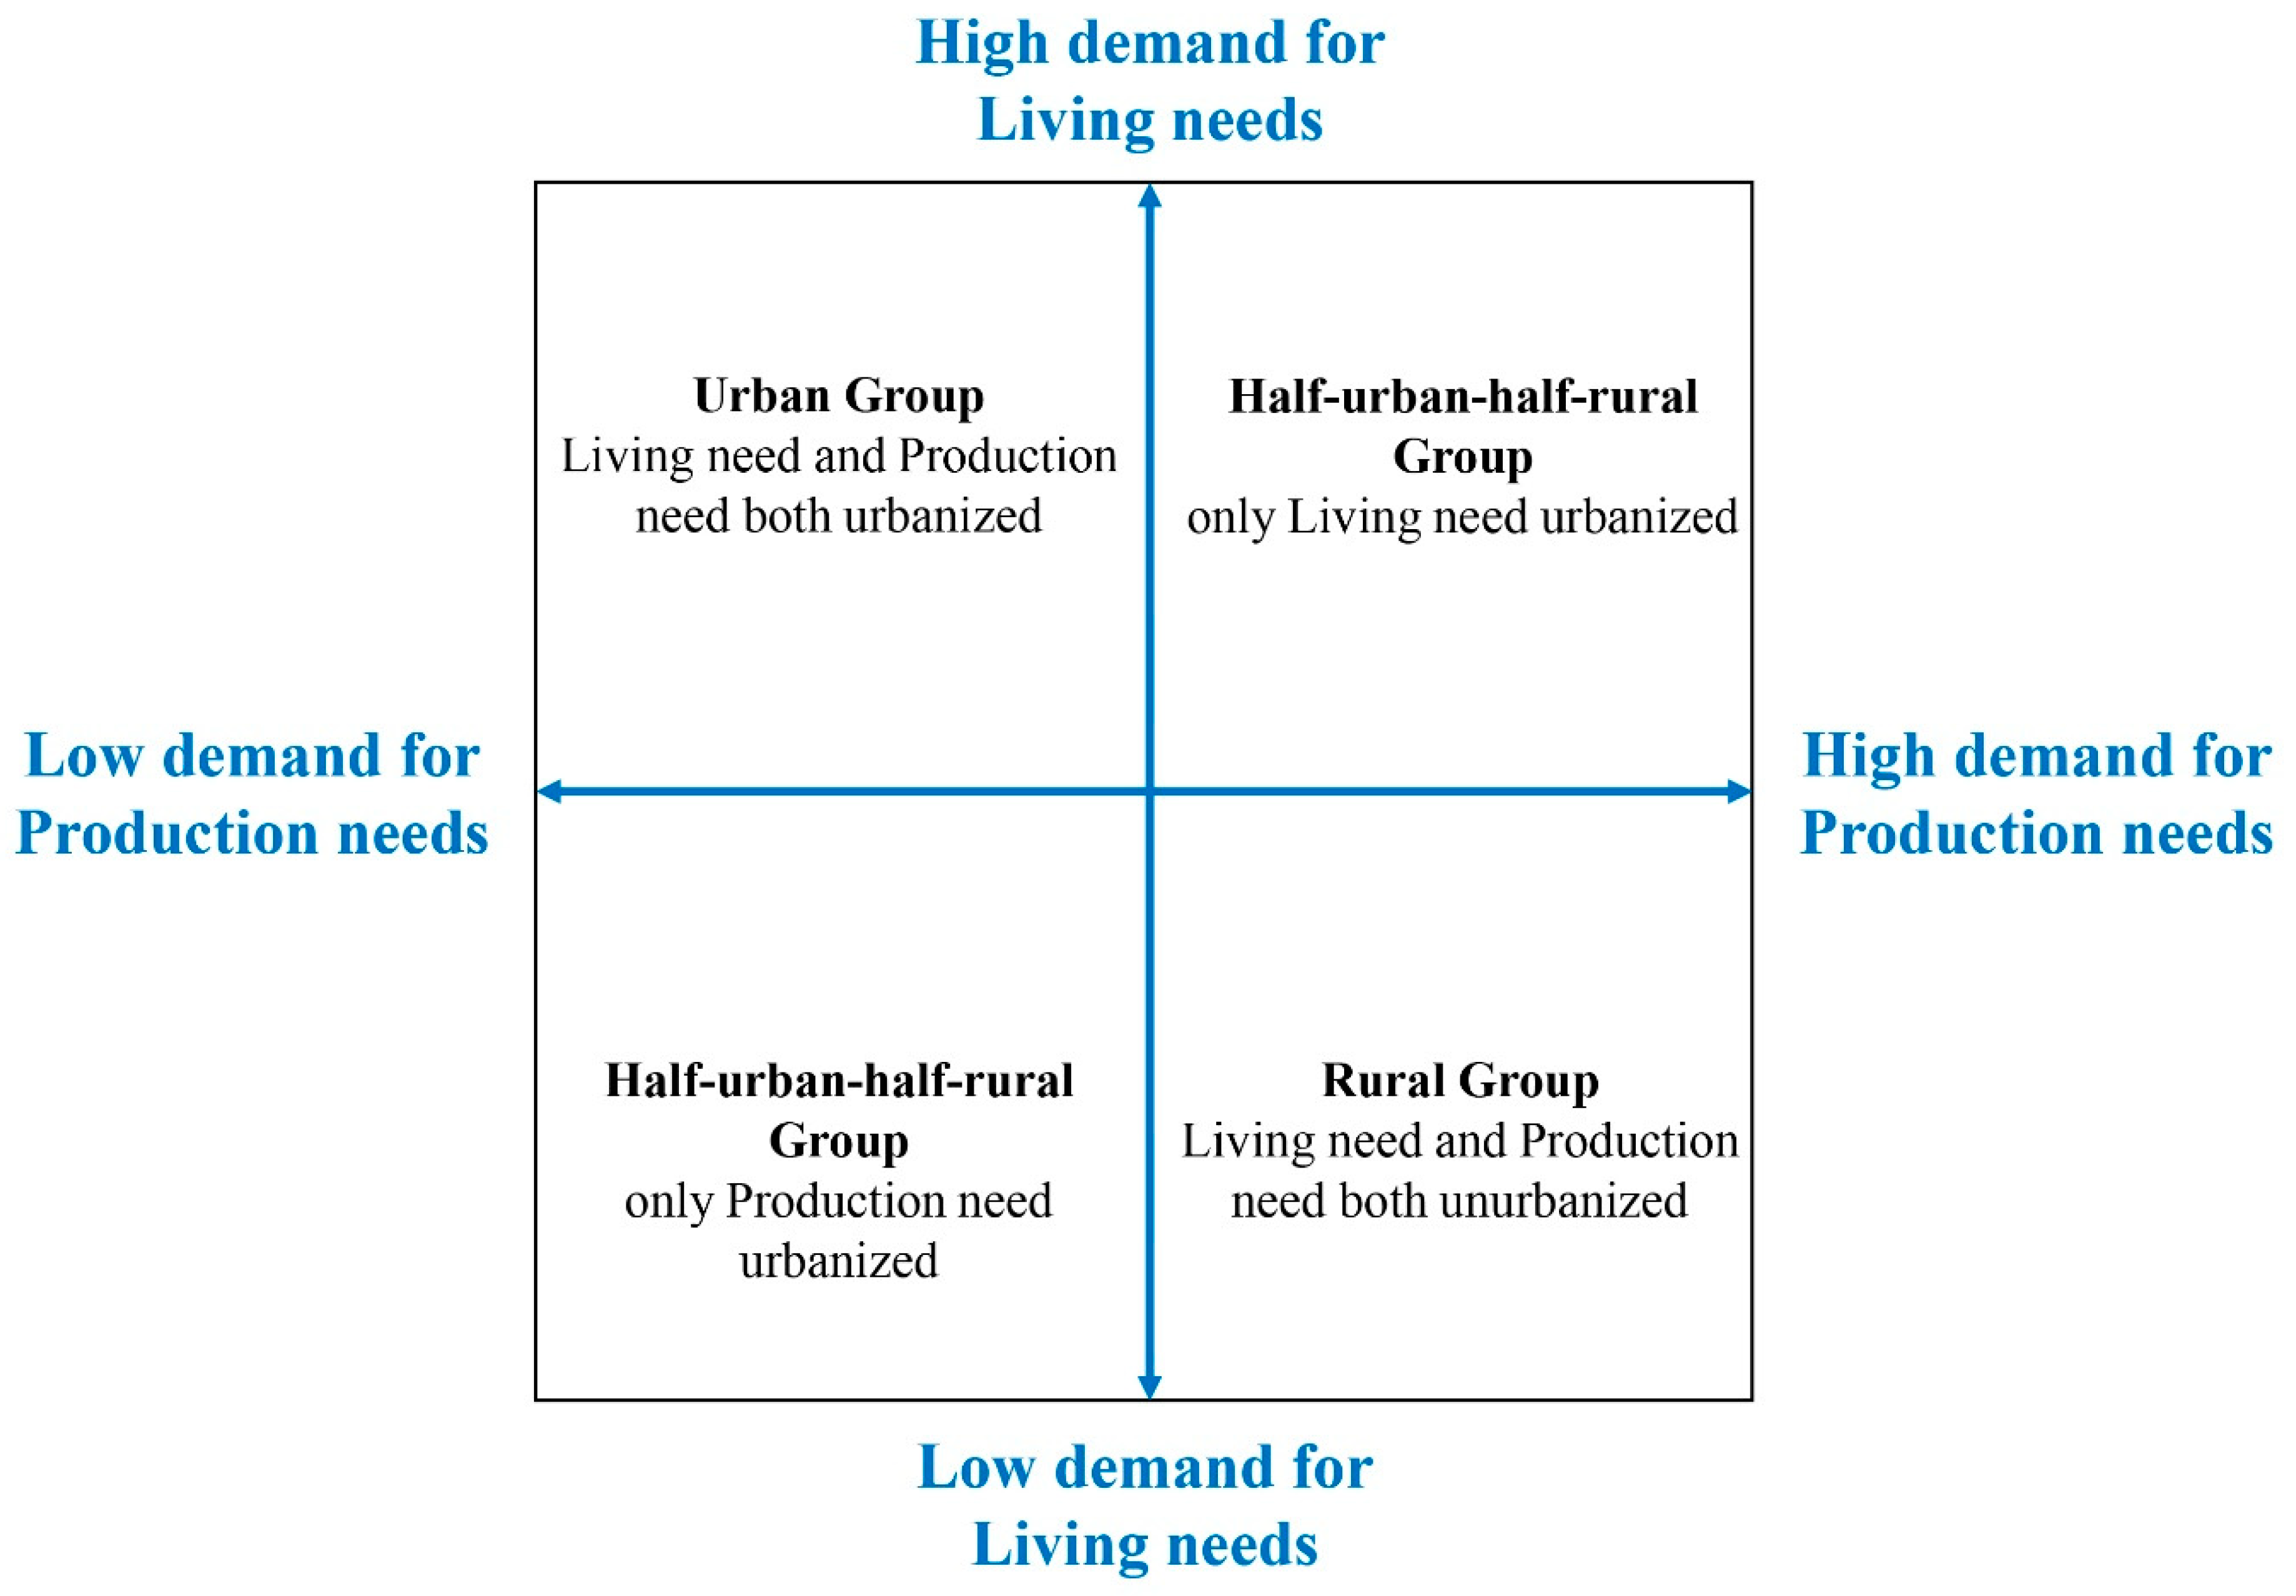
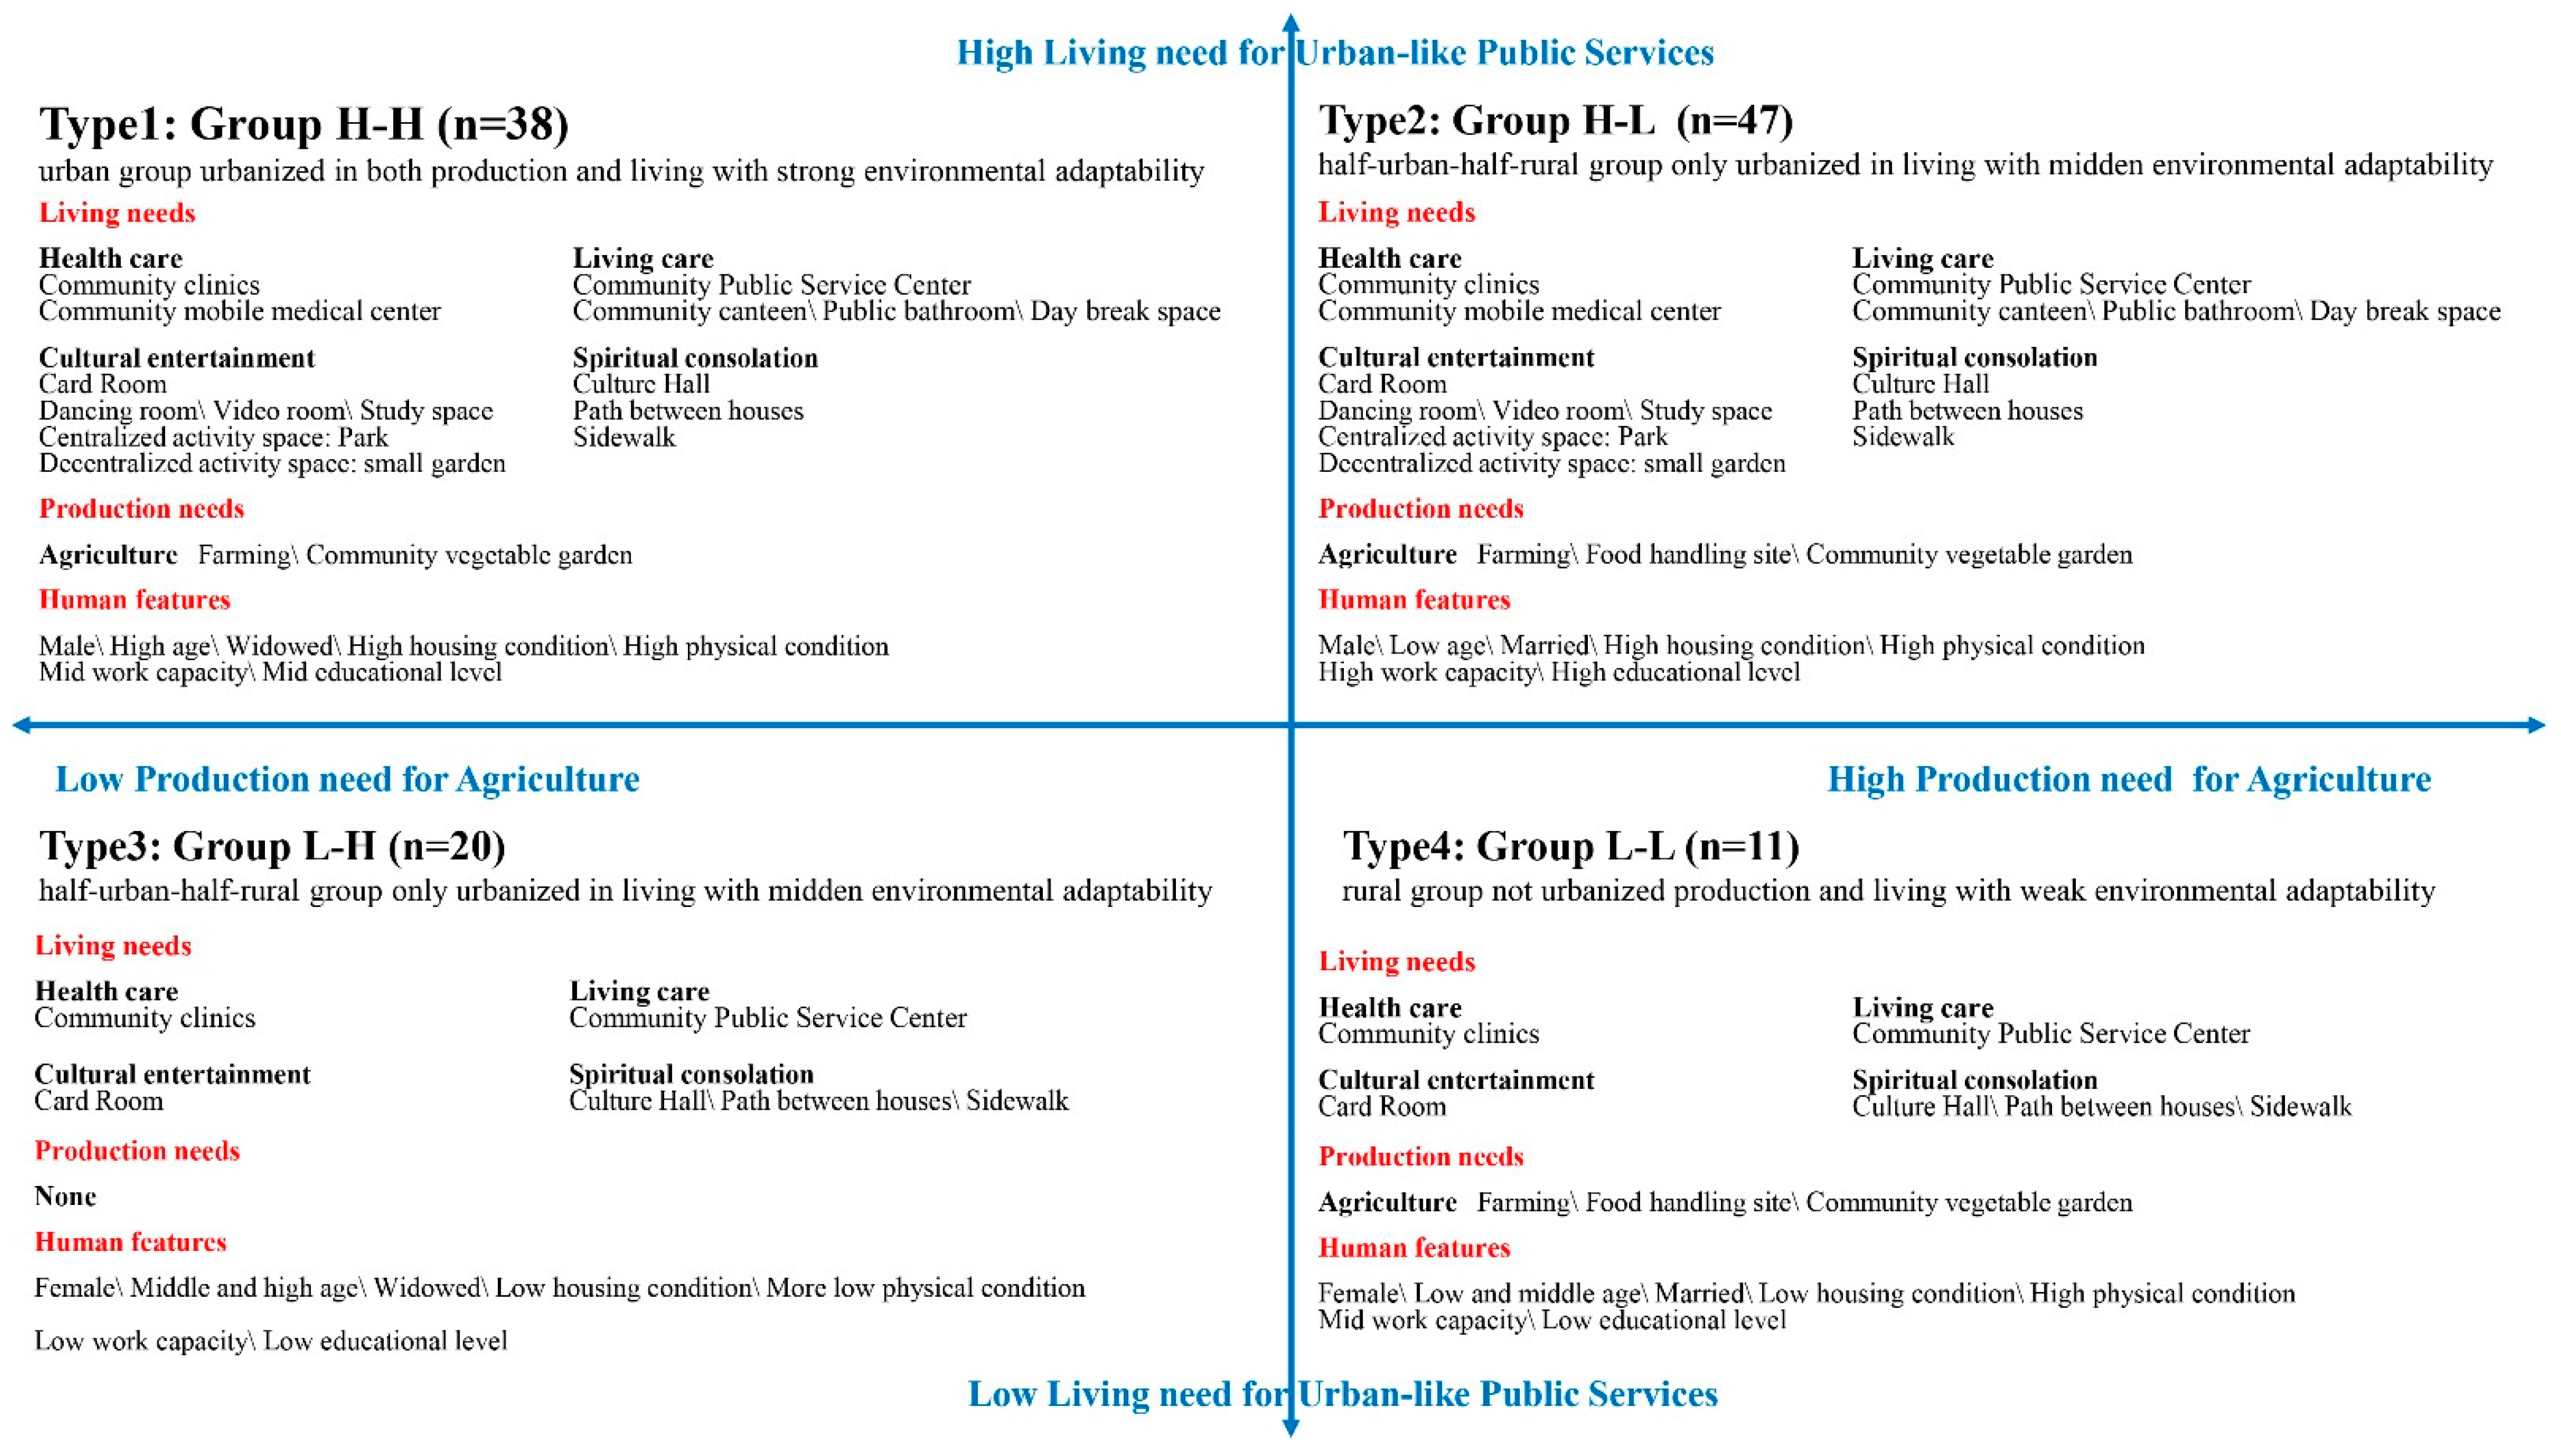
  • According to living and production urbanized values, the study constructed a four-quadrant model frame on human urbanization feature as follows: an Urban Group with both living and production needs urbanized (Group H-H); a Half-urban-half-rural Group with only living needs urbanized(Group H-L); a Half-urban-half-rural Group with only production needs urbanized (Group L-H); and a Rural group with both living and production needs not urbanized (Group L-L) (Figure 3). Each group’ final need indicators are determined according to its average of every need score, with which a need-based urbanization decomposition model is established.
  • Using the chi-square test, which can find the difference between the actual value and theoretical value of an observed variable for categorical control, the study compares the categorical percentage of individual characteristics with the overall percentage, and mines the significant difference of individual characteristics for four urbanization groups. Each group’ final individual characteristics are determined according to every individual percentage, with which an individual-characteristics-based urbanization decomposition model is established.

3. Results

3.1. Need-Based Classification of Urbanization Characteristics

Samples were classified into Group 1 with 85 samples and Group 2 with 31 samples according to living-needs indicators by hierarchical cluster analysis, and Table 3 displays one-way ANOVA analysis results of two groups: (1) In the six indicators of Community clinics, Community public service center, Card room, Cultural hall, Paths between houses, and Sidewalk, there is little difference in average score of between group 1 and group 2 (p > 0.05). (2) In the ten indicators of Community expert medical center, Community canteen, Public bathroom, Day break space, Night rest space, Dancing room, Video room, Study space, park, and small garden, there is significant difference between the two groups (p < 0.05). (3) By comparing the overall standard deviation with the group standard deviation in indicators with significant difference, it is found that the standard deviation of group 2 is greatly lower, and group 1 is only slightly higher than the overall in Night rest space and Study space, which indicates that the samples with similar living need are classified and the classification is relatively reasonable. (4) Comparing the average scores of indicators with significant differences, it is found that there is no significant difference for rural characteristics between the two groups, while group 1 has higher need for urban characteristics indexes, indicating that the degree of urbanization of group 1 is higher than that of group 2. Therefore, the group 1 is defined as living urbanized group, group 2 is defined as living unurbanized. (5) The sample size shows that under the influence of urban environment, most people’s living needs tend to be urban characteristics.
According to production-need indicators’ classification, samples are classified into group 1′ with 58 samples and 2′ with 58 samples by hierarchical cluster analysis, and Table 4 lists the one-way ANOVA analysis results of two groups: (1) In the three indicators of Family workshop, Street-facing stores and Labor employment, there is little difference in the average score of between group 1′ and group 2′ (p > 0.05). (2) In the six indicators of Farming, Parking lot for agricultural vehicles, Storage space for fertilizer and pesticide, Food handling site, Community vegetable garden, and Vegetable stand, there is a significant difference in the average scores between the two groups (p < 0.05). (3) By comparing the overall standard deviation and the group standard deviation in production need indicators with significant difference, it is found that the standard deviation of group 1′ is greatly lower and group 2′ is only slightly higher than the overall in Farming, Food handling site and Community vegetable garden, which indicates that the samples with similar living needs are classified and the classification is relatively reasonable. (4) Comparing the average scores of group 1′ and group 2′, there is no significant difference in Handmade and Business needs between them, while group 1′ has a lower need for agricultural production, indicating that group 1′ is more separated from agriculture, and has a higher production urbanization degree. Therefore, group 1′ is defined as the production urbanized group, and group 2′ is defined as production unurbanized. (5) The sample size shows that, under the influence of an urban environment, there are still a considerable number of humans whose needs remain as rural characteristics.
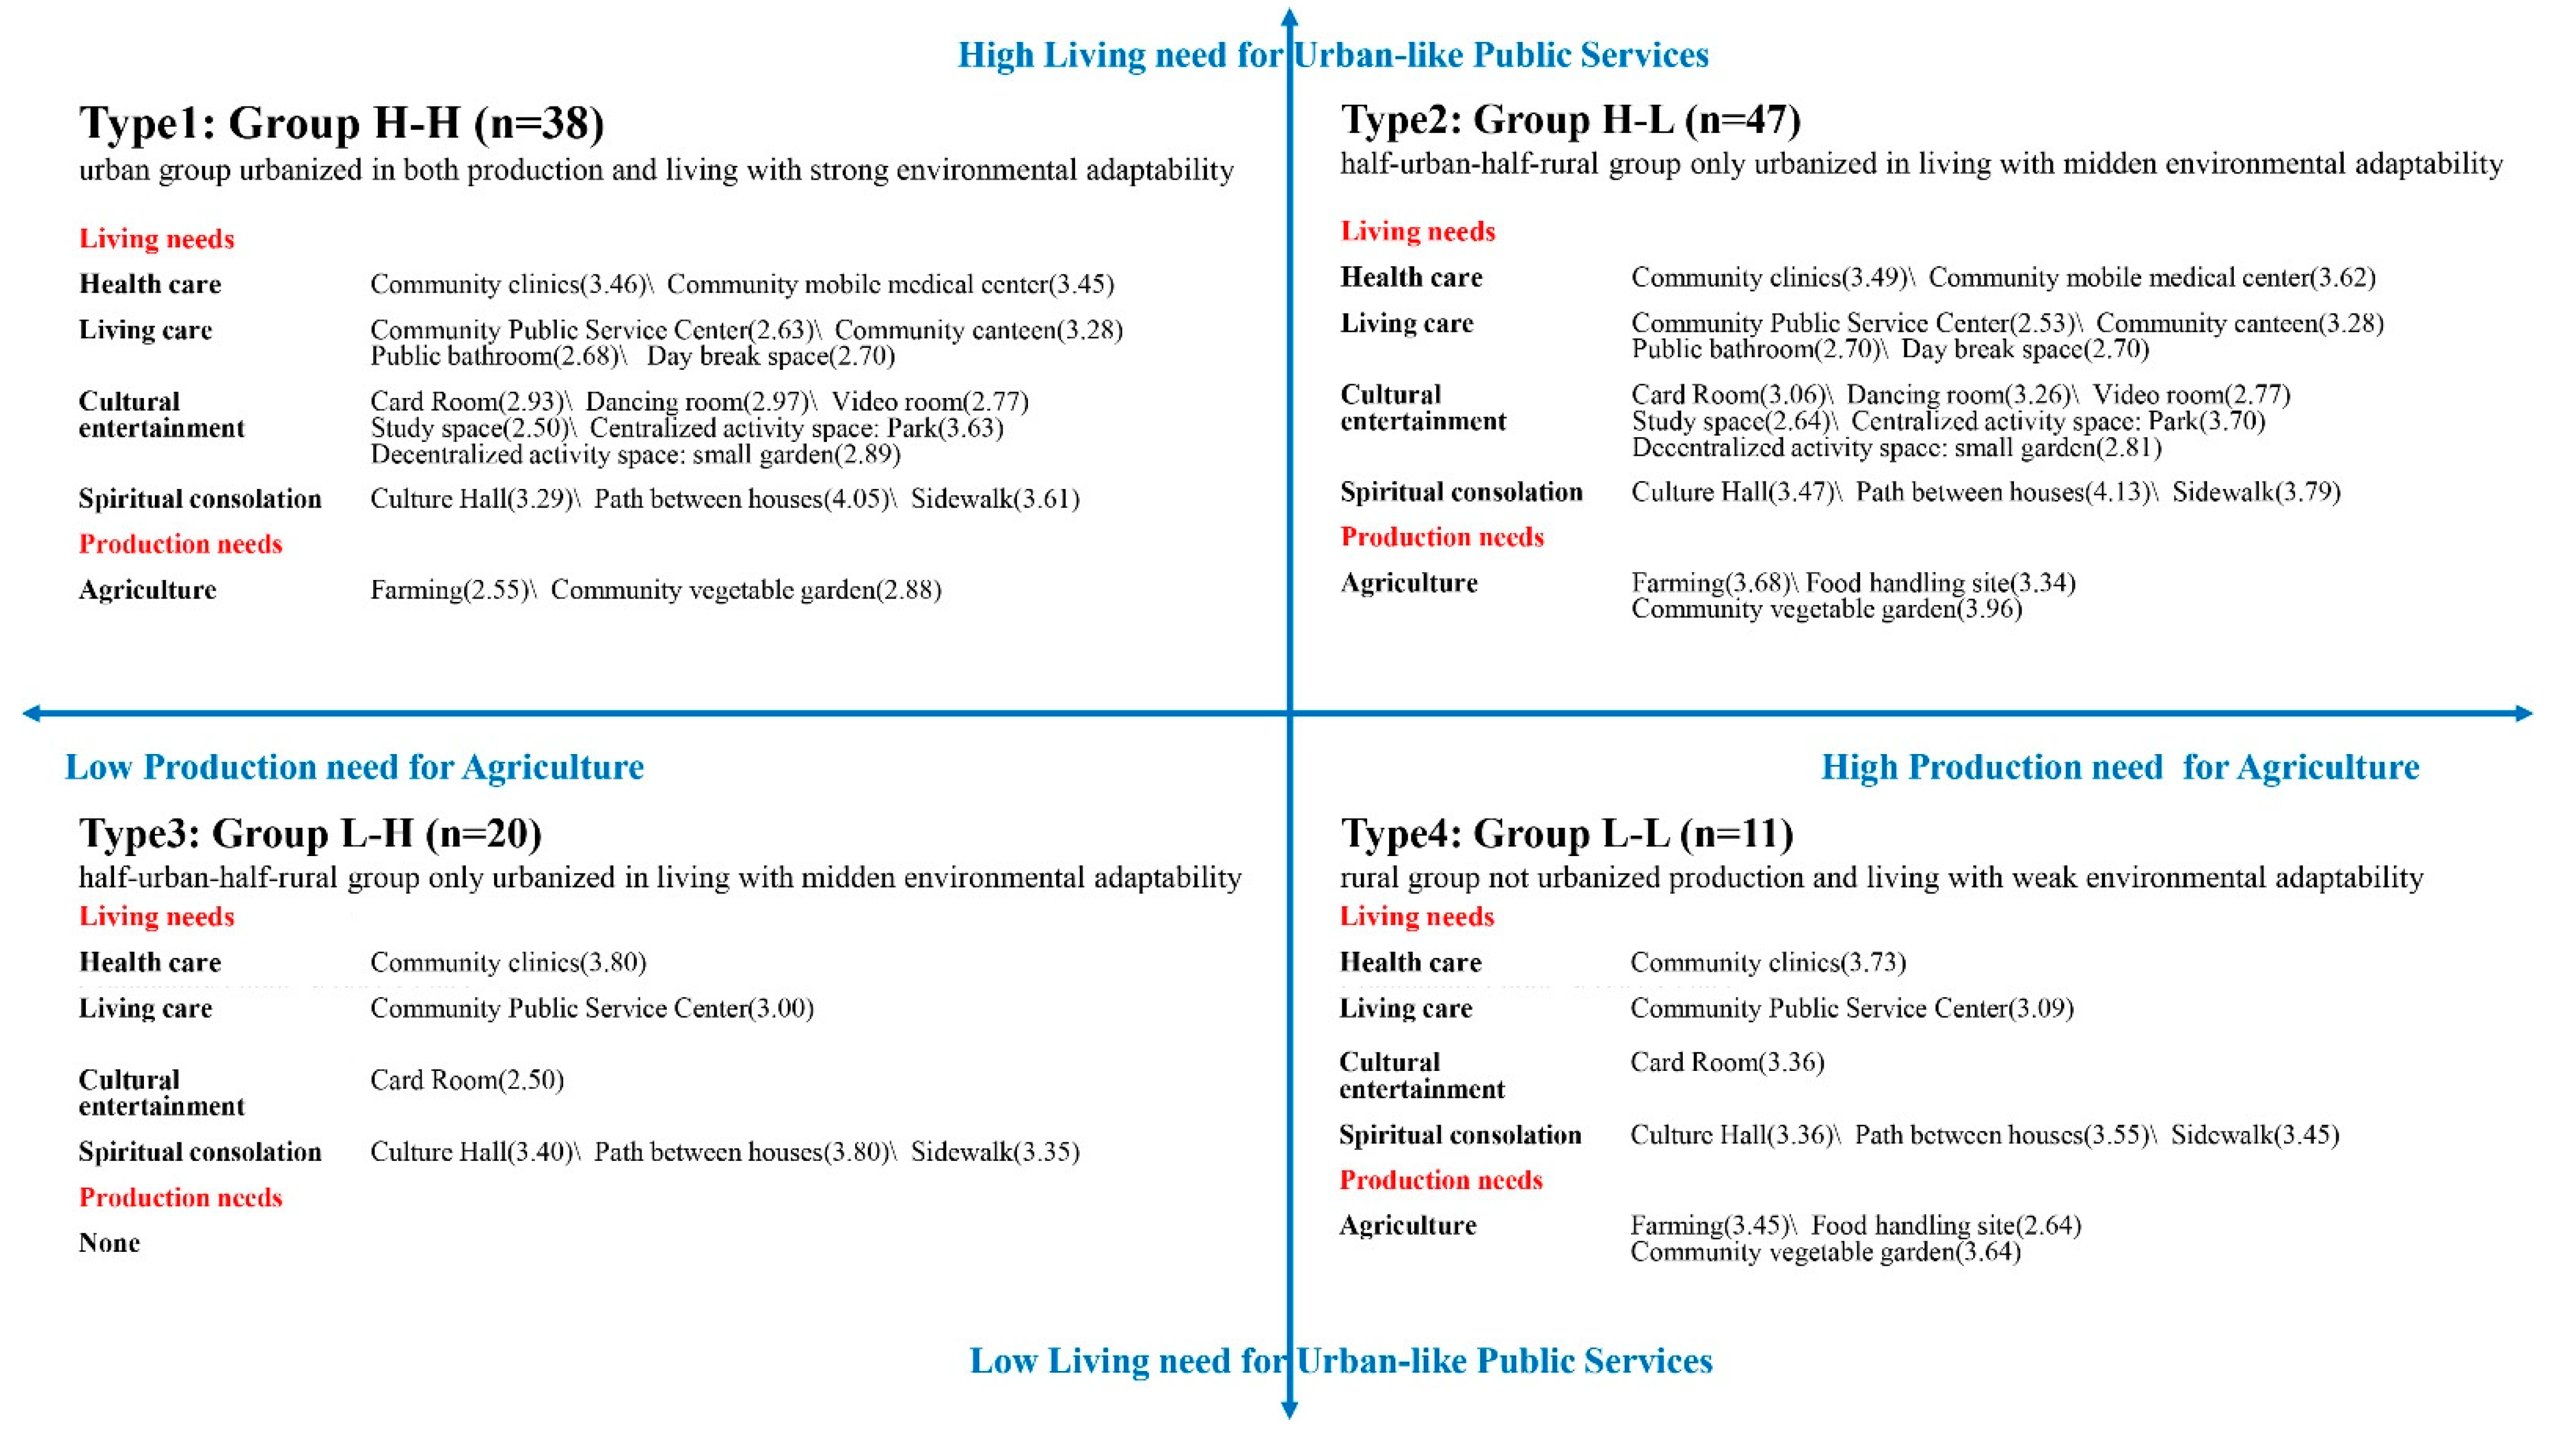
By permutation and combination, each sample obtained two urbanization values of production and living, and generated four urbanization feature groups. The specific need judgment criteria of a group is that the average score of a certain need of the group is higher than the average score for all production and living needs (2.45). The need-based urbanization feature decomposition model is shown in Figure 4.
Type 1: Group 1 and Group 1′. This type represents the urban group urbanized in both production and living with strong environmental adaptability (n = 38), which is defined as Group H-H. The needs for this type include most of the urban public services indicators, all rural public services indicators and some agricultural elements.
Type 2: Group 1 and Group 2′. This type represents the half-urban-half-rural group only urbanized in living with moderate environmental adaptability (n = 47), which is defined as Group H-L. The needs for this type include most urban public services indicators, all rural public services indicators and more agricultural elements.
Type 3: Group 2 and Group 1′. This type represents the half-urban-half-rural group only urbanized in production with moderate environmental adaptability (n = 20), which is defined as Group L-H. The needs for this type include basic urban-characteristic public services indicators and all rural-characteristic public services indicators. There is no production need for this type.
Type 4: Group 2 and Group 2′. This type represents the rural group without urbanized production and living with weak environmental adaptability (n = 11), which is defined as Group L-L. The needs for this type include basic urban public services indicators, all rural public services indicators and more agricultural elements.

3.2. Urbanization Types’ Characteristics of Environmental Adaptability

Based on the urbanization classification of population, this study conducted Chi-square analysis on the proportion of each dimension population attribute of four types to understand the impact of different population attributes on urban environmental adaptability (Table 5). (1) The seven population attributes of Gender, Age, Marital status, Housing condition, Physical condition, Work capacity and Educational level are significantly different (p < 0.05), which indicates that these seven dimensions have an impact on urban environment adaptability. (2) In Gender, the percentage of Group L-H and Group L-L are greatly different from the whole sample, which indicates that Gender has a great impact on living urbanization; in Age, Work capacity and Educational level, all four groups are very different from the overall proportion, indicating that these three dimensions have an impact on both living and production environmental adaptation; Group L-H’’s low Physical condition percentage shows that the decline of health reduced environmental adaptability; the high proportion of widows in Group H-H and Group L-H indicates that Marital status will affect the degree of production urbanization. (3) For pension, in spite of the little difference among the four groups (p > 0.05), we cannot be sure pension has no impact on urban environmental adaptability because the samples in this research are all in low pension. Regardless, the pension standard here and a sample with higher pensions may have different need characteristics.
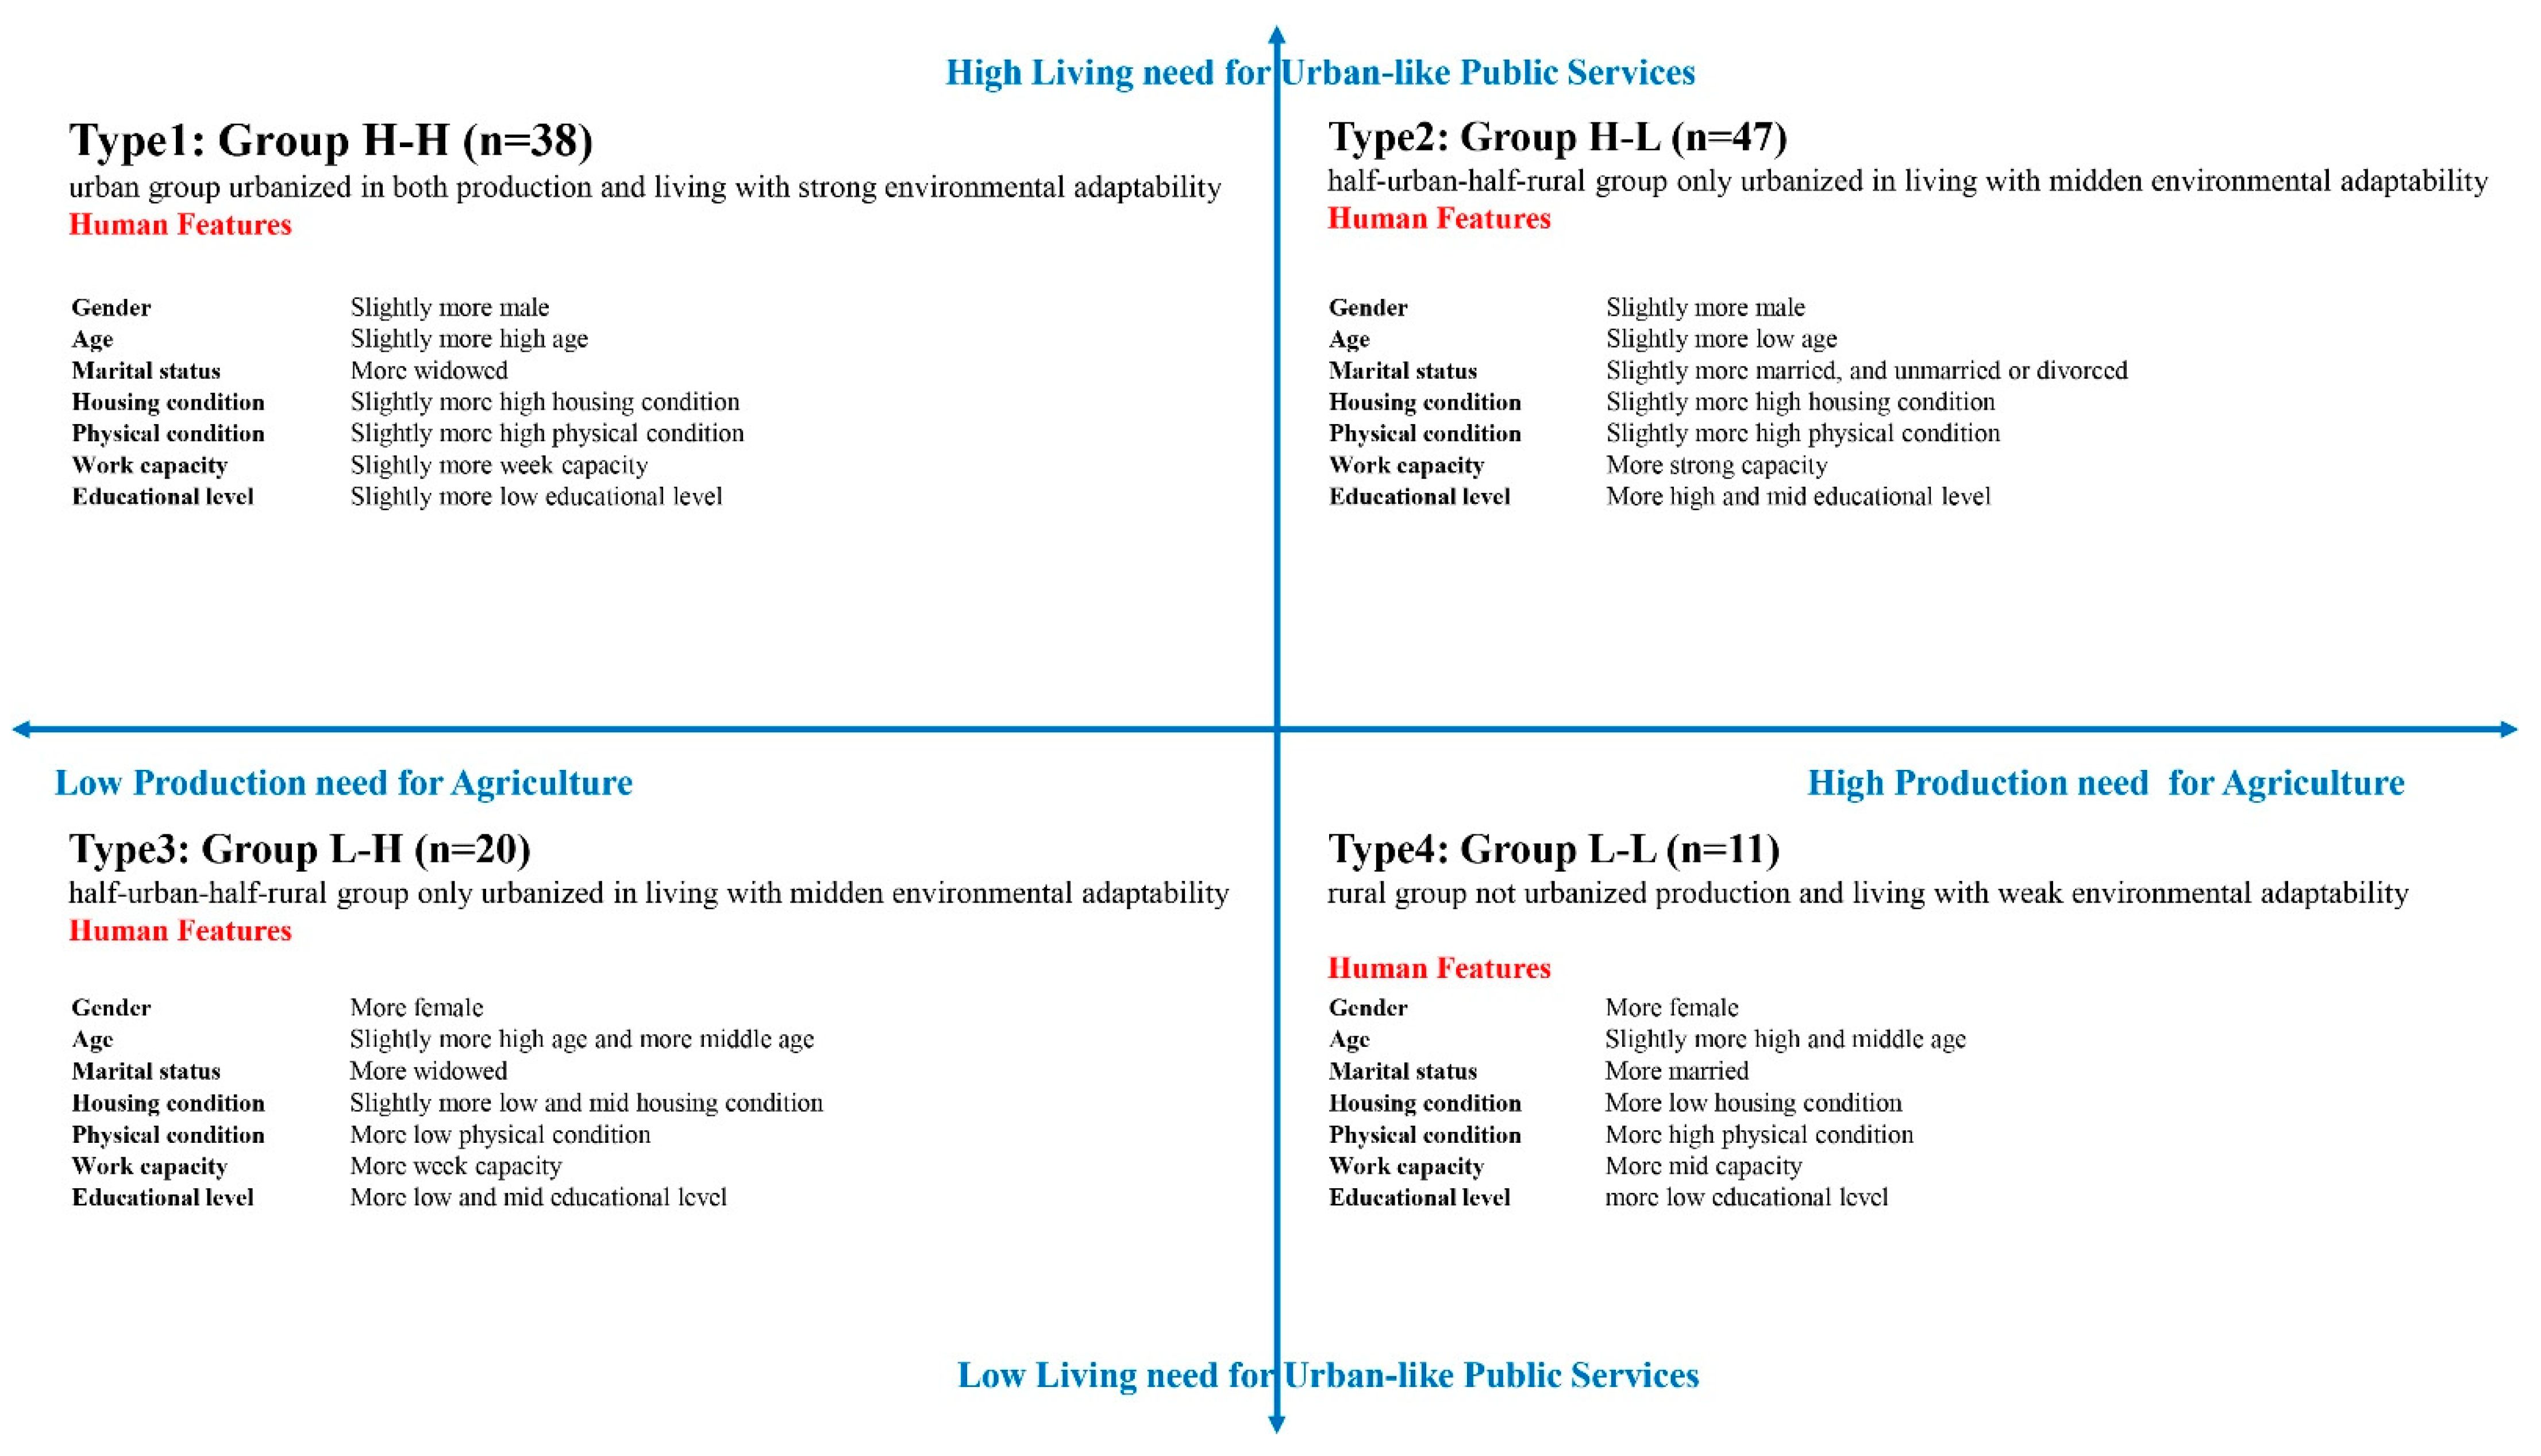
In population attribute dimensions with significant differences, the percentage of a certain population attribute in one group being higher than the total proportion of the item is used to judge the population’s attribute characteristics of the group. The population-attribute-based urbanization feature decomposition model is shown in Figure 5:
Group H-H, an urban group urbanized in both production and living with strong environmental adaptability: the proportion of males is a little higher, the age is older, the health condition is better, most of them have an independent house, the widow proportion is significantly higher, and work capacity and educational levels are both middling;
Group H-L, a half-urban-half-rural group only urbanized in living with middle environmental adaptability: the proportion of males is a little higher, the age is younger, and their health condition is better; most of them have an independent house, and most still have a spouse, with an overall strong work capacity and high education levels;
Group L-H, a half-urban-half-rural group only urbanized in production with moderate environmental adaptability: the proportion of women is greatly high, with more middle and old aged samples, the proportion of those unable to take care of themselves is high, 40% do not have their own property, 30% are widowed, and there is an overall low work capacity and low educational levels;
Group L-L, a rural group without urbanized production and living with weak environmental adaptability: the proportion of women is very high, with more middle and low aged samples, the health condition is good, more than 60% do not have their own property, most of them have still living spouses, and are mainly engaged in housework, with low educational levels.

3.3. Correlation between Need and Environmental Adaptability

Through the qualitative comparison of the needs and the population attributes of four groups with different environmental adaptability, this study found that the urban environmental adaptability of elderly migrants is complicated: one factor is that the production and living needs of different urban environmental adaptability groups is different; the other is that the population attributes of four groups with different environmental adaptability is different. Distribution of 116 samples in a four-quadrant model of human urbanization features shows the relationship of living and production needs and population attributes (Figure 6): Group H-H need most urban public services, all rural public services and some agricultural elements, and tends to be older, in better health, with independent houses, widows, and middling work capacity and educational levels; Group H-L needs most urban public services, all rural public services and more agricultural elements, and tends to be younger, in better health, with an independent house, with a spouse, and with strong work capacity and high education levels; Group L-H needs basic urban public services and all rural public services, and tends to be women, older, unable to take care of themselves, with no independent property, widowed, and with low work capacity and low educational levels; Group L-L needs basic urban public services, all rural public services and more agricultural elements, and tends to be women, low age, in better health, with no property, with spouses still living, mainly engaged in housework, and with low educational levels.

4. Discussion

In summary, elderly migrants have the following four characteristics for the production and living needs of resettlement community: (1) in terms of urban public services, basic services were needed by all groups and more were needed by Group H-H and H-L; with the impact of the urbanized environment, urban public services will be more demanded; (2) in terms of rural public services, the four groups have high demand; (3) in terms of Agriculture elements, only the L-H group has no demand; (4) four groups all have no Handmade and Business. Therefore, the production and living needs of elderly migrants are summarized as urban public services, rural public services and agricultural production factors. To meet elderly migrants’ complex needs for production and living, this paper proposes three concepts focused on planning resettlement communities: promotion of urban public services, construction of spiritual homes, and placement of agricultural production factors.

4.1. Promote the Supply Level of Urban Public Services

To meet elderly migrants’ increasing need for a better life, resettlement community planning should improve the supply level of urban public services, mainly from two perspectives: (1) ensuring equalization of basic services and (2) enriching diversification of expanded services. Basic services relate to basic living and development; they should include material elements such as housing and municipal facilities, as well as soft elements such as medical care, education, and a safe social environment. To ensure migrants a fair opportunity for basic services, government departments should equalize the provision of public services and creation of the public environment. Expanded services meet needs for improvement of quality of life, involving professional medical care, facilities for the elderly, culture, and entertainment. Expanded services should be diverse both in content and level because of migrants’ differences, and they can operate through introduction of commercial facilities.

4.2. Create a Place That Embodies the Spirit of Immigrants’ Homeland

Elderly migrants’ spiritual comfort is mainly realized through ceremonial activities such as festivals, birthdays, weddings, and funerals, along with daily neighborhood interaction activities such as gatherings and extrapolated production and living behaviors. To respect and retain migrants’ traditional memories, reshape their social life, and form good social relations after resettlement, community planning should preserve spaces that reflect the spirit of migrants’ homelands, especially by relying on both collective and neighborhood spaces [37,38,39]. In a narrow sense, collective space generally refers to a cultural hall for such functions as village history shows, banquets, and collective material storage. In a broader sense, collective space also includes public spaces that support a variety of activities and are rich in the sense of domain. Formation of such spaces can generally be achieved by enhancing community boundaries and creating community entrances. Neighborhood spaces are mainly formed by creating small-scale locations with a certain sense of enclosure through terrain height differences, green belts, landscape stones, pavilions, and other elements in spaces between houses, at street intersections, at entrances and exits of residential groups, and around stores of specific business types.

4.3. Moderate Consideration of Agricultural Production Needs

At the community level, provision of agricultural production factors mainly consists of the installation of a certain percentage of green space for planting and construction of production service facilities [40,41]. Small-scale planting sites can be established in combination with green spaces between houses and alongside public facilities [42]. For needs of agricultural vehicle parking, fertilizer and pesticide storage, and agricultural operations, production service facilities can be provided in conjunction with community service centers and parks, while demand for agricultural technology services can be directed to commercial development. In terms of industry and commerce, although elderly migrants’ needs were not high, in interviews, they expressed that the main obstacle to engaging in such production methods was their lack of job skills and opportunities. With elderly migrants’ gradual urbanization, the number of those with the skills to engage in industry and commerce will gradually increase, and resettlement community planning should consider such needs.

5. Conclusions

The resettlement community has achieved environmental urbanization in terms of natural land, planning mode, spatial pattern, and preset production methods. However, elderly migrants’ production and living habits continue rural traditions, in contrast to the urban residential environment. This reflects a problem in that human and environmental urbanization are not synchronized.
Based on the internal—human—factor of environmental regulation, this study begins with individual needs of elderly migrants, and attends to interaction mechanisms between the environment and human beings. Then, the study employs the systematic clustering method to construct a human urbanization feature, a four-quadrant model according to people’s production and living needs. Through the qualitative comparison the needs and the population attributes of four groups with different environmental adaptability, the study revealed four features: Group H-H needs most urban public services, all rural public services and some agricultural elements, and tends to be older, in better health, with independent houses, widows, and has middling work capacity and educational levels; Group H-L needs most urban public services, all rural public services and more agricultural elements, and tends to be younger, in better health, with independent houses, with spouses, and with strong work capacity and high education levels; Group L-H needs basic urban public services and all rural public services, and tends to be women, older, unable to take care of themselves, with no property, widowed, and with low work capacity and low educational levels; and Group L-L needs basic urban public services, all rural public services and more agricultural elements, and tends to be women, low age, in better health, with no property, with spouses still living, mainly engaged in housework, and with low educational levels.
With regard to elderly migrants’ urbanization cognition of living environment, this study focuses only on the functional plan of production and living needs. However, such urbanization cognition was also reflected in elderly migrants’ preference for spatial characteristics (e.g., spatial domain, accessibility, identifiability). Future research may focus on these indicators. In addition, due to limitations of time and resources, this study investigated only one resettlement community. Other resettlement communities might manifest different distribution characteristics in the two-dimensional model of production and living; correlation between needs and environmental adaptability might also differ from this case. Additionally, features in this case’s model need more verification. With gradual urbanization, elderly migrants’ dynamic needs should also be considered in future research.

Author Contributions

Conceptualization, Y.H. and Z.Q.; methodology, Y.H. and Z.Q.; validation, Y.H. and W.L.; formal analysis, Y.H; resources, Z.Q.; data curation, Y.H. and W.L.; investigation, Z.Q.; writing—original draft preparation, Y.H.; writing—review and editing, Z.Q.; visualization, Y.W.; supervision, Z.W.; project administration, Z.Q.; funding acquisition, Z.Q. All authors have read and agreed to the published version of the manuscript.

Funding

This research was funded by the National Key Research and Development Program of China (No. 2019YFD1101101).

Institutional Review Board Statement

The study was conducted according to the guidelines of the Declaration of Helsinki, and approved by the Institutional Review Board of Institute of Architectural Design and Theoretical Research, Zhejiang University (protocol code: 201807001; date of approval: 29 June 2018).

Informed Consent Statement

Informed consent was obtained from all subjects involved in the study.

Data Availability Statement

Data supporting reported results can be found in https://pan.zju.edu.cn/share/1e37d0e152c8a7e624edeab492 (Accessed on 10 May 2021).

Acknowledgments

The authors would like to express sincere gratitude to the support received from the students of Zhejiang University in collecting the data, as well as the insightful comments from anonymous reviewers that helped to improve the article considerably.

Conflicts of Interest

The authors declare no conflict of interest.

References

  1. De Sherbinin, A.; Castro, M.; Gemenne, F.; Cernea, M.M.; Adamo, S.; Fearnside, P.M.; Krieger, G.; Lahmani, S.; Oliver-Smith, A.; Pankhurst, A.; et al. Preparing for Resettlement Associated with Climate Change. Science 2011, 334, 456–457. [Google Scholar] [CrossRef] [PubMed]
  2. Tang, S.; Hao, P.; Huang, X. Land conversion and urban settlement intentions of the rural population in China: A case study of suburban Nanjing. Habitat Int. 2016, 51, 149–158. [Google Scholar] [CrossRef]
  3. Yang, Q.; Ley, D. Residential relocation and the remaking of socialist workers through state-facilitated urban redevelopment in Chengdu, China. Urban. Stud. 2019, 56, 2480–2498. [Google Scholar] [CrossRef]
  4. Yi, Z.; Gu, M. Planning and practice of reservoir resettlement in new-type urbanization mode: Case of Nan’an Reservoir in Yongjia County of Wenzhou City. Yangtze River 2015, 46, 107–111. (In Chinese) [Google Scholar]
  5. Lian, H.; Glendinning, A.; Yin, B. The Issue of ‘Land-lost’ Farmers in the People’s Republic of China: Reasons for discontent, actions and claims to legitimacy. J. Contemp. China 2016, 25, 718–730. [Google Scholar] [CrossRef]
  6. Zhang, Z.; Qiu, Z. The usage pattern and spatial preference of community facilities by elder people in rural environments. Neth. J. Hous. Environ. Res. 2019, 35, 661–678. [Google Scholar] [CrossRef]
  7. Bing, L.; Yue, L. The Change of Country Resident’ Behavior and Evaluation After Relocation. Archit. J. 2009, 64–68. (In Chinese) [Google Scholar]
  8. Zhi, Q.; Yi, H.; Yue, W.; Zhu, W. In Study on “Adapted Use” in Reservoir Resettlement Community—Taking Community L of Zhejiang Province as an Example, A New Idea for Starting Point of the Silk Road: Urban and Rural Design for Human. In Proceedings of the 14th International Conference on Environment-Behavior Studies 2020, Xi’an, China, 17–18 October 2020. [Google Scholar]
  9. Qian, Z. Displaced villagers’ adaptation in concentrated resettlement community: A case study of Nanjing, China. Land Use Policy 2019, 88, 104097. [Google Scholar] [CrossRef]
  10. Schopp, K. Analyzing Coping Strategies and Adaptation after Resettlement—Case Study of Ekondo Kondo, Cameroon and Ekondo Kondo Model of Adaptation. Sustainability 2020, 12, 9615. [Google Scholar] [CrossRef]
  11. Aijang, C.; Guoqing, S. A Social Integration Study of Involuntary Migration. Chin. Sociol. Anthropol. 2006, 38, 5–18. [Google Scholar] [CrossRef]
  12. Li, C.; Guo, M.; Li, S.; Feldman, M. The Impact of the Anti-Poverty Relocation and Settlement Program on Rural Households’ Well-Being and Ecosystem Dependence: Evidence from Western China. Soc. Nat. Resour. 2021, 34, 40–59. [Google Scholar] [CrossRef]
  13. Zhou, L.; Xiong, L. Evolution of the Physical and Social Spaces of ’Village Resettlement Communities’ from the Production of Space Perspective: A Case Study of Qunyi Community in Kunshan. Int. J. Environ. Res. Public Health 2019, 16, 2980. [Google Scholar] [CrossRef] [PubMed] [Green Version]
  14. Li, C.; Li, M. The Policy Information Gap and Resettlers’ Well-Being: Evidence from the Anti-Poverty Relocation and Resettlement Program in China. Int. J. Environ. Res. Public Health 2020, 17, 2957. [Google Scholar] [CrossRef] [PubMed]
  15. Li, B. Environment-Behavior Theories and Design Methodology. J. Hum. Settl. West China 2017, 32, 1–6. (In Chinese) [Google Scholar]
  16. Zhang, L.; Zhao, S.X.B. Re-examining China’s “Urban” Concept and the Level of Urbanization. China Q. 1998, 154, 330. [Google Scholar] [CrossRef]
  17. Albarracín, D.; Wyer, R.S. The cognitive impact of past behavior: Influences on beliefs, attitudes, and future behavioral decisions. J. Pers. Soc. Psychol. 2000, 79, 5–22. [Google Scholar] [CrossRef] [PubMed]
  18. Tang, D.; Wang, J. Basic Public Health Service Utilization by Internal Older Adult Migrants in China. Int. J. Environ. Res. Public Health 2021, 18, 270. [Google Scholar] [CrossRef] [PubMed]
  19. Zhang, L.; Tan, X. Educational Assortative Mating and Health: A Study in Chinese Internal Migrants. Int. J. Environ. Res. Public Health 2021, 18, 1375. [Google Scholar] [CrossRef] [PubMed]
  20. Shi, J.; Hu, X.; Guo, X.; Lian, C. Risk Information Seeking Behavior in Disaster Resettlement: A Case Study of Ankang City, China. Int. J. Environ. Res. Public Health 2020, 17, 7352. [Google Scholar] [CrossRef]
  21. Gu, T.; Yuan, J.; Li, L.; Shao, Q.; Zheng, C. Demand for community-based care services and its influencing factors among the elderly in affordable housing communities: A case study in Nanjing City. BMC Health Serv. Res. 2020, 20, 241. [Google Scholar] [CrossRef] [PubMed]
  22. Hou, B. Community Home-based Care Service for Urban Elderly: Demand Levels and Satisfying Strategy. Chin. Soc. Secur. Rev. 2019, 3, 147–159. (In Chinese) [Google Scholar]
  23. Tong, W.; Lo, K.; Zhang, P. Land Consolidation in Rural China: Life Satisfaction among Resettlers and Its Determinants. Land 2020, 9, 118. [Google Scholar] [CrossRef] [Green Version]
  24. Chang, K.K.P.; Wong, F.K.Y.; Chan, K.L.; Wong, F.; Ho, H.C.; Wong, M.S.; Ho, Y.S.; Yuen, J.W.M.; Siu, J.Y.-M.; Yang, L. The Impact of the Environment on the Quality of Life and the Mediating Effects of Sleep and Stress. Int. J. Environ. Res. Public Health 2020, 17, 8529. [Google Scholar] [CrossRef] [PubMed]
  25. Joseph, A.E.; Cloutier, D.S. Elderly migration and its implications for service provision in rural communities: An Ontario perspective. J. Rural Stud. 1991, 7, 433–444. [Google Scholar] [CrossRef]
  26. Cheng, Y.; Rosenberg, M.W.; Wang, W.; Yang, L.; Li, H. Access to residential care in Beijing, China: Making the decision to relocate to a residential care facility. Ageing Soc. 2011, 32, 1277–1299. [Google Scholar] [CrossRef]
  27. Zhao, C. Towards “China’s Issues” with Interdisciplinary Approach Thinking in Organizing the Special Issue of “Architectural Anthropology”. Archit. J. 2020, 6, 1–4. (In Chinese) [Google Scholar]
  28. Ley, D. The Immigrant Church as an Urban Service Hub. Urban. Stud. 2008, 45, 2057–2074. [Google Scholar] [CrossRef]
  29. Lee, Y.-S.F. Small Towns and China’s Urbanization Level. China Q. 1989, 120, 771–786. [Google Scholar] [CrossRef]
  30. Hu, S.; Das, D. Quality of life among older adults in China and India: Does productive engagement help? Soc. Sci. Med. 2019, 229, 144–153. [Google Scholar] [CrossRef] [PubMed]
  31. Jiang, Y.; Waley, P.; Gonzalez, S. ‘Nice apartments, no jobs’: How former villagers experienced displacement and resettlement in the western suburbs of Shanghai. Urban. Stud. 2017, 55, 3202–3217. [Google Scholar] [CrossRef]
  32. Zhi, Q.; Yi, H.; Yue, W.; Jiuyan, S.; Zhu, W. A Tentative Study of the Elderly Human Settlements in Urban-insertion Reservoir Resettlement Communitys. Archit. Cult. 2020, 10, 132–134. (In Chinese) [Google Scholar]
  33. Liddell, T.M.; Kruschke, J.K. Analyzing ordinal data with metric models: What could possibly go wrong? J. Exp. Soc. Psychol. 2018, 79, 328–348. [Google Scholar] [CrossRef] [Green Version]
  34. Lam, J.; Bolano, D. Social and productive activities and health among partnered older adults: A couple-level analysis. Soc. Sci. Med. 2019, 229, 126–133. [Google Scholar] [CrossRef]
  35. Halmdienst, N.; Radhuber, M.; Winter-Ebmer, R. Attitudes of elderly Austrians towards new technologies: Communication and entertainment versus health and support use. Eur. J. Ageing 2019, 16, 513–523. [Google Scholar] [CrossRef] [PubMed] [Green Version]
  36. Qiu, Z.; Zhang, Z.; Ye, L.; Luo, W. Building for the Elderly in North Zhejiang Rural Areas Based on the Survey and Analysis of Demands. New Archit. 2017, 1, 24–28. (In Chinese) [Google Scholar]
  37. Zhang, Z.; Qiu, Z. Exploring Daily Activity Patterns on the Typical Day of Older Adults for Supporting Aging-in-Place in China’s Rural Environment. Int. J. Environ. Res. Public Health 2020, 17, 8416. [Google Scholar] [CrossRef] [PubMed]
  38. Milbourne, P. Growing public spaces in the city: Community gardening and the making of new urban environments of publicness. Urban. Stud. 2021. [Google Scholar] [CrossRef]
  39. Buchecker, M. Withdrawal from the Local Public Place: Understanding the Process of Spatial Alienation. Landsc. Res. 2009, 34, 279–297. [Google Scholar] [CrossRef]
  40. Qian, Z. Resettlement and adaptation in China’s small town urbanization: Evidence from the villagers’ perspective. Habitat Int. 2017, 67, 33–43. [Google Scholar] [CrossRef]
  41. Van Holstein, E. Strategies of self-organising communities in a gentrifying city. Urban. Stud. 2019, 57, 1284–1300. [Google Scholar] [CrossRef]
  42. Oh, J.; Kim, S.; Oh, J. Effect of household economic indices on sustainability of community gardens. J. Asian Arch. Build. Eng. 2019, 18, 145–150. [Google Scholar] [CrossRef]
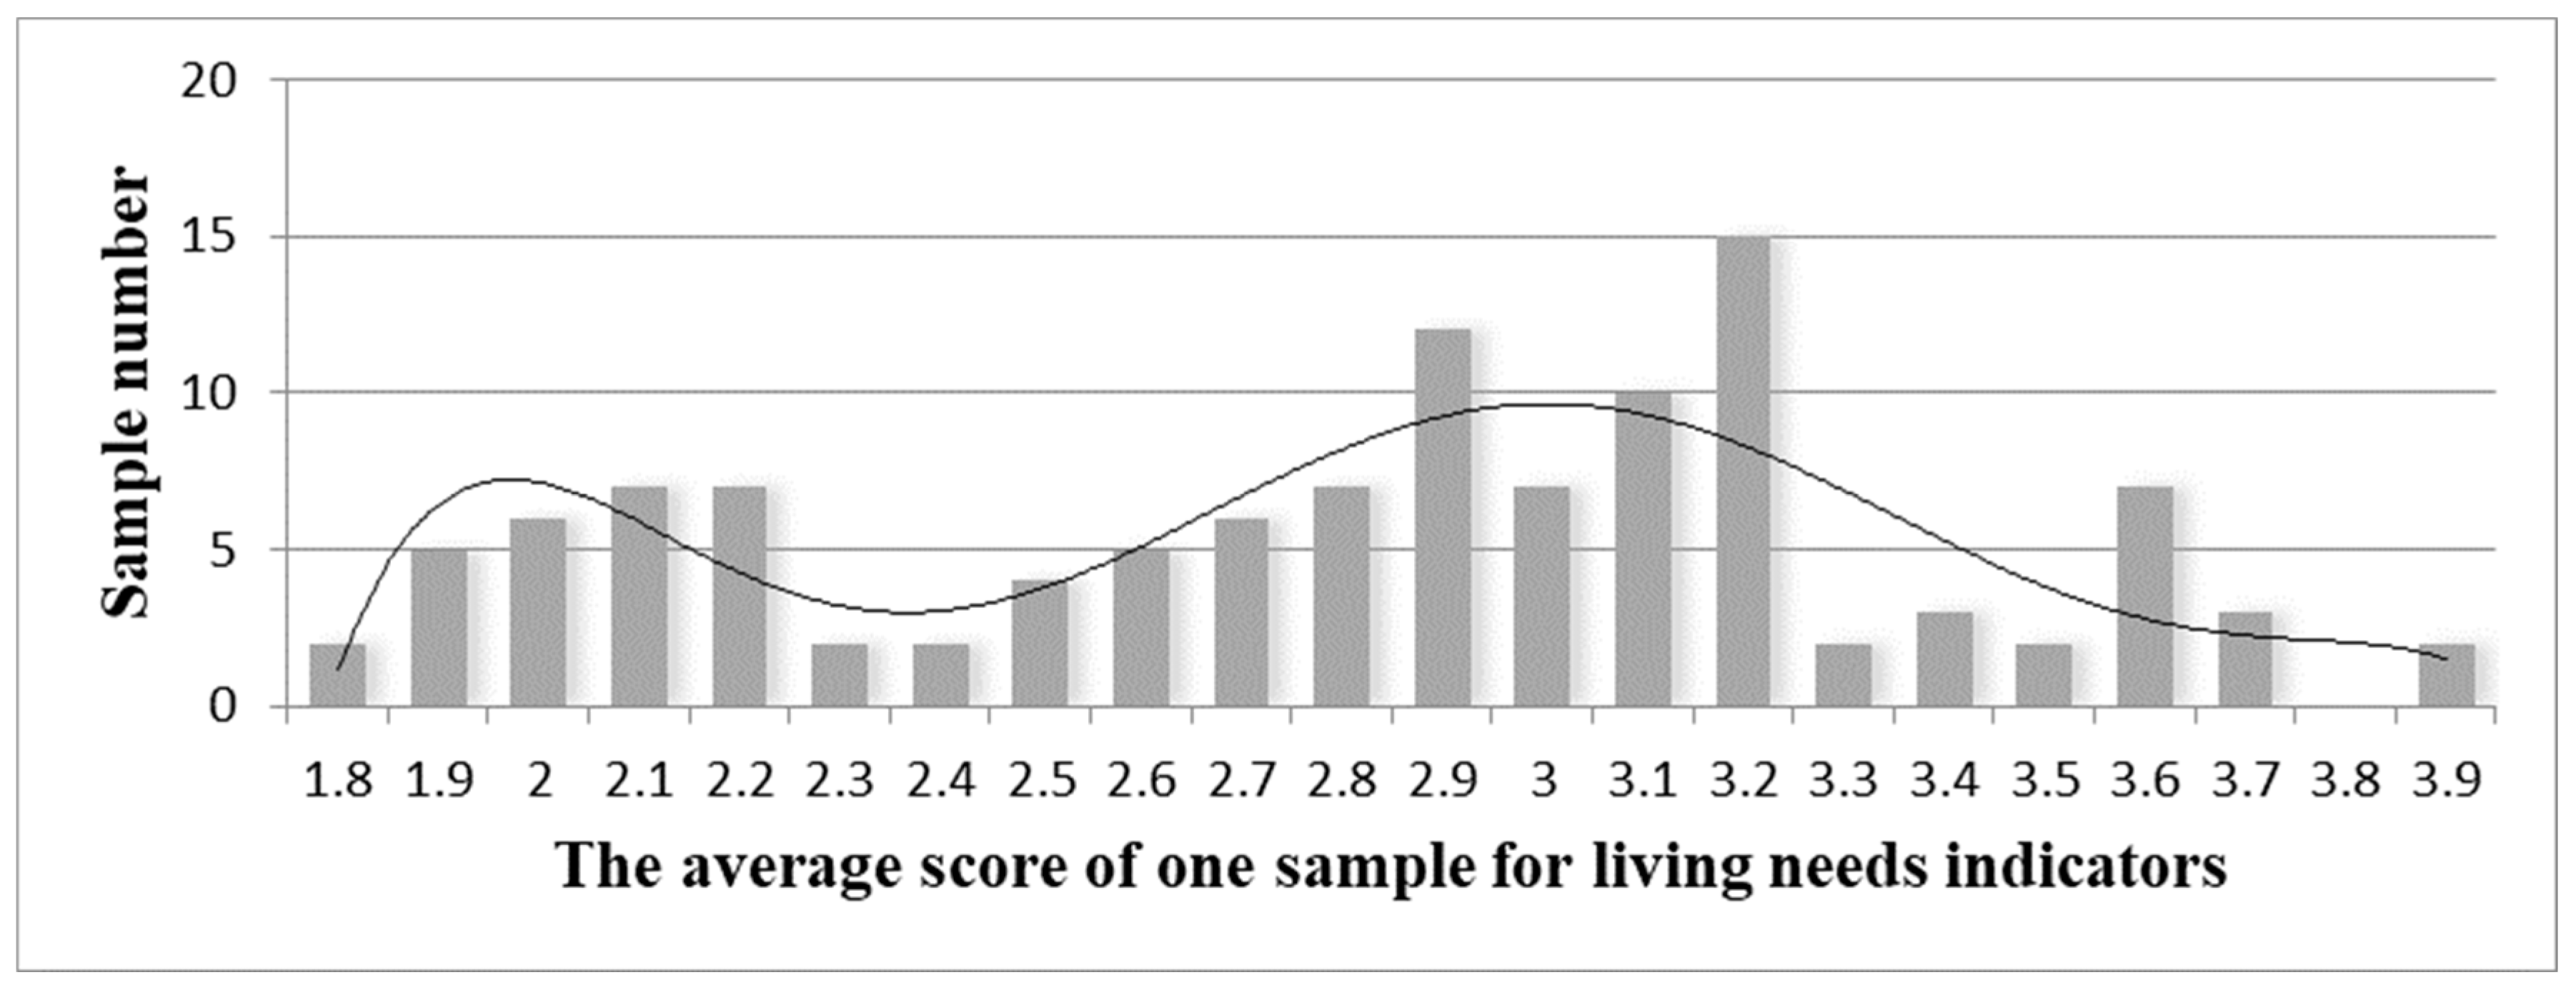
Figure 1. Frequency distribution of the average score of one sample for living needs.
Ijerph 18 05068 g001
Figure 2. Frequency distribution based on the average score of one sample for production needs.
Ijerph 18 05068 g002
Figure 3. Framework of the model of urbanization characteristics (Source: Author).
Ijerph 18 05068 g003
Figure 4. Decomposition model of urbanization features based on need (Source: Author).
Ijerph 18 05068 g004
Figure 5. Decomposition model of urbanization features based on population-attribute (Source: Author).
Ijerph 18 05068 g005
Figure 6. Model of urbanization characteristics (Source: Author).
Ijerph 18 05068 g006
Table 1. Production- and living-needs indicator system.
First-Level IndicatorSecond-Level IndicatorThird-Level Indicator
Living NeedsHealth careCommunity clinics
Community mobile medical center
Living careCommunity public service center
Community canteen
Public bathroom
Day break space
Overnight restroom
Cultural entertainmentCard room
Dancing room
Video room
Study space
Centralized activity space: Park
Decentralized activity space: small garden
Spiritual consolationCulture hall
Path between houses
Sidewalk
Production NeedsAgricultureFarmland
Parking for agricultural vehicles
Storage space for fertilizer and pesticide
Farm operation space
Community agricultural garden
Vegetable stall
Handmade and BusinessFamily workshop
Street shop
Labor employment
Table 2. Basic demographic information and population attributes of the survey sample (N = 116).
NameOptionExplanationFrequencyPercent %
GenderFemale/6455.17
Male/5244.83
AgeLow55–69 years4942.24
Mid70–79 years4639.66
HighOlder than 80 years2118.1
Marital status Married/8775
Widowed/2622.41
Unmarried, divorced/32.59
PensionLowLess than 1000 ¥6354.31
Mid1000–2000 ¥3328.45
HighMore than 2000 ¥ 2017.24
Housing conditionLowLiving with other family members, no house ownership1412.07
MidLiving alone, no house ownership1412.07
HighHouse ownership8875.86
Physical conditionLowNeeding help or nursing76.03
HighSelf-caring10993.97
Work capacityWeakCan neither undertake housework nor make money2723.28
MidMainly housework6253.45
StrongCan make money2723.28
Educational levelLowNot completed primary education5950.86
MidCompleted primary education4236.21
HighCompleted junior school education and above1512.93
Table 3. Characteristic variables of living needs and One-Way ANOVA test (Source: Author).
Living Demand IndicatorsClassification of Living Needs
(Mean ± Standard Deviation)
Average Score
(Mean ± Standard Deviation)
p
1 (n = 85)2 (n = 31)
Community clinics3.49 ± 0.843.77 ± 0.923.57 ± 0.870.124
Community experts medical center3.48 ± 0.961.87 ± 0.623.05 ± 1.130.000 **
Community public service center2.73 ± 0.902.87 ± 0.852.75 ± 0.930.450
Community canteen3.31 ± 0.951.52 ± 0.722.83 ± 1.200.000 **
Public bathroom2.69 ± 0.931.19 ± 0.402.30 ± 1.060.000 **
Day break space2.72 ± 1.111.13 ± 0.562.29 ± 1.220.000 **
Night rest space2.19 ± 1.201.03 ± 0.181.88 ± 1.150.000 **
Card room2.95 ± 1.052.81 ± 1.222.91 ± 1.090.525
Dancing room2.99 ± 1.321.03 ± 0.182.47 ± 1.430.000 **
Video room2.79 ± 1.371.13 ± 0.432.34 ± 1.400.000 **
Study space2.52 ± 1.291.16 ± 0.452.16 ± 1.280.000 **
Centralized activity space: park3.66 ± 1.262.16 ± 0.973.26 ± 1.360.000 **
Decentralized activity space: small garden2.91 ± 1.201.16 ± 0.372.44 ± 1.300.000 **
Cultural hall3.32 ± 0.893.39 ± 1.123.34 ± 0.950.729
Paths between houses4.08 ± 1.213.71 ± 0.823.97 ± 1.140.115
Sidewalk3.64 ± 1.233.39 ± 0.763.58 ± 1.170.297
** p < 0.01.
Table 4. Characteristic variables of production needs and One-Way ANOVA test (Source: Author).
Production Demand IndicatorsClassification of Production Needs (Mean ± Standard Deviation)Average Score
(Mean ± Standard Deviation)
p
1′ (n = 58)2′ (n = 58)
Farming1.12 ± 0.383.64 ± 1.022.38 ± 1.470.000 **
Parking lot for agricultural vehicles1.09 ± 0.282.03 ± 0.731.56 ± 0.720.000 **
Storage space for fertilizer and pesticide1.05 ± 0.292.21 ± 1.021.63 ± 0.940.000 **
Food handling site1.14 ± 0.443.21 ± 1.532.17 ± 1.520.000 **
Community vegetable garden1.55 ± 0.923.90 ± 1.002.72 ± 1.510.000 **
Vegetable stand1.16 ± 0.451.98 ± 1.071.57 ± 0.910.000 **
Family workshop1.29 ± 0.561.57 ± 0.901.43 ± 0.760.050
Street-facing stores1.19 ± 0.691.38 ± 0.671.28 ± 0.680.135
Labor employment1.50 ± 0.821.31 ± 0.631.41 ± 0.730.165
** p < 0.01.
Table 5. Results of cross-sectional (chi-square) analysis of urbanization types and elderly migrants’ individual characteristics (Source: Author).
NameOptionPercentage of Type of Urbanization (N)Average Percentageχ²p
Type 1 (38)
Urban Group Urbanized Both in Living and Production
Type 2 (47)
Half-Urban-Half-Rural Group ONLY Urbanized in Living
Type 3 (20)
Half-Urban-Half-Rural Group Only Urbanized in Production
Type 4 (11)
Rural Group Not Urbanized Both in Living and Production
GenderFemale44.7%48.9%80.0%75.0%55.2%8.7680.033 *
Male55.3%51.1%20.0%25.0%44.8%
AgeLow29.0%63.8%20.0%36.4%42.2%26.1080.000 **
Mid36.8%31.9%50.0%63.6%39.7%
High34.2%4.3%30.0%0.0%18.1%
Marital statusMarried63.2%83.0%70.0%90.9%75.0%13.7730.032 *
Widowed36.8%10.6%30.0%9.1%22.4%
Unmarried, divorced0.0%6.4%0.00%0.0%2.6%
PensionLow60.5%48.9%65.0%36.4%54.3%4.2320.645
Mid23.7%29.80%25.0%45.5%28.5%
High15.80%21.3%10.0%18.2%17.2%
Housing conditionLow10.5%6.4%25.0%18.2%12.1%21.4740.002 **
Mid2.6%10.6%15.0%45.5%12.1%
High86.8%83.0%60.0%36.4%75.9%
Physical conditionHigh97.4%97.90%75.0%100%94.0%15.4340.001 **
Low2.6%2.1%25.0%0.0%6.0%
Work capacityWeak29.0%8.5%45.0%27.3%23.3%18.0590.006 **
Mid44.7%57.5%55.0%63.6%53.5%
Strong26.3%34.0%0.0%9.1%23.3%
Educational levelLow52.6%27.7%85.0%81.8%50.9%33.8640.000 **
Mid44.7%42.6%15.0%18.2%36.2%
High2.6%29.8%0.0%0.0%12.9%
* p < 0.05, **p < 0.01.
Publisher’s Note: MDPI stays neutral with regard to jurisdictional claims in published maps and institutional affiliations.