Accelerometer-Measured Physical Activity and Sedentary Behavior Levels and Patterns in Female Sixth Graders: The CReActivity Project


Abstract
1. Introduction
2. Materials and Methods
2.1. Participants
2.2. Measures
Physical Activity
2.3. Procedure
2.4. Data Analysis
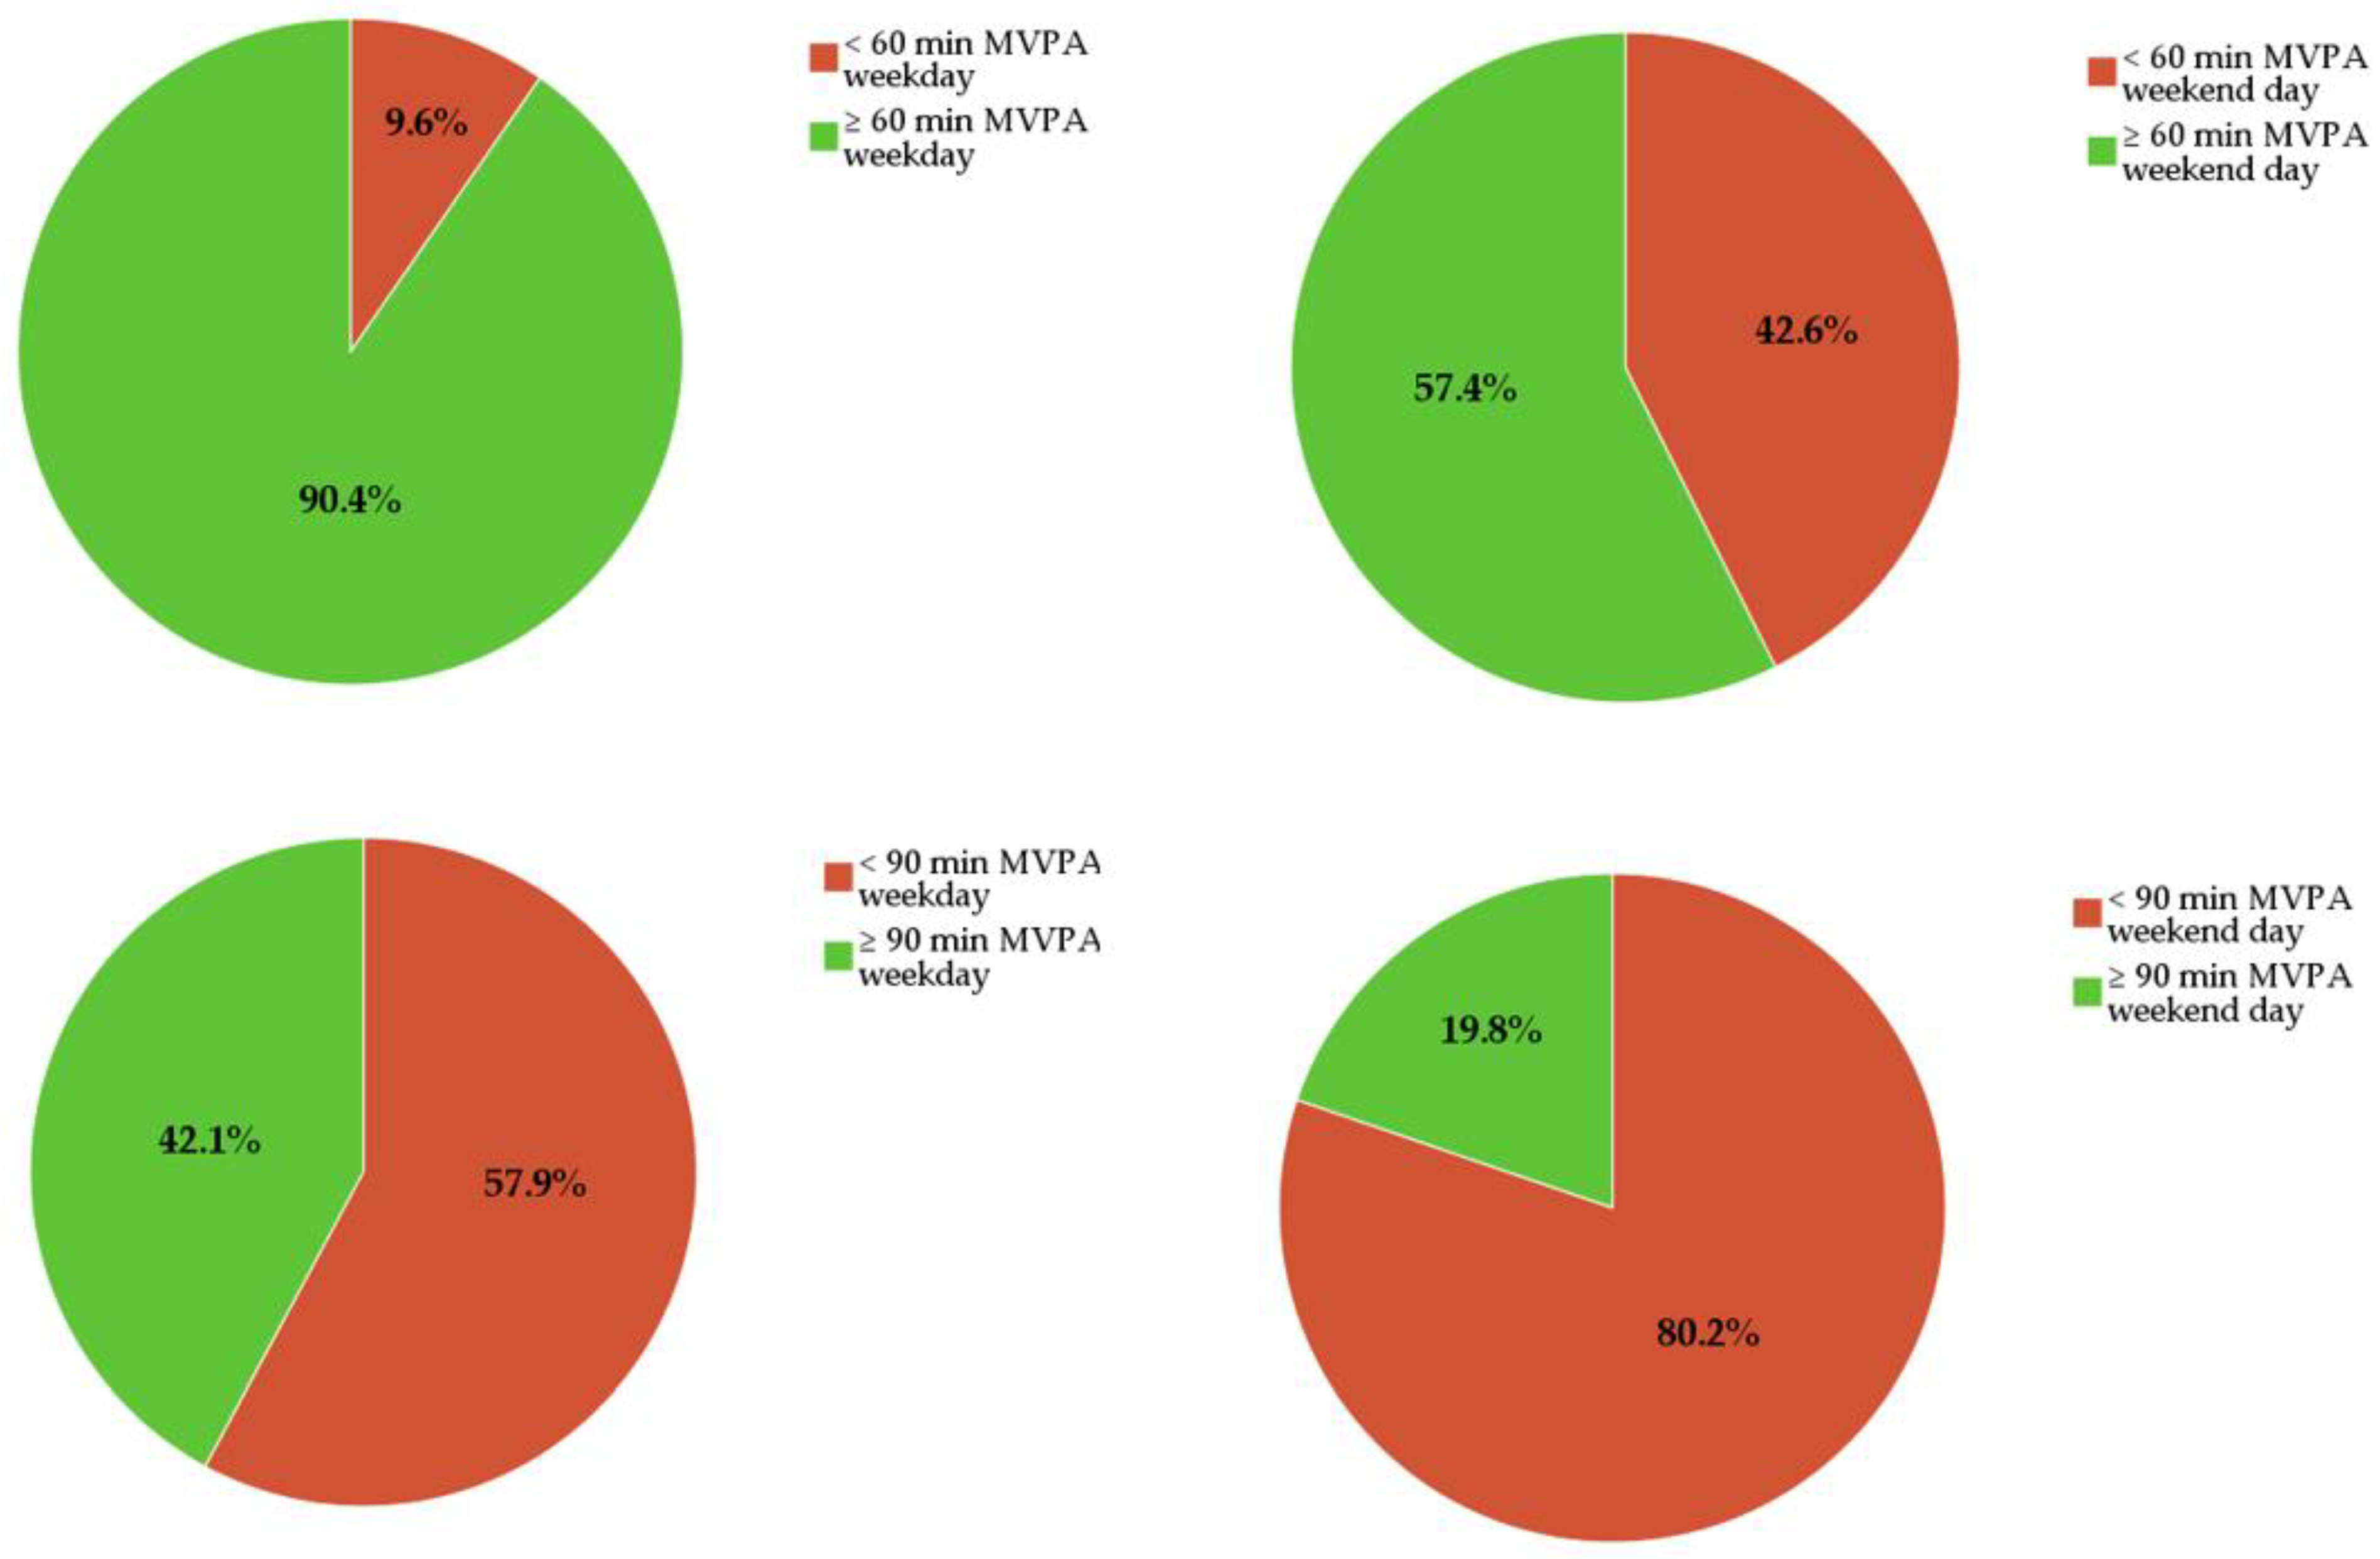
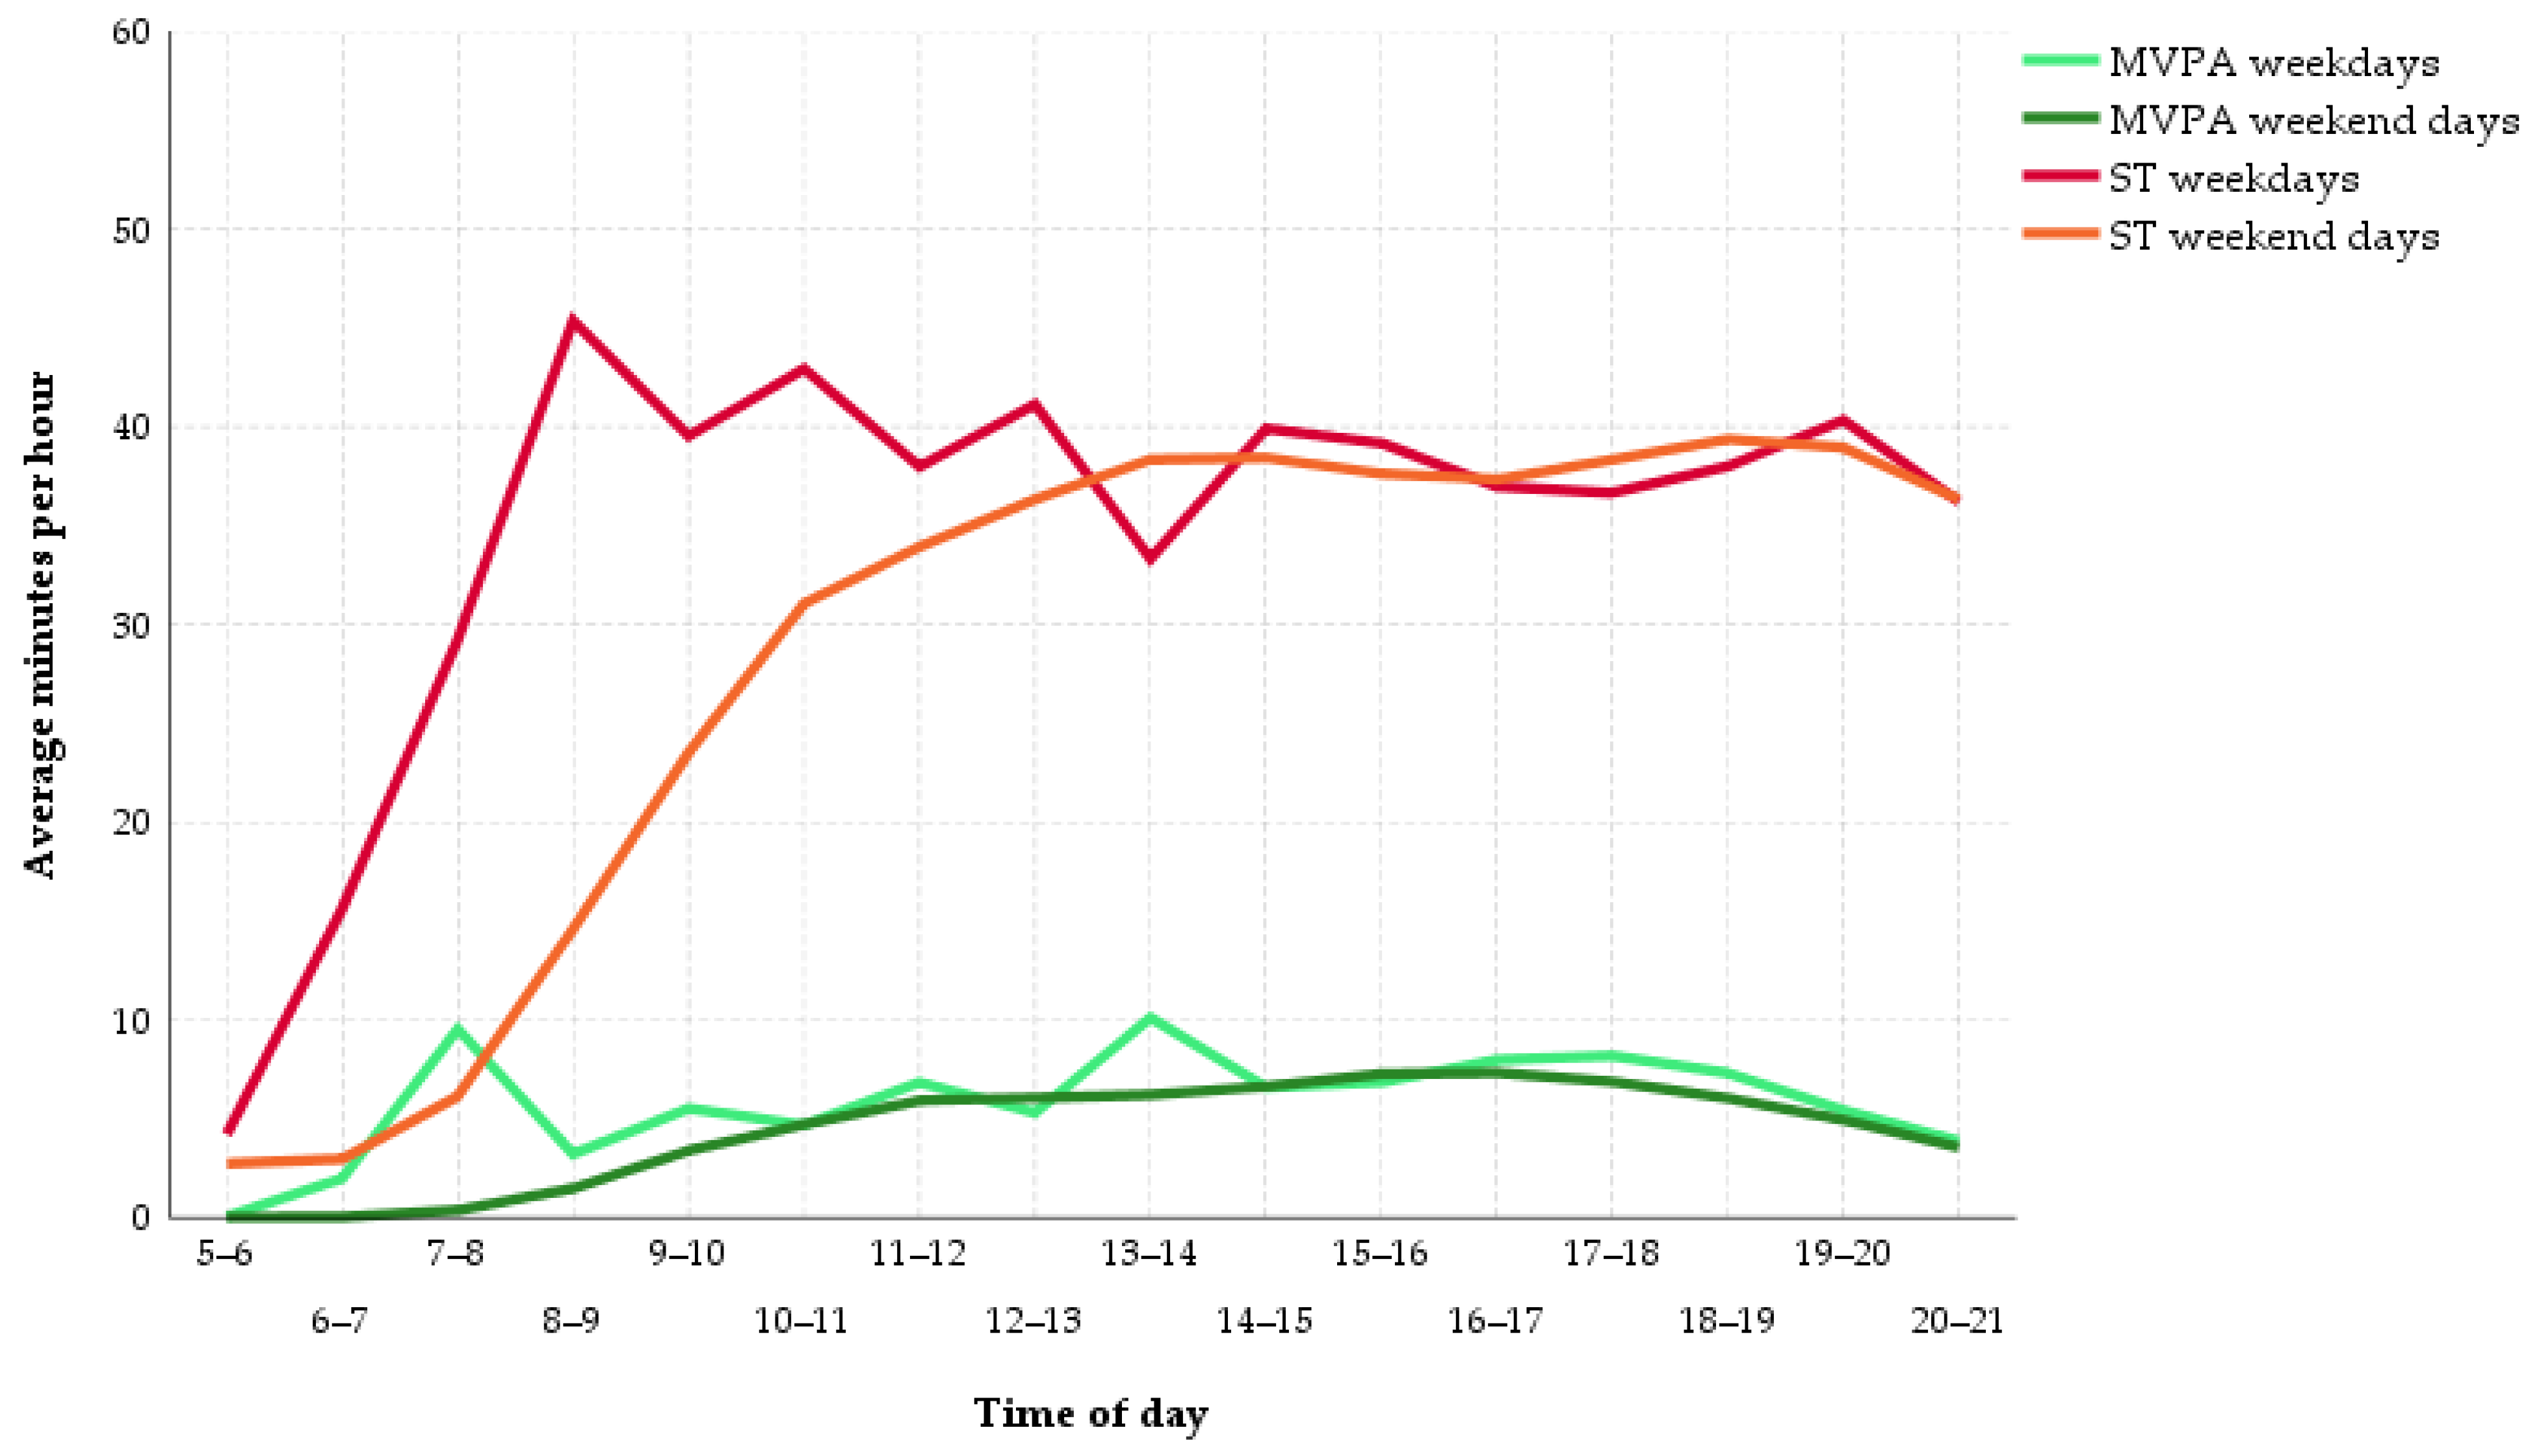
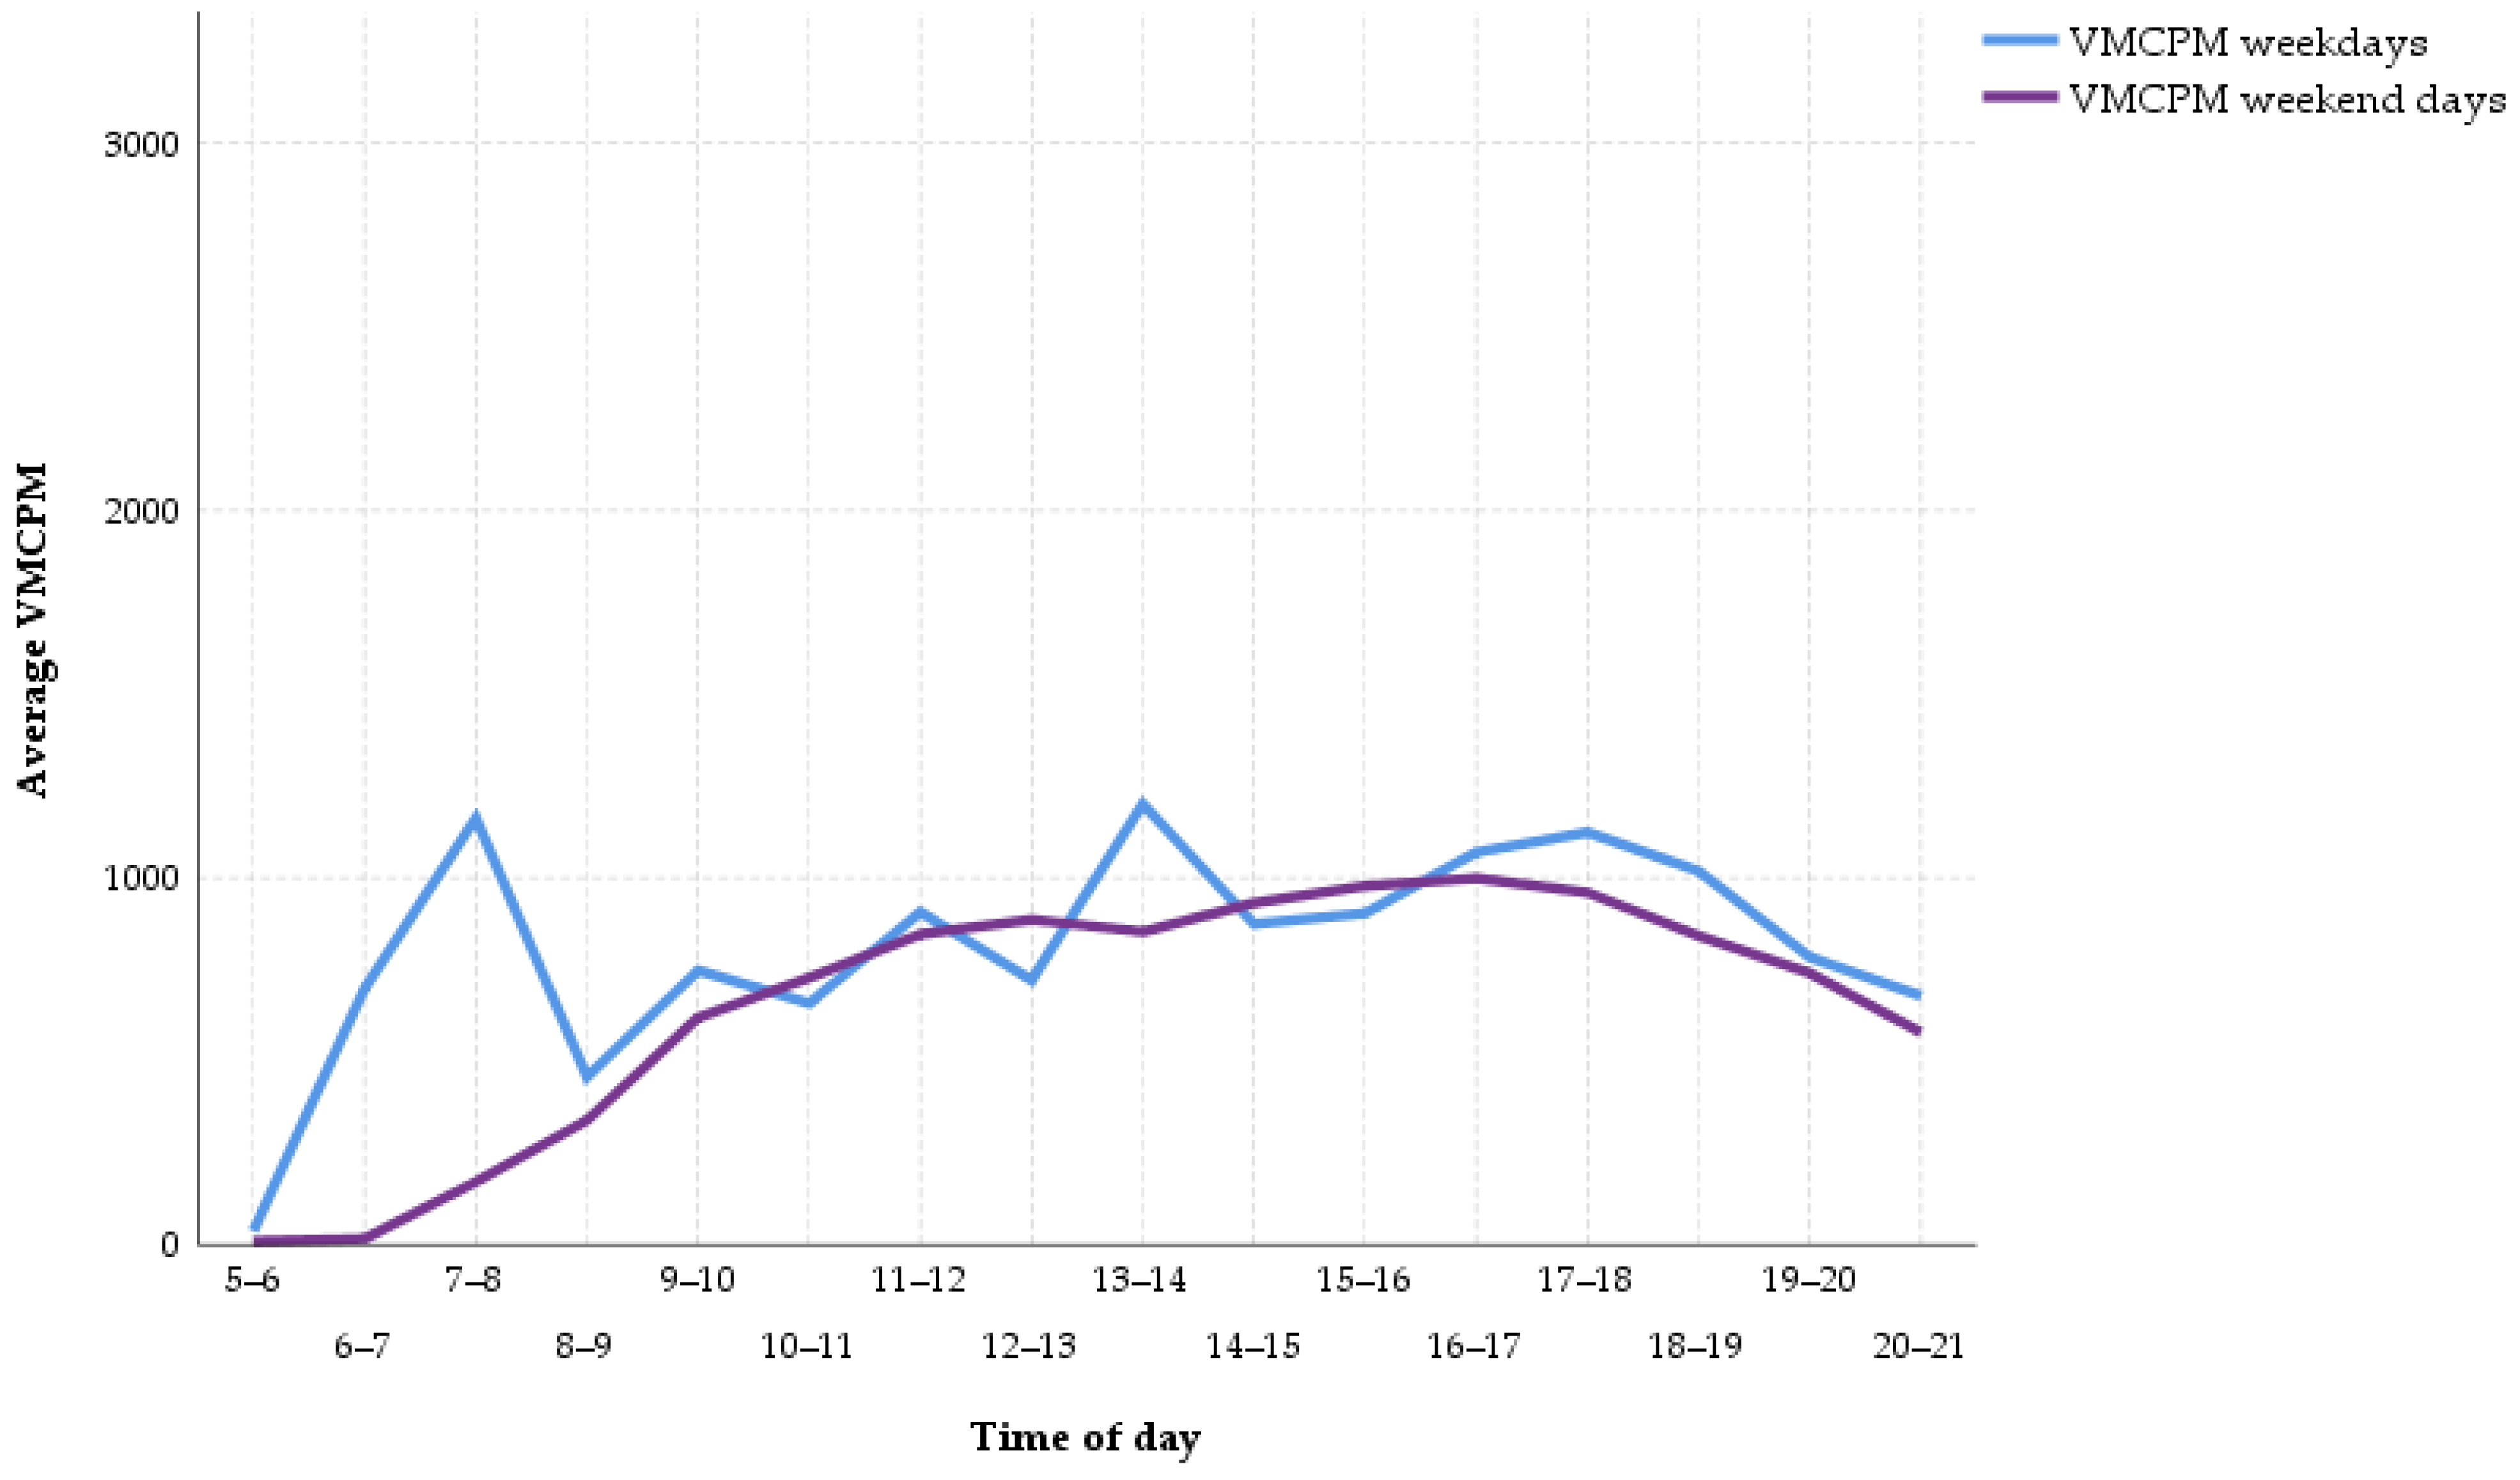
3. Results
4. Discussion
5. Conclusions
Supplementary Materials
Author Contributions
Funding
Institutional Review Board Statement
Informed Consent Statement
Data Availability Statement
Acknowledgments
Conflicts of Interest
References
- Bull, F.C.; Al-Ansari, S.S.; Biddle, S.; Borodulin, K.; Buman, M.P.; Cardon, G.; Carty, C.; Chaput, J.-P.; Chastin, S.; Chou, R.; et al. World Health Organization 2020 guidelines on physical activity and sedentary behaviour. Br. J. Sports Med. 2020, 54, 1451. [Google Scholar] [CrossRef] [PubMed]
- Rütten, A.; Pfeifer, K. Nationale Empfehlungen für Bewegung und Bewegungsförderung; Bundeszentrale für gesundheitliche Aufklärung: Köln, Germany, 2017. [Google Scholar]
- Janssen, I.; LeBlanc, A.G. Systematic review of the health benefits of physical activity and fitness in school-aged children and youth. Int. J. Behav. Nutr. Phys. Act. 2010, 7, 40. [Google Scholar] [CrossRef] [PubMed]
- Poitras, V.J.; Gray, C.E.; Borghese, M.M.; Carson, V.; Chaput, J.P.; Janssen, I.; Katzmarzyk, P.T.; Pate, R.R.; Connor Gorber, S.; Kho, M.E.; et al. Systematic review of the relationships between objectively measured physical activity and health indicators in school-aged children and youth. Appl. Physiol. Nutr. Metab. 2016, 41, S197–S239. [Google Scholar] [CrossRef] [PubMed]
- Tremblay, M.S.; Aubert, S.; Barnes, J.D.; Saunders, T.J.; Carson, V.; Latimer-Cheung, A.E.; Chastin, S.F.M.; Altenburg, T.M.; Chinapaw, M.J.M.; Altenburg, T.M.; et al. Sedentary Behavior Research Network (SBRN)—Terminology Consensus Project process and outcome. Int. J. Behav. Nutr. Phys. Act. 2017, 14, 75. [Google Scholar] [CrossRef] [PubMed]
- Tremblay, M.S.; LeBlanc, A.G.; Janssen, I.; Kho, M.E.; Hicks, A.; Murumets, K.; Colley, R.C.; Duggan, M. Canadian sedentary behaviour guidelines for children and youth. Appl. Physiol. Nutr. Metab. 2011, 36, 59–64. [Google Scholar] [CrossRef] [PubMed]
- van der Ploeg, H.P.; Hillsdon, M. Is sedentary behaviour just physical inactivity by another name? Int. J. Behav. Nutr. Phys. Act. 2017, 14, 142. [Google Scholar] [CrossRef]
- Carson, V.; Hunter, S.; Kuzik, N.; Gray, C.E.; Poitras, V.J.; Chaput, J.P.; Saunders, T.J.; Katzmarzyk, P.T.; Okely, A.D.; Connor Gorber, S.; et al. Systematic review of sedentary behaviour and health indicators in school-aged children and youth: An update. Appl. Physiol. Nutr. Metab. 2016, 41, S240–S265. [Google Scholar] [CrossRef]
- Loprinzi, P.D.; Cardinal, B.J. Measuring children’s physical activity and sedentary behaviors. J. Exerc. Sci. Fit. 2011, 9, 15–23. [Google Scholar] [CrossRef]
- Hänggi, J.M.; Phillips, L.R.; Rowlands, A.V. Validation of the GT3X ActiGraph in children and comparison with the GT1M ActiGraph. J. Sci. Med. Sport 2013, 16, 40–44. [Google Scholar] [CrossRef]
- Sherar, L.B.; Griew, P.; Esliger, D.W.; Cooper, A.R.; Ekelund, U.; Judge, K.; Riddoch, C. International Children’s Accelerometry Database (ICAD): Design and methods. BMC Public Health 2011, 11, 485. [Google Scholar] [CrossRef]
- Demetriou, Y.; Hebestreit, A.; Reimers, A.K.; Schlund, A.; Niessner, C.; Schmidt, S.; Finger, J.D.; Mutz, M.; Völker, K.; Vogt, L.; et al. Results from Germany’s 2018 report card on physical activity for children and youth. J. Phys. Act. Health 2018, 15, S363–S365. [Google Scholar] [CrossRef]
- Finger, J.D.; Varnaccia, G.; Borrmann, A.; Lange, C.; Mensink, G. Körperliche Aktivität von Kindern und Jugendlichen in Deutschland—Querschnittergebnisse aus KiGGS Welle 2 und Trends. J. Health Monit. 2018, 3, 24–31. [Google Scholar] [CrossRef]
- Bucksch, J.; Inchley, J.; Hamrik, Z.; Finne, E.; Kolip, P.; the HBSC Study Group Germany. Trends in television time, non-gaming PC use and moderate-to-vigorous physical activity among German adolescents 2002–2010. BMC Public Health 2014, 14, 351. [Google Scholar] [CrossRef] [PubMed]
- Konstabel, K.; Veidebaum, T.; Verbestel, V.; Moreno, L.A.; Bammann, K.; Tornaritis, M.; Eiben, G.; Molnar, D.; Siani, A.; Sprengeler, O.; et al. Objectively measured physical activity in European children: The IDEFICS study. Int. J. Obes. (Lond.) 2014, 38 (Suppl. 2), S135–S143. [Google Scholar] [CrossRef] [PubMed]
- Pfitzner, R.; Gorzelniak, L.; Heinrich, J.; von Berg, A.; Klümper, C.; Bauer, C.P.; Koletzko, S.; Berdel, D.; Horsch, A.; Schulz, H. Physical activity in German adolescents measured by accelerometry and activity diary: Introducing a comprehensive approach for data management and preliminary results. PLoS ONE 2013, 8, e65192. [Google Scholar] [CrossRef] [PubMed]
- Woll, A.; Oriwol, D.; Anedda, B.; Burchartz, A.; Hanssen-Doose, A.; Kopp, M.; Niessner, C.; Schmidt, S.; Bös, K.; Worth, A. Körperliche Aktivität, Motorische Leistungsfähigkeit und Gesundheit in Deutschland: Ergebnisse aus der Motorik-Modul-Längsschnittstudie (MoMo); Karlsruher Institut für Technologie (KIT): Karlsruhe, Germany, 2019. [Google Scholar]
- Cooper, A.; Goodman, A.; Page, A.; Sherar, L.; Esliger, D.; Sluijs, E.; Andersen, L.; Anderssen, S.; Cardon, G.; Davey, R.; et al. Objectively measured physical activity and sedentary time in youth: The International children’s accelerometry database (ICAD). Int. J. Behav. Nutr. Phys. Act. 2015, 12, 113. [Google Scholar] [CrossRef] [PubMed]
- Manz, K.; Schlack, R.; Poethko-Müller, C.; Mensink, G.; Finger, J.; Lampert, T. Körperlich-sportliche Aktivität und Nutzung elektronischer Medien im Kindes- und Jugendalter. In Bundesgesundheitsblatt—Gesundheitsforschung—Gesundheitsschutz; Robert Koch-Institut, Epidemiologie und Gesundheitsberichterstattung: Berlin, Germany, 2014; Volume 57. [Google Scholar]
- Huber, G.; Köppel, M. Analysis of sedentary times of children and adolescents between 4 and 20 years. Dtsch. Z. Sportmed. 2017, 67, 101–106. [Google Scholar] [CrossRef]
- Brooke, H.L.; Corder, K.; Atkin, A.J.; van Sluijs, E.M. A systematic literature review with meta-analyses of within- and between-day differences in objectively measured physical activity in school-aged children. Sports Med. (Auckl.) 2014, 44, 1427–1438. [Google Scholar] [CrossRef] [PubMed]
- Aznar, S.; Naylor, P.J.; Silva, P.; Pérez, M.; Angulo, T.; Laguna, M.; Lara, M.T.; López-Chicharro, J. Patterns of physical activity in Spanish children: A descriptive pilot study. Child Care Health Dev. 2011, 37, 322–328. [Google Scholar] [CrossRef]
- Rhodes, R.E.; McEwan, D.; Rebar, A.L. Theories of physical activity behaviour change: A history and synthesis of approaches. Psychol. Sport. Exerc. 2019, 42, 100–109. [Google Scholar] [CrossRef]
- Parajára, M.d.C.; de Castro, B.M.; Coelho, D.B.; Meireles, A.L. Are neighborhood characteristics associated with sedentary behavior in adolescents? A systematic review. Int. J. Environ. Health Res. 2020, 30, 388–408. [Google Scholar] [CrossRef] [PubMed]
- Messing, S.; Rütten, A.; Abu-Omar, K.; Ungerer-Röhrich, U.; Goodwin, L.; Burlacu, I.; Gediga, G. How can physical activity be promoted among children and adolescents? A systematic review of reviews across settings. Front. Public Health 2019, 7, 55. [Google Scholar] [CrossRef] [PubMed]
- Innerd, A.L.; Azevedo, L.B.; Batterham, A.M. The effect of a curriculum-based physical activity intervention on accelerometer-assessed physical activity in schoolchildren: A non-randomised mixed methods controlled before-and-after study. PLoS ONE 2019, 14, e0225997. [Google Scholar] [CrossRef] [PubMed]
- Parrish, A.-M.; Okely, A.D.; Stanley, R.M.; Ridgers, N.D. The effect of school recess interventions on physical activity. Sports Med. 2013, 43, 287–299. [Google Scholar] [CrossRef]
- Larouche, R.; Mammen, G.; Rowe, D.A.; Faulkner, G. Effectiveness of active school transport interventions: A systematic review and update. BMC Public Health 2018, 18, 206. [Google Scholar] [CrossRef]
- Demetriou, Y.; Gillison, F.; McKenzie, T. After-school physical activity interventions on child and adolescent physical activity and health: A review of reviews. Adv. Phys. Educ. 2017, 7, 191–215. [Google Scholar] [CrossRef]
- Migueles, J.H.; Cadenas-Sanchez, C.; Ekelund, U.; Delisle Nystrom, C.; Mora-Gonzalez, J.; Lof, M.; Labayen, I.; Ruiz, J.R.; Ortega, F.B. Accelerometer data collection and processing criteria to assess physical activity and other outcomes: A systematic review and practical considerations. Sports Med. (Auckl.) 2017, 47, 1821–1845. [Google Scholar] [CrossRef]
- Demetriou, Y.; Bachner, J. A school-based intervention based on self-determination theory to promote girls’ physical activity: Study protocol of the CReActivity cluster randomised controlled trial. BMC Public Health 2019, 19, 519. [Google Scholar] [CrossRef]
- Nold, D. Sozioökonomischer Status von Schülerinnen und Schülern 2008. Ergebnisse des Mikrozensus. Wirtsch. Stat. 2010, 2, 138–149. [Google Scholar]
- Rutterford, C.; Copas, A.; Eldridge, S. Methods for sample size determination in cluster randomized trials. Int. J. Epidemiol. 2015, 44, 1051–1067. [Google Scholar] [CrossRef]
- Ganzeboom, H. A new International Socio-Economic Index (ISEI) of occupational status for the International Standard Classification of Occupation 2008 (ISCO-08) constructed with data from the ISSP 2002–2007. In Proceedings of the Annual Conference of International Social Survey Programme, Lisbon, Portugal, 5 January 2010. [Google Scholar]
- Ried-Larsen, M.; Brønd, J.C.; Brage, S.; Hansen, B.H.; Grydeland, M.; Andersen, L.B.; Møller, N.C. Mechanical and free-living comparisons of four generations of the Actigraph activity monitor. Int. J. Behav. Nutr. Phys. Act. 2012, 9, 113. [Google Scholar] [CrossRef] [PubMed]
- Tudor-Locke, C.; Barreira, T.V.; Schuna, J.M.; Mire, E.F.; Chaput, J.-P.; Fogelholm, M.; Hu, G.; Kuriyan, R.; Kurpad, A.; Lambert, E.V.; et al. Improving wear time compliance with a 24-hour waist-worn accelerometer protocol in the International Study of Childhood Obesity, Lifestyle and the Environment (ISCOLE). Int. J. Behav. Nutr. Phys. Act. 2015, 12, 11. [Google Scholar] [CrossRef] [PubMed]
- Aibar, A.; Bois, J.E.; Zaragoza, J.; Generelo, E.; Julian, J.A.; Paillard, T. Do epoch lengths affect adolescents’ compliance with physical activity guidelines? J. Sports Med. Phys. Fit. 2014, 54, 326–334. [Google Scholar]
- Howe, C.A.; Staudenmayer, J.W.; Freedson, P.S. Accelerometer prediction of energy expenditure: Vector magnitude versus vertical axis. Med. Sci. Sports Exerc. 2009, 41, 2199–2206. [Google Scholar] [CrossRef]
- Choi, L.; Liu, Z.; Matthews, C.E.; Buchowski, M.S. Validation of accelerometer wear and nonwear time classification algorithm. Med. Sci. Sports Exerc. 2011, 43, 357–364. [Google Scholar] [CrossRef]
- IBM Corporation. IBM SPSS Statistics for Windows; 25.0; IBM Corporation: Armonk, NY, USA, 2017. [Google Scholar]
- Cohen, J. A power primer. Psychol. Bull. 1992, 112, 155–159. [Google Scholar] [CrossRef]
- Ruiz, J.R.; Ortega, F.B.; Martínez-Gómez, D.; Labayen, I.; Moreno, L.A.; De Bourdeaudhuij, I.; Manios, Y.; Gonzalez-Gross, M.; Mauro, B.; Molnar, D.; et al. Objectively measured physical activity and sedentary time in European adolescents: The HELENA study. Am. J. Epidemiol. 2011, 174, 173–184. [Google Scholar] [CrossRef]
- Chinapaw, M.J.M.; de Niet, M.; Verloigne, M.; De Bourdeaudhuij, I.; Brug, J.; Altenburg, T.M. from sedentary time to sedentary patterns: Accelerometer data reduction decisions in youth. PLoS ONE 2014, 9, e111205. [Google Scholar] [CrossRef]
- Hallal, P.C.; Andersen, L.B.; Bull, F.C.; Guthold, R.; Haskell, W.; Ekelund, U. Global physical activity levels: Surveillance progress, pitfalls, and prospects. Lancet 2012, 380, 247–257. [Google Scholar] [CrossRef]
- Cabanas-Sánchez, V.; García-Cervantes, L.; Esteban-Gonzalo, L.; Girela-Rejón, M.J.; Castro-Piñero, J.; Veiga, Ó.L. Social correlates of sedentary behavior in young people: The UP&DOWN study. J. Sport Health Sci. 2020, 9, 189–196. [Google Scholar] [CrossRef]
- Hasler, B.P.; Dahl, R.E.; Holm, S.M.; Jakubcak, J.L.; Ryan, N.D.; Silk, J.S.; Phillips, M.L.; Forbes, E.E. Weekend-weekday advances in sleep timing are associated with altered reward-related brain function in healthy adolescents. Biol. Psychol. 2012, 91, 334–341. [Google Scholar] [CrossRef]
- Atkin, A.J.; Foley, L.; Corder, K.; Ekelund, U.; van Sluijs, E.M. Determinants of three-year change in children’s objectively measured sedentary time. PLoS ONE 2016, 11, e0167826. [Google Scholar] [CrossRef] [PubMed]
- Grao-Cruces, A.; Sánchez-Oliva, D.; Padilla-Moledo, C.; Izquierdo-Gómez, R.; Cabanas-Sánchez, V.; Castro-Piñero, J. Changes in the school and non-school sedentary time in youth: The UP&DOWN longitudinal study. J. Sports Sci. 2020, 38, 780–786. [Google Scholar] [CrossRef] [PubMed]
- Harding, S.K.; Page, A.S.; Falconer, C.; Cooper, A.R. Longitudinal changes in sedentary time and physical activity during adolescence. Int. J. Behav. Nutr. Phys. Act. 2015, 12, 44. [Google Scholar] [CrossRef] [PubMed]
- Börner, N.; Conraths, A.; Gerken, U.; Steinhauer, R.; Stötzel, J.; Tabel, A. Bildungsbericht Ganztagsschule NRW 2014; Technische Universität Dortmund: Dortmund, Germany, 2014. [Google Scholar]
- Ryan, R.M.; Deci, E.L. Self-determination theory and the facilitation of intrinsic motivation, social development, and well-being. Am. Psychol. 2000, 55, 68–78. [Google Scholar] [CrossRef] [PubMed]
- Vaquero-Solís, M.; Gallego, D.I.; Tapia-Serrano, M.; Pulido, J.J.; Sánchez-Miguel, P.A. School-based physical activity interventions in children and adolescents: A systematic review. Int. J. Environ. Res. Public Health 2020, 17, 999. [Google Scholar] [CrossRef] [PubMed]
- Standage, M.; Gillison, F.B.; Ntoumanis, N.; Treasure, D.C. Predicting students’ physical activity and health-related well-being: A prospective cross-domain investigation of motivation across school physical education and exercise settings. J. Sport Exerc. Psychol. 2012, 34, 37–60. [Google Scholar] [CrossRef] [PubMed]
- Chatzisarantis, N.L.; Hagger, M.S. Effects of an intervention based on self-determination theory on self-reported leisure-time physical activity participation. Psychol. Health 2009, 24, 29–48. [Google Scholar] [CrossRef]
- McDavid, L.; Cox, A.E.; McDonough, M.H. Need fulfillment and motivation in physical education predict trajectories of change in leisure-time physical activity in early adolescence. Psychol. Sport Exerc. 2014, 15, 471–480. [Google Scholar] [CrossRef]
- Laird, Y.; Fawkner, S.; Kelly, P.; McNamee, L.; Niven, A. The role of social support on physical activity behaviour in adolescent girls: A systematic review and meta-analysis. Int. J. Behav. Nutr. Phys. Act. 2016, 13, 79. [Google Scholar] [CrossRef]
- Rodrigues, A.M.; O’Brien, N.; French, D.P.; Glidewell, L.; Sniehotta, F.F. The question-behavior effect: Genuine effect or spurious phenomenon? A systematic review of randomized controlled trials with meta-analyses. Health Psychol. 2015, 34, 61–78. [Google Scholar] [CrossRef] [PubMed]
- Dössegger, A.; Ruch, N.; Jimmy, G.; Braun-Fahrländer, C.; Mäder, U.; Hänggi, J.; Hofmann, H.; Puder, J.J.; Kriemler, S.; Bringolf-Isler, B. Reactivity to accelerometer measurement of children and adolescents. Med. Sci. Sports Exerc. 2014, 46, 1140–1146. [Google Scholar] [CrossRef] [PubMed]
- Wickström, G.; Bendix, T. The “Hawthorne effect”—What did the original Hawthorne studies actually show? Scand. J. Work Environ. Health 2000, 26, 363–367. [Google Scholar] [CrossRef] [PubMed]
- Waters, L.; Reeves, M.; Fjeldsoe, B.; Eakin, E. Control group improvements in physical activity intervention trials and possible explanatory factors: A systematic review. J. Phys. Act. Health 2012, 9, 884–895. [Google Scholar] [CrossRef] [PubMed]
- Banda, J.A.; Haydel, K.F.; Davila, T.; Desai, M.; Bryson, S.; Haskell, W.L.; Matheson, D.; Robinson, T.N. Effects of varying epoch lengths, wear time algorithms, and activity cut-points on estimates of child sedentary behavior and physical activity from accelerometer data. PLoS ONE 2016, 11, e0150534. [Google Scholar] [CrossRef]
- Evenson, K.R.; Catellier, D.J.; Gill, K.; Ondrak, K.S.; McMurray, R.G. Calibration of two objective measures of physical activity for children. J. Sports Sci. 2008, 26, 1557–1565. [Google Scholar] [CrossRef]
- Romanzini, M.; Petroski, E.L.; Ohara, D.; Dourado, A.C.; Reichert, F.F. Calibration of ActiGraph GT3X, Actical and RT3 accelerometers in adolescents. Eur. J. Sport Sci. 2014, 14, 91–99. [Google Scholar] [CrossRef]
- Treuth, M.S.; Schmitz, K.; Catellier, D.J.; McMurray, R.G.; Murray, D.M.; Almeida, M.J.; Going, S.; Norman, J.E.; Pate, R. Defining accelerometer thresholds for activity intensities in adolescent girls. Med. Sci. Sports Exerc. 2004, 36, 1259–1266. [Google Scholar]
- Puyau, M.R.; Adolph, A.L.; Vohra, F.A.; Butte, N.F. Validation and calibration of physical activity monitors in children. Obes. Res. 2002, 10, 150–157. [Google Scholar] [CrossRef]
- Mattocks, C.; Leary, S.; Ness, A.; Deere, K.; Saunders, J.; Tilling, K.; Kirkby, J.; Blair, S.N.; Riddoch, C. Calibration of an accelerometer during free-living activities in children. Int. J. Pediatr. Obes. 2007, 2, 218–226. [Google Scholar] [CrossRef]
- Keadle, S.K.; Shiroma, E.J.; Freedson, P.S.; Lee, I.M. Impact of accelerometer data processing decisions on the sample size, wear time and physical activity level of a large cohort study. BMC Public Health 2014, 14, 1210. [Google Scholar] [CrossRef] [PubMed]
- Migueles, J.H.; Cadenas-Sanchez, C.; Tudor-Locke, C.; Löf, M.; Esteban-Cornejo, I.; Molina-Garcia, P.; Mora-Gonzalez, J.; Rodriguez-Ayllon, M.; Garcia-Marmol, E.; Ekelund, U.; et al. Comparability of published cut-points for the assessment of physical activity: Implications for data harmonization. Scand. J. Med. Sci. Sports 2019, 29, 566–574. [Google Scholar] [CrossRef] [PubMed]
- Burchartz, A.; Manz, K.; Anedda, B.; Niessner, C.; Oriwol, D.; Schmidt, S.C.; Woll, A. Measurement of physical activity and sedentary behavior by accelerometry among a nationwide sample from the KiGGS and MoMo study: Study protocol. JMIR Res. Protoc. 2020, 9, e14370. [Google Scholar] [CrossRef] [PubMed]
- Vanhelst, J.; Béghin, L.; Salleron, J.; Ruiz, J.R.; Ortega, F.B.; Ottevaere, C.; Molnar, D.; Kafatos, A.; Manios, Y.; Widhalm, K.; et al. Impact of the choice of threshold on physical activity patterns in free living conditions among adolescents measured using a uniaxial accelerometer: The HELENA study. J. Sports Sci. 2014, 32, 110–115. [Google Scholar] [CrossRef] [PubMed]
- Rich, C.; Griffiths, L.J.; Dezateux, C. Seasonal variation in accelerometer-determined sedentary behaviour and physical activity in children: A review. Int. J. Behav. Nutr. Phys. Act. 2012, 9, 49. [Google Scholar] [CrossRef]
- Atkin, A.J.; Sharp, S.J.; Harrison, F.; Brage, S.; Van Sluijs, E.M.F. Seasonal variation in children’s physical activity and sedentary time. Med. Sci. Sports Exerc. 2016, 48, 449–456. [Google Scholar] [CrossRef]


| Weekday | Weekend Day | Wilcoxon Test Z-Value, Effect Size r | Total | |
|---|---|---|---|---|
| ST/day (min) | 515.0 (72.5) | 434.8 (91.6) | −14.07 ***, 0.48 | 493.7 (67.6) |
| LPA/day (min) | 177.0 (50.4) | 147.0 (51.6) | −13.10 ***, 0.45 | 168.7 (47.2) |
| MVPA/day (min) | 87.5 (23.2) | 68.4 (30.2) | −13.20 ***, 0.45 | 82.3 (22.4) |
| VMCPM (min) | 875.2 (225.3) | 855.2 (323.3) | −2.72 **, 0.09 | 867.9 (221.9) |
| WT/day (min) | 779.4 (57.5) | 650.1 (94.7) | −16.21 ***, 0.56 | 744.6 (50.7) |
| ST/WT (%) | 66.0 (7.7) | 66.9 (9.9) | −2.56 *, 0.09 | 66.3 (7.6) |
| LPA/WT (%) | 22.7 (6.4) | 22.6 (7.4) | −0.63, 0.02 | 22.7 (6.3) |
| MVPA/WT (%) | 11.2 (2.9) | 10.5 (4.4) | −5.39 ***, 0.18 | 11.1 (2.9) |
Publisher’s Note: MDPI stays neutral with regard to jurisdictional claims in published maps and institutional affiliations. |
© 2020 by the authors. Licensee MDPI, Basel, Switzerland. This article is an open access article distributed under the terms and conditions of the Creative Commons Attribution (CC BY) license (http://creativecommons.org/licenses/by/4.0/).
Share and Cite
Bachner, J.; Sturm, D.J.; Demetriou, Y. Accelerometer-Measured Physical Activity and Sedentary Behavior Levels and Patterns in Female Sixth Graders: The CReActivity Project. Int. J. Environ. Res. Public Health 2021, 18, 32. https://doi.org/10.3390/ijerph18010032
Bachner J, Sturm DJ, Demetriou Y. Accelerometer-Measured Physical Activity and Sedentary Behavior Levels and Patterns in Female Sixth Graders: The CReActivity Project. International Journal of Environmental Research and Public Health. 2021; 18(1):32. https://doi.org/10.3390/ijerph18010032
Chicago/Turabian StyleBachner, Joachim, David J. Sturm, and Yolanda Demetriou. 2021. "Accelerometer-Measured Physical Activity and Sedentary Behavior Levels and Patterns in Female Sixth Graders: The CReActivity Project" International Journal of Environmental Research and Public Health 18, no. 1: 32. https://doi.org/10.3390/ijerph18010032
APA StyleBachner, J., Sturm, D. J., & Demetriou, Y. (2021). Accelerometer-Measured Physical Activity and Sedentary Behavior Levels and Patterns in Female Sixth Graders: The CReActivity Project. International Journal of Environmental Research and Public Health, 18(1), 32. https://doi.org/10.3390/ijerph18010032