The Effects of Urban Containment Policies on Public Health


Abstract
1. Introduction
2. Previous Studies
2.1. Urban Containment Policies (UCPs) and Urban Growth
2.2. Urban Containment Policies (UCPs) and Public Health
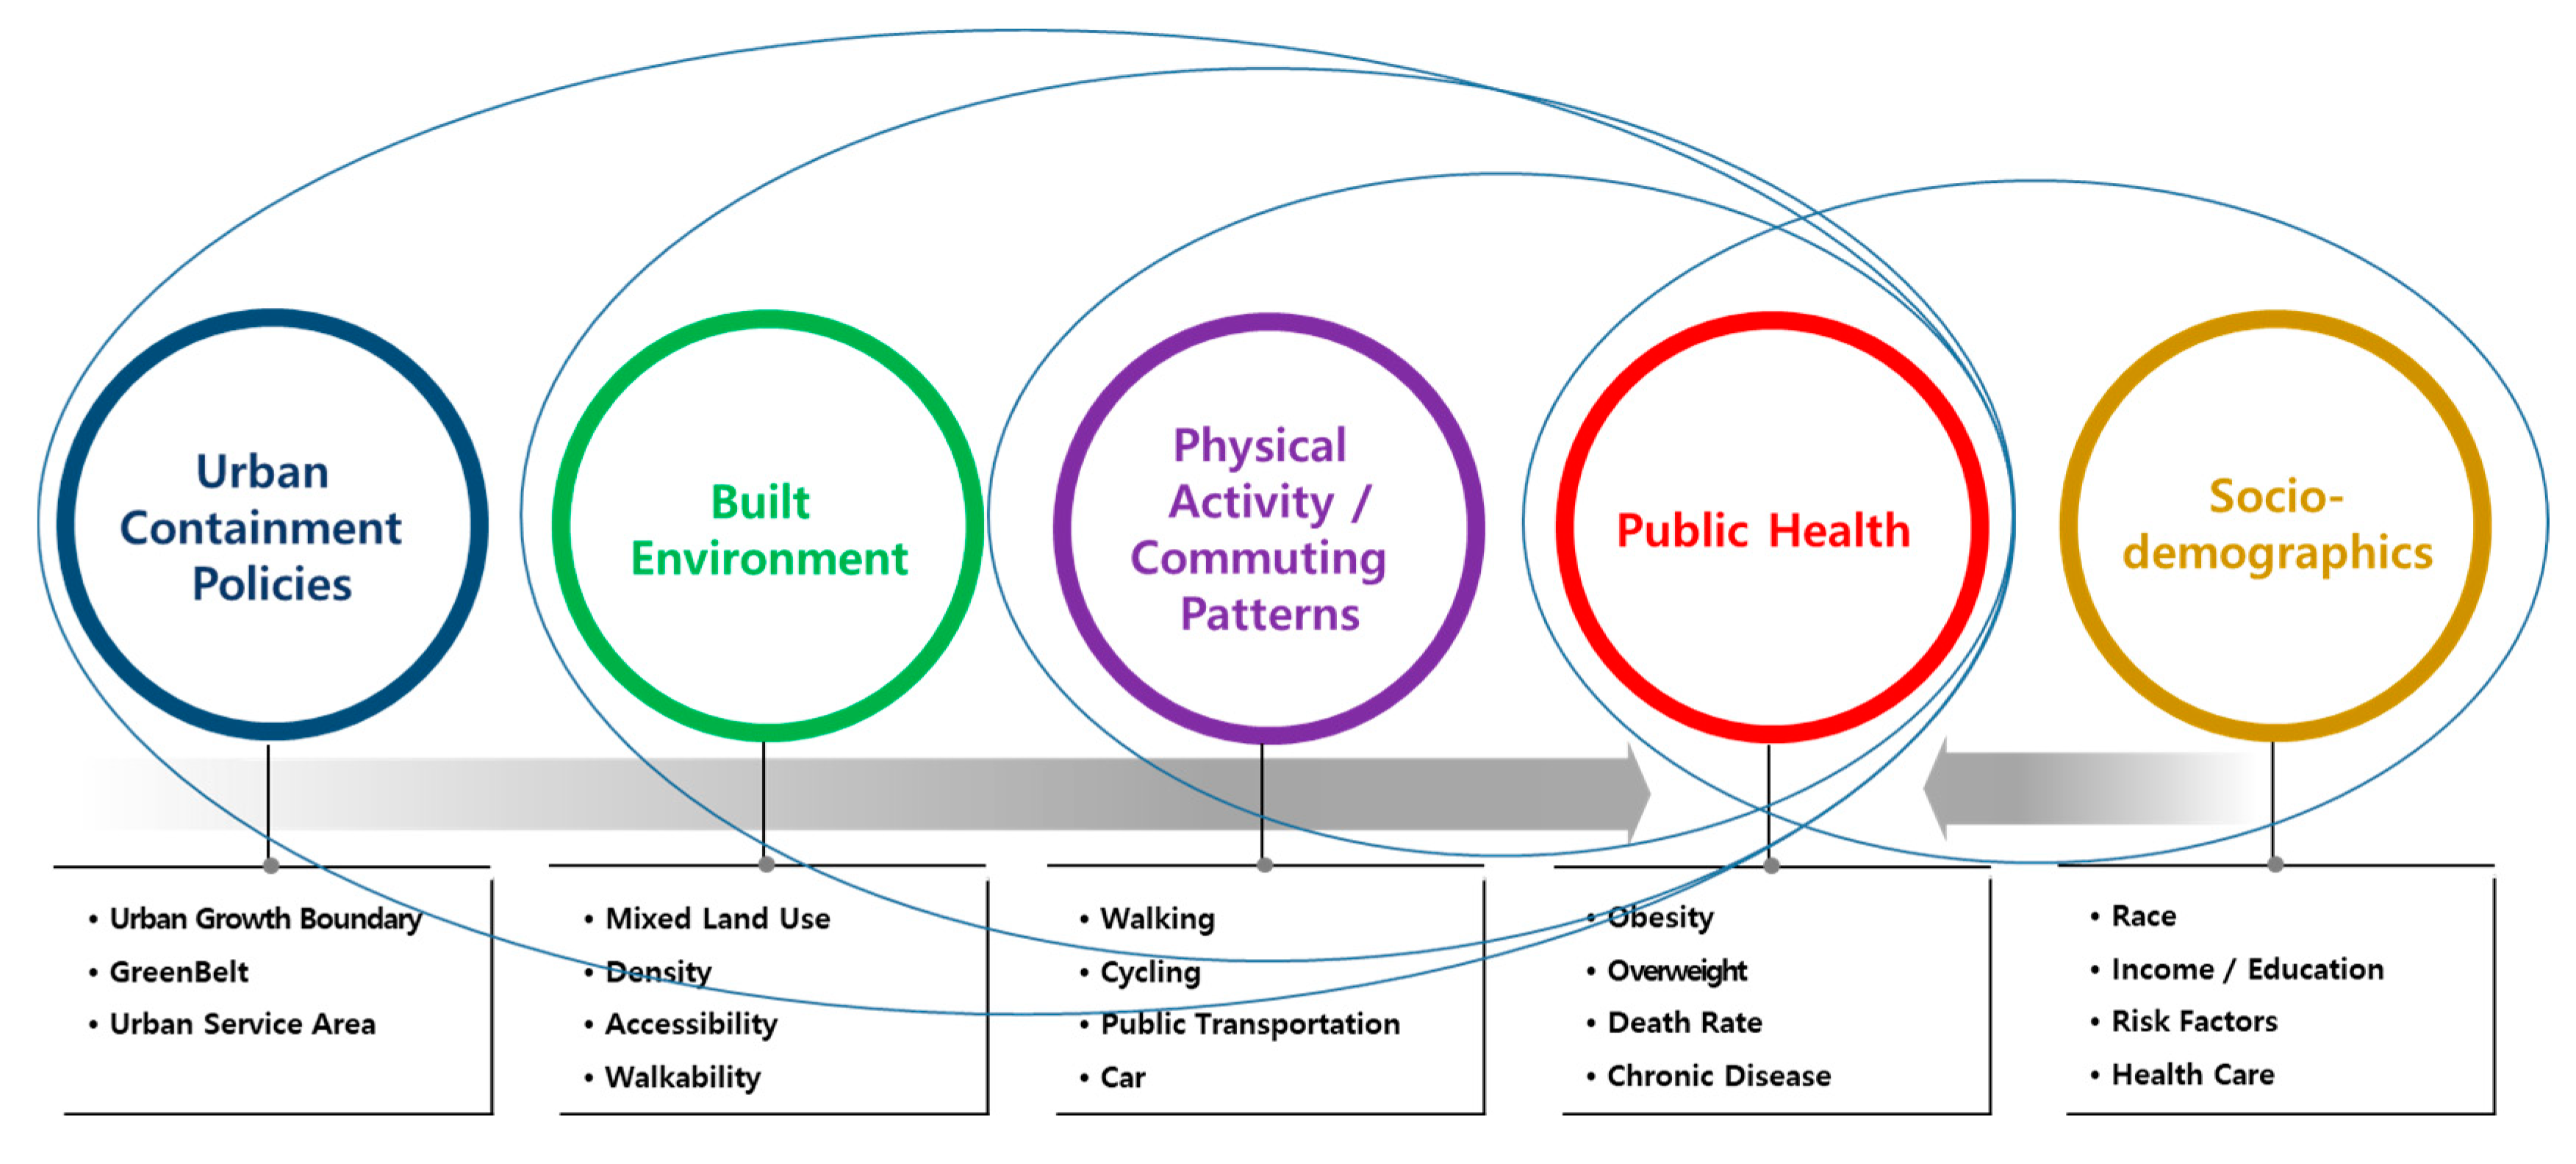
3. Analytical Framework
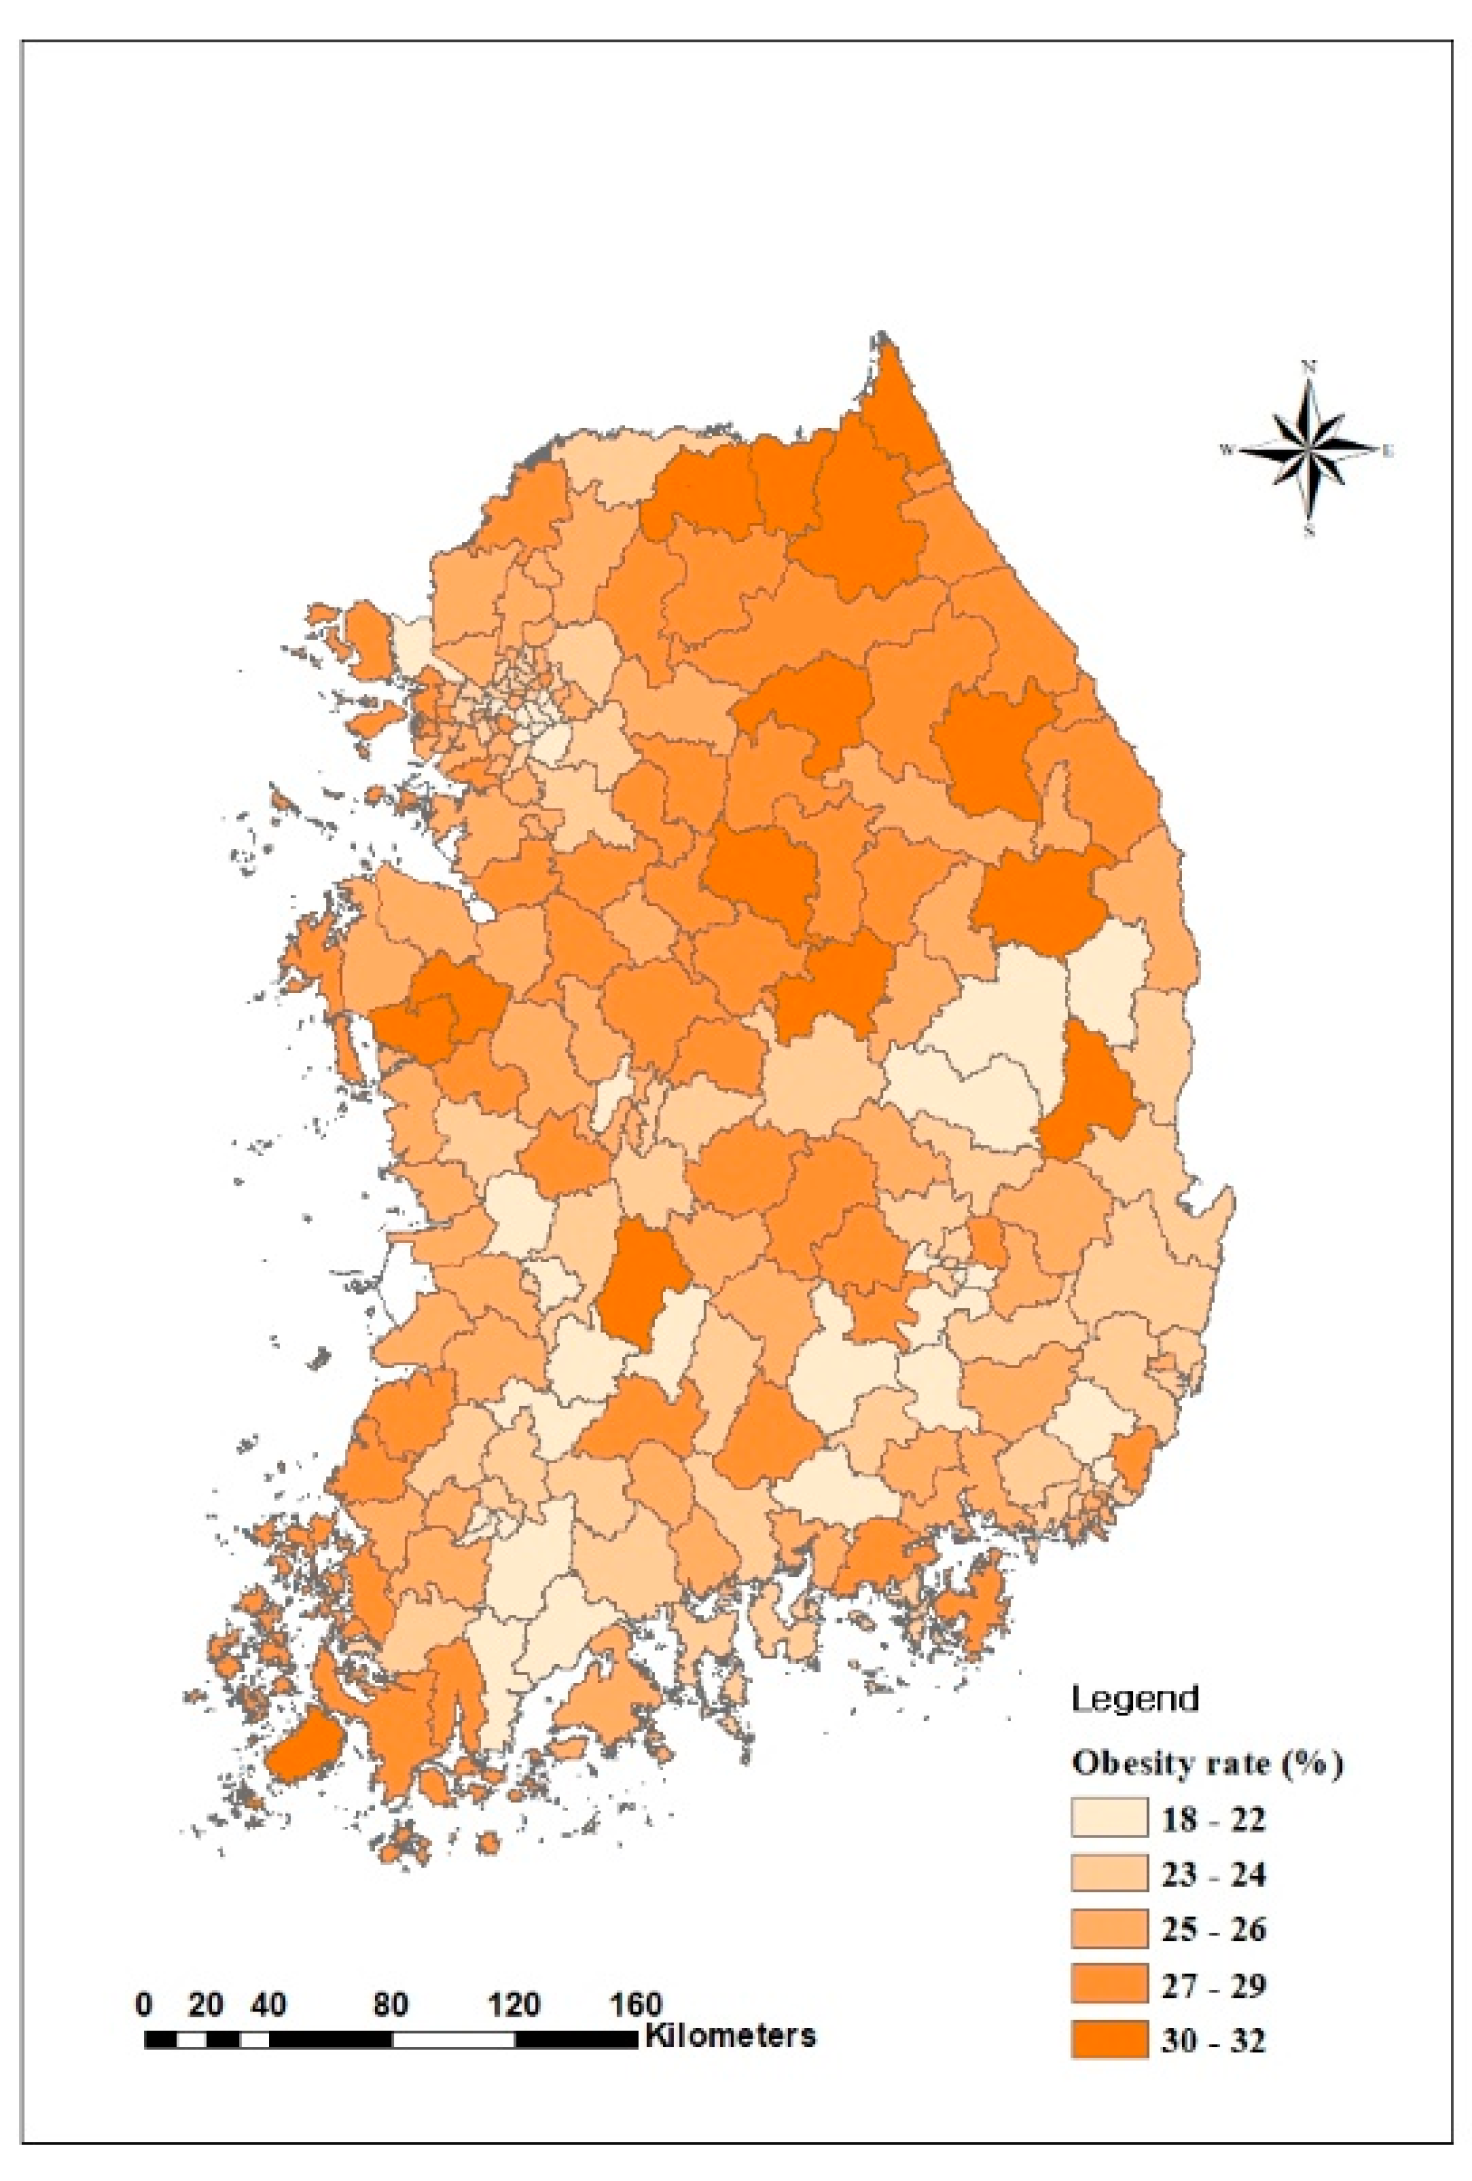
3.1. Spatial Range
3.2. Data and Variables
3.3. Methodology
4. Analysis and Discussion
4.1. Descriptive Statistics of the Variables
4.2. Effects of UCPs on Obesity
5. Conclusions
Author Contributions
Funding
Conflicts of Interest
References
- Korea Centers for Disease Control and Prevention(KCDC). Community Health Survey; Ministry of Health and Welfare of South Korea: Seoul, Korea, 2018.
- National Heart, Lung, and Blood Institute. Clinical Guidelines on the Identification, Evaluation, and Treatment of Overweight and Obesity in Adults: The Evidence Report; National Heart, Lung, and Blood Institute: Rockville, MD, USA, 1998.
- Aytur, S.A.; Rodriguez, D.A.; Evenson, K.R.; Catellier, D.J. Urban Containment Policies and Physical Activity. A Time-Series Analysis of Metropolitan Areas, 1990–2002. Am. J. Prev. Med. 2008, 34, 320–332. [Google Scholar] [CrossRef]
- Lee, S. Research Trends and Limitations of the Integrated Study of Urban Planning and Public Health for a Healthy Community. Seoul Stud. 2010, 11, 15–33. [Google Scholar]
- Kim, E.J.; Kang, M.-G. Effects of Built Environmental Factors on Obesity and Self-reported Health Statusin Seoul Metropolitan Area Using Spatial Regression Model. Korea Spat. Plan. Rev. 2011, 68, 85–98. [Google Scholar]
- Lee, Y.S.; Jung, H.; Yoo, H.J.; Kim, K.M. Urban Characteristics Affecting Obesity of Elementary, Middle and High School Students. J. Korean Reg. Sci. Assoc. 2015, 31, 113–130. [Google Scholar]
- Frank, L.D.; Andresen, M.A.; Schmid, T.L. Obesity relationships with community design, physical activity, and time spent in cars. Am. J. Prev. Med. 2004, 27, 87–96. [Google Scholar] [CrossRef] [PubMed]
- Lee, K.; Kim, T.; Lee, W.; Kim, E. A Study on Effects of Neighborhoods Environments on Residents Walking Trips Using Household Travle Diary Survey Data in Seoul. Seoul Stud. 2014, 15, 95–109. [Google Scholar]
- Rolf, P.; Martin, J.; Fulton, W.B. Holding the Line: Urban Containment in the United States; Center on Urban and Metropolitan Policy, The Brookings Institution: Washington, DC, USA, 2002.
- Rodriguez, D.; Targa, F.; Aytur, S. Transportation implications of urban containment policies: A study of the largest 25 U.S. metropolitan areas. Urban Stud. 2006, 43, 1879–1897. [Google Scholar] [CrossRef]
- Wassmer, R.W. The influence of local urban containment policies and statewide growth management on the size of United States urban areas. J. Reg. Sci. 2006, 46, 25–65. [Google Scholar] [CrossRef]
- Kelly, E. Managing Community Growth: Policies, Techniques, and Impacts; Praeger: SanFrancisco, CA, USA, 1993. [Google Scholar]
- Dierwechter, Y.; Carlson, T. Effects of urban growth boundaries on residential development in Pierce County, Washington. Prof. Geogr. 2007, 59, 209–220. [Google Scholar] [CrossRef]
- Hall, P. The future of the metropolis and its form. Reg. Stud. 1997, 31, 211–220. [Google Scholar] [CrossRef]
- Ewing, R.; Schmid, T.; Killingsworth, R.; Zlot, A.; Raudenbush, S. Relationship between urban sprawl and physical activity, obesity, and morbidity. Am. J. Health Promot. 2003, 18, 47–57. [Google Scholar] [CrossRef] [PubMed]
- Kelly-Schwartz, A.C.; Stockard, J.; Doyle, S.; Schlossberg, M. Is sprawl unhealthy? A multilevel analysis of the relationship of metropolitan sprawl to the health of individuals. J. Plan. Educ. Res. 2004, 24, 184–196. [Google Scholar] [CrossRef]
- Soot, S. Are Sprawl and Obesity Related?: Evidence from the Chicago Area; Metropolitan Transportation Support Initiative, Urban Transportation Center, University of Illinois: Chicago, IL, USA, 2006.
- Eid, J.; Overman, H.G.; Puga, D.; Turner, M.A. Fat city: Questioning the relationship between urban sprawl and obesity. J. Urban Econ. 2008, 63, 385–404. [Google Scholar] [CrossRef]
- Shin, K.; Sung, H.; Rho, J. Analysis of causal relationship between Commuting Behavior of office worker and Body Mass Index using Path Analysis. J. Korea Plan. Assoc. 2009, 44, 197–209. [Google Scholar]
- Herman, D.R.; Ganz, P.A.; Petersen, L.; Greendale, G.A. Obesity and cardiovascular risk factors in younger breast cancer survivors: The Cancer and Menopause Study (CAMS). Breast Cancer Res. Treat. 2005, 93, 13–23. [Google Scholar] [CrossRef]
- Lee, S.; Yoon, S.; Park, J.; Min, S. Applied Spatial Econometrics; Pakyoungsa: Seoul, Korea, 2006. [Google Scholar]
- Cervero, R.; Gorham, R. Commuting in transit versus automobile neighborhoods. J. Am. Plan. Assoc. 1995, 61, 210–225. [Google Scholar] [CrossRef]
- Rutherford, G.S.; McCormack, E.; Wilkinson, M. Travel Impacts of Urban Form: Implications from an Analysis of Two Seattle Area Travel Diaries. In Proceedings of the TMIP Conference on Urban Design, Telecommuting, and Travel Behavior, Washington, DC, USA, 27–30 October 1996; Federal Highway Administration: Washington, DC, USA, 1996. [Google Scholar]
- Criterion Planners Engineers. Environmental Attributes of New Urbanist Design: An Exploratory Case Study; Natural Resources Defense Council: Washington, DC, USA, 2000. [Google Scholar]
- Jung, Y.; Jung, S. The changes in medical expense burden and sectoral costs by income groups. In Issue & Focus; Korea Institute for Health and Social Affairs: Tangjeong, Korea, 2017; Volume 345. [Google Scholar]
- Kim, D.; Yoon, H.; Lee, J.; Chae, H. Measurement of inequality in medical use in Korea using medical panel data. Health Soc. Welf. Rev. 2014, 34, 33–58. [Google Scholar]
- Joo, N.; Park, Y.; Park, T.; Shin, G.; Park, R.; Kim, T. Medical Cost and Hospital Visit by Obesity and Central Obesity. J. Obes. Metab. Syndr. 2008, 17, 91–98. [Google Scholar]
- Oh, S.W. Effects of Alcohol on Obesity and Metabolic Syndrome. J. Obes. Metab. Syndr. 2009, 18, 1–7. [Google Scholar]
- Lee, S.Y. Smoking, Obesity and Metabolic Syndrome. Korea J. Obes. 2014, 23, 162–163. [Google Scholar] [CrossRef]
- Kim, J.; Shim, K.; Yoon, Y.; Lee, S.; Kim, S.; Oh, S. Cigarette Smoking Increases Abdominal and Visceral Obesity but Not Overall Fatness: An Observational Study. PLoS ONE 2012, 7, e45815. [Google Scholar] [CrossRef] [PubMed]
- Korean Central Government. Comprehensive Plan for Obbesity in 2018; Ministry of Health and Welfare of South Korea: Souel, Koera, 2019.
- Lopez, R.P.; Hynes, H.P. Obesity, physical activity, and the urban environment: Public health research needs. Environ. Health. 2006, 5, 1–25. [Google Scholar] [CrossRef] [PubMed]


| Variables | Factor | Name | Measurement | Sign |
|---|---|---|---|---|
| Dependent | Public Health | Obesity | Ratio (%) | |
| Independent | Transportation Factors | Public Transportation | Ratio (%) | - |
| Walking | Ratio (%) | - | ||
| Social Factors | APT(Apartment) | Ratio (%) | + | |
| Income | 10,000 KRW | - | ||
| Age 20–40 | Ratio (%) | + | ||
| Age 41–64 | Ratio (%) | +, - | ||
| Health Factors | Doctors | Number of doctors per hundred | - | |
| Drinking | Ratio (%) | + | ||
| Smoking | Ratio (%) | + | ||
| Stress | Ratio (%) | + | ||
| Regional Factor | Rural area | Dichotomous | + | |
| Policy Factors | Greenbelt Area | 1000 m2 | - | |
| Greenbelt Enclosure | Dichotomous | - |
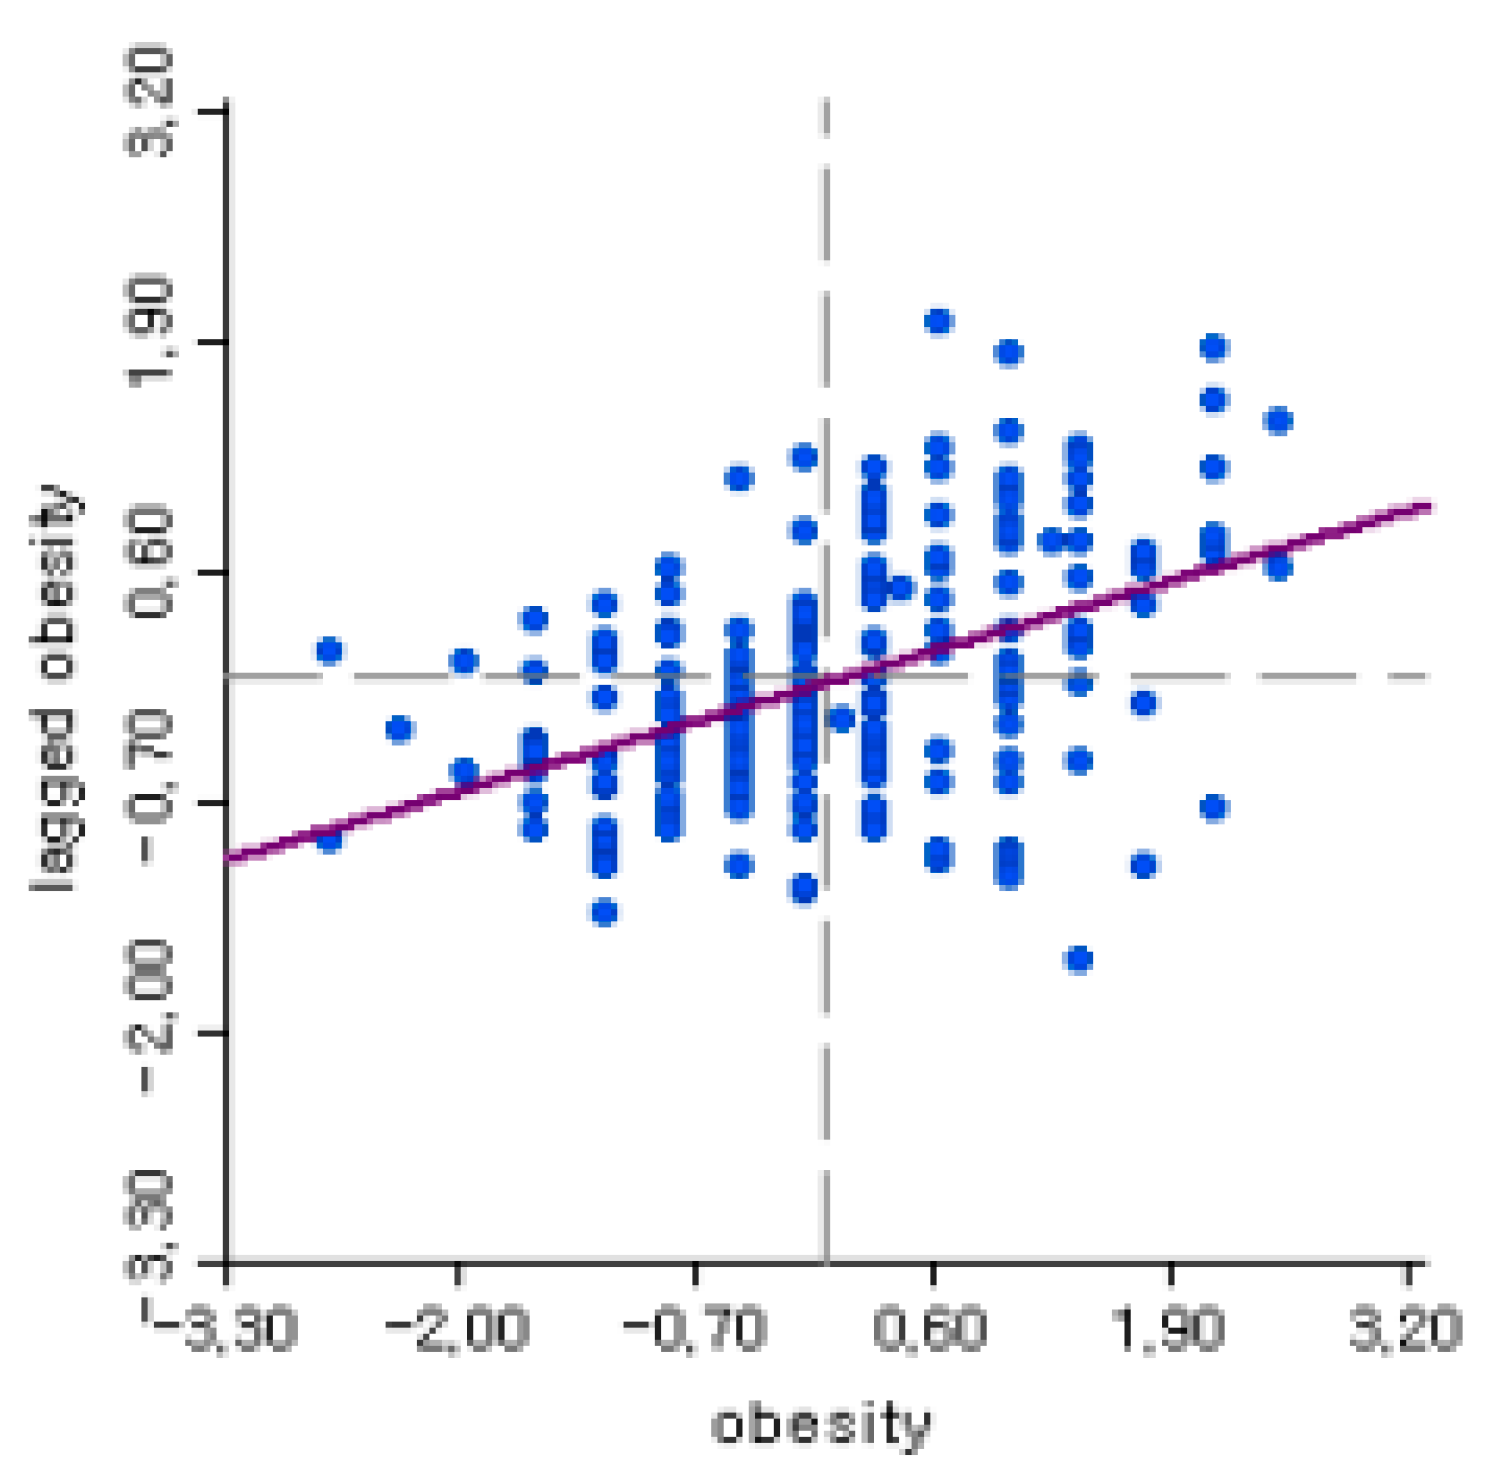
| Moran’s I | LM (Lagrange Multiplier) Error | LM (Lagrange Multiplier) Lag | |
|---|---|---|---|
| MI (Moran’s I) | Value | ||
| 0.018 | 0.84 | 0.146 | 0.038 |
| Variables | Count | Average | Standard Deviation | Max | Min | |
|---|---|---|---|---|---|---|
| Independent | Obesity | 226 | 25.32 | 2.70 | 32.00 | 18.00 |
| Transportation Factors | Public Transportation | 226 | 13.27 | 13.99 | 50.26 | 0 |
| Walking | 226 | 26.92 | 14.19 | 90.70 | 7.91 | |
| Social Factors | APT | 226 | 39.21 | 22.40 | 86.81 | 0 |
| Income | 226 | 304.87 | 86.13 | 509.55 | 126.53 | |
| Age 20–40 | 226 | 17.87 | 10.54 | 50.39 | 0 | |
| Age 41–64 | 226 | 57.86 | 11.58 | 84.91 | 11.22 | |
| Health Factors | Doctors | 226 | 2.48 | 2.28 | 22.04 | 0.83 |
| Drinking | 226 | 55.74 | 6.33 | 65.90 | 33.80 | |
| Smoking | 226 | 22.57 | 2.74 | 32.80 | 13.90 | |
| Stress | 226 | 27.55 | 3.92 | 37.00 | 16.00 | |
| Regional Factor | Rural area | 226 | 0.358 | 0.481 | 1 | 0 |
| Policy Factors | Greenbelt Area | 226 | 17,052.23 | 37,209.49 | 250,150.0 | 0.00 |
| Greenbelt Enclosure | 226 | 0.292 | 0.456 | 1 | 0 | |
| Model | OLS | SAR | SEM | SAC | |||||||||
|---|---|---|---|---|---|---|---|---|---|---|---|---|---|
| Variable | Coeff. | t | Coeff. | z | Coeff. | z | Coeff. | z | |||||
| Constant | 9.472 | *** | 3.852 | 9.436 | *** | 3.935 | 9.863 | *** | 4.084 | 9.522 | *** | 3.95 | |
| Transportation Factors | Public Transportation | −0.043 | ** | −2.291 | −0.043 | ** | −2.36 | −0.045 | ** | −2.375 | −0.044 | ** | −2.366 |
| Walking | 0.002 | 0.124 | 0.002 | 0.111 | 0.002 | 0.116 | 0.001 | 0.098 | |||||
| Socio-economic Factors | APT | −0.04 | *** | −3.075 | −0.04 | *** | −3.169 | −0.039 | *** | −3.08 | −0.04 | *** | −3.115 |
| Income | −0.01 | ** | −2.419 | −0.01 | ** | −2.495 | −0.010 | ** | −2.485 | −0.01 | ** | −2.475 | |
| Age 0–40 | 0.087 | *** | 2.883 | 0.087 | *** | 2.984 | 0.087 | *** | 2.955 | 0.088 | *** | 2.983 | |
| Age 40–60 | 0.055 | ** | 2.367 | 0.054 | ** | 2.433 | 0.052 | ** | 2.325 | 0.053 | ** | 2.359 | |
| Health Factor | Doctors | −0.17 | ** | −2.381 | −0.17 | ** | −2.454 | −0.169 | ** | −2.442 | −0.169 | ** | −2.437 |
| Drinking | 0.123 | *** | 2.867 | 0.122 | *** | 2.924 | 0.121 | *** | 2.862 | 0.121 | *** | 2.857 | |
| Smoking | 0.22 | *** | 3.589 | 0.219 | *** | 3.696 | 0.217 | *** | 3.634 | 0.218 | *** | 3.654 | |
| Stress | 0.177 | *** | 4.114 | 0.176 | *** | 4.207 | 0.175 | *** | 4.173 | 0.174 | *** | 4.144 | |
| Regional Factor | Rural Area | 1.021 | * | 1.919 | 1.024 | ** | 1.985 | 1.005 | * | 1.947 | 1.025 | ** | 1.985 |
| Policy Factor | Greenbelt | 0.000 | ** | −2.127 | 0.000 | ** | −2.198 | 0.000 | ** | −2.057 | 0.000 | ** | −2.132 |
| Inside Greenbelt | −0.951 | ** | −2.233 | −0.949 | ** | −2.300 | −0.900 | ** | −2.136 | −0.92 | ** | −2.201 | |
| Rho (ρ) | 0.005 | 0.196 | 0.011 | 0.396 | |||||||||
| Lambda (λ) | 0.053 | 0.554 | 0.033 | 0.296 | |||||||||
| N | 226 | 226 | 226 | 226 | |||||||||
| R2 | 0.3976 | 0.3977 | 0.39851 | 0.3975 | |||||||||
| Log likelihood | −487.16 | −487.136 | −487.05 | -1) | |||||||||
| Akaike info criterion | 1002.31 | 1004.27 | 1002.10 | -1) | |||||||||
| Schwarz criterion | 1050.20 | 1055.58 | 1049.99 | -1) | |||||||||
© 2020 by the authors. Licensee MDPI, Basel, Switzerland. This article is an open access article distributed under the terms and conditions of the Creative Commons Attribution (CC BY) license (http://creativecommons.org/licenses/by/4.0/).
Share and Cite
Jeon, J.; Kim, S.; Kwon, S.M. The Effects of Urban Containment Policies on Public Health. Int. J. Environ. Res. Public Health 2020, 17, 3275. https://doi.org/10.3390/ijerph17093275
Jeon J, Kim S, Kwon SM. The Effects of Urban Containment Policies on Public Health. International Journal of Environmental Research and Public Health. 2020; 17(9):3275. https://doi.org/10.3390/ijerph17093275
Chicago/Turabian StyleJeon, Jeongbae, Solhee Kim, and Sung Moon Kwon. 2020. "The Effects of Urban Containment Policies on Public Health" International Journal of Environmental Research and Public Health 17, no. 9: 3275. https://doi.org/10.3390/ijerph17093275
APA StyleJeon, J., Kim, S., & Kwon, S. M. (2020). The Effects of Urban Containment Policies on Public Health. International Journal of Environmental Research and Public Health, 17(9), 3275. https://doi.org/10.3390/ijerph17093275