A System Dynamics Model for Ecological Environmental Management in Coal Mining Areas in China


Abstract
1. Introduction
2. The SD Model
2.1. Causal Relationship of Ecological Environment in Coal Mining Area
- (1)
- GDP →+ Environmental Investment →+ Investment in air treatment →+ Air quality →– Cost of pollution control in mining area →+ Mining revenue →+ GDP.
- (2)
- GDP →+ Environmental Investment →+ Investment in solid waste management →– Solid pollution index →+ Cost of pollution control in mining area →– Mining revenue →+ GDP.
- (3)
- GDP →+ Environmental Investment →+ Investment in water pollution control →– Water pollution index →+ Cost of pollution control in mining area →– Mining revenue →+ GDP.
- (4)
- GDP →+ Environmental Investment →+ Vegetation investment →– Vegetation greening rate →+ Cost of pollution control in mining area →– Mining revenue →+ GDP.
- (5)
- GDP →+ Environmental Investment →+ Investment in land reclamation →– Land reclamation rate →+ Cost of pollution control in mining area →– Mining revenue →+ GDP.
- (6)
- Environmental Investment →+ Investment in air treatment →+ Air quality →+ ecological environment quality in coal mining areas →– Environmental Investment.
- (7)
- Environmental Investment →+ Investment in solid waste management →+ Solid pollution index →– ecological environment quality in coal mining areas →– Environmental Investment.
- (8)
- Environmental Investment →+ Investment in water pollution control →– Water pollution index →– ecological environment quality in coal mining areas →– Environmental Investment.
- (9)
- Environmental Investment →+ Vegetation investment →– Vegetation greening rate →– ecological environment quality in coal mining areas →– Environmental Investment.
- (10)
- Environmental Investment →+ Investment in land reclamation →– Land reclamation rate →– ecological environment quality in coal mining areas →– Environmental Investment.
2.2. Flow Diagram of Ecological Environment Subsystem in coal Mining Area
2.2.1. Atmospheric Subsystem
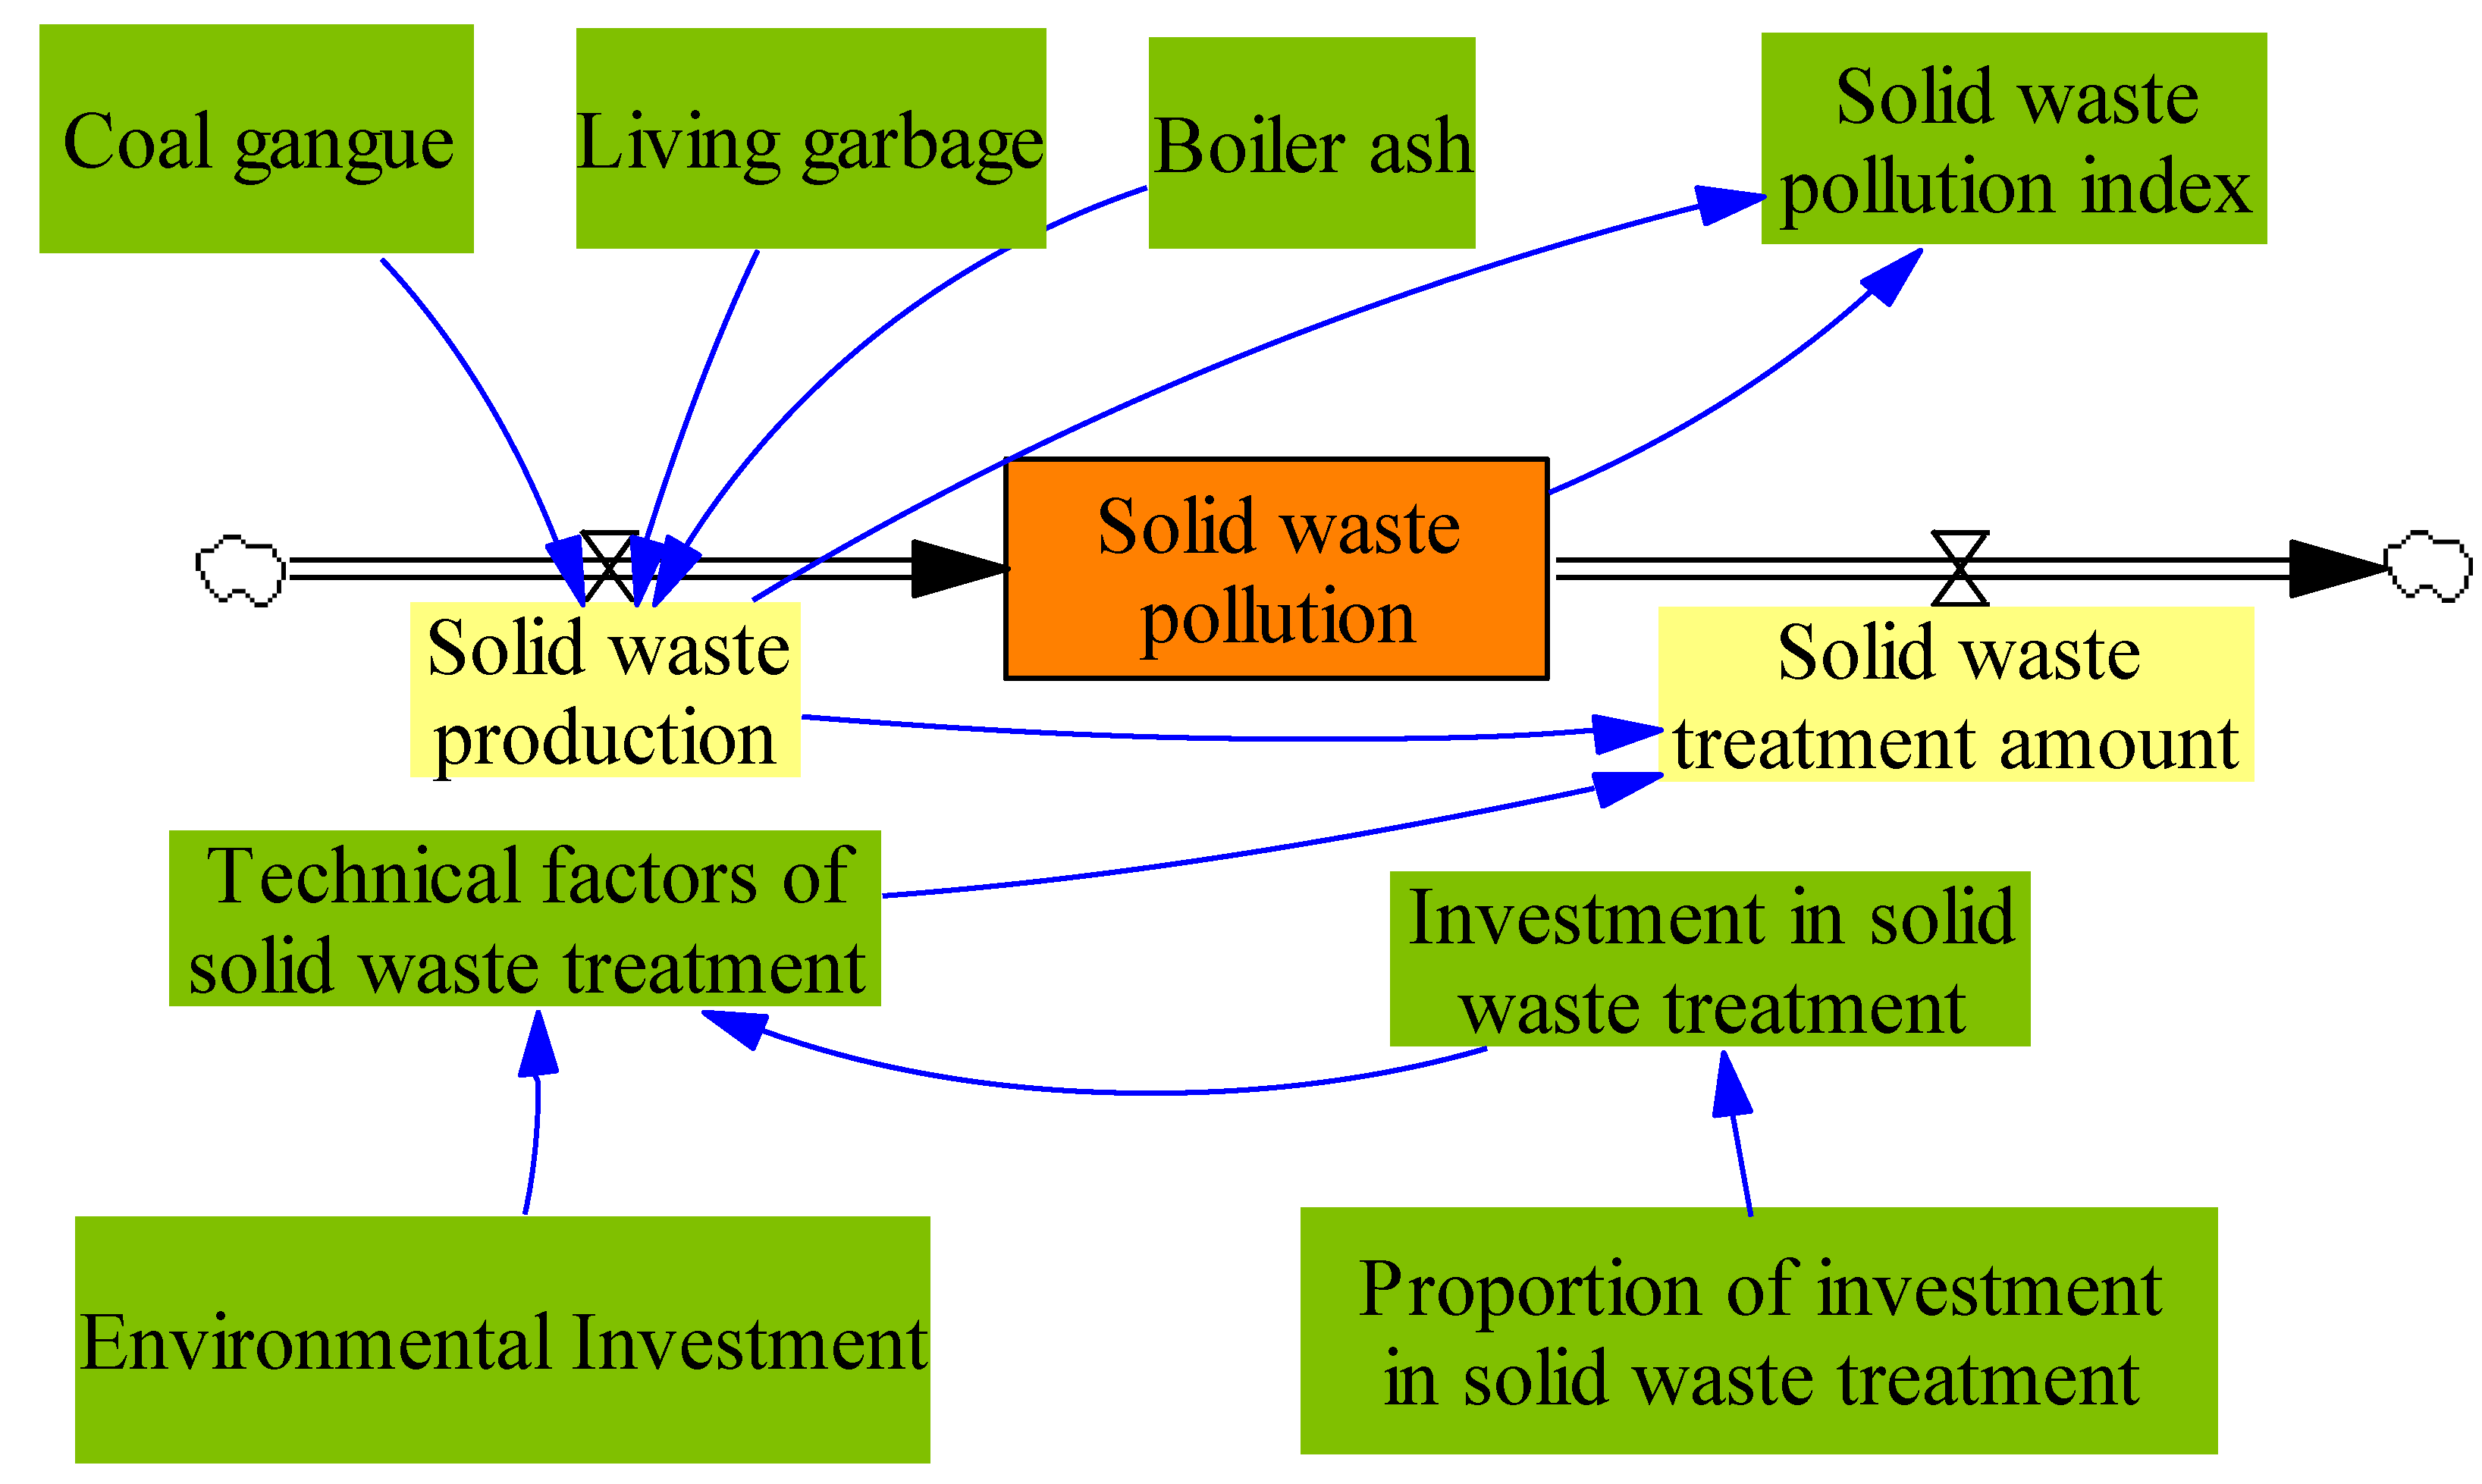
2.2.2. Solid Waste Subsystem
2.2.3. Water Resource Subsystem
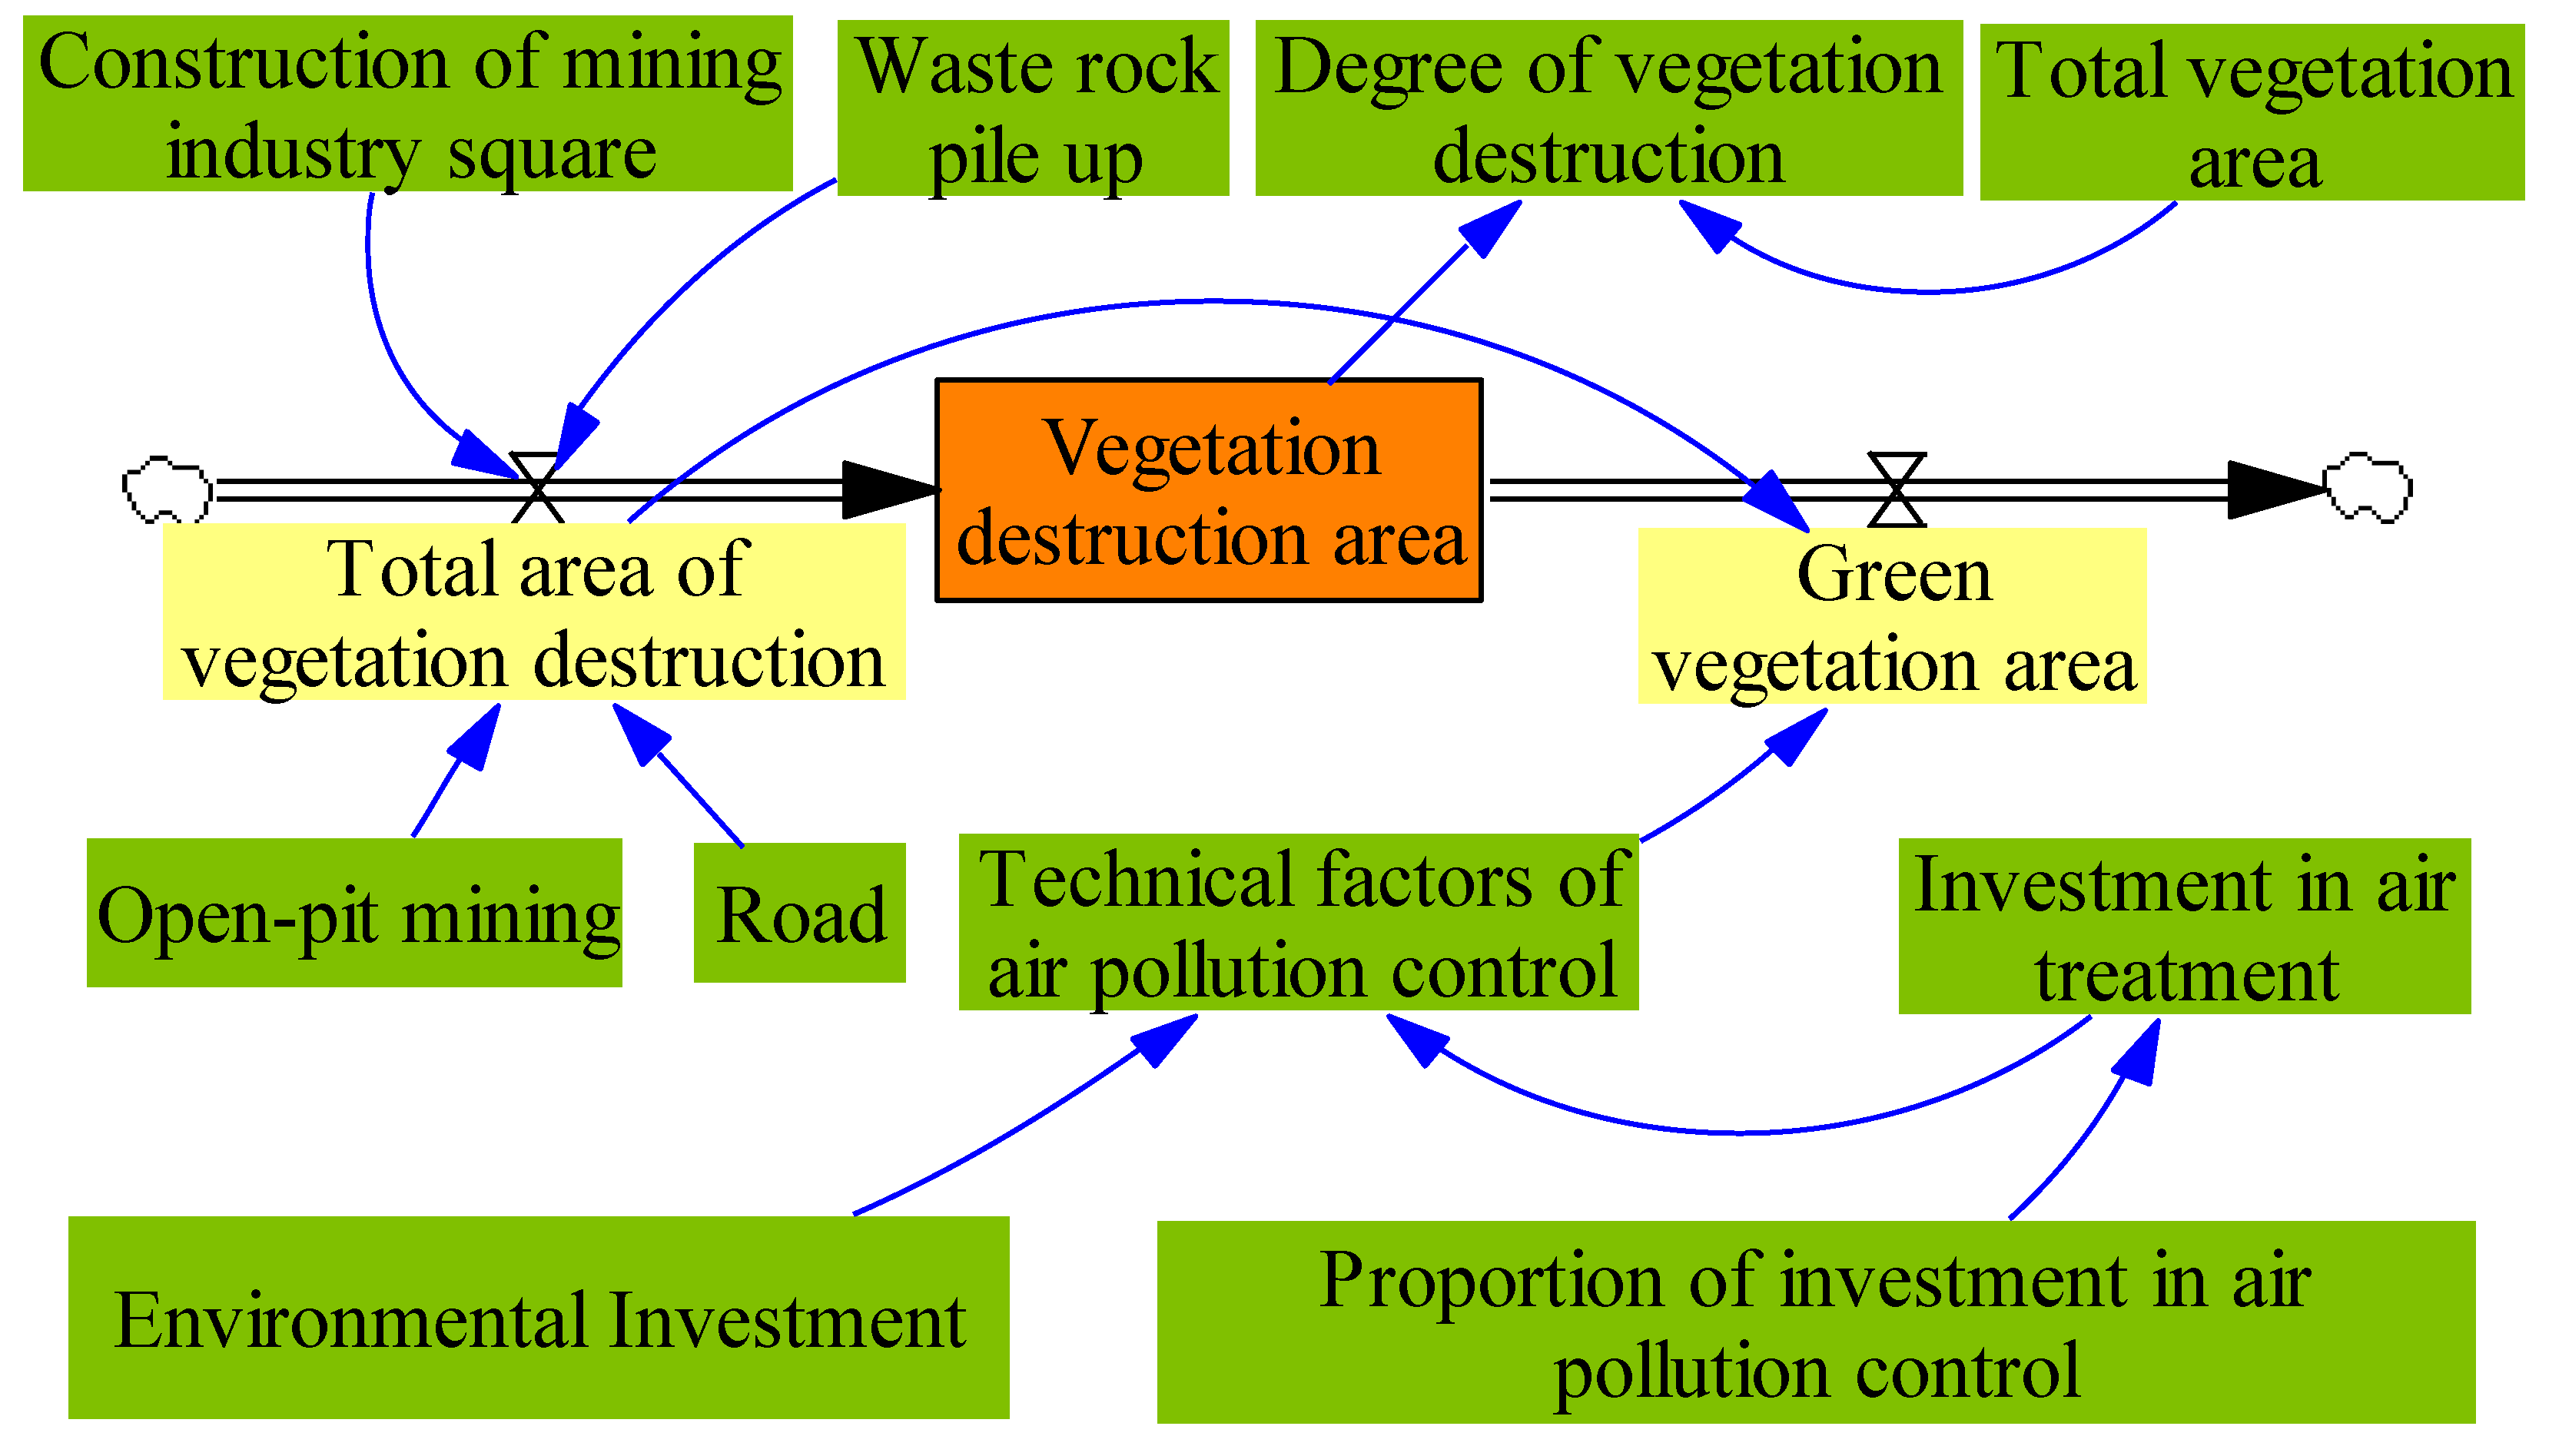
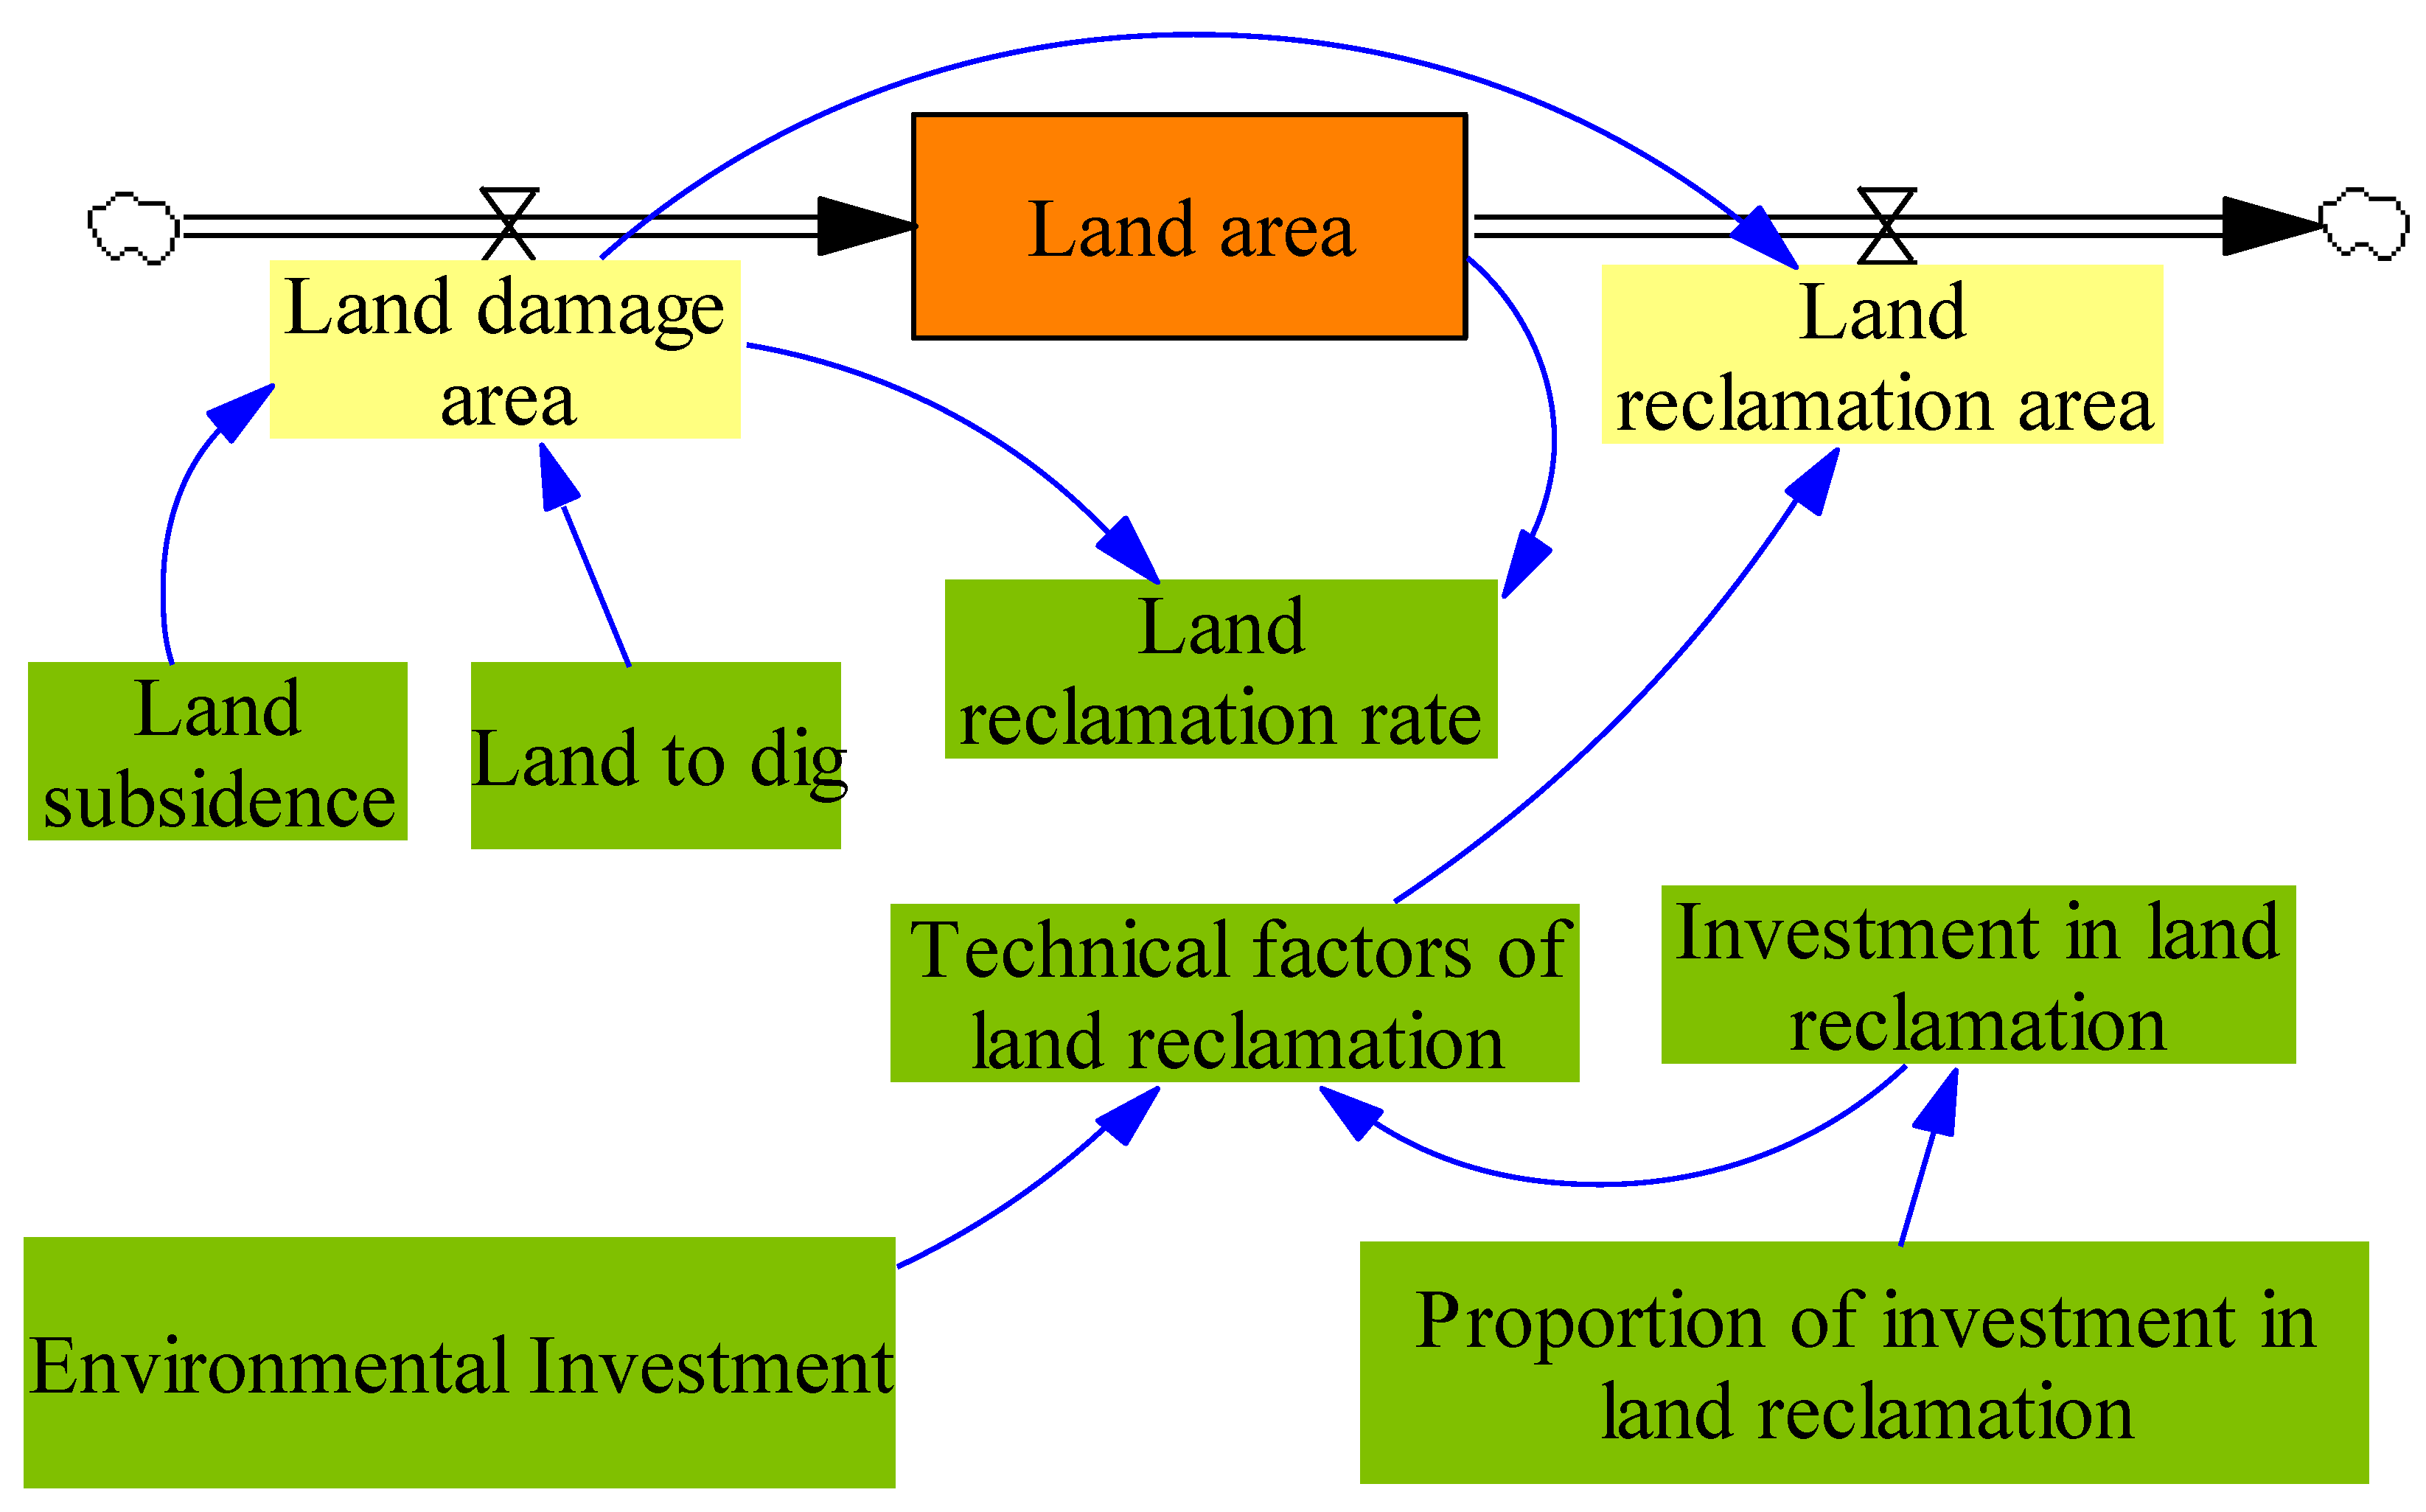
2.2.4. Vegetation Cover Subsystem and Land Reclamation Subsystem
2.3. General System Flow Diagram of Ecological Environment in Coal Mining Area
3. A case Study in China
3.1. Data
3.2. Simulations
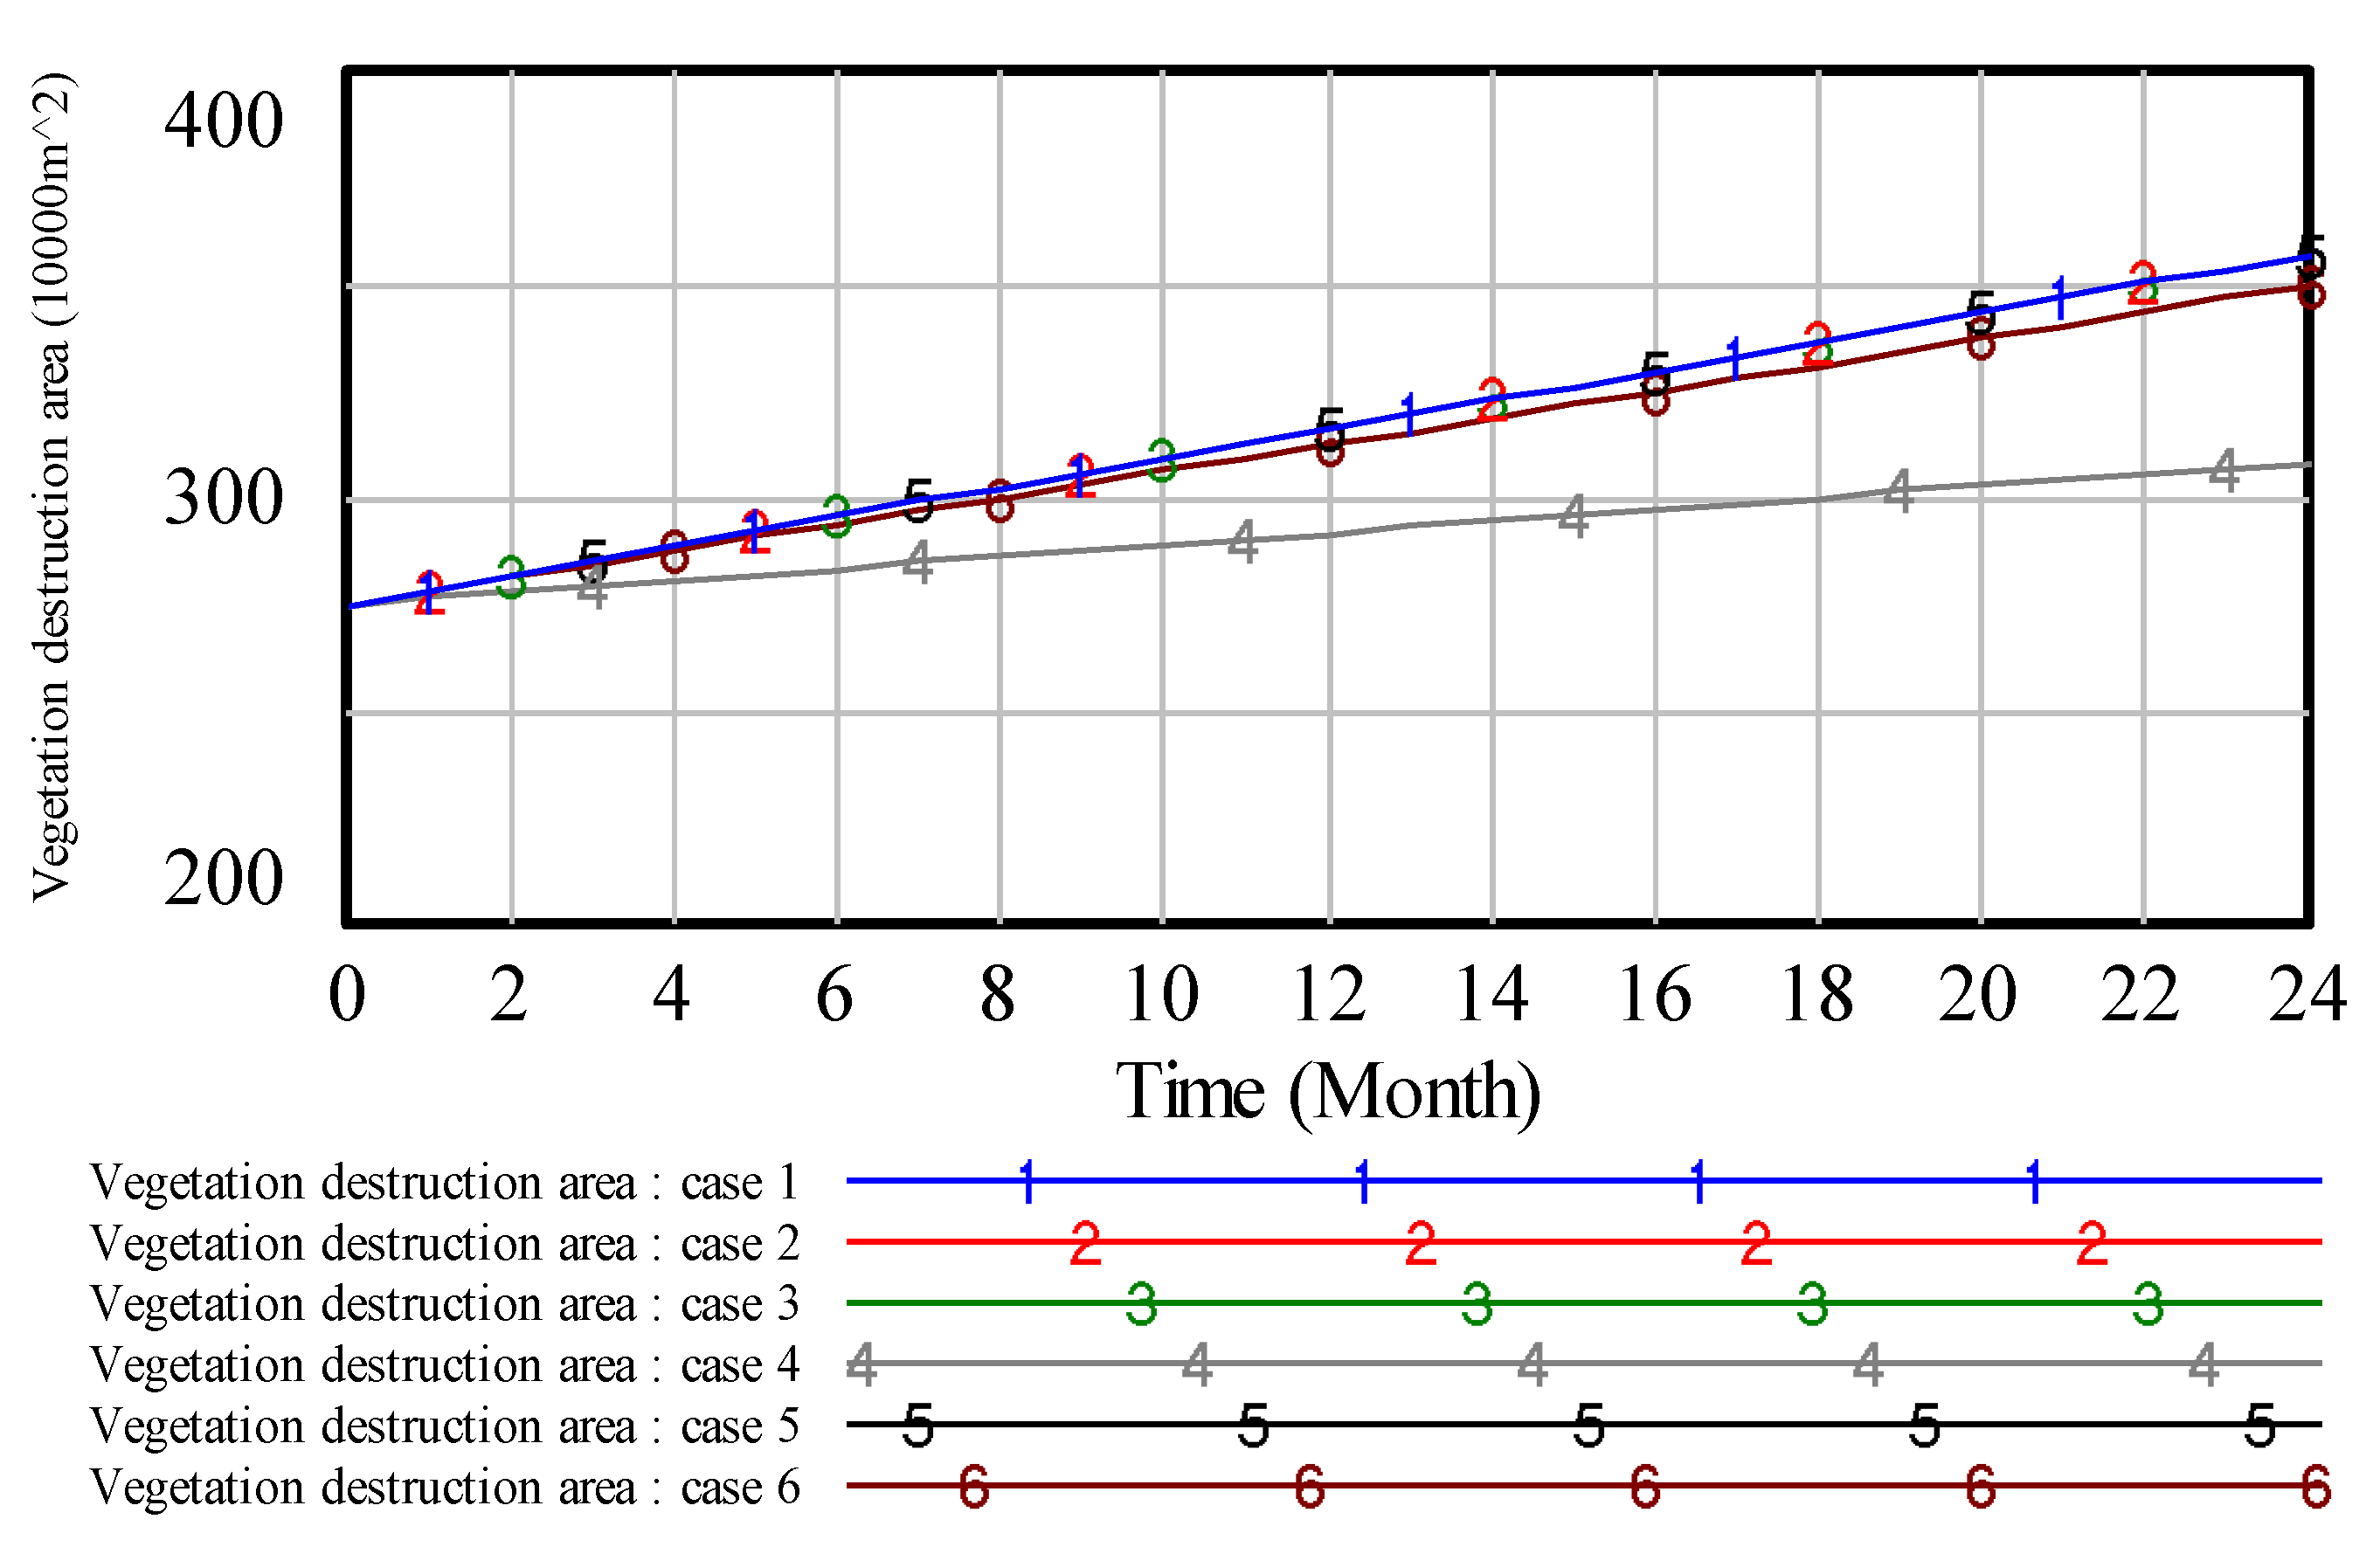
4. Results
4.1. Sensitivity Analysis
4.2. Results Analysis
5. Discussion
6. Conclusions
Author Contributions
Funding
Acknowledgments
Conflicts of Interest
Appendix A. All Equations Lest in the General System
References
- Haibin, L.; Zhenling, L. Recycling utilization patterns of coal mining waste in China. Resour. Conserv. Recycl. 2010, 54, 1331–1340. [Google Scholar] [CrossRef]
- Zhengfu, B.I.A.N.; Inyang, H.I.; Daniels, J.L.; Frank, O.T.T.O.; Struthers, S. Environmental issues from coal mining and their solutions. Min. Sci. Technol. (China) 2010, 20, 215–223. [Google Scholar]
- Franks, D.M.; Brereton, D.; Moran, C.J. Managing the cumulative impacts of coal mining on regional communities and environments in Australia. Impact Assess. Proj. Apprais. 2010, 28, 299–312. [Google Scholar] [CrossRef]
- Yu, X. Coal mining and environmental development in southwest China. Environ Dev. 2017, 21, 77–86. [Google Scholar] [CrossRef]
- Mikhailov, V.G.; Koryakov, A.G.; Mikhailov, G.S. Ecological risk management in coal mining and processing. J. Min. Sci. 2015, 51, 930–936. [Google Scholar] [CrossRef]
- Gautam, S.; Patra, A.K.; Sahu, S.P.; Hitch, M. Particulate matter pollution in opencast coal mining areas: A threat to human health and environment. Int. J. Min. Reclam. Environ. 2018, 32, 75–92. [Google Scholar] [CrossRef]
- Chabukdhara, M.; Singh, O.P. Coal mining in northeast India: An overview of environmental issues and treatment approaches. Int. J. Coal Sci. Technol. 2016, 3, 87–96. [Google Scholar] [CrossRef]
- Kowalska, I.J. Risk management in the hard coal mining industry: Social and environmental aspects of collieries’ liquidation. Resour. Policy 2014, 41, 124–134. [Google Scholar] [CrossRef]
- Li, F.; Liu, X.; Zhao, D.; Wang, B.; Jin, J.; Hu, D. Evaluating and modeling ecosystem service loss of coal mining: A case study of Mentougou district of Beijing, China. Ecol. Complex. 2011, 8, 139–143. [Google Scholar] [CrossRef]
- Liao, X.; Li, W.; Hou, J. Applications of GIS based ecological vulnerability evaluation in environmental impact assessment of master plan of coal mining area. Procedia Environ. Sci. 2013, 18, 271–276. [Google Scholar] [CrossRef]
- Mahdevari, S.; Shahriar, K.; Esfahanipour, A. Human health and safety risks management in underground coal mines using fuzzy TOPSIS. Sci. Total Environ. 2014, 488, 85–99. [Google Scholar] [CrossRef]
- Morrice, E.; Colagiuri, R. Coal mining, social injustice and health: A universal conflict of power and priorities. Health Place 2013, 19, 74–79. [Google Scholar] [CrossRef]
- Shen, L.; Muduli, K.; Barve, A. Developing a sustainable development framework in the context of mining industries: AHP approach. Resour. Policy 2015, 46, 15–26. [Google Scholar] [CrossRef]
- Si, H.; Bi, H.; Li, X.; Yang, C. Environmental evaluation for sustainable development of coal mining in Qijiang, Western China. Int. J. Coal. Geol. 2010, 81, 163–168. [Google Scholar] [CrossRef]
- Burchart-Korol, D.; Fugiel, A.; Czaplicka-Kolarz, K.; Turek, M. Model of environmental life cycle assessment for coal mining operations. Sci. Total Environ. 2016, 562, 61–72. [Google Scholar] [CrossRef]
- Alekseenko, V.A.; Bech, J.; Alekseenko, A.V.; Shvydkaya, N.V.; Roca, N. Environmental impact of disposal of coal mining wastes on soils and plants in Rostov Oblast, Russia. J. Geochem. Explor. 2018, 184, 261–270. [Google Scholar] [CrossRef]
- Yu, S.; Gao, S. A dynamic programming model for environmental investment decision-making in coal mining. Appl. Energy 2016, 166, 273–281. [Google Scholar] [CrossRef]
- Zhang, H.; Song, J.; Su, C.; He, M. Human attitudes in environmental management: Fuzzy Cognitive Maps and policy option simulations analysis for a coal-mine ecosystem in China. J. Environ. Manag. 2013, 115, 227–234. [Google Scholar] [CrossRef] [PubMed]
- Forrester, J.W. Industrial Dynamics: A Major Breakthrough for Decision Makers. Harv. Bus. Rev. 1958, 36, 37–66. [Google Scholar]
- Robalino-López, A.; Mena-Nieto, A.; García-Ramos, J.E. System dynamics modeling for renewable energy and CO2 emissions: A case study of Ecuador. Energy Sustain. Dev. 2014, 20, 11–20. [Google Scholar] [CrossRef]
- Song, M.; Cui, X.; Wang, S. Simulation of land green supply chain based on system dynamics and policy optimization. Int. J. Prod. Econ. 2019, 217, 317–327. [Google Scholar] [CrossRef]
- Chen, Z.; Wei, S. Application of system dynamics to water security research. Water Resour. Manag. 2014, 28, 287–300. [Google Scholar] [CrossRef]
- Golroudbary, S.R.; Zahraee, S.M. C System dynamics model for optimizing the recycling and collection of waste material in a closed-loop supply chain. Simul. Model. Pract. Theory 2015, 53, 88–102. [Google Scholar] [CrossRef]
- Jin, X.; Xu, X.; Xiang, X.; Bai, Q.; Zhou, Y. System-dynamic analysis on socio-economic impacts of land consolidation in China. Habit. Int. 2016, 56, 166–175. [Google Scholar] [CrossRef]
- Kong, R.; Xue, F.; Wang, J.; Zhai, H.; Zhao, L. Research on mineral resources and environment of salt lakes in Qinghai Province based on system dynamics theory. Resour. Policy 2017, 52, 19–28. [Google Scholar] [CrossRef]
- Sahin, O.; Stewart, R.A.; Porter, M.G. Water security through scarcity pricing and reverse osmosis: A system dynamics approach. J. Clean. Prod. 2015, 88, 160–171. [Google Scholar] [CrossRef]
- Sun, Y.; Liu, N.; Shang, J.; Zhang, J. Sustainable utilization of water resources in China: A system dynamics model. J. Clean. Prod. 2017, 142, 613–625. [Google Scholar] [CrossRef]
- Thompson, B.P.; Bank, L.C. Use of system dynamics as a decision-making tool in building design and operation. Build. Environ. 2010, 45, 1006–1015. [Google Scholar] [CrossRef]
- Wei, S.; Yang, H.; Song, J.; Abbaspour, K.C.; Xu, Z. System dynamics simulation model for assessing socio-economic impacts of different levels of environmental flow allocation in the Weihe River Basin, China. Eur. J. Oper. Res. 2012, 221, 248–262. [Google Scholar] [CrossRef]
- Yu, S.; Wei, Y. Prediction of China’s coal production-environmental pollution based on a hybrid genetic algorithm-system dynamics model. Energy Policy 2012, 42, 521–529. [Google Scholar] [CrossRef]


| Variable Types | The Variable Name | The Initial Value | Unit |
|---|---|---|---|
| Constant | Construction of mining industry square | 30,000 | m2 |
| Waste rock pile up | 9833 | m2 | |
| Open-pit mining | 1500 | m2 | |
| Road | 80 | m2 | |
| Environmental Investment | 50 | Ten thousand yuan | |
| Total vegetation area | 2645.2 | 10,000 m2 | |
| Dust | 3310 | m2 | |
| Waste gas | 1514 | m2 | |
| Land subsidence | 4400 | m2 | |
| Land to dig | 8800 | m2 | |
| Coal gangue | 8750 | m2 | |
| Boiler ash | 298 | m2 | |
| Life waste water | 980 | m2 | |
| Mine water | 5392 | m2 | |
| Gangue leaching | 73 | m2 | |
| State variables | Vegetation destruction area | 275 | 10,000 m2 |
| Air pollution | 300 | m2 | |
| Land area | 450 | 10,000 m2 | |
| Solid waste pollution | 25.6 | m2 | |
| Water pollution | 35 | m2 |
| Regulatory Schemes | Case 1 | Case 2 | Case 3 | Case 4 | Case 5 | Case 6 |
|---|---|---|---|---|---|---|
| Proportion of investment in air pollution control | 0.4 | 0.15 | 0.15 | 0.15 | 0.15 | 0.2 |
| Proportion of investment in solid waste treatment | 0.15 | 0.4 | 0.15 | 0.15 | 0.15 | 0.2 |
| Proportion of investment in water pollution control | 0.15 | 0.15 | 0.4 | 0.15 | 0.15 | 0.2 |
| Proportion of investment in green vegetation | 0.15 | 0.15 | 0.15 | 0.4 | 0.15 | 0.2 |
| Proportion of investment in land reclamation | 0.15 | 0.15 | 0.15 | 0.15 | 0.4 | 0.2 |
© 2020 by the authors. Licensee MDPI, Basel, Switzerland. This article is an open access article distributed under the terms and conditions of the Creative Commons Attribution (CC BY) license (http://creativecommons.org/licenses/by/4.0/).
Share and Cite
Shi, F.; Cao, H.; Wang, C.; Yao, C. A System Dynamics Model for Ecological Environmental Management in Coal Mining Areas in China. Int. J. Environ. Res. Public Health 2020, 17, 2115. https://doi.org/10.3390/ijerph17062115
Shi F, Cao H, Wang C, Yao C. A System Dynamics Model for Ecological Environmental Management in Coal Mining Areas in China. International Journal of Environmental Research and Public Health. 2020; 17(6):2115. https://doi.org/10.3390/ijerph17062115
Chicago/Turabian StyleShi, Fulei, Haiqing Cao, Chuansheng Wang, and Cuiyou Yao. 2020. "A System Dynamics Model for Ecological Environmental Management in Coal Mining Areas in China" International Journal of Environmental Research and Public Health 17, no. 6: 2115. https://doi.org/10.3390/ijerph17062115
APA StyleShi, F., Cao, H., Wang, C., & Yao, C. (2020). A System Dynamics Model for Ecological Environmental Management in Coal Mining Areas in China. International Journal of Environmental Research and Public Health, 17(6), 2115. https://doi.org/10.3390/ijerph17062115