The Effects of Private Health Insurance on Universal Health Coverage Objectives in China: A Systematic Literature Review


Abstract
1. Introduction
2. Materials and Methods
2.1. Search Strategy
2.2. Inclusion and Exclusion Criteria
2.3. Quality Assessment and Risk of Bias
3. Results
3.1. Characteristics of Included Studies
3.2. Coverage Prevalence
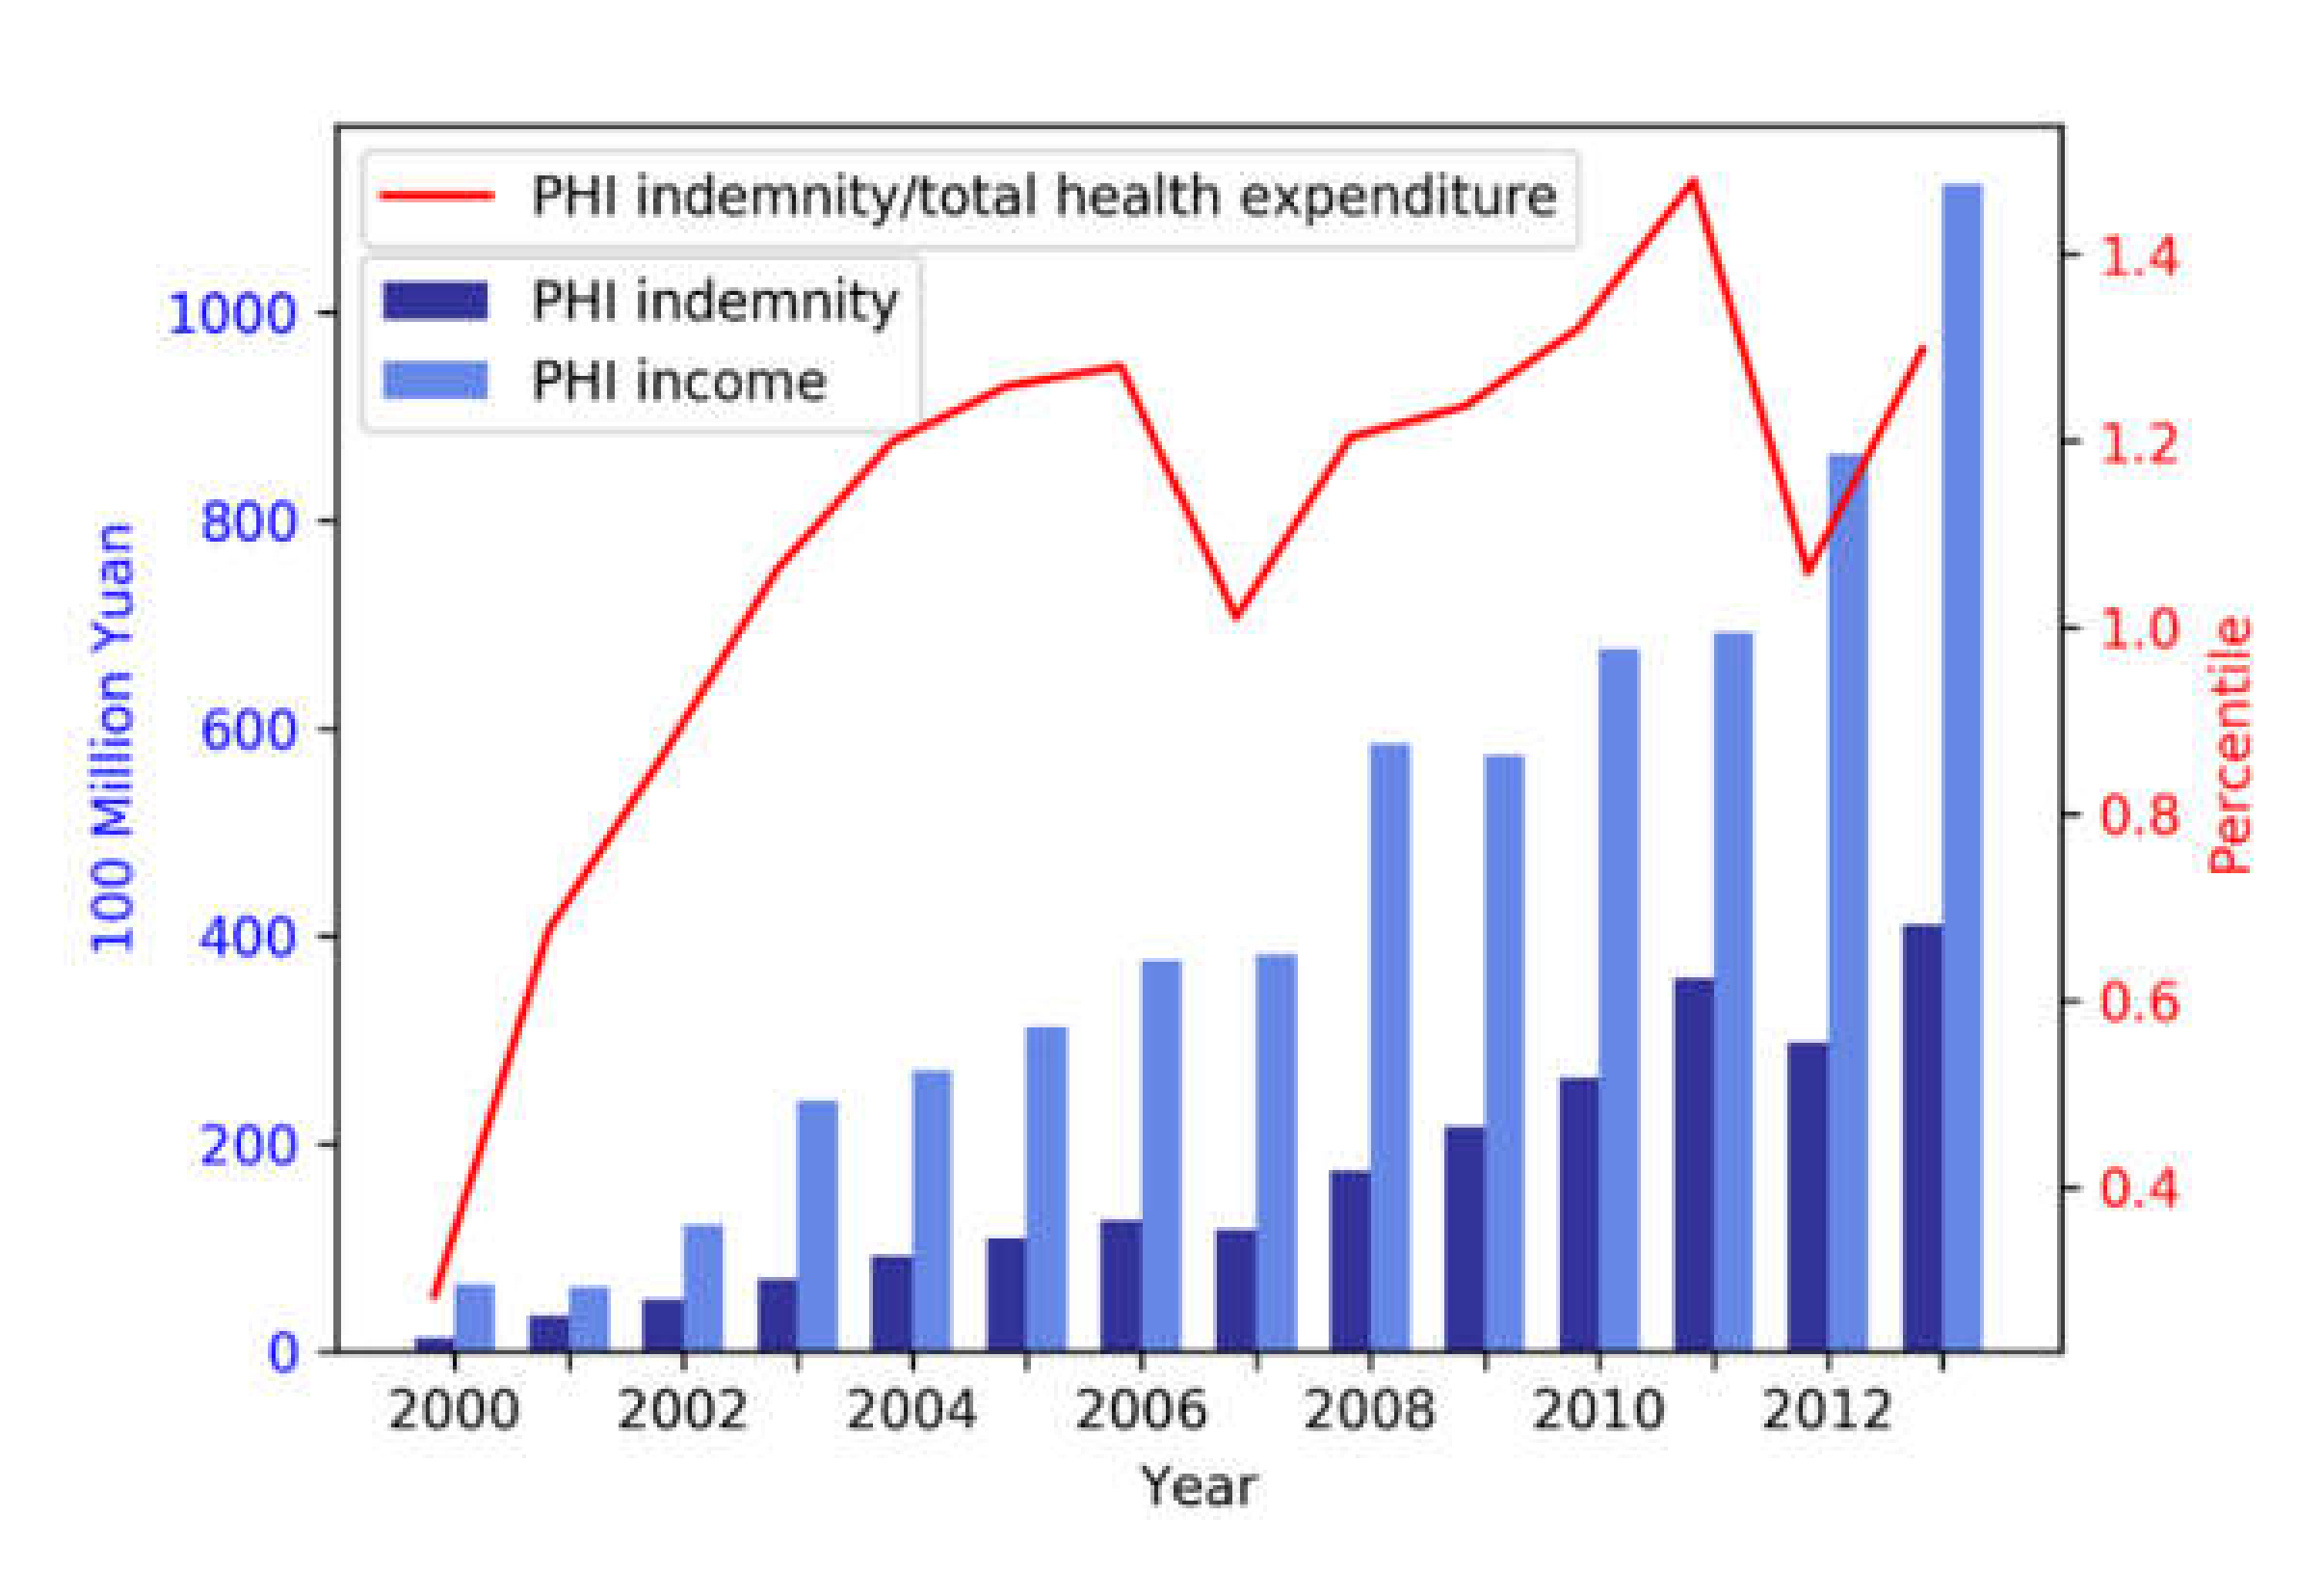
3.2.1. Trend and Distribution
3.2.2. Relationship between PHI and SHI Coverage
3.3. Access to Healthcare Services
3.4. Financial Protection
4. Discussion
5. Conclusions
Supplementary Materials
Author Contributions
Funding
Acknowledgments
Conflicts of Interest
Appendix A
- Does this study focus on PHI? (1 point)
- Does the study provide clear information of the used data, including source, sample size, time period, levels etc.? (1 point)
- Are data analysed in the study nationwide sampling (including at least 15 provinces)? (2 points)
- (a)
- Including data from at least 15 provinces (2 points);
- (b)
- Including data from more than one province but less than 15 provinces (1 point);
- (c)
- Data from only one province (0 point).
- Are data analysed in the study longitudinal? (1 point)
- How does this study deal with selection of enrolment into insurance? (3 points)
- (a)
- Quasi-randomised controlled trials that create a matched control group through either a propensity score matching method or a regression discontinuity design (3 points);
- (b)
- Difference-in-difference studies where the pre- and postintervention periods for study and control groups are the same and the characteristics of the two groups are controlled for through regression (3 points);
- (c)
- Regression studies that consider selection through the instrumental variable method (2 points);
- (d)
- Regression studies that control for related background variables but do not consider enrolment selection (1 point)
- (e)
- Others (0 point)
- Does the study examine data by applying a stratification approach? (1 point)
- Does the study describe significance test, model robustness test, or other internal validity tests for its statistical analysis? (1 point)
Appendix B

| No. | Studies | Data Source | Study Period | Geographic Area | Principal Method | Reviewer * | Quality-grading Items † | Average Grade | Quality Category‡ | Action | ||||||
| 1 | 2 | 3 | 4 | 5 | 6 | 7 | ||||||||||
| 1 | [14] | CHNS | 2000, 2004, 2006 | 9 provinces | Logistic models with difference in difference estimator, without propensity score matching | R1 | 1 | 1 | 1 | 1 | 3 | 0 | 1 | 8.5 | High | Review |
| R2 | 1 | 1 | 1 | 1 | 3 | 1 | 1 | |||||||||
| 2 | [91] | Multi-centre retrospective study with 681 patients | 2010-2013 | Shanghai | Chi-square tests that compare PHI enrolment among different SHI status | R1 | 0 | 1 | 0 | 0 | 0 | 0 | 0 | 1.5 | Low | Exclude |
| R2 | 1 | 1 | 0 | 0 | 0 | 0 | 0 | |||||||||
| 3 | [92] | Phone survey using randomly generated landline numbers including 1500 respondents | 2010 | Shenzhen | Multivariate logistic models | R1 | 0 | 1 | 0 | 0 | 1 | 0 | 0 | 2 | Low | Exclude |
| R2 | 0 | 1 | 0 | 0 | 1 | 0 | 0 | |||||||||
| 4 | [44] | Phone survey using random digit dialling method sampling landline numbers including 5097 households | 2011 | Beijing, Shanghai, and Xiamen | Logistic models | R1 | 1 | 1 | 1 | 1 | 1 | 1 | 0 | 6.5 | High | Review |
| R2 | 1 | 1 | 1 | 1 | 1 | 1 | 1 | |||||||||
| 5 | [48] | CHARLS | 2011 | 28 provinces | Bivariate probit models for both PHI enrolment and pension scheme enrolment | R1 | 1 | 1 | 2 | 0 | 1 | 0 | 0 | 5 | Medium | Review |
| R2 | 1 | 1 | 2 | 0 | 1 | 0 | 0 | |||||||||
| 6 | [41] | CHARLS | 2011, 2013 | 28 provinces | Multinomial logistic models for five insurance status | R1 | 1 | 1 | 2 | 1 | 1 | 0 | 1 | 7.5 | High | Review |
| R2 | 1 | 1 | 2 | 1 | 1 | 1 | 1 | |||||||||
| 7 | [40] | CHNS | 2004–2011 | 9 provinces | Logistic models with difference in difference estimator, without propensity score matching | R1 | 1 | 1 | 1 | 1 | 3 | 0 | 0 | 7 | High | Review |
| R2 | 1 | 1 | 1 | 1 | 3 | 0 | 0 | |||||||||
| 8 | [66] | CHNS | 2004, 2006, 2009 | 9 provinces | Probit models for health services use and linear probability models for calculating Concentration Indices | R1 | 0 | 1 | 1 | 1 | 1 | 1 | 0 | 5 | Medium | Review |
| R2 | 0 | 1 | 1 | 1 | 1 | 1 | 0 | |||||||||
| 9 | [56] | CHNS | 2004 | 9 provinces | Heckman selection models that select healthcare users and then model their OOP payments | R1 | 0 | 1 | 1 | 0 | 1 | 1 | 0 | 4.5 | Medium | Review |
| R2 | 0 | 1 | 1 | 0 | 1 | 1 | 1 | |||||||||
| 10 | [61] | State Council URBMI Household Survey | 2007-2010 | 9 cities | Instrumental variable regression, using the community-year level participation rate of each insurance programme among the non-migrant population as the instrumental variable | R1 | 1 | 1 | 1 | 0 | 2 | 1 | 1 | 7.5 | High | Review |
| R2 | 1 | 1 | 1 | 1 | 2 | 1 | 1 | |||||||||
| 11 | [63] | NHSS | 2003 | 31 provinces | Multivariate linear models for the number of outpatient visits, the number of inpatient visits and per capita annual medical expenditure | R1 | 1 | 1 | 2 | 0 | 1 | 0 | 1 | 6.5 | High | Review |
| R2 | 1 | 1 | 2 | 0 | 1 | 1 | 1 | |||||||||
| 12 | [93] | Questionnaire survey of all first and fourth graders in four elementary schools | 2005 | Pinggu district in Beijing | Chi-square tests that compare health access indicators among different insurance status | R1 | 1 | 1 | 0 | 0 | 0 | 0 | 0 | 2 | Low | Exclude |
| R2 | 1 | 1 | 0 | 0 | 0 | 0 | 0 | |||||||||
| 13 | [64] | CHARLS | 2011, 2013 | 28 provinces | Heckman selection models that selects awareness of healthcare provider ownership and model utilisation for only outpatient users | R1 | 0 | 1 | 2 | 1 | 1 | 1 | 0 | 6 | Medium | Review |
| R2 | 0 | 1 | 2 | 1 | 1 | 1 | 0 | |||||||||
| 14 | [69] | Urban data–a hospital of PKU; rural data–a survey in 101 villages | Urban-2003; rural-2005 | Urban–patient in Beijing; rural—5 provinces | Linear regression directly on health expenditure data | R1 | 1 | 1 | 1 | 1 | 1 | 0 | 0 | 5 | Medium | Review |
| R2 | 1 | 1 | 1 | 1 | 1 | 0 | 0 | |||||||||
| 15 | [94] | NHSS | 2008, 2013 | Rural Shaanxi province | Decomposition based on the logistic model for the incidence of catastrophic health expenditure representing OOP payments over 40% of the household capacity to pay | R1 | 0 | 1 | 0 | 1 | 1 | 0 | 0 | 3 | Low | Exclude |
| R2 | 0 | 1 | 0 | 1 | 1 | 0 | 0 | |||||||||
| 16 | [95] | NHSS | 2002, 2007 | Gansu province | Kakwani index of progressivity of healthcare payments on gross income | R1 | 0 | 1 | 0 | 1 | 0 | 0 | 1 | 3.5 | Low | Exclude |
| R2 | 0 | 1 | 0 | 1 | 0 | 1 | 1 | |||||||||
| 17 | [96] | NHSS | 2002, 2007 | Heilongjiang province | Kakwani index of progressivity of healthcare payments on gross income | R1 | 0 | 1 | 0 | 1 | 0 | 0 | 1 | 3 | Low | Exclude |
| R2 | 0 | 1 | 0 | 1 | 0 | 0 | 1 | |||||||||
| 18 | [50] | State statistics | 2002–2007 | 3 provinces | Linear models | R1 | 1 | 1 | 1 | 1 | 1 | 1 | 0 | 6 | Medium | Review |
| R2 | 1 | 1 | 1 | 1 | 1 | 1 | 0 | |||||||||
| 19 | [55] | State statistics | 2005–2011 | Nationwide | Degree of coupling referring to coupling theory in Physics | R1 | 1 | 1 | 2 | 1 | 0 | 0 | 0 | 5 | Medium | Review |
| R2 | 1 | 1 | 2 | 1 | 0 | 0 | 0 | |||||||||
| 20 | [52] | State statistics | 2002–2009 | 30 Provinces | Dynamic panel models with a first order lag | R1 | 1 | 1 | 2 | 1 | 1 | 0 | 1 | 7 | High | Review |
| R2 | 1 | 1 | 2 | 1 | 1 | 0 | 1 | |||||||||
| 21 | [51] | State statistics | 2000-2007 | Nationwide | Linear models | R1 | 1 | 1 | 2 | 1 | 1 | 0 | 1 | 7 | High | Review |
| R2 | 1 | 1 | 2 | 1 | 1 | 0 | 1 | |||||||||
| 22 | [54] | State statistics | 2005–2010 | Nationwide | Degree of Coordination based on the composite system synergy degree model | R1 | 1 | 1 | 2 | 1 | 0 | 1 | 0 | 6 | Medium | Review |
| R2 | 1 | 1 | 2 | 1 | 0 | 1 | 0 | |||||||||
| 23 | [42] | CHNS | 1989-2009 | 9 provinces | Logistic models for PHI enrolment, and fixed effect models and instrumental variable regression for total health expenditure | R1 | 1 | 1 | 1 | 1 | 2 | 0 | 1 | 7 | High | Review |
| R2 | 1 | 1 | 1 | 1 | 2 | 0 | 1 | |||||||||
| 24 | [49] | CHNS | 2004 2006 2009 | 9 provinces | Probit models with difference in difference estimator, without propensity score matching | R1 | 1 | 1 | 1 | 1 | 3 | 0 | 0 | 7 | High | Review |
| R2 | 1 | 1 | 1 | 1 | 3 | 0 | 0 | |||||||||
| 25 | [97] | Household survey using stratified sampling including 1600 households | 2006 | Shanghai municipality | Linear models for logged expenditure on PHI | R1 | 1 | 1 | 0 | 0 | 1 | 0 | 0 | 3 | Low | Exclude |
| R2 | 1 | 1 | 0 | 0 | 1 | 0 | 0 | |||||||||
| 26 | [32] | CHNS | 2000, 2004, 2006 | 9 provinces | Bivariate probit models with partial observability | R1 | 1 | 1 | 1 | 1 | 1 | 0 | 0 | 5.5 | Medium | Review |
| R2 | 1 | 1 | 1 | 1 | 1 | 1 | 0 | |||||||||
| 27 | [46] | CHNS | 2006 | 9 provinces | Bivariate probit models for both PHI enrolment and NCMS enrolment | R1 | 1 | 1 | 1 | 0 | 1 | 1 | 0 | 5.5 | Medium | Review |
| R2 | 1 | 1 | 1 | 0 | 1 | 1 | 1 | |||||||||
| 28 | [53] | State statistics | 2003–2012 | Nationwide | Fixed effects models with per capita outpatient expenditure as the instrumental variable | R1 | 1 | 1 | 2 | 1 | 2 | 0 | 0 | 7.5 | High | Review |
| R2 | 1 | 1 | 2 | 1 | 2 | 0 | 1 | |||||||||
| 29 | [47] | State statistics | 2007–2013 | 31 provinces | Fixed effects models | R1 | 1 | 1 | 2 | 1 | 1 | 1 | 1 | 8 | High | Review |
| R2 | 1 | 1 | 2 | 1 | 1 | 1 | 1 | |||||||||
| 30 | [31] | State statistics | 2004–2013 | 31 provinces | Linear models | R1 | 1 | 1 | 2 | 1 | 1 | 1 | 0 | 7 | High | Review |
| R2 | 1 | 1 | 2 | 1 | 1 | 1 | 0 | |||||||||
| 31 | [43] | Questionnaire survey including 557 individuals | 2012–2013 | 5 cities | Logistic models | R1 | 1 | 1 | 1 | 0 | 1 | 0 | 1 | 5 | Medium | Review |
| R2 | 1 | 1 | 1 | 0 | 1 | 0 | 1 | |||||||||
| 32 | [98] | Questionnaire survey of two districts. This study only included 900 working individuals of 1600 samples | 2010 | Tianjin municipality | Heckman-probit models that select willingness to buy PHI and then model the level of expenditure on PHI | R1 | 1 | 1 | 0 | 0 | 1 | 0 | 0 | 3.5 | Low | Exclude |
| R2 | 1 | 1 | 0 | 0 | 1 | 0 | 1 | |||||||||
| 33 | [58] | CHARLS | 2008 | 2 provinces | Logistic and multi-nominal models for types of healthcare | R1 | 1 | 1 | 1 | 0 | 1 | 0 | 0 | 4.5 | Medium | Review |
| R2 | 1 | 1 | 1 | 0 | 1 | 1 | 0 | |||||||||
| 34 | [99] | Questionnaire survey of a city including 1200 individuals | 2011 | Dongguan city | Chi-square tests that compare utilisation among different health insurance status | R1 | 0 | 1 | 0 | 0 | 0 | 0 | 0 | 1 | Low | Exclude |
| R2 | 0 | 1 | 0 | 0 | 0 | 0 | 0 | |||||||||
| 35 | [57] | CHARLS | 2008 | 2 provinces | Two-part models that select utilisation at first and then model logged health expenditure | R1 | 1 | 1 | 1 | 0 | 1 | 0 | 0 | 4 | Medium | Review |
| R2 | 1 | 1 | 1 | 0 | 1 | 0 | 0 | |||||||||
| 36 | [62] | State statistics | 2006–2010 | Nationwide | Fixed effects models for the average length of hospitalisation | R1 | 1 | 1 | 2 | 1 | 1 | 0 | 0 | 6 | Medium | Review |
| R2 | 1 | 1 | 2 | 1 | 1 | 0 | 0 | |||||||||
| 37 | [100] | Household survey using multilevel stratified sampling including 5928 households | 2014 | Three cities in Sichuan province | Logistics models | R1 | 0 | 1 | 0 | 0 | 1 | 0 | 0 | 2 | Low | Exclude |
| R2 | 0 | 1 | 0 | 0 | 1 | 0 | 0 | |||||||||
| 38 | [60] | CHNS | 2000, 2004, 2006, 2009 | 9 provinces | Logistic and linear models with difference in difference estimator, without propensity score matching | R1 | 1 | 1 | 1 | 1 | 3 | 0 | 0 | 7 | High | Review |
| R2 | 1 | 1 | 1 | 1 | 3 | 0 | 0 | |||||||||
| 39 | [59] | State Council URBMI Household Survey | 2007, 2008 | 9 cities | Probit models | R1 | 1 | 1 | 1 | 1 | 1 | 1 | 1 | 7 | High | Review |
| R2 | 1 | 1 | 1 | 1 | 1 | 1 | 1 | |||||||||
| 40 | [67] | Chinese longitudinal Healthy Longevity Survey (CLHLS) | 2011–2012 | 23 provinces | Linear models | R1 | 1 | 1 | 2 | 0 | 1 | 0 | 0 | 5 | Medium | Review |
| R2 | 1 | 1 | 2 | 0 | 1 | 0 | 0 | |||||||||
| 41 | [101] | Questionnaire survey including 4800 individuals | 2014 | 8 provinces | Chi-square tests that compare the incidence of catastrophic health expenditure indicated by OOP payments over 40% of the household capacity to pay between PHI enrolment status | R1 | 0 | 1 | 1 | 0 | 0 | 0 | 0 | 2 | Low | Exclude |
| R2 | 0 | 1 | 1 | 0 | 0 | 0 | 0 | |||||||||
| 42 | [102] | NHSS | 2003, 2008 | Rural Xinjiang province | Kakwani index | R1 | 1 | 1 | 0 | 1 | 0 | 0 | 0 | 3 | Low | Exclude |
| R2 | 1 | 1 | 0 | 1 | 0 | 0 | 0 | |||||||||
| 43 | [103] | Third Corps Survey | 2010 | Xingjiang Corps | Aronson-Johnson-Lambert Redistributive effect | R1 | 1 | 1 | 0 | 0 | 0 | 0 | 0 | 2 | Low | Exclude |
| R2 | 1 | 1 | 0 | 0 | 0 | 0 | 0 | |||||||||
| 44 | [70] | State statistics | 2006–2012 | 31 provinces | Fixed effects models | R1 | 1 | 1 | 2 | 1 | 1 | 0 | 1 | 7 | High | Review |
| R2 | 1 | 1 | 2 | 1 | 1 | 0 | 1 | |||||||||
References
- Health Expenditure, Public (% of Total Health Expenditure). Available online: https://data.worldbank.org/indicator/SH.XPD.PUBL?view=chart (accessed on 21 September 2019).
- Dai, B.; Zhou, J.; Mei, Y.J.; Wu, B.; Mao, Z. Can the New Cooperative Medical Scheme promote rural elders’ access to health-care services? Geriatr. Gerontol. Int. 2011, 11, 239–245. [Google Scholar] [CrossRef] [PubMed]
- Liang, L.; Langenbrunner, J.C. The Long March to Universal Coverage: Lessons from China; Cotlear, D., Ed.; The World Bank: Washington, DC, USA, 2013. [Google Scholar]
- Meng, Q.; Xu, L.; Zhang, Y.; Qian, J.; Cai, M.; Xin, Y.; Barber, S.L. Trends in access to health services and financial protection in China between 2003 and 2011: A cross-sectional study. Lancet 2012, 379, 805–814. [Google Scholar] [CrossRef]
- Meng, Q.; Xu, L. Monitoring and evaluating progress towards Universal Health Coverage in China. PLoS Med. 2014, 11, e1001694. [Google Scholar] [CrossRef] [PubMed]
- Yip, W.C.M.; Hsiao, W.C.; Chen, W.; Hu, S.; Ma, J.; Maynard, A. Early appraisal of China’s huge and complex health-care reforms. Lancet 2012, 379, 833–842. [Google Scholar] [CrossRef]
- National Health and Family Planning Commission. China Health Statistical Yearbook; National Health and Family Planning Commission: Beijing, China, 2013. [Google Scholar]
- Yip, W.C.M.; Hsiao, W.C. China’s health care reform: A tentative assessment. China Econ. Rev. 2009, 20, 613–619. [Google Scholar] [CrossRef]
- Meng, Q.; Fang, H.; Liu, X.; Yuan, B.; Xu, J. Consolidating the social health insurance schemes in China: Towards an equitable and efficient health system. Lancet 2015, 386, 1484–1492. [Google Scholar] [CrossRef]
- Ministry of Human Resource and Social Security. Summary of National Social Insurance; Ministry of Human Resource and Social Security: Beijing, China, 2012. [Google Scholar]
- Center for Health Statistics and Information, National Health and Family Planning Commission (China). China Health and Family Planning Statistics Yearbook; Peking Union Medical College Press: Beijing, China, 2013. [Google Scholar]
- Duan, J. Historical opportunity of commercial health insurance development in China. China Insur. 2008, 8, 14–21. [Google Scholar]
- Xiang, J. Developing commercial health insurance, serving China’s reform on the medical and health system. Insur. Stud. 2014, 12, 3–13. [Google Scholar]
- Liu, H.; Gao, S.; Rizzo, J.A. The expansion of public health insurance and the demand for private health insurance in rural China. China Econ. Rev. 2011, 22, 28–41. [Google Scholar] [CrossRef]
- Barros, P.P.; Siciliani, L. Public and Private Sector Interface. In Handbook of Health Economics; Pauly, M.V., McGuire, T.G., Barros, P.P., Eds.; Elsevier: Oxford, UK, 2012; Volume 2. [Google Scholar]
- CPCCC. State Council. In Opinions on Deepening Health Reforms Beijing; State Council of the People’s Republic of China: Beijing, China, 2009. [Google Scholar]
- Ernst & Young. China Launches Pilot Individual Income Tax policy for Commercial Health Insurance Products; Ernst & Young LLP: London, UK, 2016. [Google Scholar]
- WHO. Advancing and sustaining universal coverage. In The World Health Report 2008, Primary Health Care-Now more than Ever; World Health Organization: Geneva, Switzerland, 2008. [Google Scholar]
- Van de Ven, W.P.M.M. Making Health Insurance Affodable: Role of Risk Equalization. In Scaling Up Affordable Health Insurance; Preker, A.S., Lindner, M.E., Chernichovsky, D., Onno, P.S., Eds.; The World Bank: Washington, DC, USA, 2013. [Google Scholar]
- Colombo, F. Lessons for Developing Countries from the OECD. In Private Voluntary Health Insurance in Development: Friend or Foe? Preker, A.S., Scheffler, R.M., Bassett, M.C., Eds.; The World Bank: Washington, DC, USA, 2007. [Google Scholar]
- Arrow, K.J. UNCERTAINTY AND THE Welf. ECONOMICS OF MEDICAL-CARE. Am. Econ. Rev 1963, 53, 941–973. [Google Scholar]
- Einav, L.; Finkelstein, A. Moral hazard in health insurance: What we know and how we know it. J. Eur. Econ. Assoc. 2018, 16, 957–982. [Google Scholar] [CrossRef] [PubMed]
- Sekhri, N.; Savedoff, W. Regulating private health insurance to serve the public interest: Policy issues for developing countries. Int. J. Health Plan. Manag. 2006, 21, 357–392. [Google Scholar] [CrossRef] [PubMed]
- Pauly, M.V. Insights on Demand for Private Voluntary Health Insurance in Less Developed Countries. In Private Voluntary Health Insurance in Development: Friend or Foe?x; Preker, A.S., Scheffler, R.M., Bassett, M.C., Eds.; The World Bank: Washington, DC, USA, 2007; pp. 25–54. [Google Scholar]
- Kutzin, J. Health financing for universal coverage and health system performance: Concepts and implications for policy. Bull. World Health Organ. 2013, 91, 602–611. [Google Scholar] [CrossRef] [PubMed]
- Preker, A.S. The Evolution of Health Insurance in Developing Countries. In Private Voluntary Health Insurance in Development: Friend or Foe? Preker, A.S., Scheffler, R.M., Bassett, M.C., Eds.; The World Bank: Washington, DC, USA, 2007; pp. 1–22. [Google Scholar]
- Gu, X. Position of Commercial Health Insurance in Universal Health Care. Comp. Econ. Soc. Syst. 2009, 6, 52–59. [Google Scholar]
- Preker, A.S.; Lindner, M.E.; Chernichovsky, D.; Onno, P.S. Introduction: Public Options, Private Choices. In Scaling Up Affordable Health Insurance; Preker, A.S., Lindner, M.E., Chernichovsky, D., Onno, P.S., Eds.; The World Bank: Washington, DC, USA, 2013. [Google Scholar]
- Scheil-Adlung. Health Protection: More Than Financial Protection. In Scaling Up Affordable Health Insurance; Preker, A.S., Lindner, M.E., Chernichovsky, D., Onno, P.S., Eds.; The World Bank: Washington, DC, USA, 2013. [Google Scholar]
- WHO. World Health Report, 2010: Health Systems Financing the Path to Universal Coverage; World Health Organisation: Geneva, Switzerland, 2010. [Google Scholar]
- Suo, L.; Wanyan, R.; Chen, T. A research on the uneven development of health insurance and its reasons. Insur. Stud. 2015, 1, 42–53. [Google Scholar]
- Liu, H.; Wang, J. An empirical analysis of private health insurance ownership in China. China Econ. Q. 2012, 11, 1525–1548. [Google Scholar]
- Moher, D.; Liberati, A.; Tetzlaff, J.; Altman, D.G. Preferred reporting items for systematic reviews and meta-analyses: The PRISMA statement. Ann. Intern. Med. 2009, 151, 264–269. [Google Scholar] [CrossRef]
- Ekman, B. Community-based health insurance in low-income countries: A systematic review of the evidence. Health Policy Plan. 2004, 19, 249–270. [Google Scholar] [CrossRef]
- Spaan, E.; Mathijssen, J.; Tromp, N.; McBain, F.; Have, A.T.; Baltussen, R. The impact of health insurance in Africa and Asia: A systematic review. Bull. World Health Organ. 2012, 90, 685–692. [Google Scholar] [CrossRef]
- Liang, X.; Guo, H.; Jin, C.; Peng, X.; Zhang, X. The Effect of New Cooperative Medical Scheme on Health Outcomes and Alleviating Catastrophic Health Expenditure in China: A Systematic Review. Plos One 2012, 7, e40850. [Google Scholar] [CrossRef]
- Acharya, A.; Vellakkal, S.; Taylor, F.; Masset, E.; Satija, A.; Burke, M. The Impact of Health Insurance Schemes for the Informal Sector in Low- and Middle-Income Countries: A Systematic Review. World Bank Res. Obs. 2013, 28, 236–266. [Google Scholar] [CrossRef]
- Akers, J.; Aguiar-Ibáñez, R.; Baba-Akbari Sari, A. CRD’s Guidance for Undertaking Reviews in Health Care; Centre for Reviews and Dissemination (CRD): York, UK, 2009. [Google Scholar]
- Petticrew, M.; Roberts, H. Systematic Reviews in the Social Sciences: A Practical Guide; Blackwell Publishing Ltd.: Oxford, UK, 2006. [Google Scholar]
- Hou, X.; Zhang, J. The effects of public health insurance expansion on private health insurance in urban China. Int. J. Health Econ. Manag. 2017, 17, 359–375. [Google Scholar] [CrossRef]
- Jin, Y.; Hou, Z.; Zhang, D. Determinants of Health Insurance Coverage among People Aged 45 and over in China: Who Buys Public, Private and Multiple Insurance. Plos ONE 2016, 11, e0161774. [Google Scholar] [CrossRef] [PubMed]
- Yuan, Z.; Sun, Y.; Chen, Z. Moral Hazard in the commercial medical insurance in China. Insur. Stud. 2014, 6, 53–62. [Google Scholar]
- Dong, M.; Zhao, Y. An analysis of current determinants of buying commercial health insurance. Stat. Obs. 2013, 395, 103–106. [Google Scholar]
- Fang, K.N.; Shia, B.C.; Ma, S.G. Health Insurance Coverage and Impact: A Survey in Three Cities in China. Plos ONE 2012, 7, e39157. [Google Scholar] [CrossRef] [PubMed]
- China Insurance Regulatory Commission. Yearbook of China’s Insurance; China Insurance Regulatory Commission: Beijing, China, 2014. [Google Scholar]
- Qu, D.; Wang, J. An analysis of Chinese rural residents’ medical insurance demand and its determinants. Insur. Stud. 2010, 4, 61–65. [Google Scholar]
- Wang, W.; Peng, R.; Wang, T.; Lai, X. A determinant study on the demand for private health insurance: Based on modeling panel data. Zhejiang Financ. 2015, 5, 56–60. [Google Scholar]
- Yue, Y.; Zou, J. The Role of Wealth and Health in Insurance Choice: Bivariate Probit Analysis in China. Math. Probl. Eng. 2014, 2014, 9. [Google Scholar] [CrossRef]
- Xu, R.; Zhang, D.; Ji, X. A research on the effects of NCMS on the rural demand for commercial medical insurance. Insur. Stud. 2013, 3, 120–127. [Google Scholar]
- Li, Q. The influential factor analysis of premium income of commercial health insurance: A comparison between Hubei, Beijing and Shanghai. South China Financ. 2009, 7, 55–59. [Google Scholar]
- Wang, L. The analysis of effective demand on health insurance. Technoecon. Manag. Res. 2009, 1, 100–102. [Google Scholar]
- Wang, X. Social health insurance, market structure and China’s commercial health insurance development. Insur. Stud. 2011, 7, 35–41. [Google Scholar]
- Zhu, M.; Gui, Z. Public and private health insurance in medical expenditure financing: An analysis based on 2003–2012 China’ s provincial panel data of urban areas. Insur. Stud. 2014, 6, 96–104. [Google Scholar]
- Zheng, R.; Hua, J. The degree of coordination between commercial medical insurance and social medical insurance in China. Insur. Stud. 2013, 4, 101–109. [Google Scholar]
- Lv, Z. A study on the collaborative development of commercial health insurance and social health insurance: Based on coupling theory. J. Shandong Univ. 2013, 6, 45–54. [Google Scholar]
- You, X.; Kobayashi, Y. Determinants of out-of-pocket health expenditure in China: Analysis using China Health and Nutrition Survey data. Appl. Health Econ. Health Policy 2011, 9, 39–49. [Google Scholar] [CrossRef]
- Chai, H.-M. An empirical analysis of demand for health care and medical insurance of Chinese urban and rural residents. World Econ. Pap. 2013, 5, 107–119. [Google Scholar]
- Chai, H.-M. Study of the health care utilization and multi-health insurance schemes in China. Med. Philos. 2014, 35, 7–10. [Google Scholar]
- Zang, W.; Zhao, S.; Liu, G. The analysis of adverse selection in China’s urban basic medical insurance programs. China Econ. Q. 2012, 12, 47–70. [Google Scholar]
- Jiao, N. A Research on the Selection of Commercial Medical Insurance and the Healthcare Needs of Residents in China: An Empirical Analysis Based on DID. J. Yunnan Financ. Trade Inst. 2015, 174, 91–99. [Google Scholar]
- Qin, X.; Pan, J.; Liu, G.G. Does participating in health insurance benefit the migrant workers in China? An empirical investigation. China Econ. Rev. 2014, 30, 263–278. [Google Scholar] [CrossRef]
- Wang, Q. The Study of the Effect of Health Insurance on Medical Care Quality. Res. Econ. Manag. 2012, 10, 24–31. [Google Scholar]
- Chau, K.L. Ecological analysis of health care utilisation for China’s rural population: Association with a rural county’s socioeconomic characteristics. Bmc Public Health 2010, 10, 664. [Google Scholar] [CrossRef]
- Wang, Q.; Zhang, D.L.; Hou, Z.Y. Insurance coverage and socioeconomic differences in patient choice between private and public health care providers in China. Soc. Sci. Med. 2016, 170, 124–132. [Google Scholar] [CrossRef]
- Ernst & Young. The Rise of Private Health Insurance in China: Consumer Demand Presents Huge Opportunities and Risks; Ernst & Young LLP: London, UK, 2016. [Google Scholar]
- Yang, W. China’s new cooperative medical scheme and equity in access to health care: Evidence from a longitudinal household survey. Int. J. Equity Health 2013, 12, 20. [Google Scholar] [CrossRef]
- Zeng, Y.; Ou, L.; Yang, T.; Fang, Y. The effect of medical insurance impact on Chinese elderly’s medical expense: Results from the survey of CLHLS. Chin. J. Gerontol. 2017, 37, 710–713. [Google Scholar]
- Xu, K.; Saksena, P.; Holly, A. The Determinants of Health Expenditure: A Country-Level Panel Data Analysis; World Health Organisation: Geneva, Switzerland, 2011; Volume 26. [Google Scholar]
- Wang, H.H.; Huang, S.; Zhang, L.; Rozelle, S.; Yan, Y. A comparison of rural and urban healthcare consumption and health insurance. China Agric. Econ. Rev. 2010, 2, 212–227. [Google Scholar] [CrossRef]
- Cui, E.; Jiang, S.; Jia, S. Research on the Impact of Environmental Pollution, Commercial Health Insurance to Health Costs: Based on the Empirical Analysis of Provincial Panel Data. Nankai Econ. Stud. 2016, 6, 140–150. [Google Scholar]
- Ng, A.; Dyckerhoff, C.; Then, F. Private Health Insurance in China: Finding the Winning Formula; McKinsey’s Healthcare Systems and Services Practice; Health International, McKinsey and Company: New York, NY, USA, 2012. [Google Scholar]
- Cutler, D.M.; Gruber, J. Does public insurance crowd out private insurance? Q. J. Econ. 1996, 111, 391–430. [Google Scholar] [CrossRef]
- Shore-Sheppard, L.; Buchmueller, T.C.; Jensen, G.A. Medicaid and crowding out of private insurance: A re-examination using firm level data. J. Health Econ. 2000, 19, 61–91. [Google Scholar] [CrossRef]
- Nolan, B. The interaction of public and private health insurance: Ireland as a case study. Geneva Pap. Risk Insur. Issues Pract. 2006, 31, 633–649. [Google Scholar] [CrossRef]
- Zweifel, P.; Krey, B.B.; Tagli, M. Supply of Private Voluntary Health Insurance in Low-Income Countries. In Private Voluntary Health Insurance in Development: Friend or Foe? Preker, A.S., Scheffler, R.M., Bassett, M.C., Eds.; The World Bank: Washington, DC, USA, 2007. [Google Scholar]
- Bowie, R.; Adams, G. Financial and Management Best Practice in Private Voluntary Health Insurance. In Private Voluntary Health Insurance in Development: Friend or Foe? Preker, A.S., Scheffler, R.M., Bassett, M.C., Eds.; The World Bank: Washington, DC, USA, 2007. [Google Scholar]
- Pauly, M.V.; Blavin, F.E.; Meghan, S. How private, voluntary health insurance can work in developing countries. Health Affairs. 2009, 28, 1778–1787. [Google Scholar] [CrossRef] [PubMed]
- Qiu, C.; Chen, T. Risk factors of losses of commercial medical insurance: An empirical analysis using generalised linear models. Chin. J. Appl. Probab. 2012, 28, 389–399. [Google Scholar]
- China National Health Development Research Center. China National Health Accounts Report; National Health and Family Planning Commission: Beijing, China, 2014. [Google Scholar]
- Pauly, M.V. The evolution of health insurance in India and China. Health Affairs. 2008, 27, 1016–1019. [Google Scholar] [CrossRef]
- Barros, A.J.; Bastos, J.L.; Dâmaso, A.H. Catastrophic spending on health care in Brazil: Private health insurance does not seem to be the solution. Cad. Saude Publica 2011, 27, s254–s262. [Google Scholar] [CrossRef][Green Version]
- Shin, J. Private health insurance in South Korea: An international comparison. Health Policy 2012, 108, 76–85. [Google Scholar] [CrossRef]
- Colombo, F.; Tapay, N. Private Health Insurance in OECD Countries; OECD: Paris, France, 2004. [Google Scholar]
- Enthoven, A.C.; van de Ven, W.P.M.M. Going Dutch-Managed-competition health insurance in the Netherlands. N. Engl. J. Med. 2007, 357, 2421–2423. [Google Scholar] [CrossRef]
- Mills, A.; Ataguba, J.E.; Akazili, J.; Borghi, J.; Garshong, B.; Makawia, S.; McIntyre, D. Equity in financing and use of health care in Ghana, South Africa, and Tanzania: Implications for paths to universal coverage. Lancet 2012, 380, 126–133. [Google Scholar] [CrossRef]
- White, J. The 2010 US health care reform: Approaching and avoiding how other countries finance health care. Health Econ. Policy Law 2012, 8, 289–315. [Google Scholar] [CrossRef]
- Sekhri, N.; Savedoff, W. Private health insurance: Implications for developing countries. Bull. World Health Organ. 2005, 83, 127–134. [Google Scholar]
- Gu, X. Status and development of private health insurance in China. Insur. Stud. 2009, 11, 26–33. [Google Scholar]
- Zhao, B.; Dong, X.; Ma, X. Discussion on development strategies for Chinese commercial health insurance in the frame of new health reform. Insur. Stud. 2011, 2, 74–83. [Google Scholar]
- Yetley, E.A.; MacFarlane, A.J.; Greene-Finestone, L.S.; Garza, C.; Ard, J.D.; Atkinson, S.A.; King, J.C. Options for basing Dietary Reference Intakes (DRIs) on chronic disease endpoints: Report from a joint US-/Canadian-sponsored working group. Am. J. Clin. Nutr. 2016, 105, 249S–285S. [Google Scholar] [CrossRef] [PubMed]
- Liu, B.; Yan, H.; Guo, R.; Liu, X.; Li, X.; Xu, Y. The Basic Social Medical Insurance Is Associated with Clinical Outcomes in the Patients with ST-elevation Myocardial Infarction: A Retrospective Study from Shanghai, China. Int. J. Med Sci. 2014, 11, 905. [Google Scholar] [CrossRef]
- Lam, K.K.; Johnston, J.M. Health insurance and healthcare utilisation for Shenzhen residents: A tale of registrants and migrants? Bmc Public Health 2012, 12, 868. [Google Scholar] [CrossRef]
- Zhu, J.; Zhu, Y.; Liu, R. Health insurance of rural/township schoolchildren in Pinggu, Beijing: Coverage rate, determinants, disparities, and sustainability. Int. J. Equity Health 2008, 7, 23. [Google Scholar] [CrossRef] [PubMed]
- Xu, Y.; Gao, J.; Zhou, Z.; Xue, Q.; Yang, J.; Luo, H.; Chen, G. Measurement and explanation of socioeconomic inequality in catastrophic health care expenditure: Evidence from the rural areas of Shaanxi Province. Bmc Health Serv. Res. 2015, 15, 256. [Google Scholar] [CrossRef]
- Chen, M.; Chen, W.; Zhao, Y. New evidence on financing equity in China’s health care reform--a case study on Gansu province, China. BMC Health Serv. Res. 2012, 12, 466. [Google Scholar] [CrossRef]
- Chen, M.; Zhao, Y.; Si, L. Who pays for health care in China? The case of Heilongjiang province. PLoS ONE 2014, 9, e108867. [Google Scholar] [CrossRef]
- Xu, M. An analysis of determinants on health insurance demand in China-taking Shanghai’ insurance market in 2006 as an example. >World Econ. Pap. 2007, 5, 30–40. [Google Scholar]
- Zhu, M.; Wang, M. Tax Policy’s Incentive Effects on Commercial Health Insurance. Insur. Stud. 2016, 2, 47–58. [Google Scholar]
- Yao, W.; Xiao, X.; Luo, C. Awareness and Utilization of Community Health Services and the Influencing Factors among Residents in Dongguan. Chin. Gen. Pract. 2012, 15, 3230–3232. [Google Scholar]
- Li, M.; Yang, K.; Dong, Z. Study on the Needs, Demands and Utilization of Health Services: A Case Study of Sichuan Province. Reform Econ. Syst. 2016, 2, 41–46. [Google Scholar]
- Wang, X.; Wang, H. Effect of basic medical insurance system on catastrophic health expenditure: A empirical study. Chin. J. Public Health 2017, 6, 9. [Google Scholar]
- Li, X.; Qing, J.; Tang, J.; Chen, J.; Xu, D. Analysis of the Equity of Rural Family Health Financing in Xinjiang Province from 2003 to 2008. Mod. Prev. Med. 2012, 39, 875–877. [Google Scholar]
- Liu, H.; Qin, J.; Chai, P.; Xu, D.; Liu, X.; Mao, L. Evaluation of Redistributive Effect of Health Financing in Xinjiang Production and Construction Corps. Chin. J. Health Stat. 2013, 30, 371–376. [Google Scholar]


| SHI Schemes 2 | UEBMI | NCMS | URBMI |
|---|---|---|---|
| Year of launch | 1998 | 2003 | 2007 |
| Administration department | Human Resource and Social Security | Health | Human Resource and Social Security |
| Target population | Urban employees | Rural registrants | Urban registrants without UEBMI |
| Pooling level | Prefecture | County | Prefecture |
| Number of pools | 333 | 2852 | 333 |
| Enrolment | Compulsory | Voluntary | Voluntary |
| Number of members | 265 million | 805 million | 272 million |
| Individual contribution | 2–3% of salary | ¥30–50 | ¥30–50 |
| Employer/government contribution | 6–8% of salary | ¥200 | ¥200 |
| Inpatient reimbursement rate | 81% | < 50% | 64% |
| Outpatient reimbursement rate | Depends on MSA | 0–40% 3 | 0–40% 3 |
| Reimbursement cap | Six-times local average wage | Eight-times local peasants’ income | Six-times local disposable income |
| Ref. ID | Study period | Comparison | Results |
|---|---|---|---|
| [47] | 2007–2013 | East vs. inland | East provinces were associated with higher PHI premium income |
| [46] | 2006 | For rural residents, living in the east was associated with a higher chance of enrolment into PHI | |
| [48] | 2011 | Urban vs. rural | Living in urban areas was associated with a higher chance of enrolment into PHI |
| [41] | 2011, 2013 | Living in urban areas was associated with a higher chance of enrolment into PHI | |
| [44] | 2011 | Living in urban areas was NOT significantly associated with a higher chance of enrolment into PHI | |
| [32] | 2000, 2004, 2006 | For students, living in urban areas was associated with a higher chance of enrolment into PHI | |
| [41] | 2011, 2013 | Migrants vs. locals | Rural-to-urban migrants was associated with a higher chance of enrolment into PHI |
| Ref. ID | Study Period | PHI Indicator | SHI Indicator | SHI Schemes 2 | Sample | Correlation |
|---|---|---|---|---|---|---|
| Aggregate Level Evidence | ||||||
| [47] | 2007–2013 | Income | Percentage of enrolees | All | Mixed | Positive |
| [50] | 2002–2007 | Income | Percentage of enrolees | All | Mixed | Positive |
| [51] | 2000–2007 | Income | Fund income | UEBMI & URBMI | Mixed | Positive |
| [52] | 2002–2009 | Income | Fund income | UEBMI | Mixed | Positive |
| [53] | 2003–2012 | Income | Average compensation | UEBMI & URBMI | Mixed | Positive |
| [54] | 2005–2010 | Income | Fund income | All | Mixed | Positive |
| [55] | 2005–2011 | Compound index 3 | Compound index 4 | NCMS | Mixed | Positive |
| Individual Level Evidence | ||||||
| [32] | 2000,2004,2006 | Enrolment | Enrolment | Urban schemes | Urban | Positive |
| [46] | 2006 | Enrolment | Enrolment | NCMS | Rural | Positive |
| [42] | 1989–2009 | Enrolment | Enrolment | All | Mixed | Negative |
| [41] | Enrolment | Enrolment | All | Mixed | Negative | |
| 2011, 2013 | Urban | Negative | ||||
| Rural | Neutral | |||||
| [40] | 2004–2011 | Enrolment | Enrolment | URBMI | Urban | Neutral |
| [14] | 2011 | Enrolment | Enrolment | NCMS | Adult | Positive |
| Child | Negative | |||||
| [49] | 2004, 2006, 2009 | Enrolment | Enrolment | NCMS | Rural | Negative |
| Positive | ||||||
| Ref. ID | Study Period | PHI Indicator | Type of Healthcare Utilised | Sample | Correlation |
|---|---|---|---|---|---|
| [56] | 2004 | Enrolment | Generic healthcare | Mixed | Neutral |
| [58] | 2008 | Enrolment | Generic healthcare | Mixed | Positive 2 |
| [57] | 2008 | Enrolment | Generic healthcare | Mixed/urban/rural | Positive/Neutral 3 |
| [60] | 2000, 2004 | Enrolment | Inpatient care | Mixed | Positive 4 |
| Preventative care | Positive | ||||
| [59] | 2007, 2008 | Enrolment | Inpatient care | Urban | Positive |
| Outpatient care | Neutral | ||||
| [61] | Enrolment | Inpatient care | Rural-to-urban migrants | Neutral | |
| 2007–2010 | Outpatient care | Neutral | |||
| Preventative care | Positive | ||||
| [66] | 2004, 2006, 2009 | Enrolment | Outpatient care | Rural | Negative |
| Preventative care | Positive | ||||
| [64] | 2011, 2013 | Enrolment | Outpatient care | Mixed | Positive/Neutral 5 |
| [62] | 2006–2010 | Provincial PHI premium income over GDP | Inpatient care (the average length of hospitalisation) | Mixed | Neutral |
| [63] | 2003 | Percentage of PHI enrolees in a county | Inpatient care (the number of admissions per 1000 in 52 weeks) | Rural | Neutral |
| Outpatient care (the number of visits per 1000 in 2 weeks) | Positive |
| Ref. ID | Study Period | PHI Indicator | Financial Risk Indicator | Sample | Correlation |
|---|---|---|---|---|---|
| [56] | 2004 | Enrolment | Out-of-pocket payments | Mixed | Neutral |
| [67] | 2011–2012 | Enrolment | Out-of-pocket payments | Mixed | Neutral/Negative 2 |
| [60] | 2000, 2004 | Enrolment | Out-of-pocket payments (as a share of total health expenditure) | Mixed | Positive/Neutral 3 |
| [44] | 2011 | Enrolment | Out-of-pocket payments exceeding ¥1000 and ¥5000 | Urban | Positive for both |
| Total health expenditure exceeding ¥1000 | Positive | ||||
| [69] | 2003, 2005 | Enrolment | Total health expenditure | Urban | Positive 4 |
| [57] | 2008 | Enrolment | Total health expenditure | Mixed/urban/rural | Positive/Neutral 5 |
| [42] | 1989–2009 | Enrolment | Total health expenditure | Mixed | Positive |
| [63] | 2003 | Percentage of PHI enrolees in a county | Per-capita health expenditure | Rural | Neutral |
| [70] | 2006–2012 | Provincial per-capita PHI premium income | Per-capita health expenditure | Mixed | Negative |
© 2020 by the authors. Licensee MDPI, Basel, Switzerland. This article is an open access article distributed under the terms and conditions of the Creative Commons Attribution (CC BY) license (http://creativecommons.org/licenses/by/4.0/).
Share and Cite
Wu, R.; Li, N.; Ercia, A. The Effects of Private Health Insurance on Universal Health Coverage Objectives in China: A Systematic Literature Review. Int. J. Environ. Res. Public Health 2020, 17, 2049. https://doi.org/10.3390/ijerph17062049
Wu R, Li N, Ercia A. The Effects of Private Health Insurance on Universal Health Coverage Objectives in China: A Systematic Literature Review. International Journal of Environmental Research and Public Health. 2020; 17(6):2049. https://doi.org/10.3390/ijerph17062049
Chicago/Turabian StyleWu, Runguo, Niying Li, and Angelo Ercia. 2020. "The Effects of Private Health Insurance on Universal Health Coverage Objectives in China: A Systematic Literature Review" International Journal of Environmental Research and Public Health 17, no. 6: 2049. https://doi.org/10.3390/ijerph17062049
APA StyleWu, R., Li, N., & Ercia, A. (2020). The Effects of Private Health Insurance on Universal Health Coverage Objectives in China: A Systematic Literature Review. International Journal of Environmental Research and Public Health, 17(6), 2049. https://doi.org/10.3390/ijerph17062049