Stroke Prediction with Machine Learning Methods among Older Chinese


Abstract
1. Introduction
2. Methods
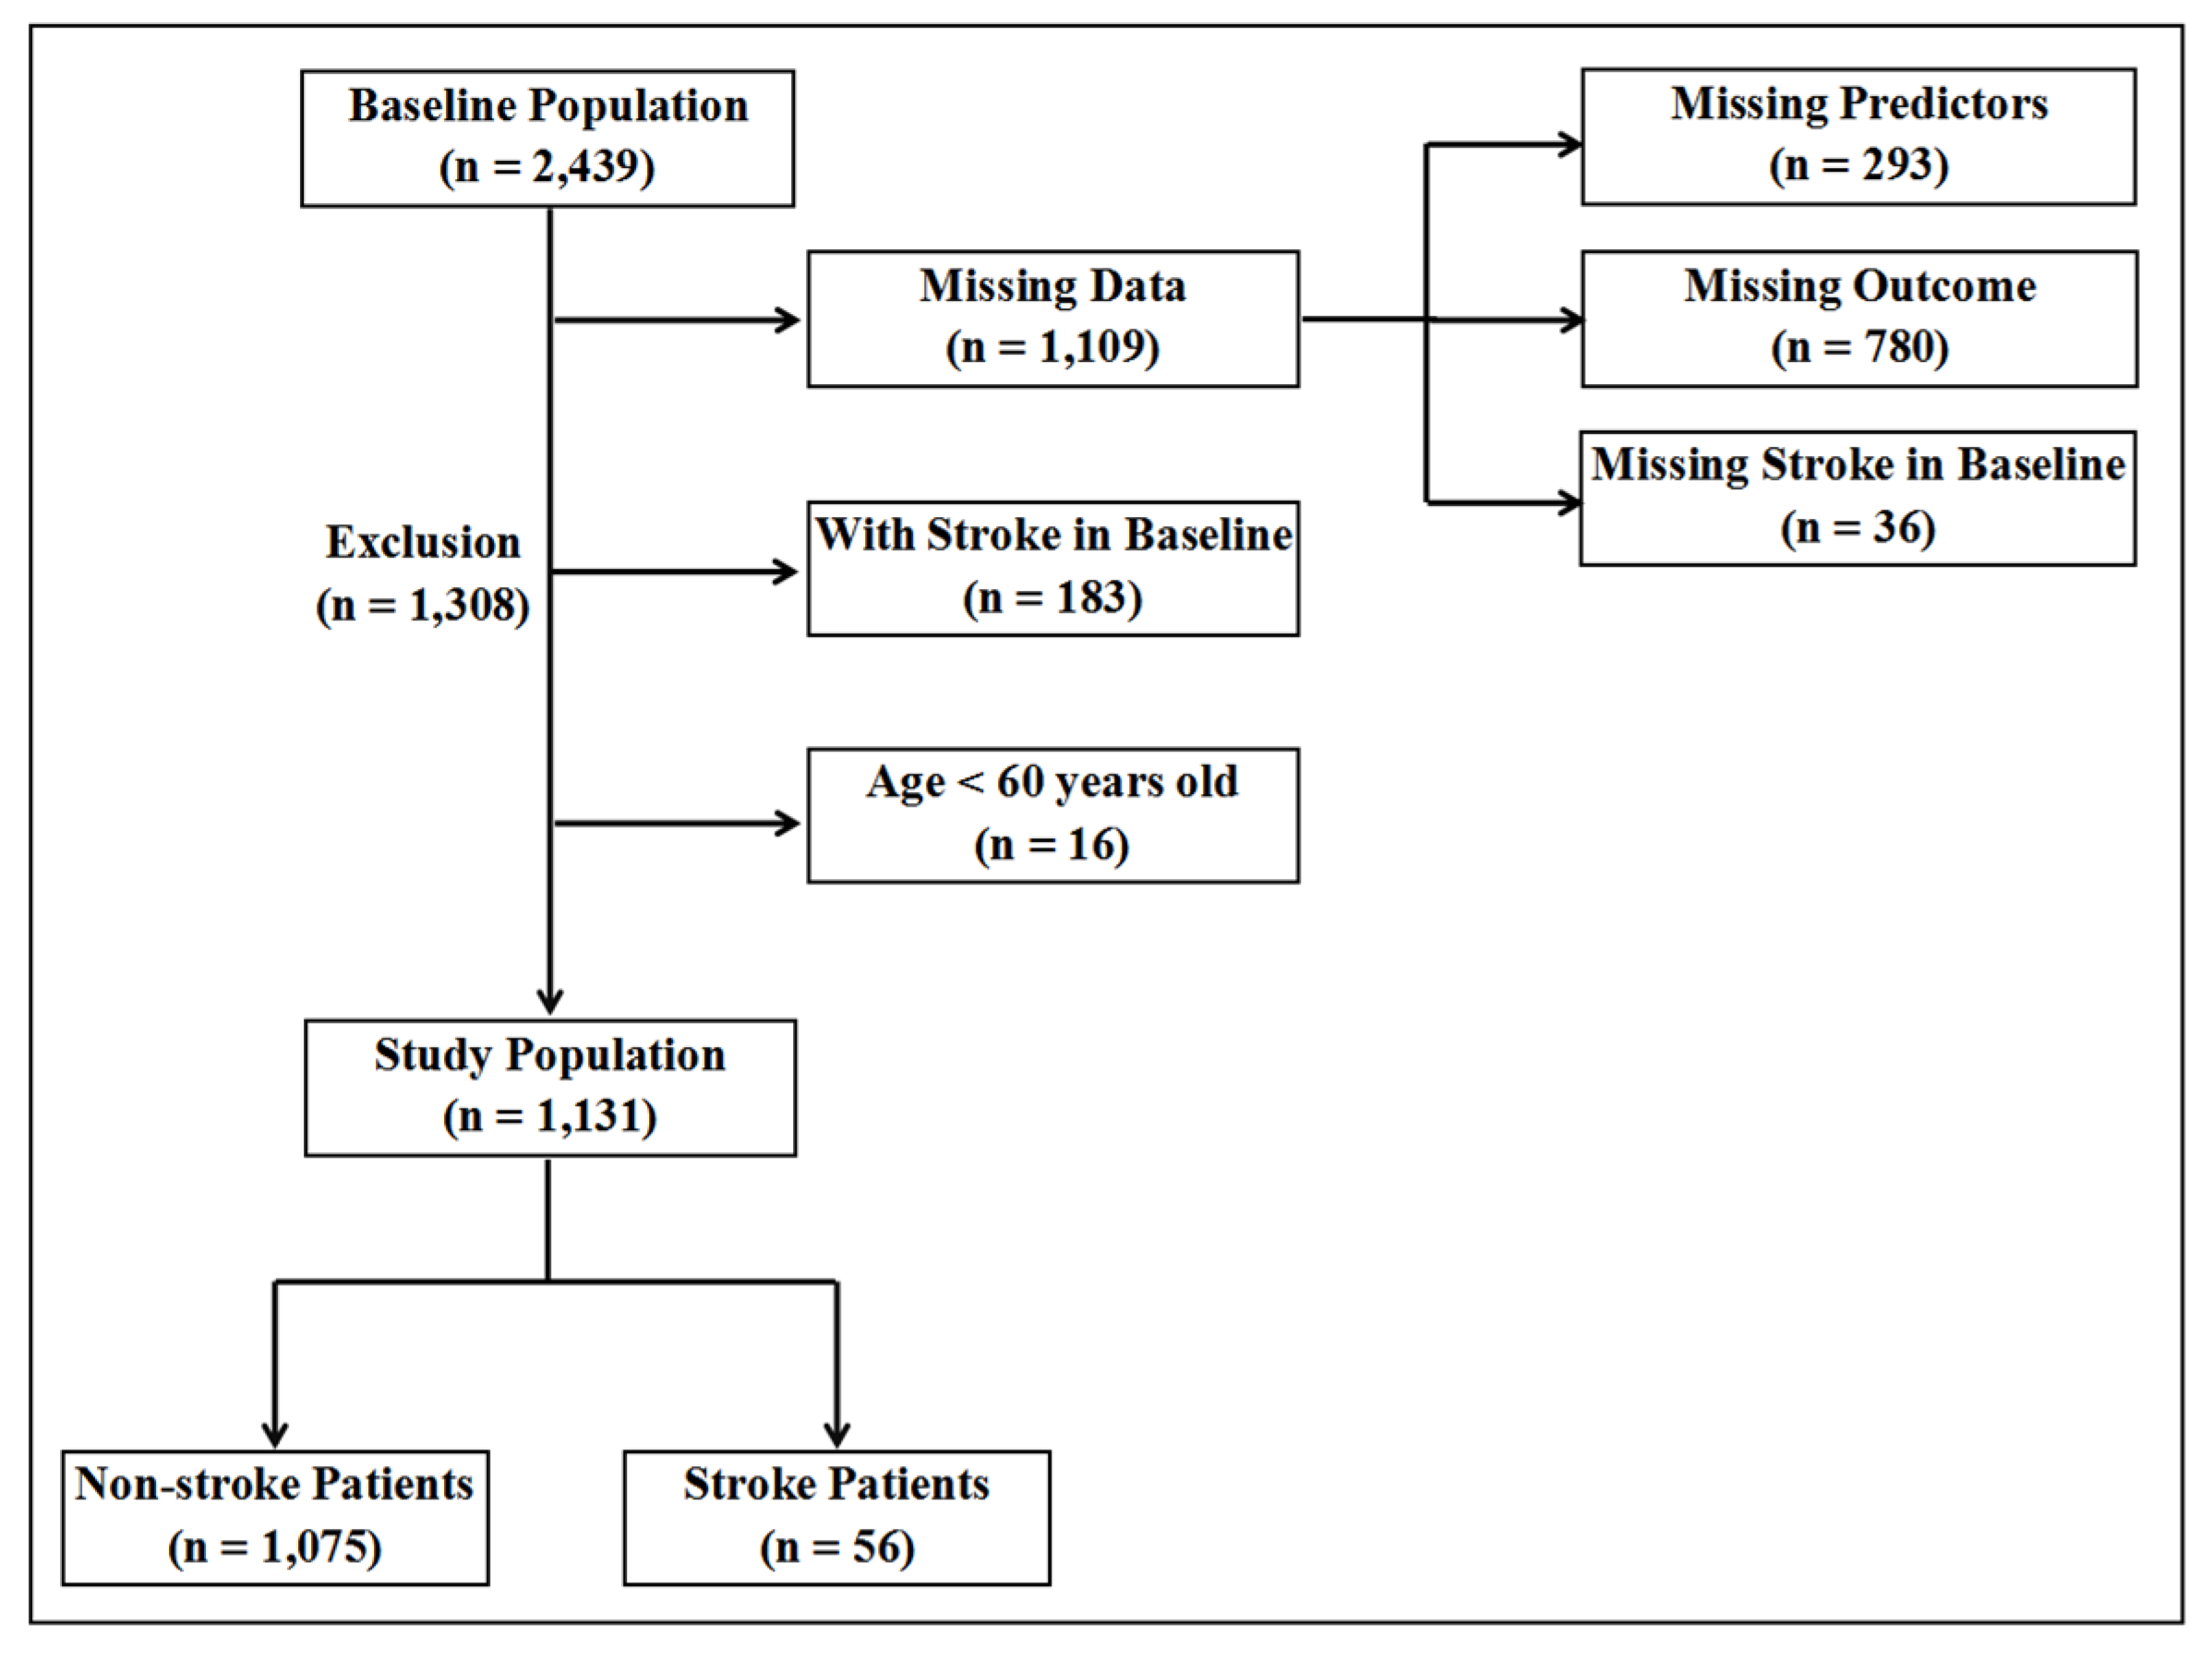
2.1. Data Source
2.2. Predictors and Data Preprocessing
2.3. Outcome Definition
2.4. Model Derivation and Validation
2.5. Statistical Analysis
3. Results
3.1. Baseline Characteristics
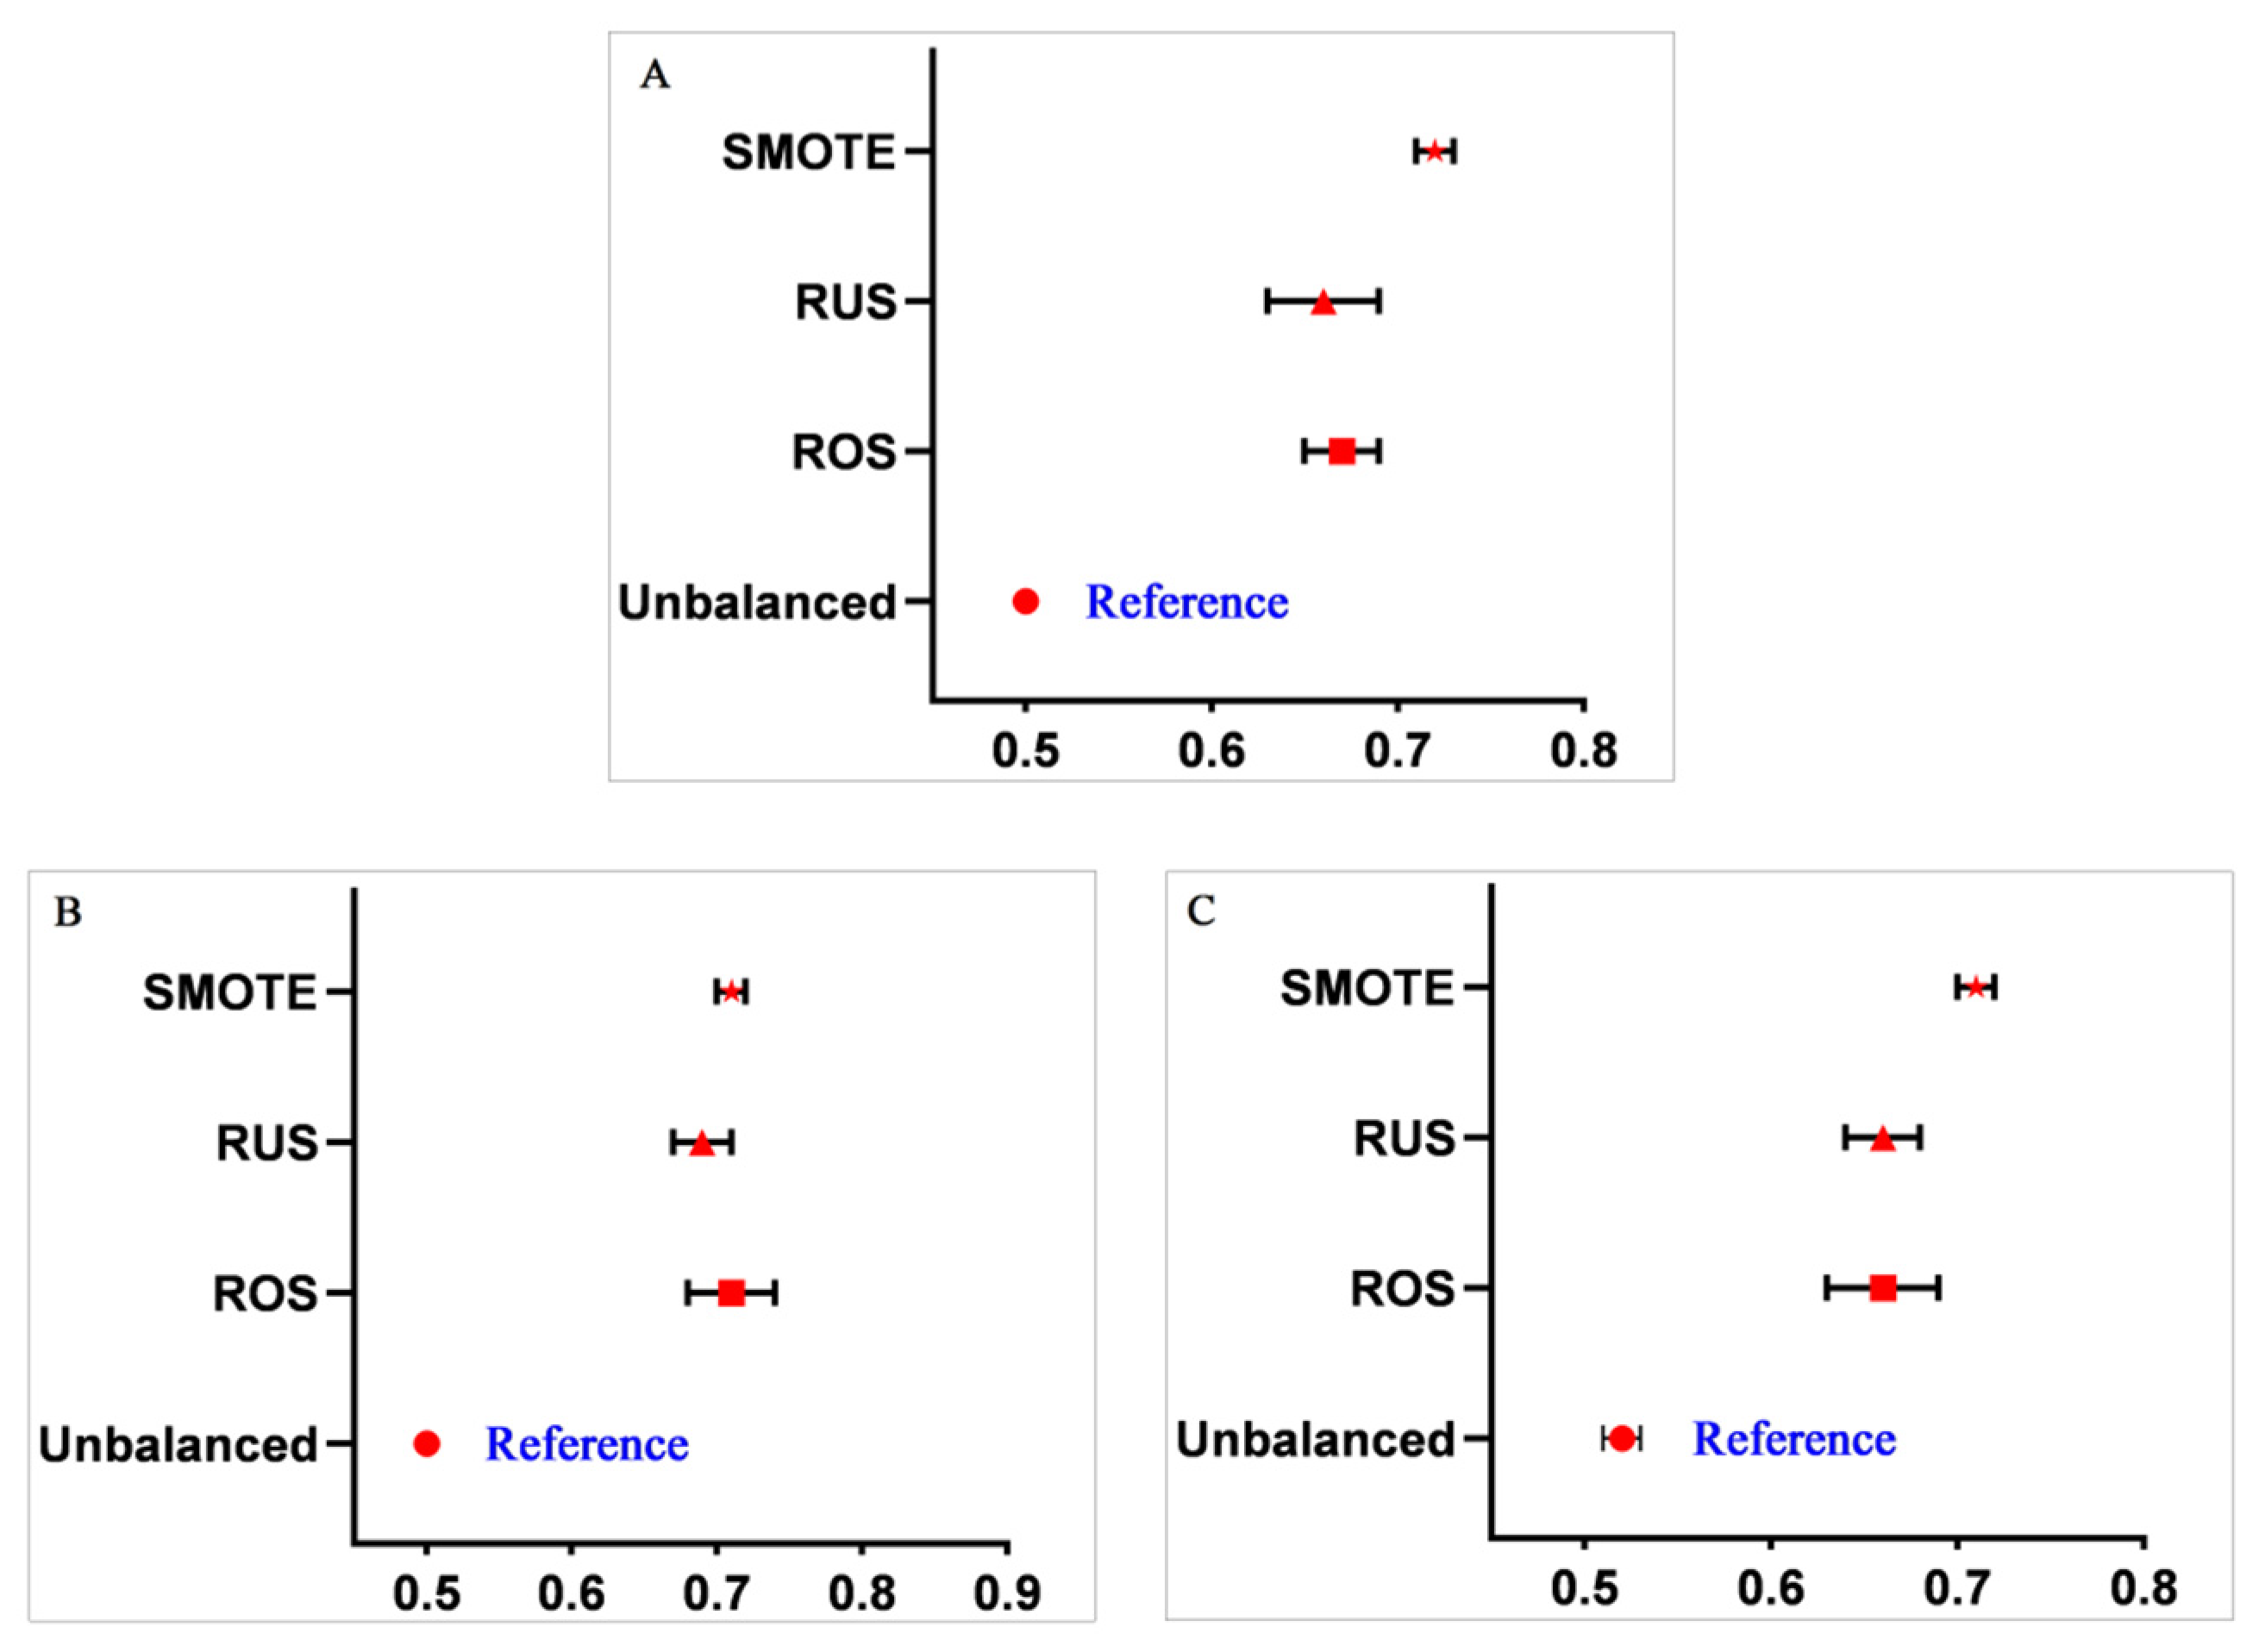
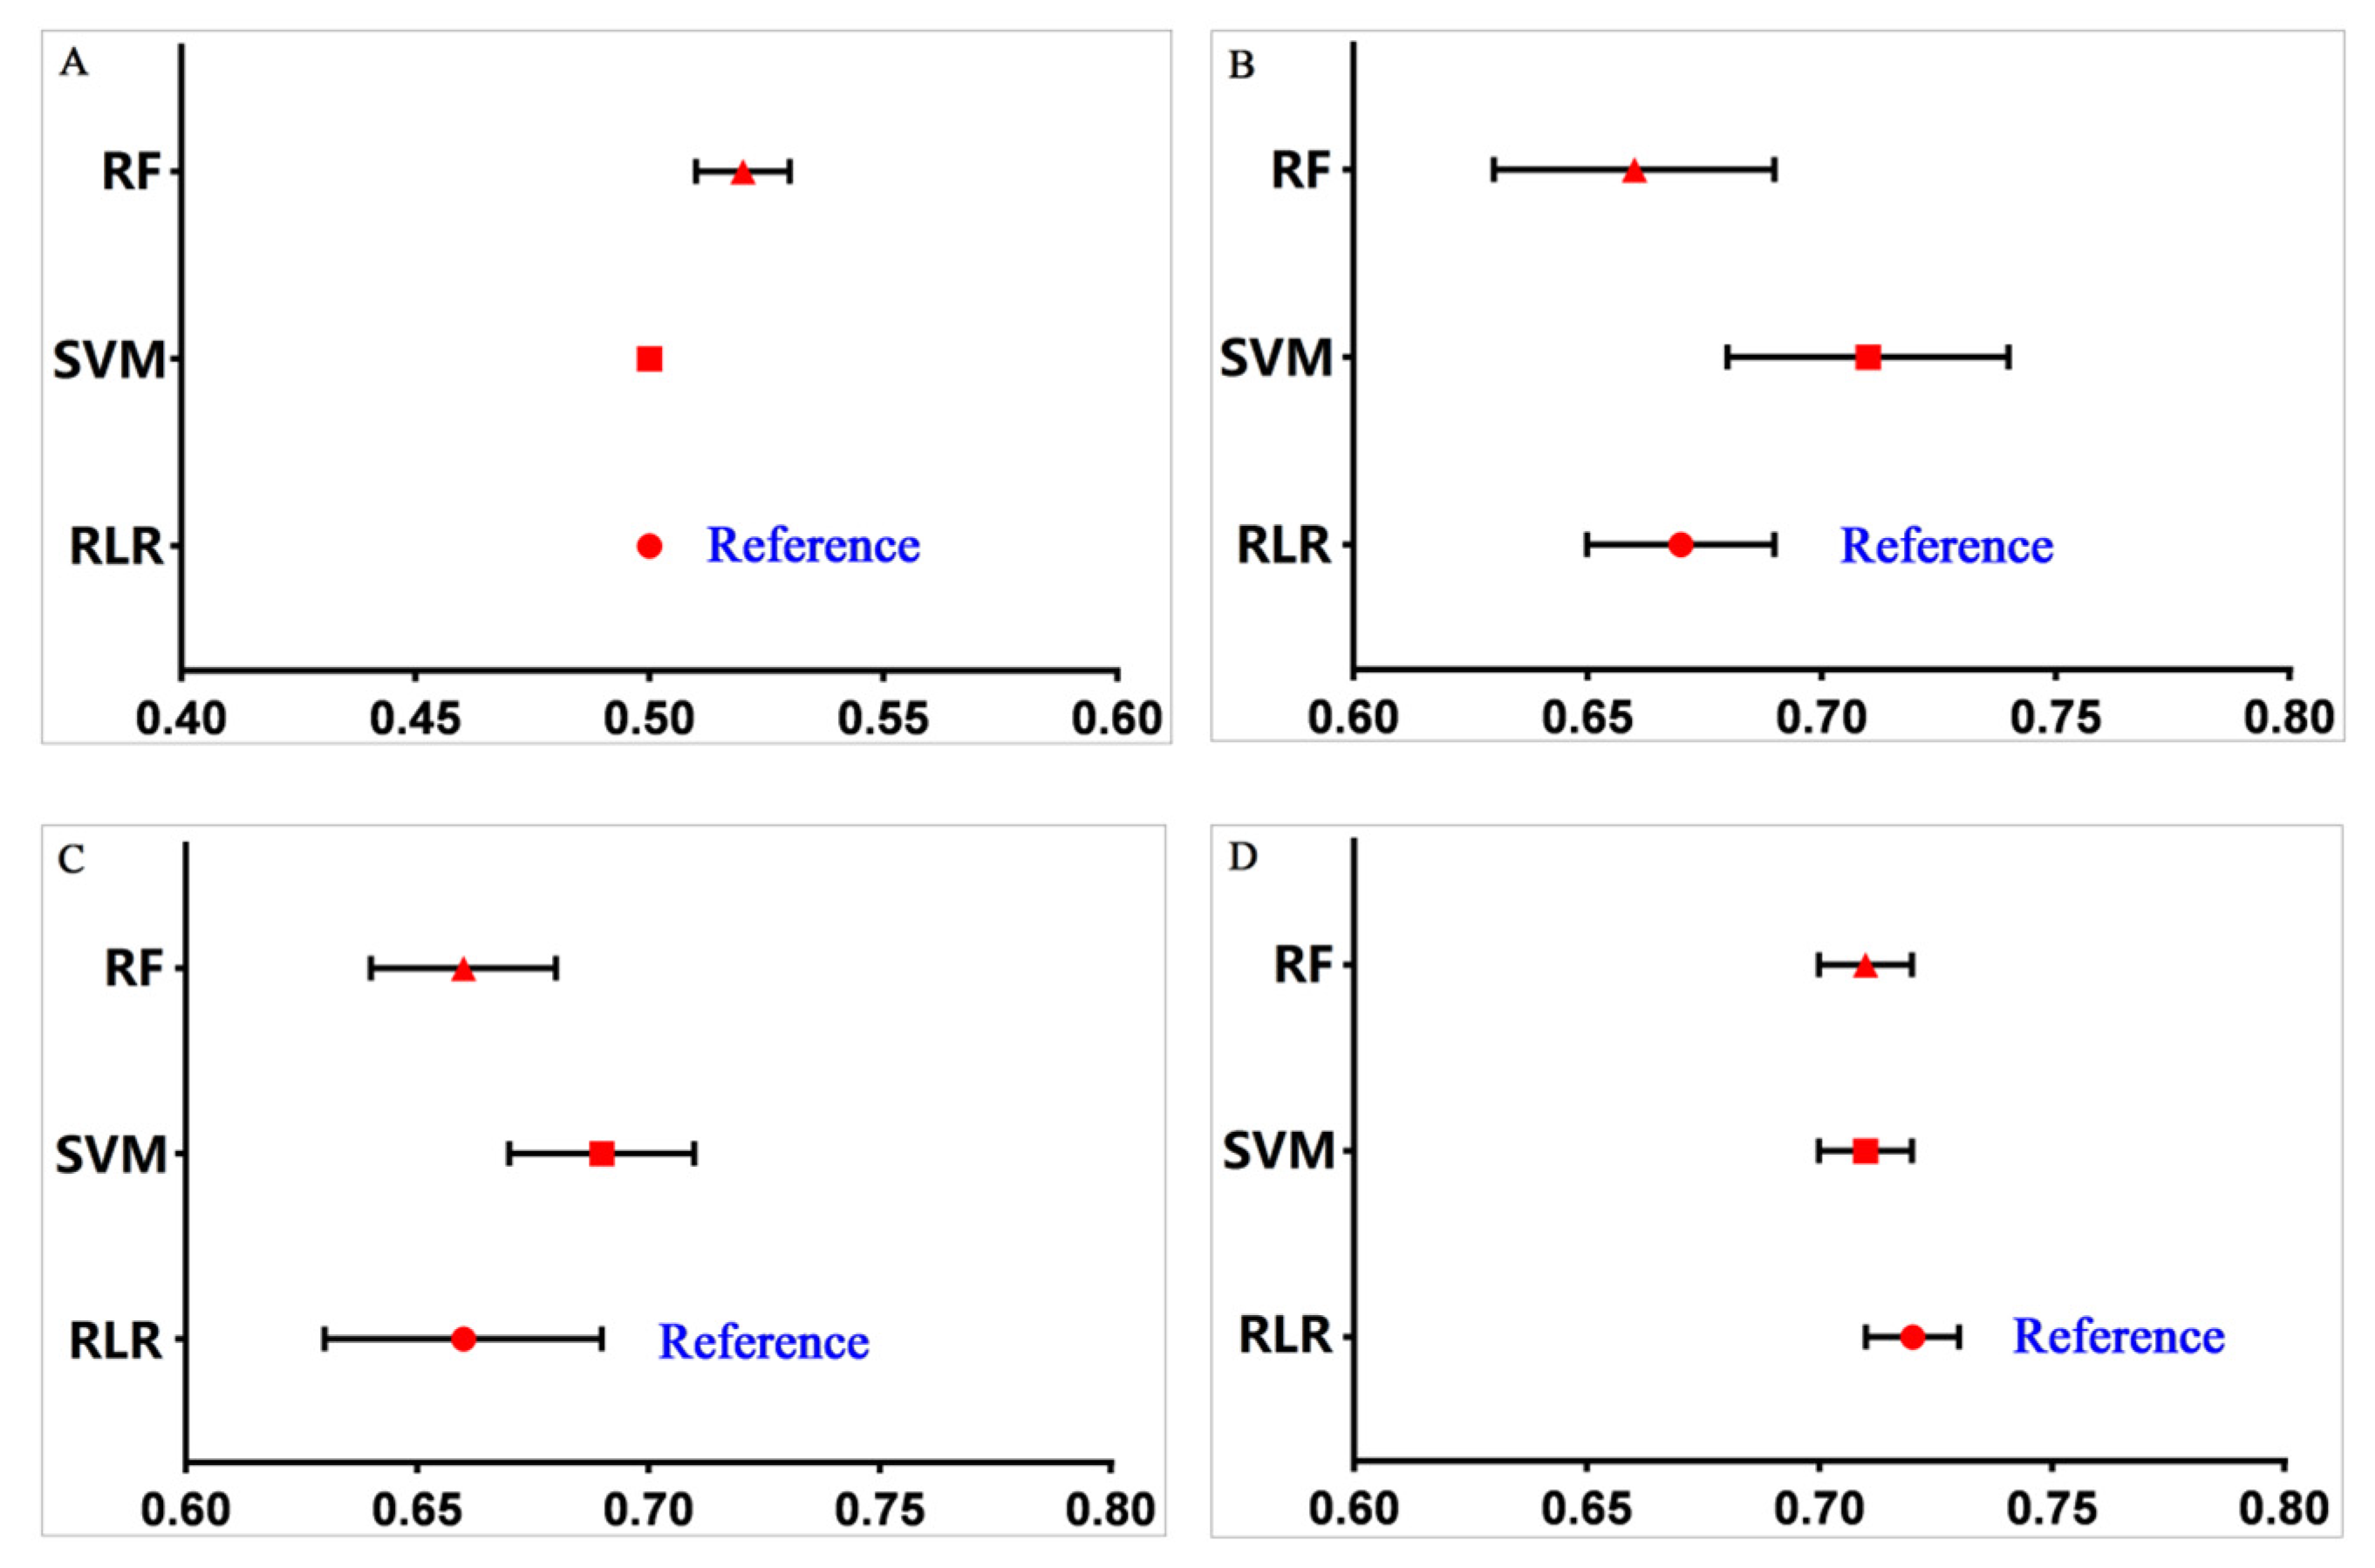
3.2. Performance of Machine Learning Methods for Analyzing Imbalanced Data
3.3. Performance Comparison between Different Data Balancing Methods
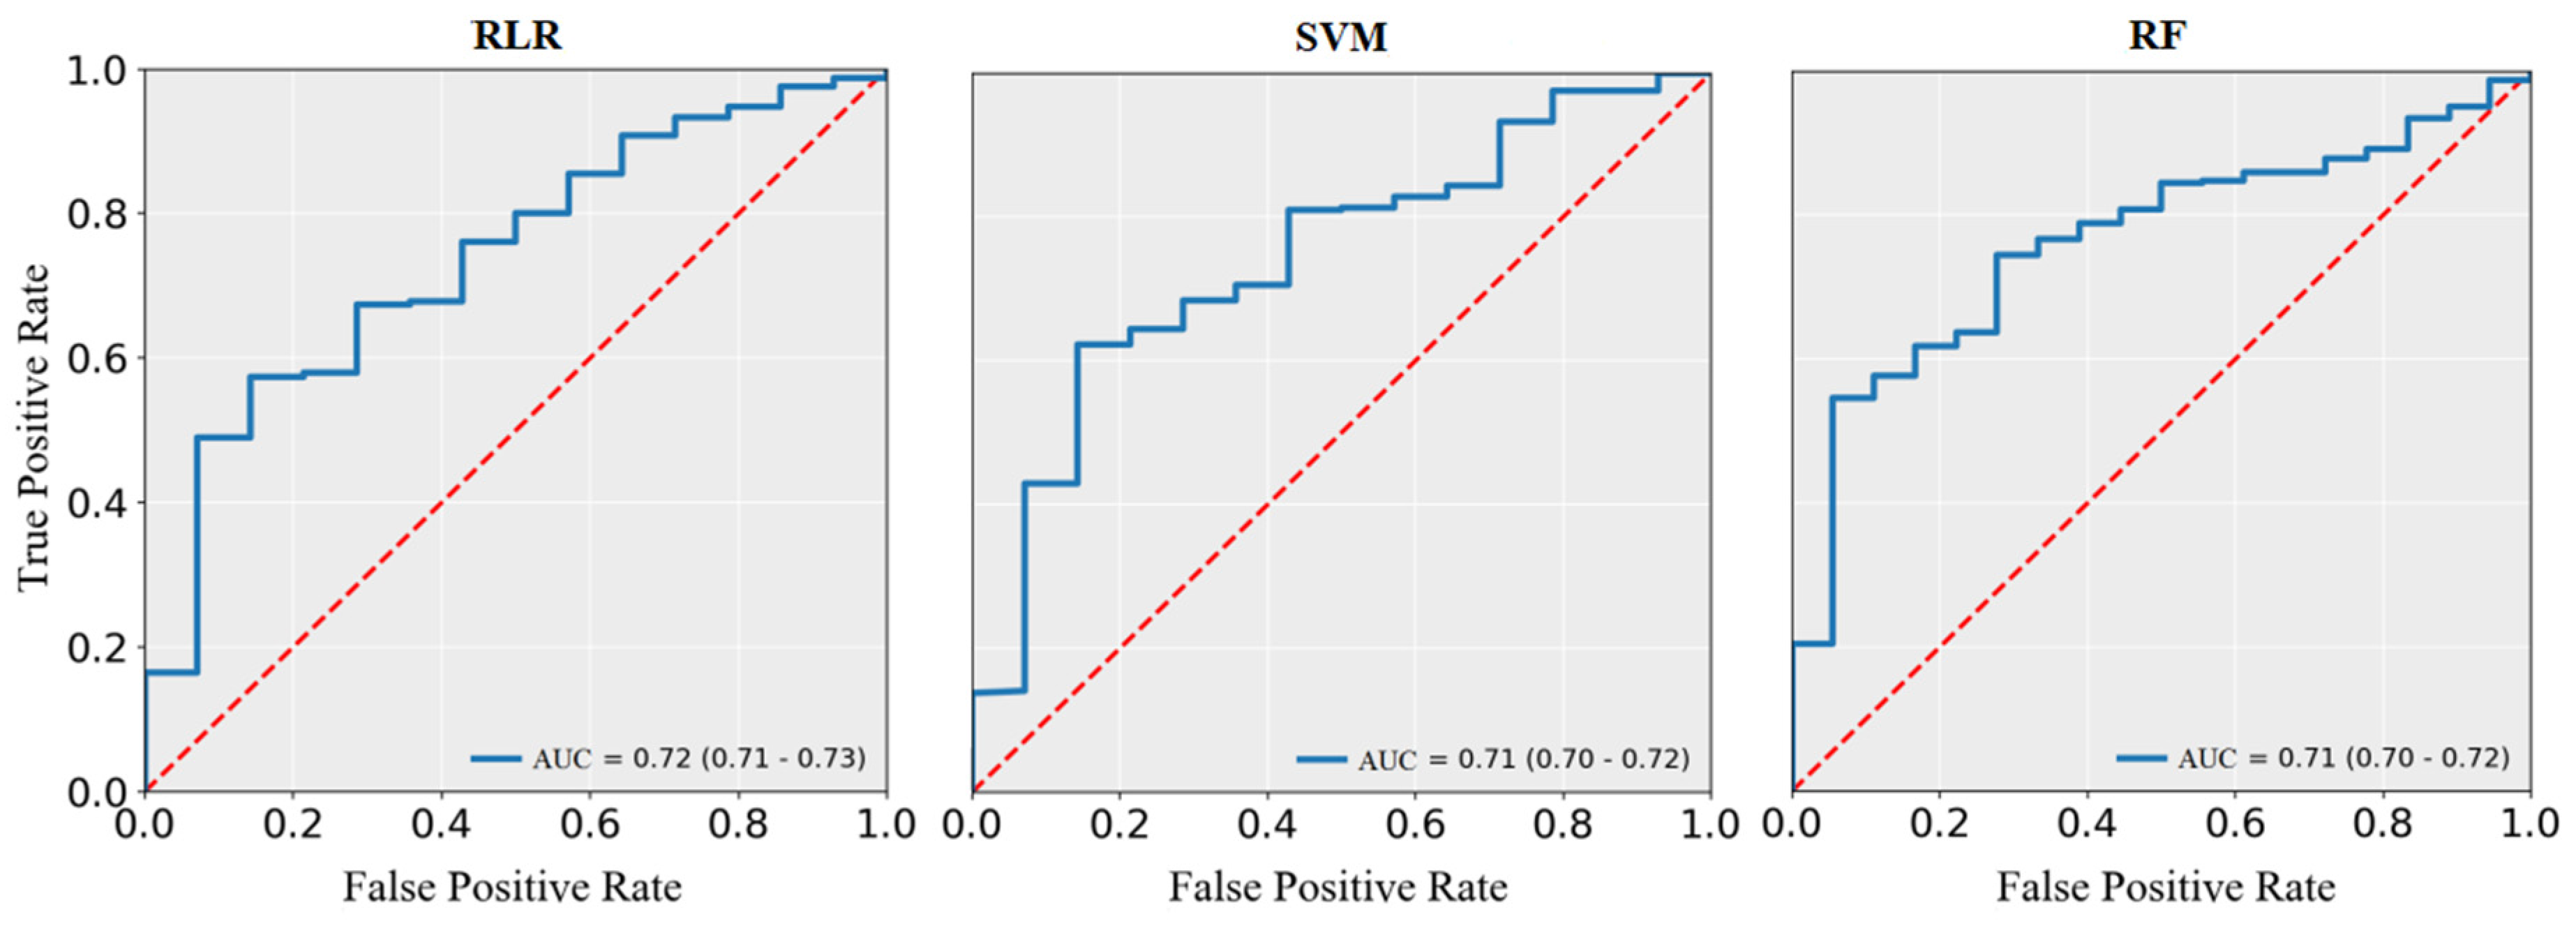
3.4. Performance Comparison between Different Machine Learning Models
3.5. Selection of Important Predictors for the Stroke Prediction Model
4. Discussion
5. Conclusions
Supplementary Materials
Author Contributions
Funding
Acknowledgments
Conflicts of Interest
References
- Naghavi, M.; Abajobir, A.A.; Abbafati, C.; Abbas, K.M.; Abd-Allah, F.; Abera, S.F. Global, regional, and national age-sex specific mortality for 264 causes of death, 1980–2016: A systematic analysis for the Global Burden of Disease Study 2016. Lancet 2017, 390, 1151–1210. [Google Scholar] [CrossRef]
- Hay, S.I.; Abajobir, A.A.; Abate, K.H.; Abbafati, C.; Abbas, K.M.; Abd-Allah, F. Global, regional, and national disability-adjusted life-years (DALYs) for 333 diseases and injuries and healthy life expectancy (HALE) for 195 countries and territories, 1990–2016: A systematic analysis for the Global Burden of Disease Study 2016. Lancet 2017, 390, 1260–1344. [Google Scholar] [CrossRef]
- Vos, T.; Abajobir, A.A.; Abate, K.H.; Abbafati, C.; Abbas, K.M.; Abd-Allah, F. Global, regional, and national incidence, prevalence, and years lived with disability for 328 diseases and injuries for 195 countries, 1990–2016: A systematic analysis for the Global Burden of Disease Study 2016. Lancet 2017, 390, 1211–1259. [Google Scholar] [CrossRef]
- Wang, W.; Jiang, B.; Sun, H.; Ru, X.; Sun, D.; Wang, L. Prevalence, Incidence, and Mortality of Stroke in China. Circulation 2017, 135, 759–771. [Google Scholar] [CrossRef] [PubMed]
- Zhou, M.; Wang, H.; Zeng, X.; Yin, P.; Zhu, J.; Chen, W. Mortality, morbidity, and risk factors in China and its provinces, 1990–2017: A systematic analysis for the Global Burden of Disease Study 2017. Lancet 2019, 394, 1145–1158. [Google Scholar] [CrossRef]
- Xing, X.; Yang, X.; Liu, F.; Li, J.; Chen, J.; Liu, X. Predicting 10-Year and Lifetime Stroke Risk in Chinese Population. Stroke 2019, 50, 2371–2378. [Google Scholar] [CrossRef]
- Feigin, V.L.; Nguyen, G.; Cercy, K.; Johnson, C.O.; Alam, T.; Parmar, P.G. Global, Regional, and Country-Specific Lifetime Risks of Stroke, 1990 and 2016. N. Engl. J. Med. 2018, 379, 2429–2437. [Google Scholar] [CrossRef]
- Wang, Y.; Liu, J.; Wang, W.; Wang, M.; Qi, Y.; Xie, W. Lifetime risk of stroke in young-aged and middle-aged Chinese population: The Chinese Multi-Provincial Cohort Study. J. Hypertens. 2016, 34, 2434–2440. [Google Scholar] [CrossRef]
- Abedi, V.; Goyal, N.; Tsivgoulis, G.; Hosseinichimeh, N.; Hontecillas, R.; Bassaganya-Riera, J. Novel Screening Tool for Stroke Using Artificial Neural Network. Stroke 2017, 48, 1678–1681. [Google Scholar] [CrossRef]
- Doupe, P.; Faghmous, J.; Basu, S. Machine Learning for Health Services Researchers. Value Health 2019, 22, 808–815. [Google Scholar] [CrossRef]
- Wiemken, T.L.; Kelley, R.R. Machine Learning in Epidemiology and Health Outcomes Research. Annu. Rev. Public Health 2019, 41, 1–16. [Google Scholar] [CrossRef]
- Colombet, I.; Jaulent, M.C.; Degoulet, P.; G, C. Logistic regression model an assessment of variability of predictions. Stud. Health Technol. Inform. 2001, 84, 1314–1318. [Google Scholar]
- Cortes, C.; Vapnik, V. Support vector network. Mach. Learn. 1995, 20, 273–297. [Google Scholar] [CrossRef]
- Yu, W.; Liu, T.; Valdez, R.; Gwinn, M.; Khoury, M.J. Application of support vector machine modeling for prediction of common diseases: The case of diabetes and pre-diabetes. BMC Med. Inform. Decis. Mak. 2010, 10, 16. [Google Scholar] [CrossRef]
- Breiman, L. Random Forests. Mach. Learn. 2001, 45, 5–32. [Google Scholar] [CrossRef]
- Luo, Y.; Li, Z.; Guo, H.; Cao, H.; Song, C.; Guo, X.; Zhang, Y. Predicting congenital heart defects: A comparison of three data mining methods. PLoS ONE 2017, 12, e177811. [Google Scholar] [CrossRef] [PubMed]
- He, H.; Garcia, E.A. Learning from Imbalanced Data. IEEE Trans. Knowl. Data Eng. 2009, 21, 1263–1284. [Google Scholar] [CrossRef]
- Chawla, N.V.; Bowyer, K.W.; Hall, L.O.; Kegelmeyer, W.P. SMOTE: Synthetic Minority Over-sampling Technique. J. Artif. Intell. Res. 2002, 16, 321–357. [Google Scholar] [CrossRef]
- Blagus, R.; Lusa, L. Joint use of over- and under-sampling techniques and cross-validation for the development and assessment of prediction models. BMC Bioinform. 2015, 16, 363–372. [Google Scholar] [CrossRef]
- Hu, S.; Liang, Y.; Ma, L.; He, Y. MSMOTE: Improving Classification Performance when Training Data is imbalanced. In Proceedings of the 2009 Second International Workshop on Computer Science and Engineering, Qingdao, China, 28–30 October 2009. [Google Scholar]
- Zhang, J.; Chen, L. Clustering-based undersampling with random over sampling examples and support vector machine for imbalanced classification of breast cancer diagnosis. Comput. Assist. Surg. 2019, 24, 1–12. [Google Scholar] [CrossRef]
- Zeng, M.; Zou, B.; Wei, F.; Liu, X.; Wang, L. Effective prediction of three common diseases by combining SMOTE with Tomek links technique for imbalanced medical data. In Proceedings of the 2016 IEEE International Conference of Online Analysis and Computing Science (ICOACS), Chongqing, China, 28–29 May 2016. [Google Scholar]
- Barlow, H.; Mao, S.; Khushi, M. Predicting High-Risk Prostate Cancer Using Machine Learning Methods. Data 2019, 4, 129. [Google Scholar] [CrossRef]
- Kohavi, R. A Study of Cross-Validation and Bootstrap for Accuracy Estimation and Model Selection. In Proceedings of the International Joint Conference on Artificial Intelligence, Montreal, QC, Canada, 20–25 August 1995. [Google Scholar]
- Jia, Q.; Liu, L.; Wang, Y. Stroke in China. Clin. Exp. Pharmacol. Physiol. 2010, 37, 259–264. [Google Scholar] [CrossRef]
- Kearns, M.; Mansour, Y.; Ng, A.Y.; Ron, D. An Experimental and Theoretical Comparison of Model SeIection Methods. Conf. Learn. Theory 1995, 27, 21–30. [Google Scholar]
- Li, W.; Liu, H.; Yang, P.; Xie, W. Supporting Regularized Logistic Regression Privately and Efficiently. PLoS ONE 2016, 11, e0156479. [Google Scholar] [CrossRef]
- Hametner, C.; Kellert, L.; Ringleb, P.A. Impact of sex in stroke thrombolysis: A coarsened exact matching study. BMC Neurol. 2015, 15, 10. [Google Scholar] [CrossRef] [PubMed]
- Alter, M.; Friday, G.; Lai, S.M.; Oconnell, J.; Sobel, E. Hypertension and Risk of Stroke Recurrence. Stroke 1994, 25, 1605–1610. [Google Scholar] [CrossRef]
- Linfante, I.; Starosciak, A.K.; Walker, G.R.; Dabus, G.; Castonguay, A.C.; Gupta, R. Predictors of poor outcome despite recanalization: A multiple regression analysis of the NASA registry. J. Neurointerv. Surg. 2016, 8, 224–229. [Google Scholar] [CrossRef]
- Karagiannis, A.; Mikhailidis, D.P.; Tziomalos, K.; Sileli, M.; Savvatianos, S.; Kakafika, A. Serum uric acid as an independent predictor of early death after acute stroke. Circ. J. 2007, 71, 1120–1127. [Google Scholar] [CrossRef][Green Version]
- Jia, Q.; Zheng, H.; Zhao, X.; Wang, C.; Liu, G.; Wang, Y. Abnormal glucose regulation in patients with acute stroke across China: Prevalence and baseline patient characteristics. Stroke 2012, 43, 650–657. [Google Scholar] [CrossRef]
- Amarenco, P.; Goldstein, L.B.; Szarek, M.; Sillesen, H.; Rudolph, A.E.; Callahan, A. Effects of Intense Low-Density Lipoprotein Cholesterol Reduction in Patients with Stroke or Transient Ischemic Attack: The Stroke Prevention by Aggressive Reduction in Cholesterol Levels (SPARCL) Trial. Stroke 2007, 38, 3198–3204. [Google Scholar] [CrossRef]
- Dawood, F.Z.; Judd, S.; Howard, V.J.; Limdi, N.A.; Meschia, J.F.; Cushman, M. High-Sensitivity C-Reactive Protein and Risk of Stroke in Atrial Fibrillation (from the Reasons for Geographic and Racial Differences in Stroke Study). Am. J. Cardiol. 2016, 118, 1826–1830. [Google Scholar] [CrossRef] [PubMed]
- Sundell, L.; Salomaa, V.; Vartiainen, E.; Poikolainen, K.; Laatikainen, T. Increased stroke risk is related to a binge-drinking habit. Stroke 2008, 39, 3179–3184. [Google Scholar] [CrossRef] [PubMed]


| Stroke (n = 56) | Non-Stroke (n = 1075) | p-value | |
|---|---|---|---|
| Median age (IQR), y | 79.00 (71.25~86.00) | 83.00 (72.00~93.00) | 0.08 |
| Men, n (%) | 37 (6.76%) | 510 (93.24%) | 0.01 |
| Women, n (%) | 19 (3.25%) | 565 (96.75%) | |
| Median hsCRP (IQR), mg/L | 0.85 (0.52~3.27) | 0.77 (0.35~1.95) | 0.14 |
| Median GLU (IQR), mmol/L | 4.65 (4.15~5.14) | 4.46 (3.71~5.12) | 0.03 |
| Median HDLC (IQR), mmol/L | 1.10 (0.93~1.41) | 1.25 (1.05~1.51) | 0.01 |
| mean ± SD LDLC, mmol/L | 2.56 ± 0.84 | 2.61 ± 0.80 | 0.66 |
| Median TG (IQR), mmol/L | 0.83 (0.59~1.13) | 0.82 (0.60~1.17) | 0.80 |
| mean ± SD UA, umol/L | 268.98 ± 86.31 | 287.01 ± 87.52 | 0.13 |
| Smoker, n (%) | 9 (3.83%) | 226 (96.17%) | 0.37 |
| Non-smoker | 47 (5.25%) | 849 (94.75%) | |
| Drinker, n (%) | 6 (2.83%) | 206 (97.17%) | 0.11 |
| Non-drinker, n (%) | 50 (5.44%) | 869 (94.56%) | |
| Hypertension, n (%) | 21 (7.29%) | 267 (92.71%) | 0.03 |
| Non-hypertension, n (%) | 35 (4.15%) | 808 (95.85%) | |
| Diabetes, n (%) | 2 (7.69%) | 24 (92.31%) | 0.85 |
| Non-diabetes, n (%) | 54 (4.89%) | 1051 (95.11%) | |
| Heart disease, n (%) | 6 (7.69%) | 72 (92.31%) | 0.38 |
| Non-heart disease, n (%) | 50 (4.75%) | 1003 (95.25%) | |
| mean ± SD SBP, mmHg | 142 ± 20 | 141 ± 24 | 0.88 |
| Median DBP (IQR), mmHg | 80 (74~90) | 80 (71~89) | 0.50 |
| Model | Balancing Methods | Accuracy (95% CI) | Sensitivity (95% CI) | Specificity (95% CI) | AUC (95% CI) |
|---|---|---|---|---|---|
| RLR | – | 0.95 (0.95–0.95) | 0.00 (0.00–0.00) | 1.00 (1.00–1.00) | 0.50 (0.50–0.50) |
| SVM | – | 0.95 (0.94–0.96) | 0.00 (0.00–0.00) | 1.00 (1.00–1.00) | 0.50 (0.50–0.50) |
| RF | – | 0.90 (0.89–0.91) | 0.09 (0.06–0.12) | 0.94 (0.93–0.95) | 0.52 (0.51–0.53) |
| RLR | ROS | 0.61 (0.59–0.63) | 0.75 (0.71–0.79) | 0.60 (0.58–0.62) | 0.67 (0.65–0.69) |
| SVM | ROS | 0.67 (0.65–0.69) | 0.75 (0.70–0.80) | 0.67 (0.65–0.69) | 0.71 (0.68–0.74) |
| RF | ROS | 0.68 (0.66–0.70) | 0.63 (0.57–0.69) | 0.68 (0.66–0.70) | 0.66 (0.63–0.69) |
| RLR | RUS | 0.57 (0.55–0.59) | 0.76 (0.69–0.83) | 0.56 (0.54–0.58) | 0.66 (0.63–0.69) |
| SVM | RUS | 0.62 (0.59–0.65) | 0.77 (0.71–0.83) | 0.61 (0.57–0.65) | 0.69 (0.67–0.71) |
| RF | RUS | 0.56 (0.53–0.59) | 0.78 (0.73–0.83) | 0.55 (0.52–0.58) | 0.66 (0.64–0.68) |
| RLR | SMOTE | 0.70 (0.68–0.72) | 0.75 (0.72–0.78) | 0.69 (0.67–0.71) | 0.72 (0.71–0.73) |
| SVM | SMOTE | 0.72 (0.68–0.76) | 0.70 (0.66–0.74) | 0.72 (0.68–0.76) | 0.71 (0.70–0.72) |
| RF | SMOTE | 0.78 (0.77–0.79) | 0.62 (0.58–0.66) | 0.79 (0.77–0.81) | 0.71 (0.70–0.72) |
| Rank | Machine Learning Methods | ||
|---|---|---|---|
| RLR | SVM | RF | |
| 1 | Sex | UA | Sex |
| 2 | Drinking | Sex | LDLC |
| 3 | Hypertension | Hypertension | GLU |
| 4 | GLU | Age | Hypertension |
| 5 | UA | hsCRP | UA |
© 2020 by the authors. Licensee MDPI, Basel, Switzerland. This article is an open access article distributed under the terms and conditions of the Creative Commons Attribution (CC BY) license (http://creativecommons.org/licenses/by/4.0/).
Share and Cite
Wu, Y.; Fang, Y. Stroke Prediction with Machine Learning Methods among Older Chinese. Int. J. Environ. Res. Public Health 2020, 17, 1828. https://doi.org/10.3390/ijerph17061828
Wu Y, Fang Y. Stroke Prediction with Machine Learning Methods among Older Chinese. International Journal of Environmental Research and Public Health. 2020; 17(6):1828. https://doi.org/10.3390/ijerph17061828
Chicago/Turabian StyleWu, Yafei, and Ya Fang. 2020. "Stroke Prediction with Machine Learning Methods among Older Chinese" International Journal of Environmental Research and Public Health 17, no. 6: 1828. https://doi.org/10.3390/ijerph17061828
APA StyleWu, Y., & Fang, Y. (2020). Stroke Prediction with Machine Learning Methods among Older Chinese. International Journal of Environmental Research and Public Health, 17(6), 1828. https://doi.org/10.3390/ijerph17061828