Article

Performance Analysis of Boosting Classifiers in Recognizing Activities of Daily Living

1
Electrical Engineering Department, College of Engineering, Najran University, Najran 61441, Saudi Arabia
2
Department of Computer and Information Sciences, Northumbria University, Newcastle-upon-Tyne NE1 8ST, UK
3
Department of Computer Science, National University of Modern Languages, Islamabad 44000, Pakistan
4
Faculty of Medicine and Health, School of Psychology, University of Leeds, Leeds LS2 9JT, UK
*
Authors to whom correspondence should be addressed.
Int. J. Environ. Res. Public Health 2020, 17(3), 1082; https://doi.org/10.3390/ijerph17031082
Submission received: 22 January 2020 / Revised: 5 February 2020 / Accepted: 5 February 2020 / Published: 8 February 2020

Abstract

:
Physical activity is essential for physical and mental health, and its absence is highly associated with severe health conditions and disorders. Therefore, tracking activities of daily living can help promote quality of life. Wearable sensors in this regard can provide a reliable and economical means of tracking such activities, and such sensors are readily available in smartphones and watches. This study is the first of its kind to develop a wearable sensor-based physical activity classification system using a special class of supervised machine learning approaches called boosting algorithms. The study presents the performance analysis of several boosting algorithms (extreme gradient boosting—XGB, light gradient boosting machine—LGBM, gradient boosting—GB, cat boosting—CB and AdaBoost) in a fair and unbiased performance way using uniform dataset, feature set, feature selection method, performance metric and cross-validation techniques. The study utilizes the Smartphone-based dataset of thirty individuals. The results showed that the proposed method could accurately classify the activities of daily living with very high performance (above 90%). These findings suggest the strength of the proposed system in classifying activity of daily living using only the smartphone sensor’s data and can assist in reducing the physical inactivity patterns to promote a healthier lifestyle and wellbeing.

1. Introduction

World health organizations defined physical activity as any body movement that requires energy expenditure to perform any task originated through the musculoskeletal system [1]. Physical activity is quite essential for human beings to carry on their daily living routine work. Activities are the movements that the body does all day long. Picking up fruits, cleaning the house, sitting, standing, walking and lying are examples of activities of daily living (ADLs). Physical activity should not be confused with exercise since it is a sub-branch of physical activity. Exercise is a set of well-planned, structured and repetitive actions where we plan to move a specific part of the body, such as lower or upper limbs, and the movement is repeated, for example, lifting the weight ten times in a row. Similarly, brisk walking for at least 10 min is considered exercise [2]. Thus, exercise is an intentional effort to raise the heart rate, raise muscles and increase the flexibility of the body. However, both physical activity and exercise are essential in promoting a healthier lifestyle and wellbeing. Everyone needs exercise and activity each day. Therefore, incorporating ADLs and exercise in our daily routine can protect the human body from severe health conditions and diseases, such as cardiovascular disease, high risk of falling, dementia, obesity and depression [3].
Obesity is one of the leading medical issues in the modern world. The primary reason for obesity is an inactive lifestyle. Obesity has become a global epidemic, and the world health organizations are warning that one-third of the world population is now obese or overweight. Almost 10% of total medical costs in the USA are related to obesity issues [4,5]. Mainly, one in three adults or one in six children is obese in the USA. Obesity is one of the major causes of death in the USA [6,7]. It was reported in [8,9] that nearly 20,000 people die every year in Saudi Arabia due to obesity. Additionally, 36% of the Saudi population is obese, and almost 69% of Saudi people are overweight [10,11,12,13]. One of the main reasons for the significant number of obese in Saudi Arabia is its climate. The temperature remains high during day time, and people choose to drive cars rather than walking and doing physical activity. Obesity is linked with other diseases such as heart disease, diabetes, depression and dementia. Adopting a healthy lifestyle, selecting healthy food and having regular physical exercise and physical activity can reduce the risk of obesity [14].
The lack of physical activity may also cause dementia and Alzheimer’s disease [15,16]. The brain gets benefits from regular physical movement of the body. Scientists working on brain health have revealed a fantastic link between brain health and body activity. Daily activity triggers the growth of new blood vessels in the brain, allowing the brain to receive larger blood supply. It spurs the creation of new neurons in the brain’s memory centre. Studies in older adults have shown that regular aerobic exercise can improve cognitive function and slows the cognitive decline. Therefore, to maintain brain memory, peoples may consider starting and continuing a consistent healthy workout. Studies have shown that regular exercise can improve the mood and reduce the symptoms of anxiety, depression and dementia. It can even make you more resilient to stress [17,18,19].

2. Overview of Boosting Algorithms and Their Use in Physical Activity Classification Research

A recent development in the miniature sensing devices, considering their computational power, data storage capabilities, wear-ability and ease of use, made it possible to use them for activity monitoring. As a consequence, several activities tracking systems were developed using the accelerometer and gyroscope sensors to provide the acceleration and angular velocity measurements that can eventually assist in better quantification and profiling of ADLs. This section provides an overview of recent developments in the domain of physical activity classification (PAC) to classify ADLs using the boosting family of machine learning classifiers. It also provides the limitations of existing boosting-based PAC systems.

2.1. Boosting Algorithms

Supervised machine learning classifiers can be categorized into multiple types. These types include naïve Bayes, linear discriminant analysis (LDA) and quadratic discriminant analysis (QDA), generalized linear models, stochastic gradient descent, support vector machine (SVM), linear support vector classifier (Linear SVC) decision trees, neural network models, nearest neighbours and ensemble methods. The ensemble methods combine weak learners to create strong learners. The objective of these predictive models is to improve the overall accuracy rate. This can be achieved using two strategies. One of the strategies is the use of feature engineering, and the other strategy is the use of boosting algorithms. Boosting algorithms concentrate on those training observations which end up having misclassifications. There are five vastly used boosting methods, which include AdaBoost, CatBoost, LightGBM, XGBoost and gradient boosting. The basic hierarchy of supervised machine learning classifiers is shown in Figure 1.

2.1.1. Adaboost

Adaptive boosting (AdaBoost) initially assigns equal weights to each training observation. It uses multiple weak models and assigns higher weights to those observations for which misclassification was observed. As it uses multiple weak models, combining the results of the decision boundaries achieved during multiple iterations, the accuracy of the misclassified observations is improved, and hence the accuracy of the overall iterations is also improved.
The weak models are evaluated using the error rate as given in (1):
ε t = Pr i D t [ h t ( x i ) y i ] = i : h t ( x i ) y i D t ( i )
where ε t is the weighted error estimate, Pr i D t is the probability of the random example i to the distribution D t , h t are the hypotheses of the weak learner, x i is the training observation, y i is the target variable, t is the iteration number. The prediction error is one if the classification is wrong and 0 if the classification is correct.

2.1.2. Gradient Boosting

Gradient boosting (GB) [20] sequentially creates new models from an ensemble of weak models with the idea that each new model can minimize the loss function. This loss function is measured by gradient descent method. With the use of the loss function, each new model fits more accurately with the observations, and thus the overall accuracy is improved. However, boosting needs to be eventually stopped; otherwise, the model will tend to overfit. The stopping criteria can be a threshold on the accuracy of predictions or a maximum number of models created.

2.1.3. Lightgbm, Xgboost and Catboost

The structural difference between LightGBM [21] and XGBoost [22] is the way the best split is computed. For LightGBM, Gradient-based one-side sampling (GOSS) is used to identify the observations which can be used for computing the split. For XGBoost, a histogram-based algorithm filters the observations to be used for finding the split. The computation time of a histogram-based algorithm is more than the GOSS; therefore, in terms of complexity, LightGBM is generally more efficient as compared with XGBoost.
Another difference between them is the way each of the techniques handles categorical features. Boost [23] uses a one-hot encoding scheme to convert the categorical values into numerical values. It also enables users to supply the number of splits for a given categorical feature. An interesting observation about CatBoost is that it performs best when the dataset has the categorical features; otherwise, its performance is deteriorated on the absence of categorical features. A special algorithm [24] is used in LightGBM for the conversion of categorical values into numerical values. Contrary to CatBoost and LightGBM, XGBoost does not offer any conversion scheme for categorical features. All the categorical features must be converted into numerical features in the preprocessing step before the data is trained and tested for XGBoost. In general, XGBoost is slower as compared with LightGBM and CatBoost.

2.2. Use of Boosting Algorithms for PAC

The authors of [25] have used Adaboost as the base classifier for the recognition of five activities using a smartphone. The activities classified were walking, sitting, standing, cycling and running. Gyroscopes and acceleration sensors were used with the combination of smartphones for the collection of data. They have used decision stump as the subclassified in Adaboost, which is a one-layer decision tree that can classify based on a single feature of the observation. The authors conclude that they achieved 98% accuracy with this model. However, this work was limited to classifying only five activities. Similar work was performed in [26]. The authors have used decision trees and random forest in combination with Adaboost to classify five activities, namely, standing up, standing, sitting down, sitting and walking. They used decision tree and random forest classifiers as week learners and utilized a publically available human activity recognition dataset [27], which is developed by acceleration-based sensors placed on various body locations; (waist, right arm, left thigh and right ankle. The paper concluded that accuracies of 99.87% and 99.9% were achieved for decision tree and random forest, respectively. Precision and recall were the other performance evaluation metrics used. Reiss et al. [28] have compared multiple variants of Adaboost for multi-class classification in physical activity classification. Experiments were performed on eight different datasets from the repository of the University of California, Irvine (UCI) [29]. The paper included the classification of 21 different physical positions and reported an overall accuracy of 77.78%. The authors concluded that confidence-based variation of AdaBoost ConfAdaBoost.M1 outperformed the other variations of Adaboost in seven of the eight selected datasets.
Gradient boosting has also been tested in physical activity classification. In [30], the authors have experimented with gradient boosting and random forest in a dataset that contains data related to free-living conditions. The data was collected from 36 persons using smartphones. A total of 59 features were used in the dataset, while six positions were monitored, namely, standing, sitting, downstairs, upstairs, jogging and walking. The paper concluded that the overall accuracies of 99.03% and 99.22% were recorded for random forest and gradient boosting, respectively. Gradient boosting, Adaboost, random forest and decision tree were used in somewhat a related problem of identification of feet fidgeting [31]. This work has used accelerometers on shoes for the data collection of four positions of legs which are generally categorized as fidgeting. This study concluded that random forest has the highest accuracy among the other classifiers.
The authors of [32] have used wearable sensors to monitor running movements of 513 teenagers to compare the performances of SVM, decision tree, k-nearest neighbours (KNN), random forest and gradient boosted decision tree with the performance of their proposed optimized XGBoost model. Their model is based on the algorithm for the optimization of the Bayesian hyperparameter. The model classified the fitness level of each participant. The paper concluded that their proposed XGBoost model outperformed the other classifiers. In a recent contribution, Zhang et al. [33] have used barometer, gyroscope and accelerometer to record five movements of multi-floor indoor activities. The recorded movements were elevator taking, stair climbing, stillness, escalator taking and walking. The authors have compared the performance of XGBoost with the performances of random forest, KNN, SVM, multi-layer perceptron (MLP) and GBDT and claimed that XGBoost outperformed the other classifiers with an overall accuracy of 84.41% and an F-score of 84.19%. Gao et al. [34] have recently proposed a framework for human activity recognition that uses stack denoising autoencoder (SDAE) and LightGBM. The authors have used three datasets with different activity modes, which were classified into a static mode, dynamic mode and moving mode. They have compared the efficiency of their proposed framework with the efficiencies of CNN and XGBoost and claimed that their proposed framework outperformed the other classifiers with an overall accuracy of 95.99%. They also evaluated their framework with precision, recall and F-1 score. The literate survey is summarized in Table 1 to provide a better overview of recent advancements that happened in classifying ADLs by incorporating the boosting-based classifiers within the context of PAC.

2.3. Limitations In Existing Boosting-Based PAC Systems

In recent years, there has been active participation in the recognition of human activities. Interestingly, the research community has paid attention to applying the boosting techniques for the classification of physical activities. However, the performances of existing boosting classifiers based on PAC systems are incomparable with each other, and existing studies are unable to provide a better insight into which algorithms perform better than others due to the inconsistencies involved in their design process. The inconsistencies are as follows: different set of ADLs analysed (sitting, standing, running, jogging, etc.), data collected over different populations (young, elderly, healthy, unhealthy), difference in type of signals measured (acceleration signal, gyroscope signal, barometric pressure signal), different sensor locations (waist, wrist, ankle, etc.), diversities in the feature-set analysed (time, frequency, statistical descriptors, etc.), differences in cross-validation strategies for performance evaluation (10 fold, leave one subjects out, etc.) and use of different performance metrics (accuracy, f-measure, precision, recall, etc.). Although some studies in Table 1 are providing high accuracy, all these differences make their performance incomparable. For example, Guo et al. [32] used the XGboost classifier and achieved an f-measure score of 99%, while Zhang et al. [33] have achieved f-measure of only 84.14% using the same classifier. Moreover, the impact of feature selection methods on the performance of boosting classifiers is not studied systematically considering the domain of PAC, and very little is known about how these classifiers behave when the feature selection stage is incorporated before classification. To better address this issue, a benchmark analysis was carried out by Awais et al. [35], which provides the sequence of steps that can be performed to provide a balanced and unbiased performance analysis of different PAC systems using a different type of classifiers. This study also investigates the performance of recently developed Catboost classifiers for PAC. Therefore, the objectives of the present study are
  • To provide an insight into existing boosting-based PAC systems and to provide the limitations and weaknesses of these systems in providing a fair and unbiased analysis.
  • To provide a fair and unbiased performance comparison of boosting classifiers in profiling ADLs.
  • To study the impact of feature selection on the performance of boosting classifiers and to identify which classifiers perform better than others with and without feature selection approach.

3. Materials and Methods

3.1. Dataset

The dataset used in this study is a publically available dataset [36] developed using the waist-mounted smartphone. Thirty subjects participated in the data collection protocol, aged from 19 to 48 years. The activities of daily living (ADLs) performed by the subjects were sitting, standing, walking, lying, stairs up and stairs down. The sampling frequency of accelerometer and gyroscope data collected through the smartphone was 50 Hz. More details of the dataset are presented in Table 2. Each column in Table 2 (except the percentage column) refers to the total number of window instances, and each window instance contains 2.56 s of data recording. For example, walking activity contains 1722 window instances in the total dataset, and each window corresponds to 2.56 s.

3.2. Feature Set

The feature set used to develop the PAC system is the same as reported in [36]. The acceleration signals were decomposed into gravitational and body acceleration components using the Butterworth filter of 3rd order. The angular speed and angular acceleration signals also resulted in five signals obtained through accelerometer and gyroscope. The magnitude signals of these five signals were then derived, resulting in a total of ten signals. The frequency components of these signals were also computed to better recognize the ADLs by exploring both the time and the frequency domain features.
Several features were extracted from these time and frequency signals across a window of 2.56 s, resulting in 128 samples per window with an overlap of 50%. The features from the aforementioned derived signals were mean, standard deviation, median, maximum, minimum, signal magnitude area, signal energy, interquartile range, entropy, autoregression coefficients, correlation coefficients, skewness, kurtosis, maximum frequency component and the angle between two vectors [36]. A total of 561 features were extracted from the window of 2.56 s.

3.3. Feature Selection

We incorporated feature selection before the classification stage to get rid of correlated features, as these have significant implications on the system performance and the computational complexity of the system considering the real-time applications. Correlation-based features (CFS) were used in this study to get rid of the redundant features. It is a statistical approach and provides a correlation score, which can then infer how much linear dependency exists between two features. The higher the correlation score between two features, the more linearly dependent the feature are with each other. Similarly, the lower the correlation score is, the less dependent the features are with each other. Therefore, low correlation features are eventually retained in the feature set, and highly correlated features are dropped from the feature set to reduce the redundancy and dependency among the features. In this paper, the correlation score of 0.8 was used as a threshold, and features above this threshold were eliminated from the feature set.

3.4. Classification and Cross-Validation

A total of five boosting-based machine learning classifiers were used in this study to observe their performances in classifying the ADLs. The classifiers are extreme gradient boosting (XGB), light gradient boosting machine (LGBM), gradient boosting (GB), cat boosting (CB) and AdaBoost. Two variants of AdaBoost were used, one using decision trees (ADA-DT) as a week learner and the other using random forest (ADA-RF) as a week learner. The classifiers’ settings were maximum depth = 50, minimum child weight = 1, number of estimators = 100, learning rate = 0.16 for XGB; maximum depth = 50, learning rate = 0.1, number of estimators = 100 for LGBM; learning rate = 0.15, depth = 10, loss function = multi class for CB; maximum depth = 10, number of estimators = 100 for ADA-DT; and maximum depth = 100, number of estimators = 100 for ADA-RF.
The dataset was divided into two datasets (70%/30%, training/testing) to avoid any bias in training and testing. Of the data, 70% was used to train the ML model, and the remaining 30% was used for testing the performance of the proposed activity classification system.
The expressions to calculate precision and recall are provided in Equations (2) and (3). Precision provides a measure of how accurate your model is in predicting the actual positives out of the total positives predicted by your system. Recall provides the number of actual positives captured by our model by classifying these as true positive.
F-measure can provide a balance between precision and recall, and it is preferred over accuracy where data is unbalanced. Therefore, F-measure was utilized in this study as a performance metric to provide a balanced and fair measure using the formula in (4).
P r e c i s i o n = T P T P + F P × 100
R e c a l l = T P T P + F N × 100
F m e a s u r e = 2 P r e c i s i o n R e c a l l P r e c i s i o n + R e c a l l × 100
where TP—True Positive, FP—False Positive, FN—False Negative.

4. Result and Discussion

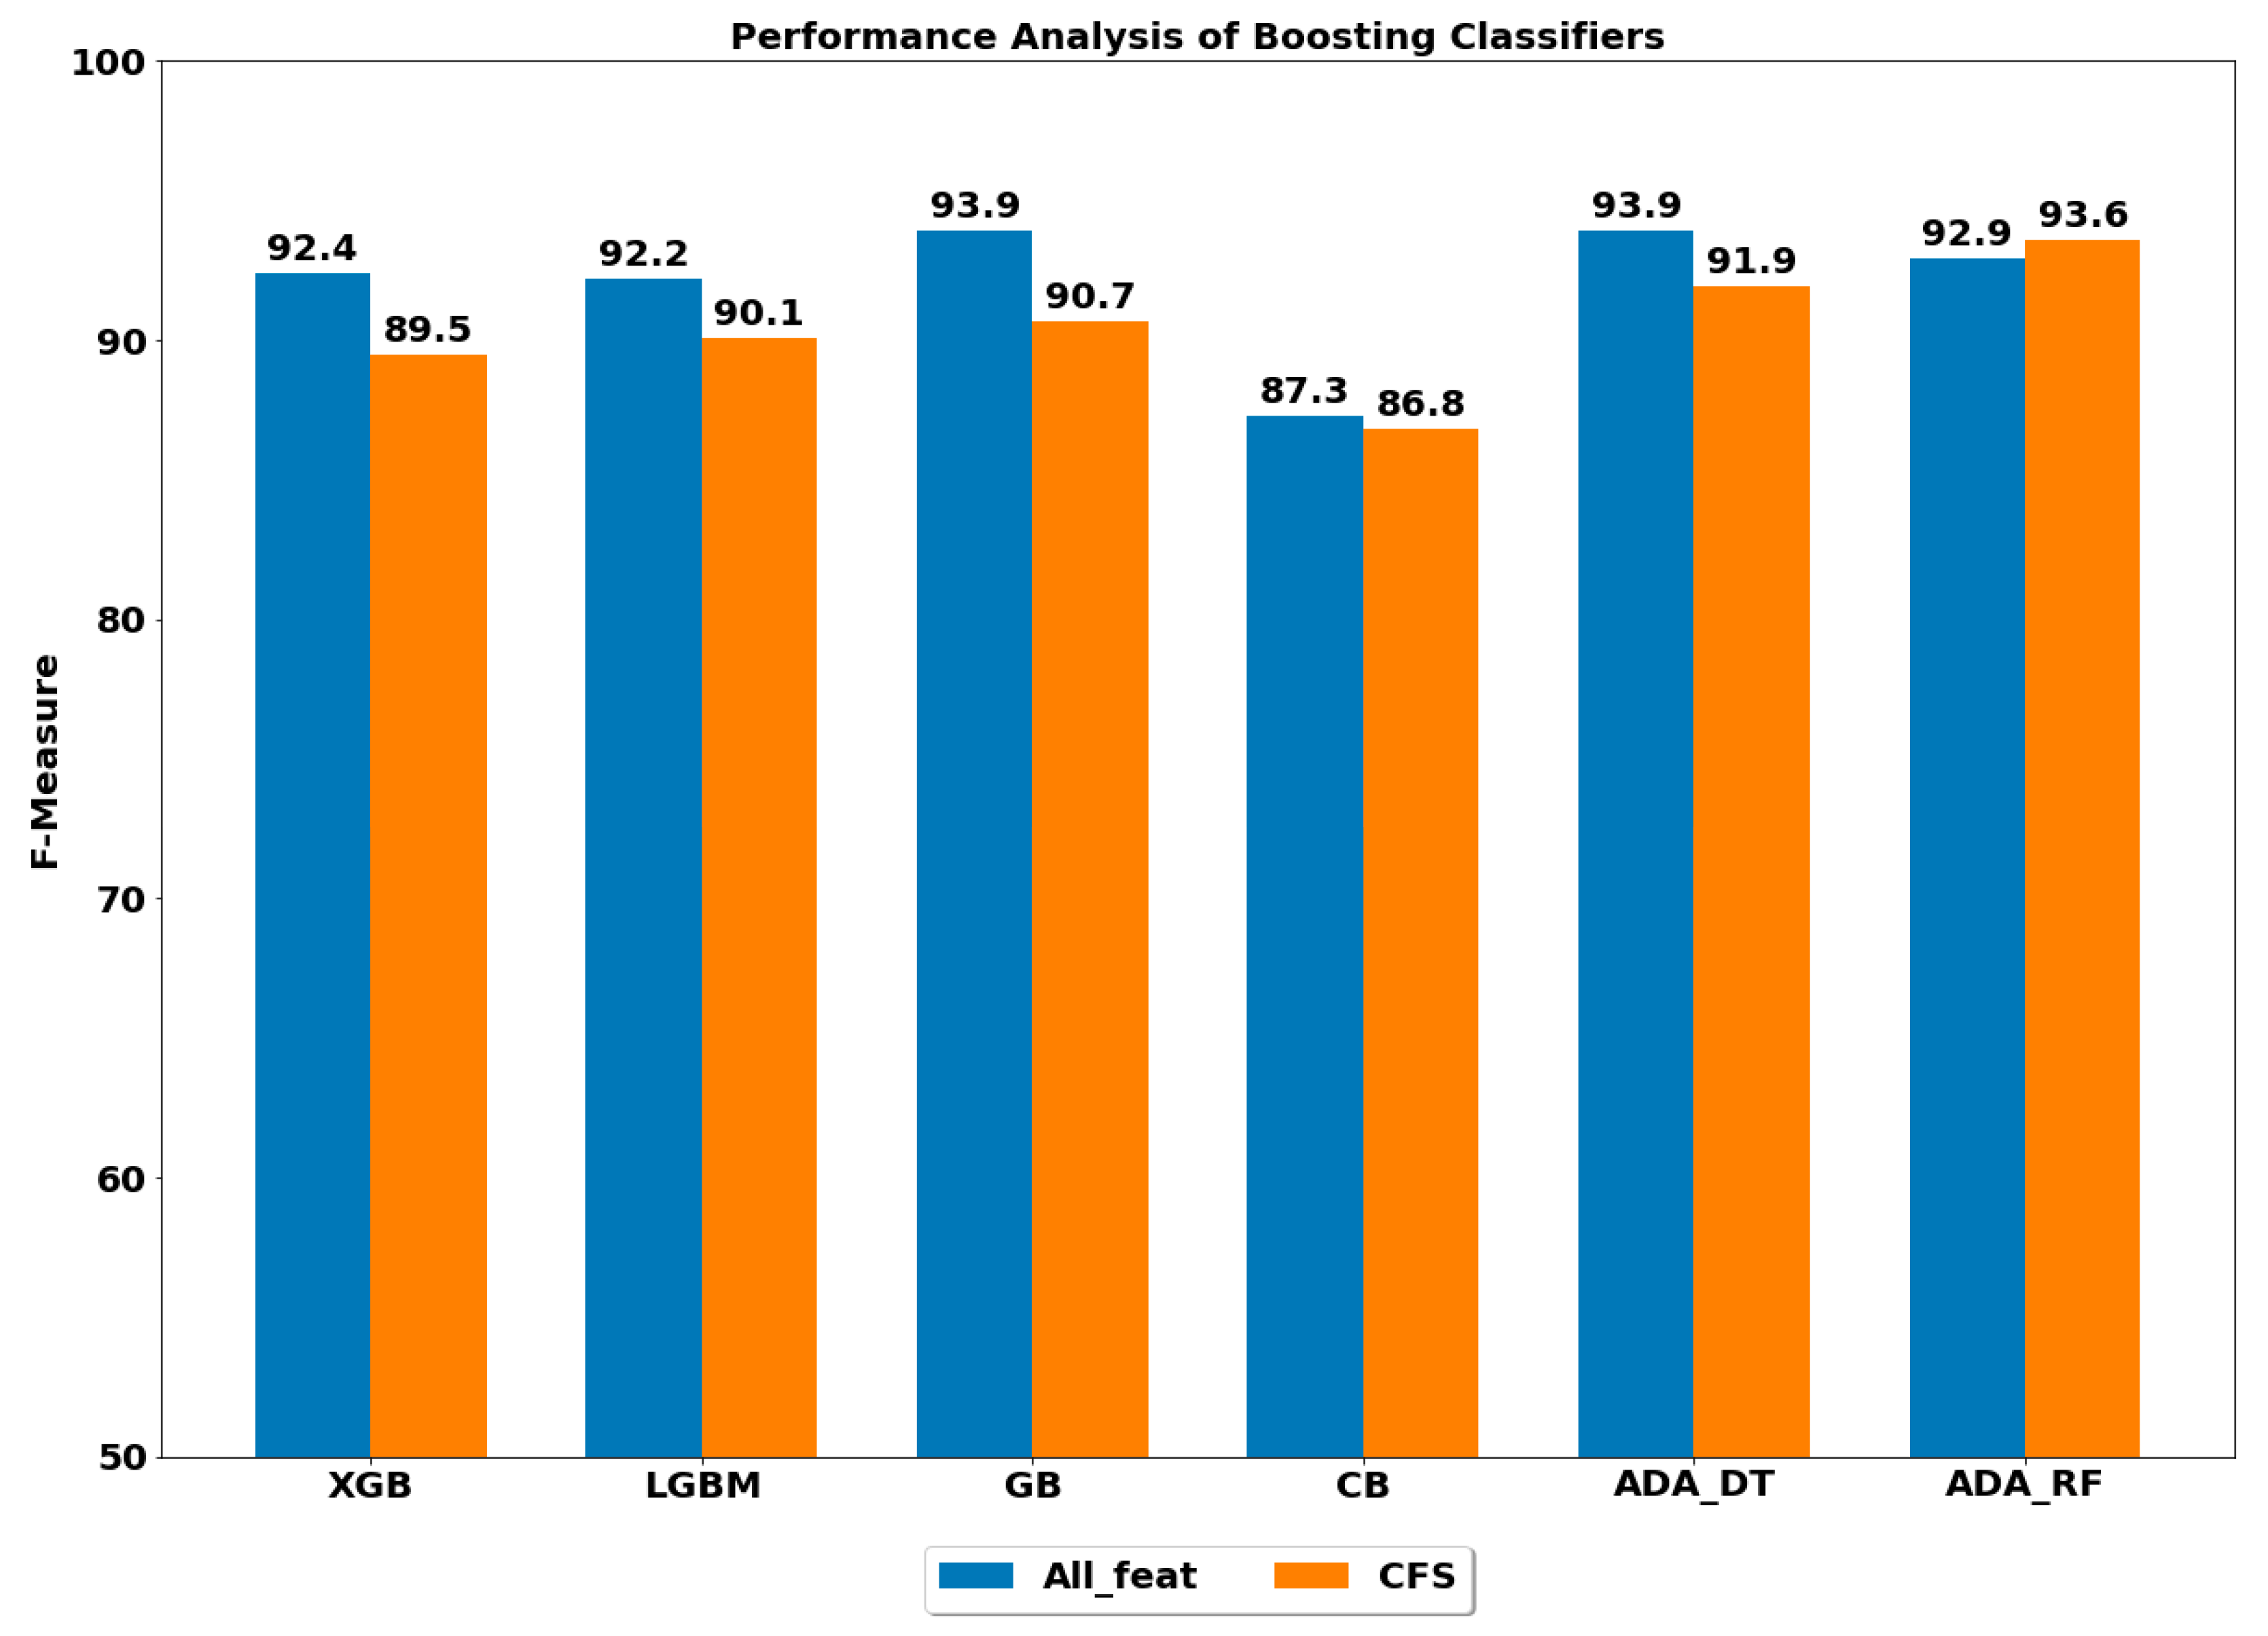
4.1. Overall Performance Analysis of Boosting Classifiers Used With and Without Feature Selection

4.1.1. Using All Feature Set

The performances of the six classifiers implemented in this study were computed using the F-measure metric. The performance of each classifier was computed using both feature sets, without feature selection, by using all the feature set obtained originally (All feat), and with feature selection, by only utilizing the uncorrelated feature set obtained through CFS approach.
The overall performances of six classification algorithms to classify ADLs are depicted in Figure 2. The best overall performance of 93.9% was achieved by GB and ADA (DT) classifiers, and the lowest performance of 87.3% was obtained by the CB classifier using all the feature set. Moreover, the XGB, LGBM and ADA (RF) classifiers also performed significantly well by achieving the overall performance of above 90%, and the differences in performance of these classifiers are quite small (less than 1%). The confusion matrix of the best classifier, i.e., GB, using all feature set is presented in Table 3.

4.1.2. Using Reduced Feature Set

The performance analysis of classification algorithms used in the study suggested that CFS-based feature set had decreased overall performance of the majority of the classifiers, except for ADA (RF), where the performance was increased. Although the change (increase or decrease) in the performance was not quite significant as compared with the performances achieved through the whole feature set, the number of features was significantly reduced from 561 to 150 using the CFS approach (over 70% reduction in several features). The number of features has implications on the computational complexity of the system [35,37]. A large number of features increases the computational complexity of the system and makes the systems infeasible to operate in real-time scenarios. On the contrary, the reduced feature set can significantly reduce the computational overheads and computational complexity of the system, which can be implemented in real-time applications. The confusion matrix of best-performing classifiers, all using the reduced CFS feature set, is presented in Table 4.

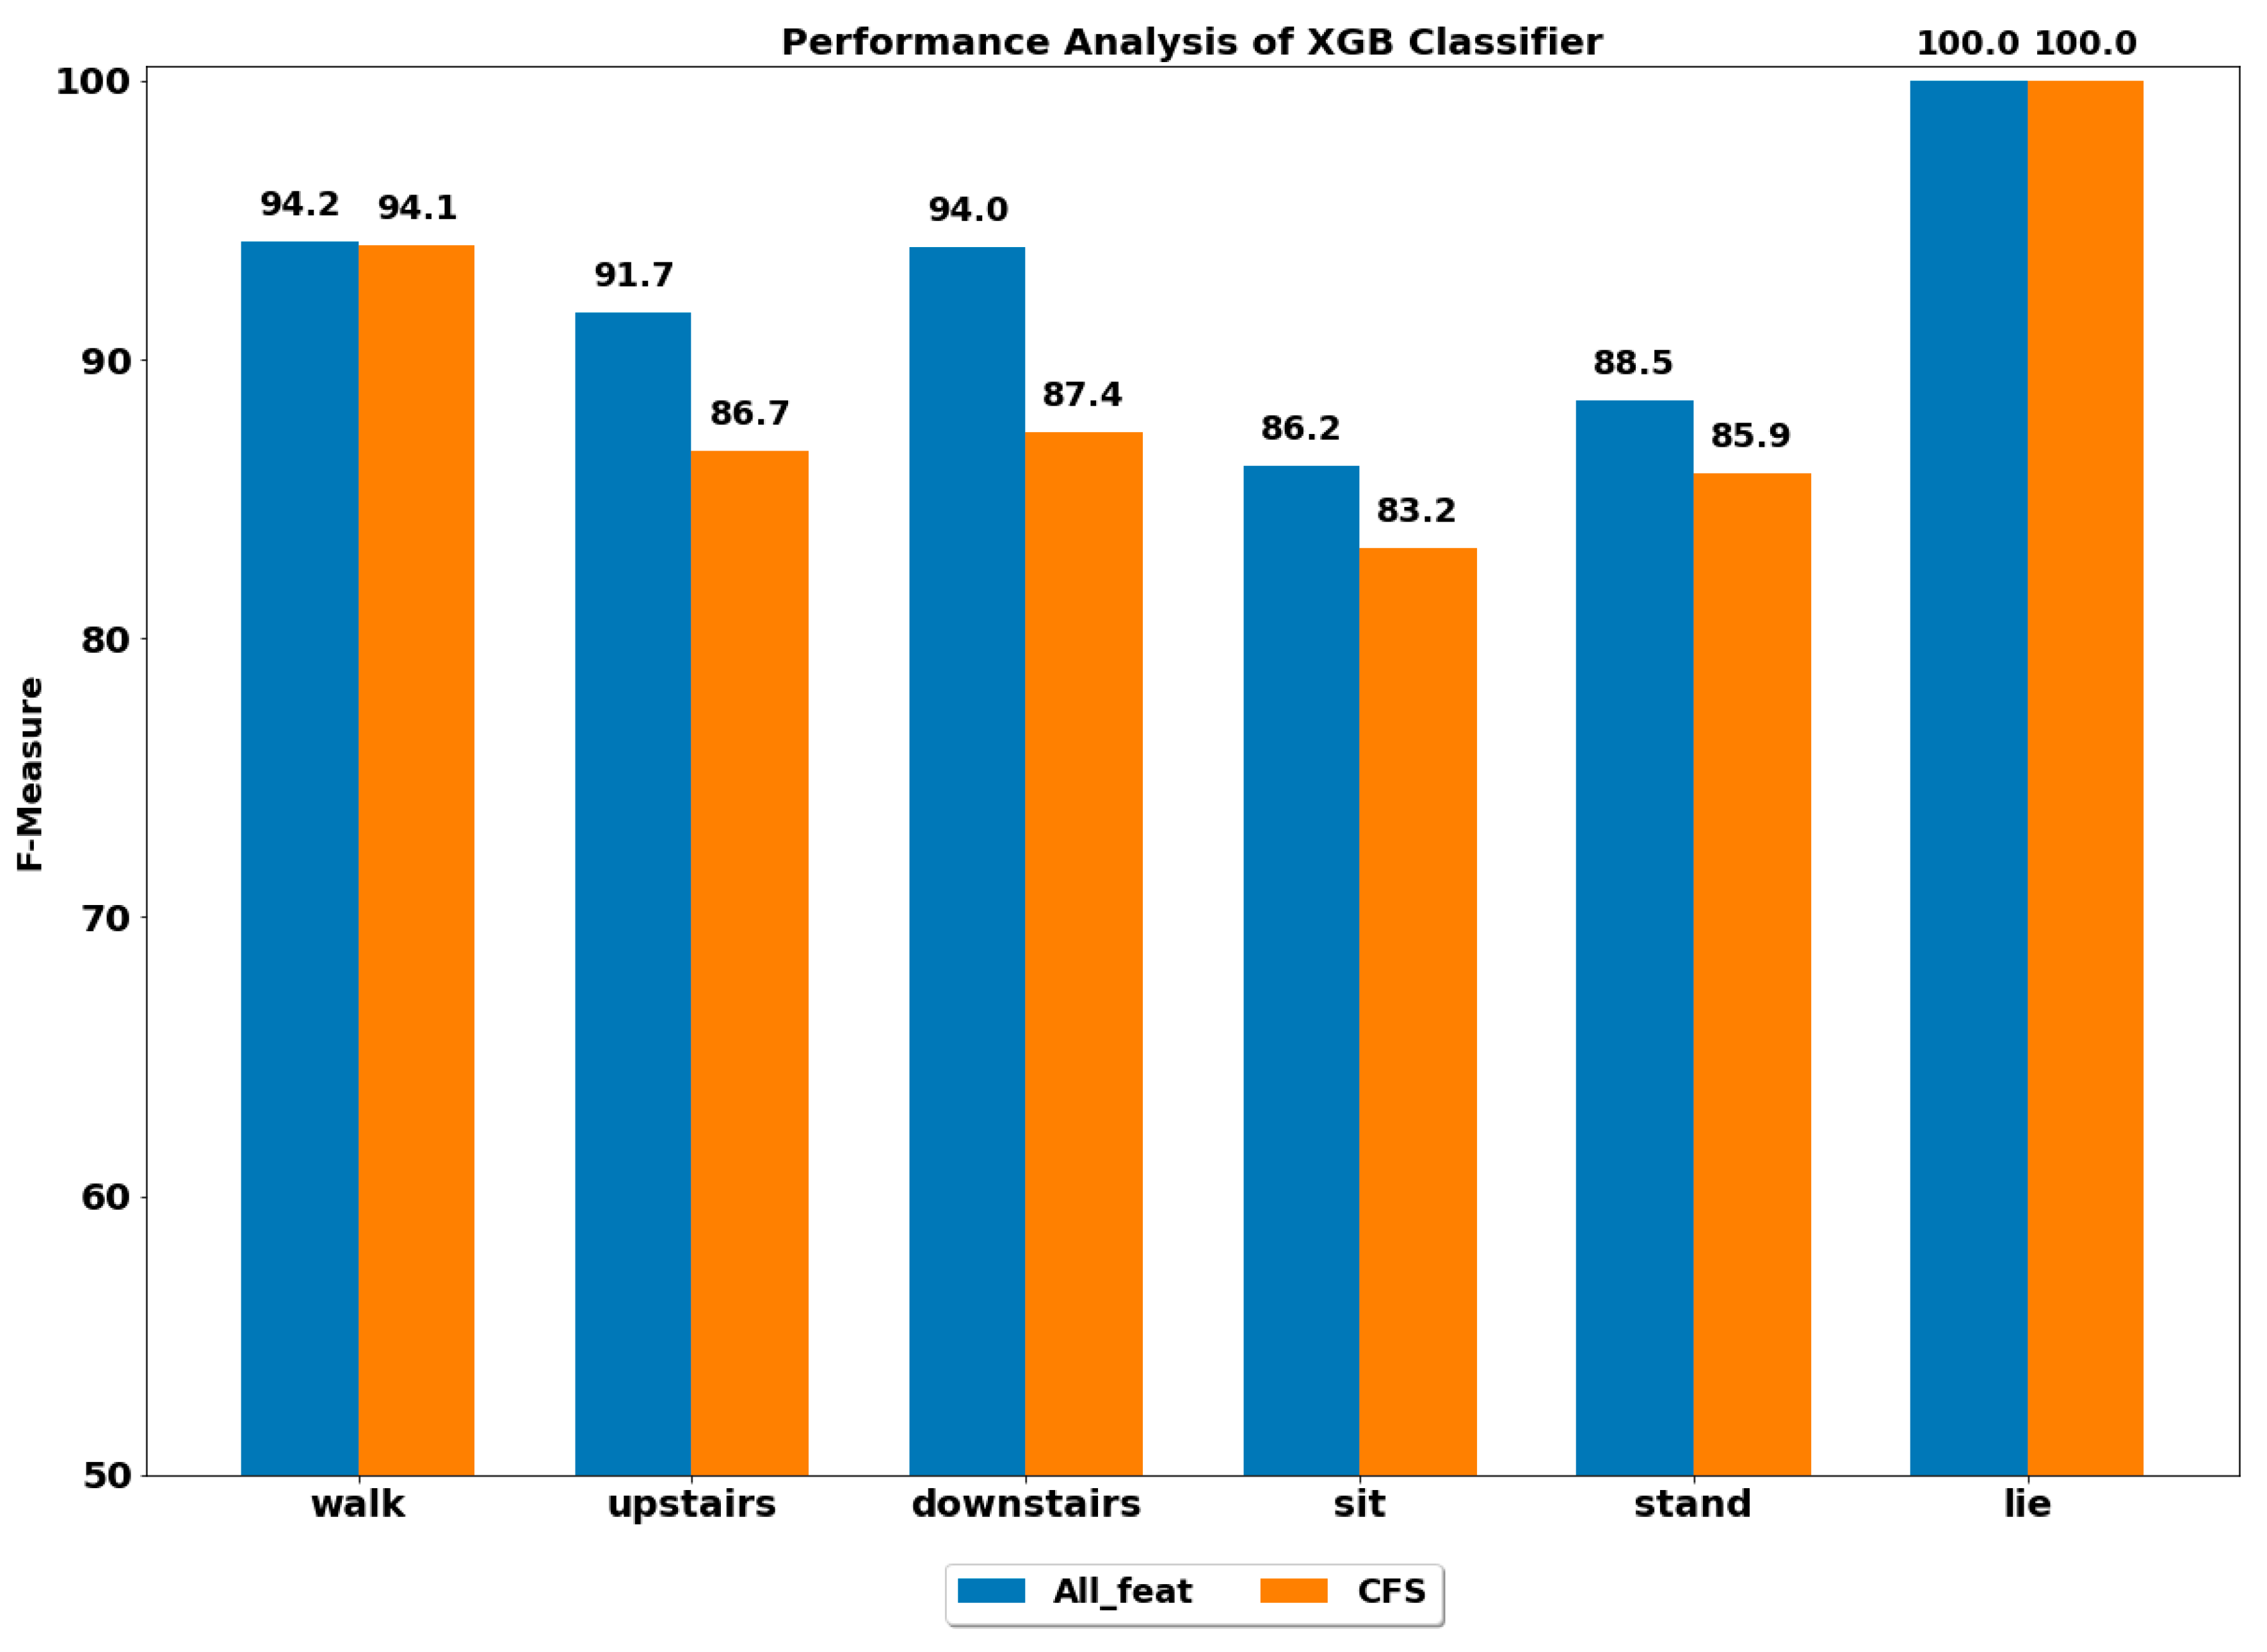
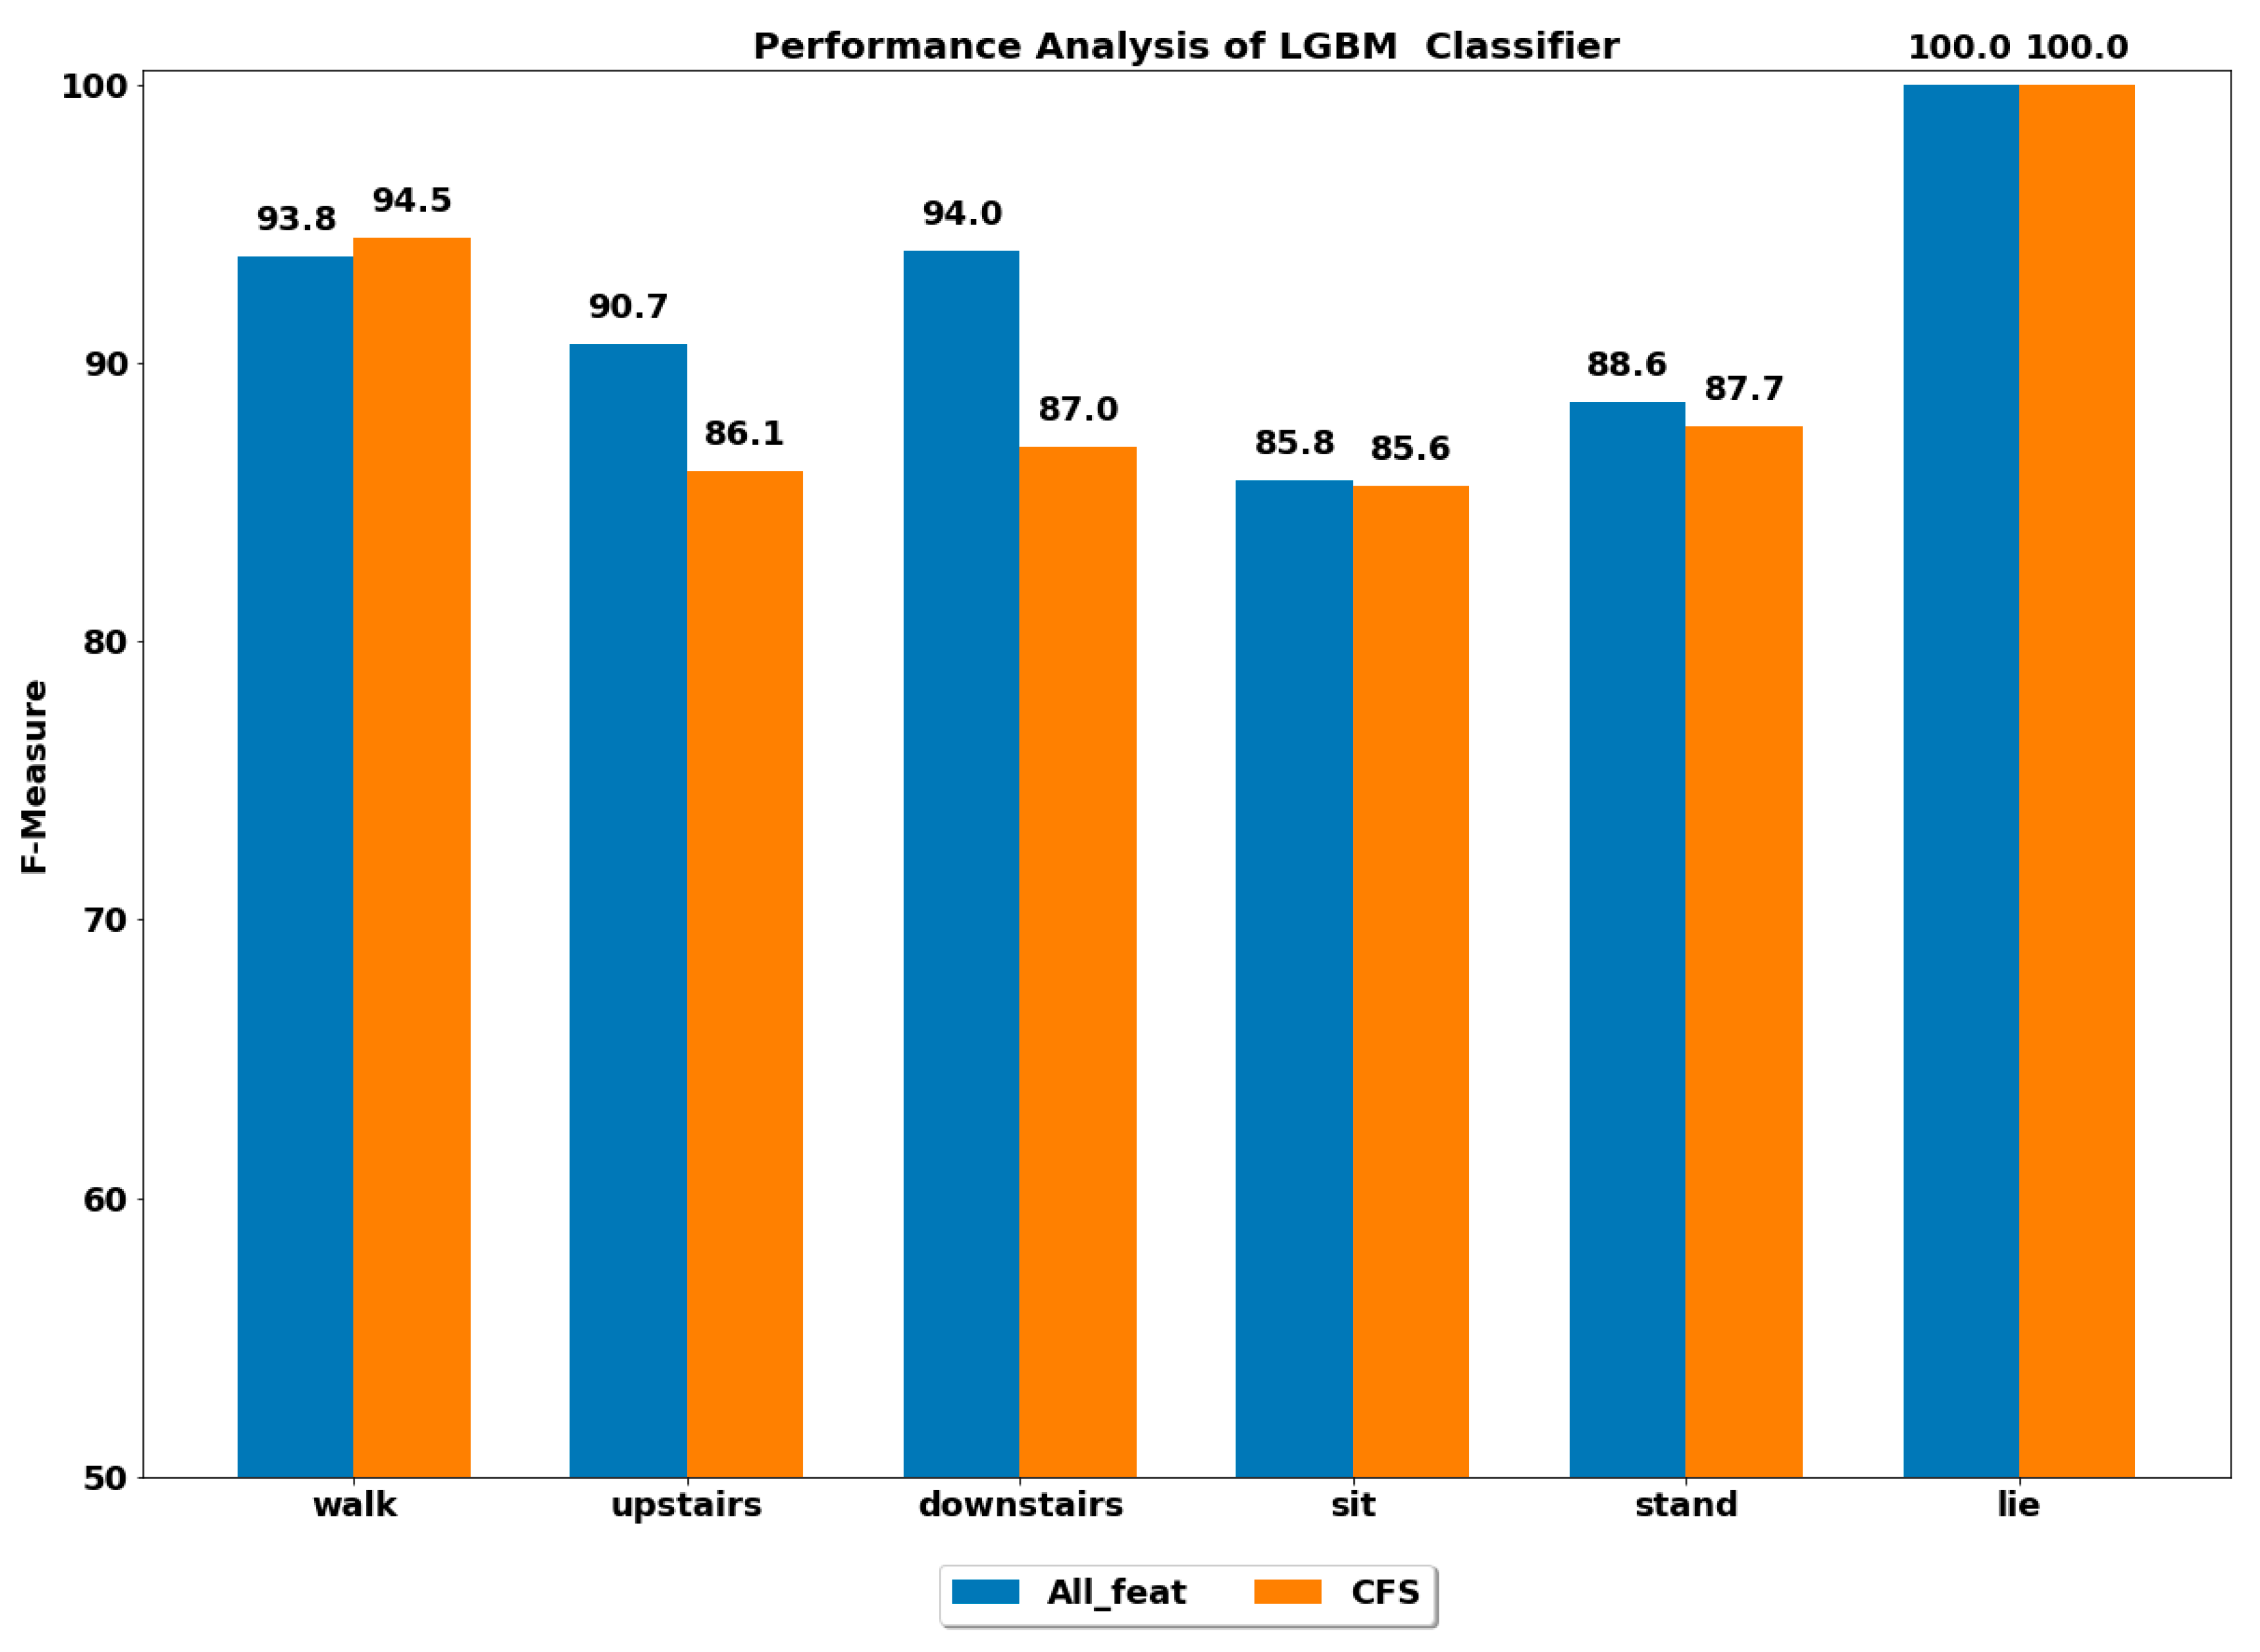
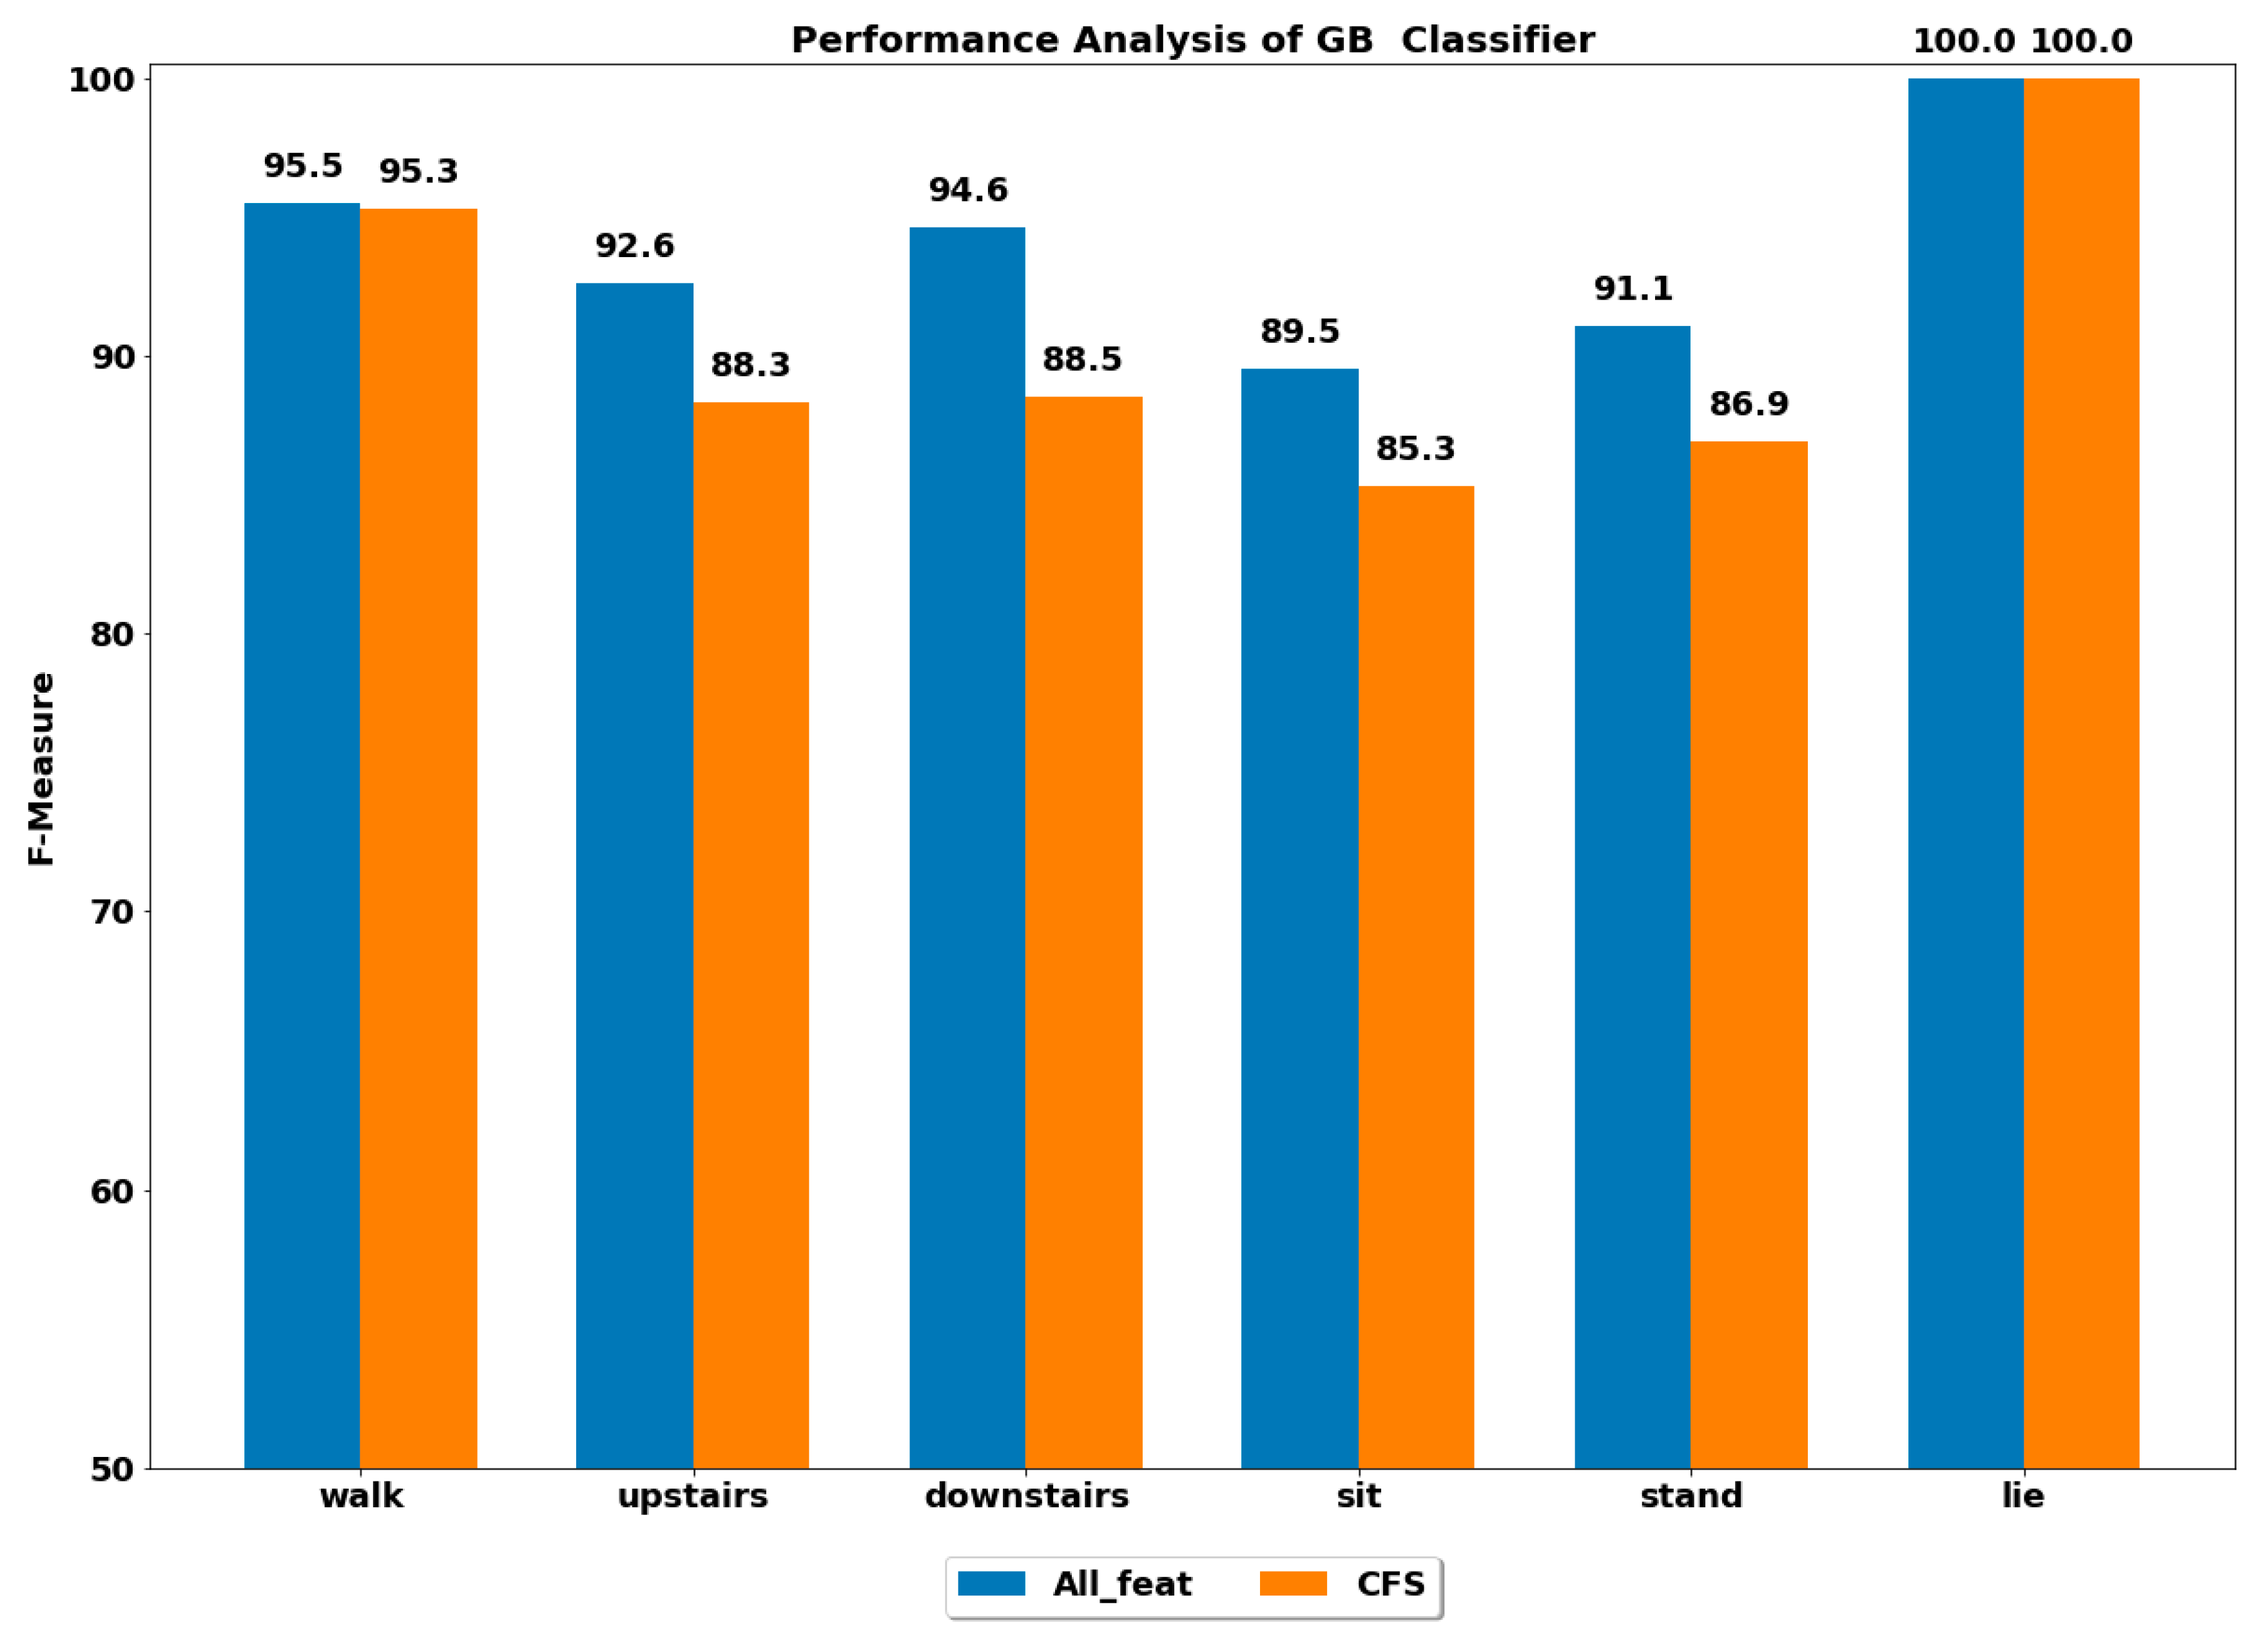
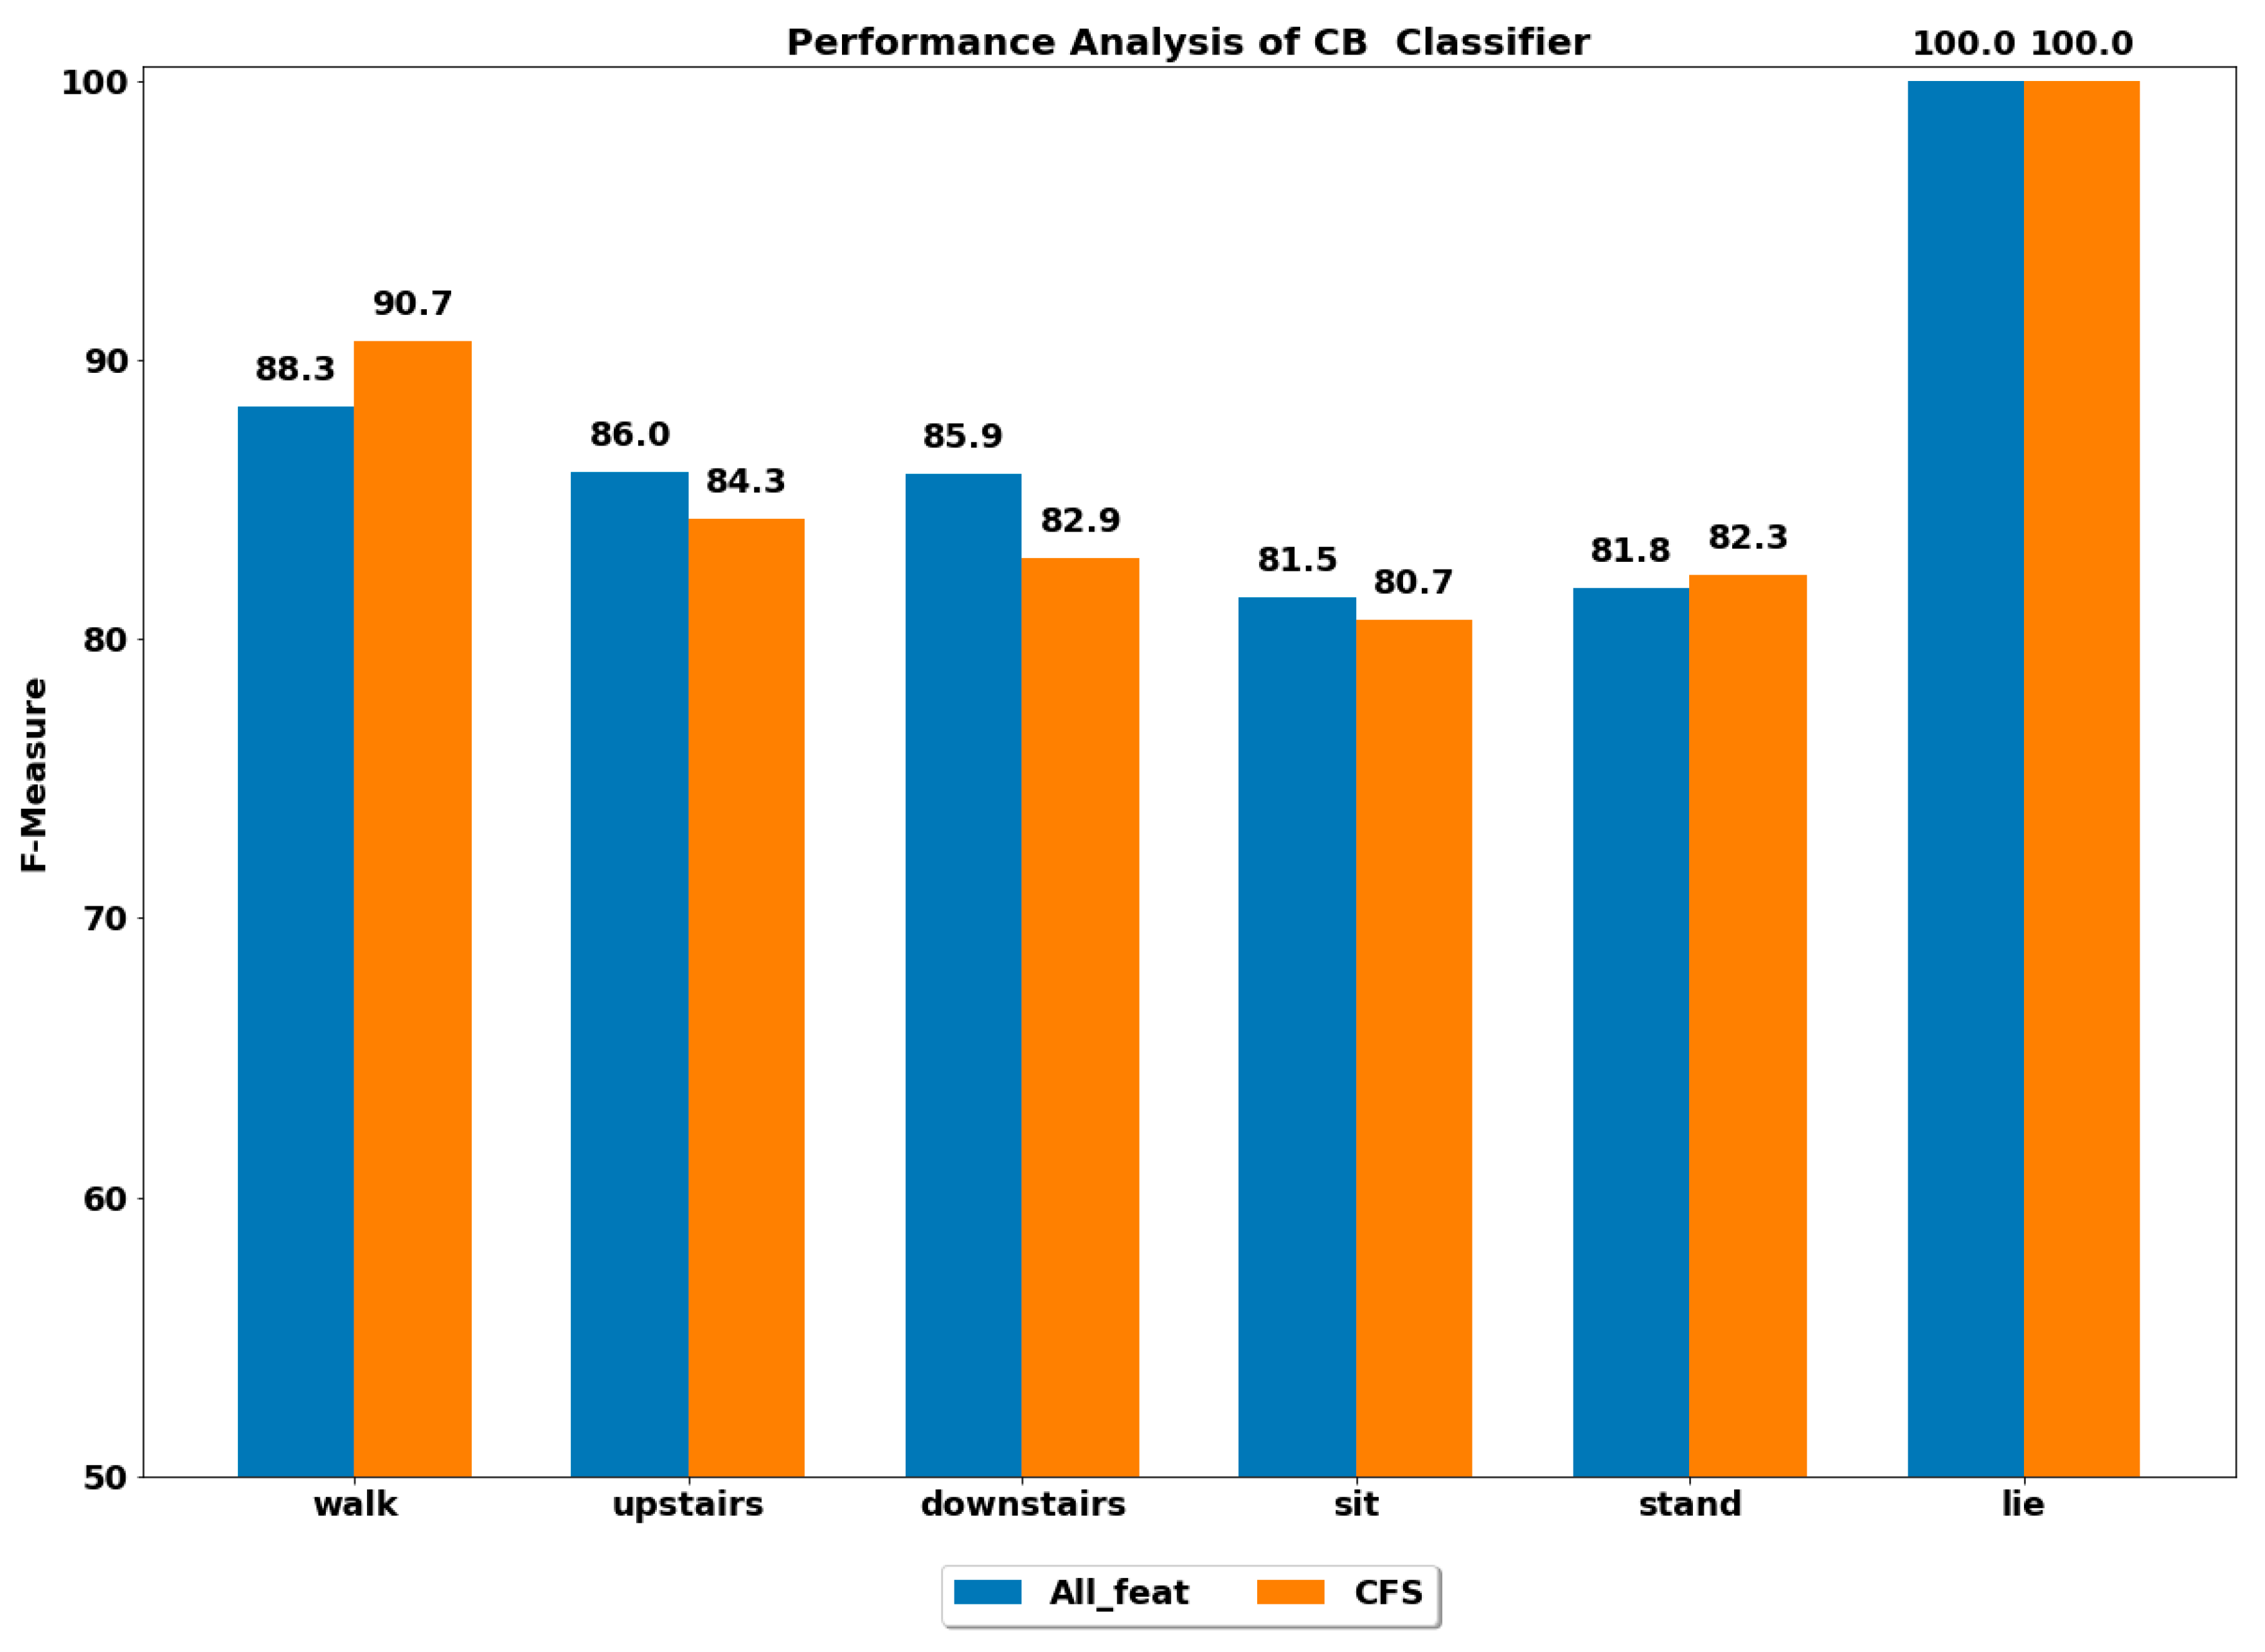
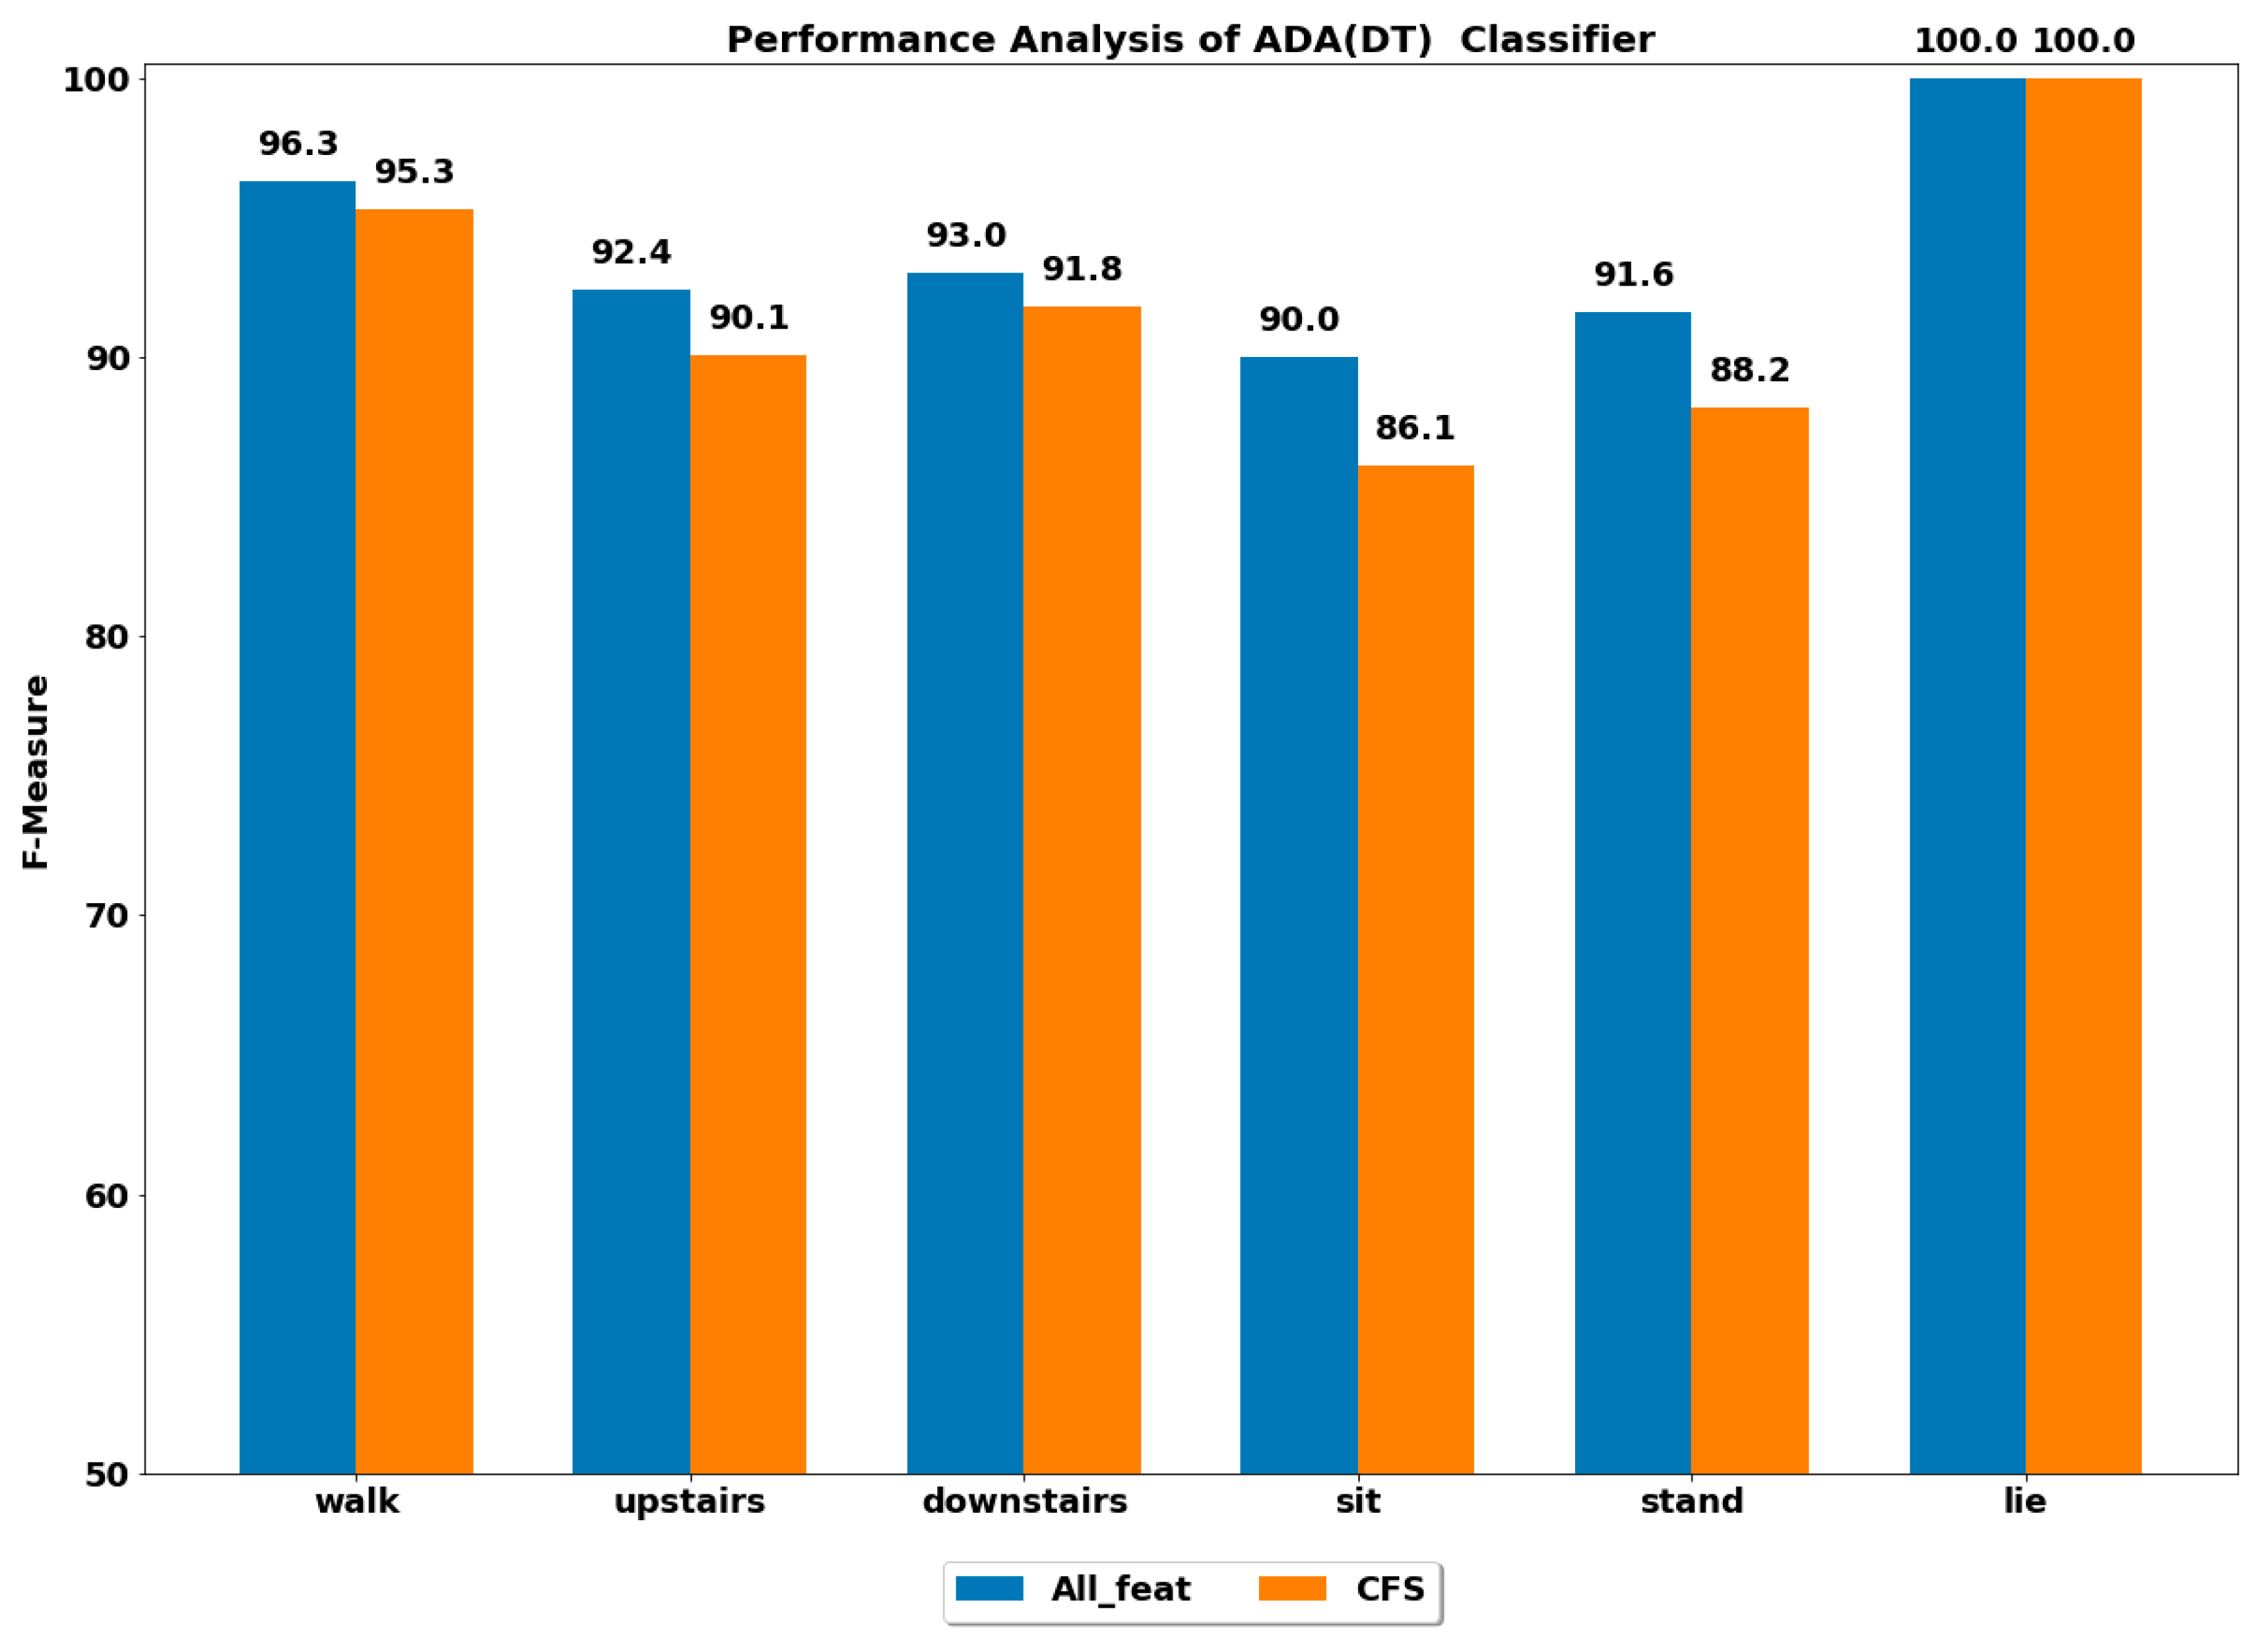
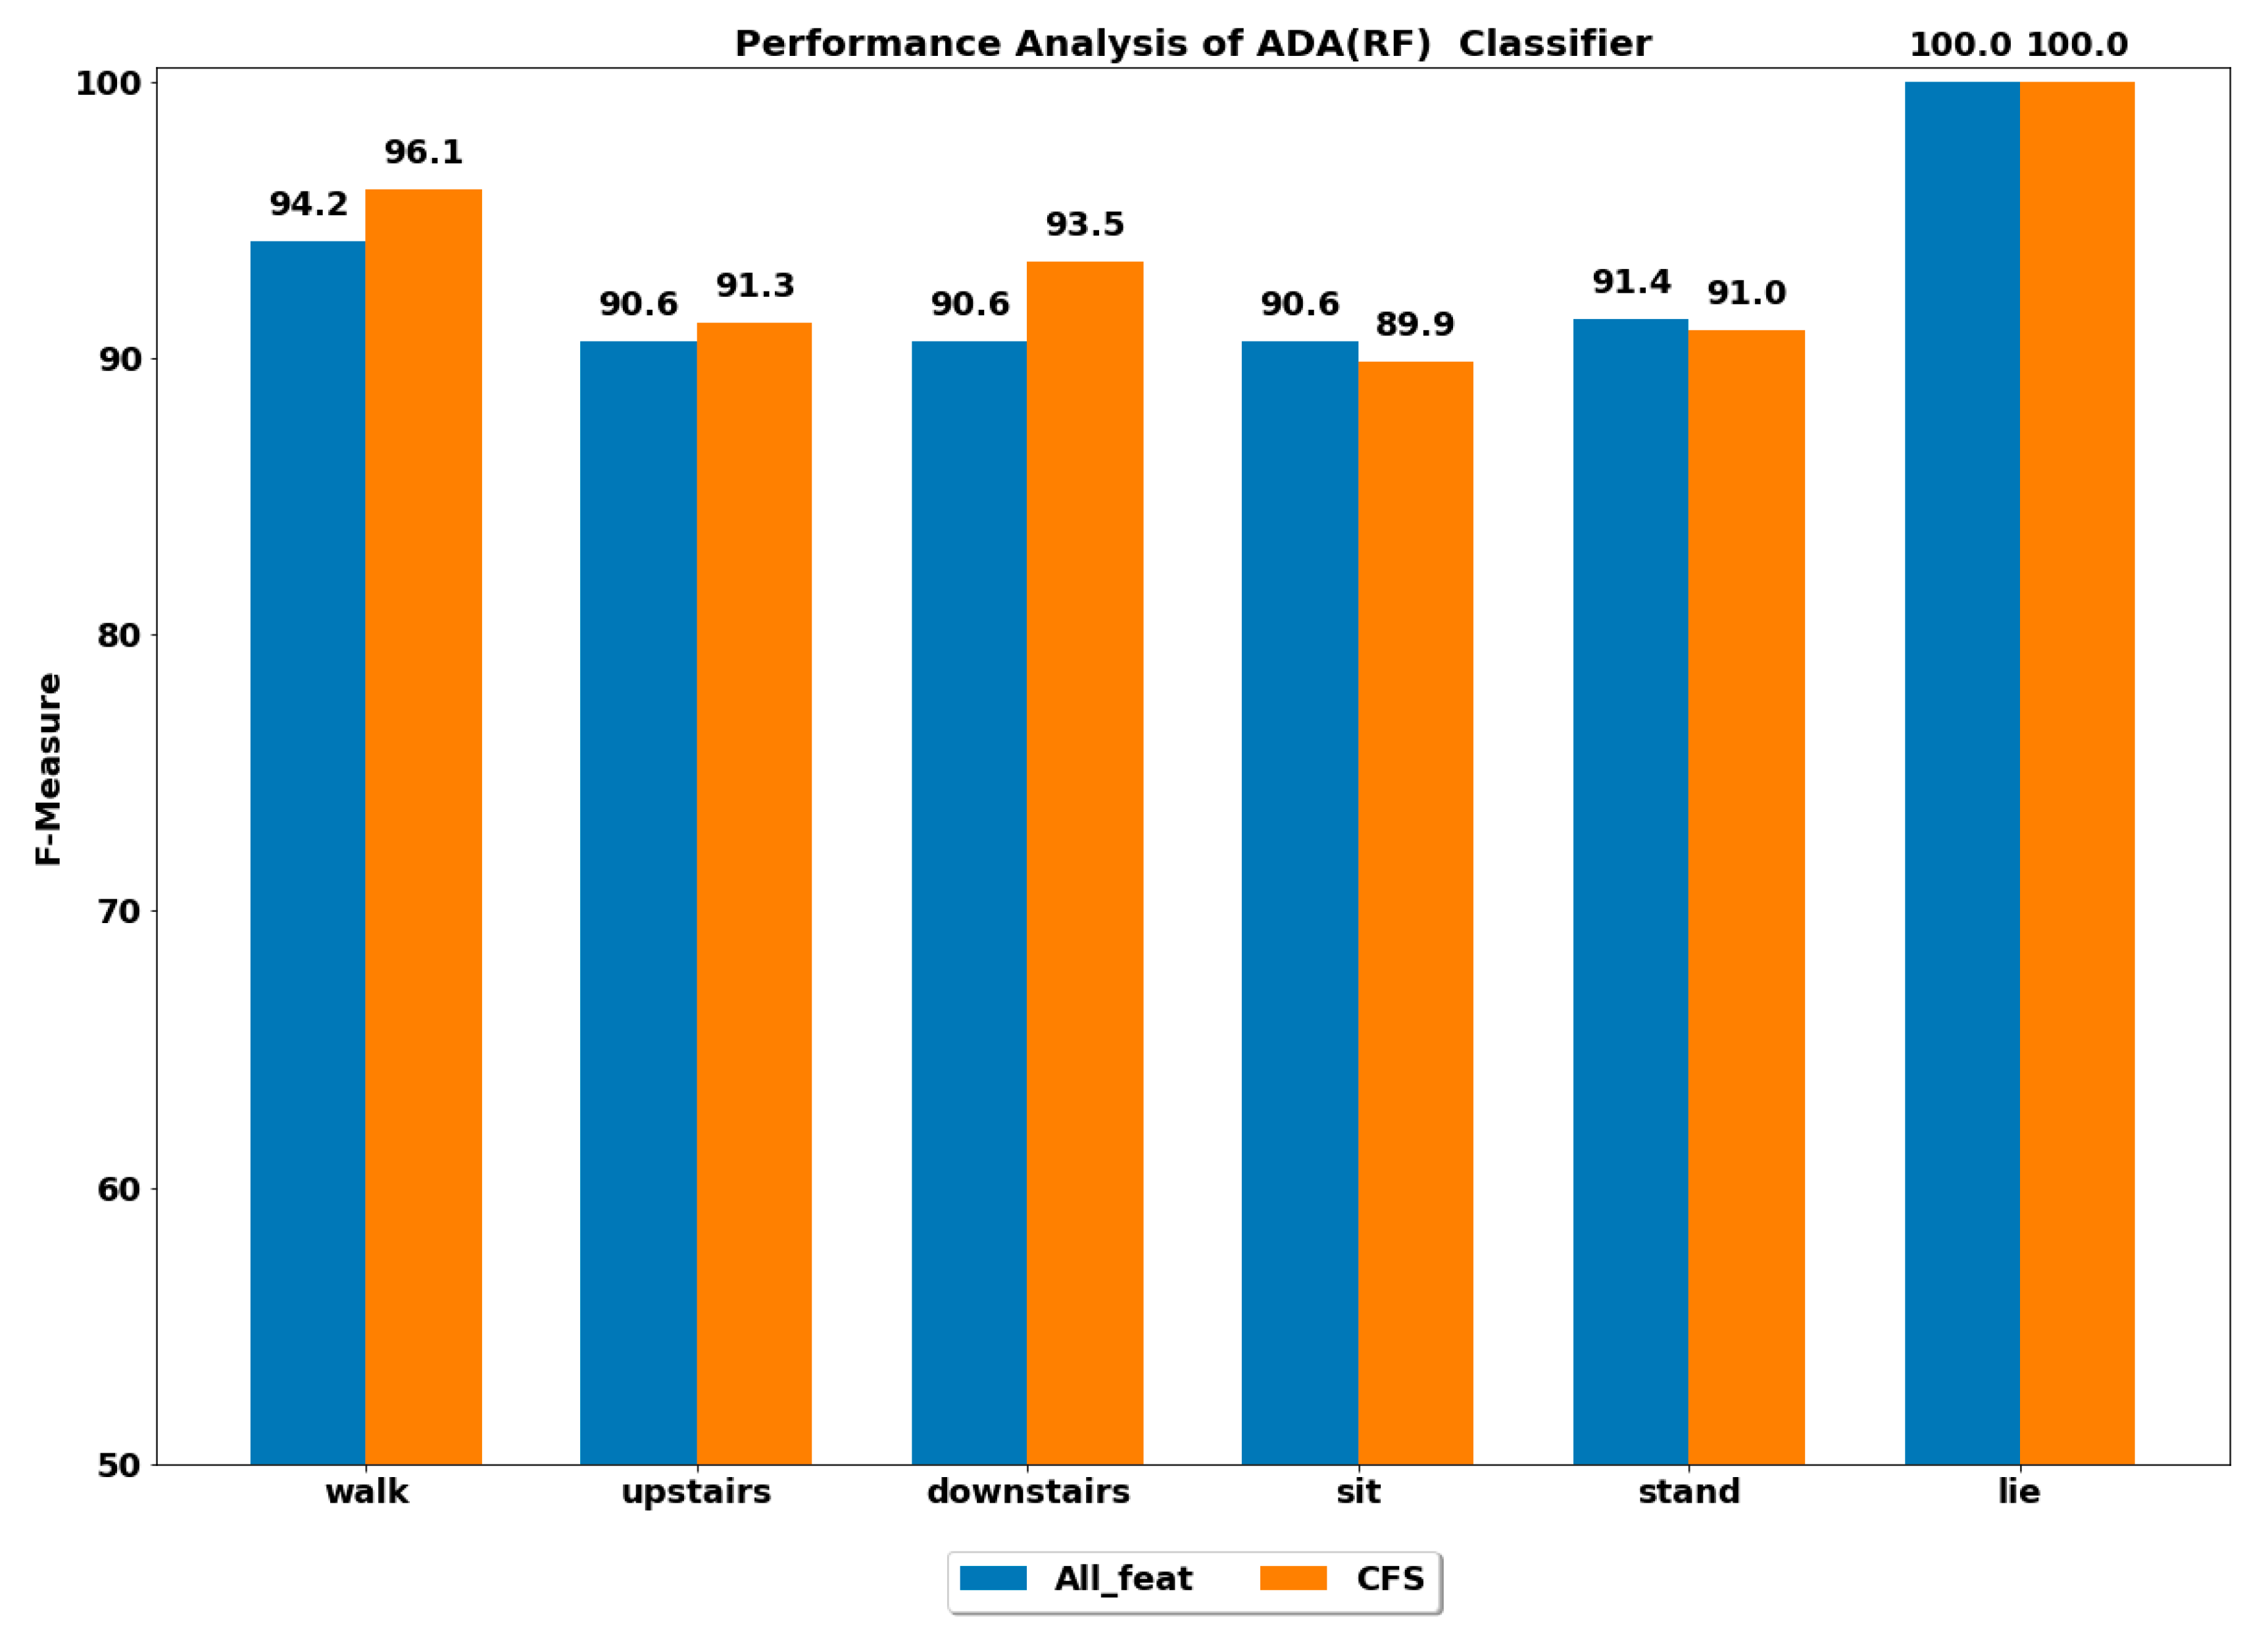
4.2. Performance Analysis of Individual ADL Classified by Boosting Classifiers

The performance of all the boosting classifiers was also computed to classify each ADL using all feature set and using only CFS-based reduced feature set. The performances by each class of ADL for the classifiers XGB, LGBM, GB, CB, ADA (DT) and ADA (RF) are depicted in Figure 3, Figure 4, Figure 5, Figure 6, Figure 7 and Figure 8.

4.2.1. Using All Feature Set

The best performance of above 96% was achieved by the ADA boost classifier using all feature set to classify the walking activity, while the CB classifier performed the worst among all. All the gradient boosting classifiers’ performances were quite close to that of ADA boost classifier with an overall performance of above 92% in classifying the walking activity.
The GB classifier achieved the best performances of 92.55% and 94.61% in classifying the stairs up and stairs down activities, respectively. The other classifiers also performed well in classifying stairs up and stairs down with F-measure of above 90%, except for CB, whose performance was lowest among all.
The sedentary ADLs, i.e., sitting, standing and lying, were best classified by ADA boost classifiers using the all feature set, followed by the GB classifier. The performance of above 90% was achieved in classifying the sitting and standing by the ADA boost classifiers. The other classifiers’ performances were below 90%. All the classifiers accurately classified the lying class with excellent performance of 100%, including the CB classifier, whose performance was quite low in classifying the rest of the ADLs. This could be because the orientation of accelerometer signals was significantly changed during the lying stage when compared with other classes, thus helping in classifying lying accurately.

4.2.2. Using Reduced Feature Set

The performance by a class of each ADL was computed on the reduced feature set using all the classifiers. The best performance by class was achieved using the ADA boost classifiers, while the next best performer was GB classifier.
The ADA (RF) outperformed all the classifiers in classifying all the ADLs, i.e., walking, stairs up, stairs down, sit, stand and lie.
These findings show the potential of using the reduced set of features to achieve the same performance and can potentially reduce the computational complexity of the PAC system by up to 70%.

4.3. Smartphone-Based Activity Profiling

The performances achieved to classify the ADLs through the GB classifier (using all the feature set) and ADA (RF) classifier (using reduced feature set) are quite encouraging and suggest that smartphone-based inertial sensors can provide a reliable measure to profile the ADLs. Smartphones are easy to carry in daily life routine and do not create many issues regarding battery life, since it is quite a routine matter to recharge the battery every day. Surprisingly, as an advantage, one can keep track of each of the ADLs performed along the course of a day, to weeks, months and even years. In this manner, one can adopt a heather lifestyle by incorporating more activity in their daily routines. Activity profiling can also provide an accurate and reliable measure to healthcare infrastructure and staff to provide well-informed interventions and therapies that can help the general population in obtaining a better quality of life and wellbeing.

5. Conclusions

This study provides a fair and unbiased performance analysis of the boosting classifiers used for physical activity classification. The study also investigates the performance of newly developed CatBoost classifiers and how well they performs with and without feature selection scenarios. The fair and unbiased performance analysis is accomplished by keeping the uniformity across the studied population, set of ADLs performed, the sensor type, the sensor location, the feature set, the cross-validation procedure and the performance metric. Gradient boosting classifier performed best among all classifiers when analysed over the whole feature set, and the achieved performance was around 94%. ADA boost classifier using the random forest as weak learner achieved the same level of performance. However, the ADA (RF) used a significantly reduced feature set (over 70% reduction) as compared with GB classifier while achieved the same performance in classifying ADLs. The reduced feature set has implications in real-time implementation as this is directly linked with the computational complexity of the system. The large feature set can increase the computational complexity of the system, making it difficult for real-time implementations, while a reduced feature set can potentially improve the computation complexity of the system, making real-time implementation more feasible.
The study also come up with limitations. The main limitation is the context where ADLs are performed. This dataset was developed in a relatively controlled environment, and it would be interesting to see how the boosting-based classifiers perform when implemented on a dataset collected in free-living conditions without any constraint on where and how the activities are performed.

Author Contributions

S.R., M.I., K.M.G., and M.A. performed the literature review, modelling, theoretical framework and paper drafting. M.A. has performed an extensive analysis of the draft, experimental framework and software-hardware integration. M.R., S.Y. and M.A. contributed towards the critical revision of the work. All authors have read and agreed to the published version of the manuscript.

Funding

This research got funded by Deanship of Scientific Research, Najran University, Saudi Arabia, for the award of research fund NU/ESCI/16/104.

Conflicts of Interest

The authors declare no conflict of interest.

References

  1. World Health Organization. Global Recommendations on Physical Activity for Health; World Health Organization: Geneva, Switzerland, 2010. [Google Scholar]
  2. Gellert, P.; Wienert, J.; Ziegelmann, J.P.; Kuhlmey, A. Profiles of physical activity biographies in relation to life and aging satisfaction in older adults: Longitudinal findings. Eur. Rev. Aging Phys. 2019, 16, 221–226. [Google Scholar] [CrossRef] [PubMed] [Green Version]
  3. Daskalopoulou, C.; Stubbs, B.; Kralj, C.; Koukounari, A.; Prince, M.; Prina, A.M. Physical activity, and healthy ageing: A systematic review and meta-analysis of longitudinal cohort studies. Ageing Res. Rev. 2017, 38, 6–17. [Google Scholar] [CrossRef] [PubMed] [Green Version]
  4. Keadle, S.K.; McKinnon, R.; Graubard, B.I.; Troiano, R.P. Prevalence and trends in physical activity among older adults in the United States: A comparison across three national surveys. Prev. Med. 2016, 89, 37–43. [Google Scholar] [CrossRef] [Green Version]
  5. Morrill, A.C.; Chinn, C.D. The obesity epidemic in the United States. J. Public Health Policy 2004, 25, 353–366. [Google Scholar] [CrossRef] [PubMed]
  6. Johnson, J.A., 3rd; Johnson, A.M. Urban-rural differences in childhood and adolescent obesity in the United States: A systematic review and meta-analysis. Child. Obes. 2015, 11, 233–241. [Google Scholar] [CrossRef] [PubMed]
  7. Lobstein, T.; Jackson-Leach, R.; Moodie, M.L.; Hall, K.D.; Gortmaker, S.L.; Swinburn, B.A.; James, W.P.T.; Wang, Y. Child and adolescent obesity: Part of a bigger picture. Lancet 2015, 385, 2510–2520. [Google Scholar] [CrossRef] [Green Version]
  8. DeNicola, E.; Aburizaiza, O.S.; Siddique, A.; Khwaja, H.; Carpenter, D.O. Obesity and public health in the Kingdom of Saudi Arabia. Rev. Environ. Health 2015, 30, 191–205. [Google Scholar] [CrossRef]
  9. Memish, Z.A.; El Bcheraoui, C.; Tuffaha, M.; Robinson, M.; Daoud, F.; Jaber, S.; Mikhitarian, S.; Al Saeedi, M.; AlMazroa, M.A.; Mokdad, A.H.; et al. Obesity and Associated Factors—Kingdom of Saudi Arabia, 2013. Prev. Chronic Dis. 2014, 11, E174. [Google Scholar] [CrossRef] [Green Version]
  10. Al-Hazzaa, H.M.; Abahussain, N.A.; Al-Sobayel, H.I.; Qahwaji, D.M.; Alsulaiman, N.A.; Musaiger, A.O. Prevalence of overweight, obesity, and abdominal obesity among Urban Saudi adolescents: Gender and regional variations. J. Health Popul. Nutr. 2014, 32, 634–645. [Google Scholar]
  11. Azzeh, F.S.; Bukhari, H.M.; Header, E.A.; Ghabashi, M.A.; Al-Mashi, S.S.; Noorwali, N.M. Trends in overweight or obesity and other anthropometric indices in adults aged 18-60 years in Western Saudi Arabia. Ann. Saudi Med. 2017, 37, 106–113. [Google Scholar] [CrossRef] [Green Version]
  12. Engin, A. The definition and prevalence of obesity and metabolic syndrome. Adv. Exp. Med. Biol. 2017, 960, 1–17. [Google Scholar] [PubMed]
  13. Ng, S.W.; Zaghloul, S.; Ali, H.; Harrison, G.; Popkin, P.M. The prevalence and trends of overweight, obesity and nutrition-related non-communicable diseases in the Arabian Gulf States. Obes. Res. 2011, 12, 1–13. [Google Scholar] [CrossRef] [PubMed]
  14. Hamam, F.A.; Eldalo, A.S.; Alnofeie, A.A.; Alghamdi, W.Y.; Almutairi, S.S.; Badyan, F.S. The association of eating habits and lifestyle with overweight and obesity among health sciences students in Taif University, KSA. J. Taibah Univ. Med Sci. 2017, 12, 249–260. [Google Scholar] [CrossRef] [PubMed]
  15. Raza, M.; Awais, M.; Ellahi, W.; Aslam, N.; Nguyen, H.X.; Le-Minh, H. Diagnosis and Monitoring of Alzheimer’s Patients Using Classical and Deep Learning Techniques. Expert Syst. Appl. 2019, 136, 353–364. [Google Scholar] [CrossRef]
  16. Alphen, H.J.V.; Hortobagyi, T.; Heuvelen, M.J.V. Barriers, motivators, and facilitators of physical activity in dementia patients: A systematic review. Arch. Gerontol. Geriatr. 2016, 66, 109–118. [Google Scholar] [CrossRef]
  17. Blankevoort, C.G.; Van Heuvelen, M.J.; Boersma, F.; Luning, H.; De Jong, J.; Scherder, E.J. Review of effects of physical activity on strength, balance, mobility and ADL performance in elderly subjects with dementia. Dement. Geriatr. Cogn. Disord. 2010, 30, 392–402. [Google Scholar] [CrossRef]
  18. Burns, J.M.; Mayo, M.S.; Anderson, H.S.; Smith, H.J.; Donnelly, J.E. Cardiorespiratory fitness in early-stage Alzheimer disease. Alzheimer Dis. Assoc. Disord. 2008, 22, 39–46. [Google Scholar] [CrossRef]
  19. Cedervall, Y.; Åberg, A.C. Physical activity and implications on well-being in mild Alzheimer’s disease: A qualitative case study on two men with dementia and their spouses. Physiother. Theory Pract. 2010, 26, 226–239. [Google Scholar] [CrossRef]
  20. Friedman, J.H. Stochastic gradient boosting. Comput. Stat. Data Anal. 2002, 38, 367–378. [Google Scholar] [CrossRef]
  21. Ke, G.; Meng, Q.; Finley, T.; Wang, T.; Chen, W.; Ma, W.; Ye, Q.; Liu, T.Y. LightGBM: A Highly Efficient Gradient Boosting Decision Tree. In Proceedings of the 31st Conference on Neural Information Processing Systems, Long Beach, CA, USA, 4 December 2017. [Google Scholar]
  22. Chen, T.; Guestrin, C. XGBoost: A Scalable Tree Boosting System. In Proceedings of the 22nd ACM Sigkdd International Conference on Knowledge Discovery and Data Mining, San Francisco, CA, USA, 13–17 August 2016. [Google Scholar]
  23. Prokhorenkova, L.; Gusev, G.; Vorobev, A.; Dorogush, A.V.; Gulin, A. CatBoost: Unbiased boosting with categorical features. In Proceedings of the 32nd International Conference on Neural Information Processing Systems, Montréal, QC, Canada, 3–8 December 2018; pp. 6639–6649. [Google Scholar]
  24. Fisher, W.D. On Grouping for Maximum Homogeneity. J. Am. Stat. Assoc. 1958, 53, 789–798. [Google Scholar] [CrossRef]
  25. Li, P.; Wang, Y.; Tian, Y.; Zhou, T.S.; Li, J.S. An Automatic User-Adapted Physical Activity Classification Method Using Smartphones. IEEE Trans. Biomed. Eng. 2017, 64, 706–714. [Google Scholar] [CrossRef] [PubMed]
  26. Zubair, M.; Song, K.; Yoon, C. Human activity recognition using wearable accelerometer sensors. In Proceedings of the 2016 IEEE International Conference on Consumer Electronics-Asia, Seoul, South Korea, 26–28 October 2016; pp. 1–5. [Google Scholar]
  27. Ugulino, W.; Cardador, D.; Vega, K.; Velloso, E.; Milidiú, R.; Fuks, H. Wearable Computing: Accelerometers’ Data Classification of Body Postures and Movements. In Proceedings of the 21st Brazilian Symposium on Artificial Intelligence Conference on Advances in Artificial Intelligence-SBIA 2012, Curitiba, Brazil, 20–25 October 2012; Springer: Berlin/Heidelberg, Germany, 2012; pp. 52–61. [Google Scholar]
  28. Reiss, A.; Stricker, D.; Hendeby, G. confidence-based multiclass AdaBoost for physical activity monitoring. In Proceedings of the 17th Annual International Symposium on International Symposium on Wearable Computers, Zurich, Switzerland, 8–12 September 2013; pp. 13–20. [Google Scholar]
  29. Asuncion, A.; Newman, D.J. UCI Machine Learning Repository; University of California, Irvine, School of Information and Computer Science: Irvine, CA, USA, 2007; Available online: http://archive.ics.uci.edu/ml/index.php (accessed on 2 October 2019).
  30. Lee, K.; Kwan, M.P. Physical activity classification in free-living conditions using smartphone accelerometer data and exploration of predicted results. Comput. Environ. Urban Syst. 2018, 67, 124–131. [Google Scholar] [CrossRef]
  31. Esseiva, J.; Caon, J.; Mugellini, E.; Khaled, O.A.; Aminian, K. Feet fidgeting detection based on accelerometers using decision tree learning and gradient boosting. In Proceedings of the International Conference on Bioinformatics and Biomedical Engineering, Kunming, China, 15–17 September 2018; Springer: Berlin/Heidelberg, Germany, 2018; pp. 75–84. [Google Scholar]
  32. Guo, J.; Yang, L.; Bie, R.; Yu, J.; Gao, Y.; Shen, Y.; Kos, A. An XGBoost-based physical fitness evaluation model using advanced feature selection and Bayesian hyper-parameter optimization for wearable running monitoring. Comput. Netw. 2019, 151, 166–180. [Google Scholar] [CrossRef]
  33. Zhang, W.; Zhao, X.; Li, Z. A Comprehensive Study of Smartphone-Based Indoor Activity Recognition via Xgboost. IEEE Access 2019, 7, 80027–80042. [Google Scholar] [CrossRef]
  34. Gao, X.; Luo, H.; Wang, Q.; Zhao, F.; Ye, L.; Zhang, Y. A Human Activity Recognition Algorithm Based on Stacking Denoising Autoencoder and LightGBM. Sensors 2019, 19, 947. [Google Scholar] [CrossRef] [Green Version]
  35. Awais, M.; Palmerini, L.; Bourke, A.K.; Ihlen, E.A.; Helbostad, J.L.; Chiari, L. Performance Evaluation of State of the Art Systems for Physical Activity Classification of Older Subjects Using Inertial Sensors in a Real-Life Scenario: A Benchmark Study. Sensors 2016, 16, 2105. [Google Scholar] [CrossRef] [Green Version]
  36. Anguita, D.; Ghio, A.; Oneto, L.; Parra, X.; Reyes-Ortiz, J.L. A Public Domain Dataset for Human Activity Recognition Using Smartphones. In Proceedings of the European Symposium on Artificial Neural Networks, Bruges, Belgium, 24–26 April 2013; pp. 24–26. [Google Scholar]
  37. Awais, M.; Chiari, L.; Ihlen, E.A.; Helbostad, J.L.; Palmerini, L. Physical Activity Classification for Elderly People in Free-Living Conditions. IEEE J. Biomed. Health Inform. 2019, 23, 197–207. [Google Scholar] [CrossRef]
Figure 1. Basic types of supervised machine learning algorithms.
Ijerph 17 01082 g001
Figure 2. Performance analysis of various boosting classifiers with and without feature selection.
Ijerph 17 01082 g002
Figure 3. Performance analysis of XGB (extreme gradient boosting) classifier with and without feature selection to classify set of ADLs (activities of daily living).
Ijerph 17 01082 g003
Figure 4. Performance analysis of LGBM (light gradient boosting Machine) classifier with and without feature selection to classify set of ADLs.
Ijerph 17 01082 g004
Figure 5. Performance analysis of GB (gradient boosting) classifier with and without feature selection to classify set of ADLs.
Ijerph 17 01082 g005
Figure 6. Performance analysis of CB (cat boosting) classifier with and without feature selection to classify set of ADLs.
Ijerph 17 01082 g006
Figure 7. Performance analysis of ADA (DT) classifier with and without feature selection to classify set of ADLs.
Ijerph 17 01082 g007
Figure 8. Performance analysis of ADA (RF) classifier with and without feature selection to classify set of ADLs.
Ijerph 17 01082 g008
Table 1. Overview of the physical activity classification systems developed using boosting classifiers.
AuthorSensorActivitiesClassifiersMetricsResult
Li et al. [25]Gyroscopes, acceleration sensorsWalking, sitting, standing, cycling and runningAdaboost (base classifier), Decision Tree (weak learner)Accuracy98%
Zubair et al. [26]AccelerometerStanding up, standing, sitting down, sitting and walkingAdaboost (Decision Tree, Random Forest)Accuracy99.9% Accuracy of Adaboost
Reiss et al. [28]AccelerometerDescending and ascending stairs, walking, cycling, running, standing, sitting and layingAdaboostAccuracy77.78%
Lee et al. [30]SmartphonesStanding, sitting, downstairs, upstairs, jogging and walkingGradient boosting, Random ForestsAccuracy99.03% 99.22%
Esseiva et al. [31]AccelerometersFour positions of the leg for feet fidgeting; upper leg swinging, up and down leg bouncing, lower leg swinging, foot jigglingGradient boosting, Adaboost, random forest and decision treeAccuracy, precision, recall, F-score95% accuracy for gradient boosting
Guo et al. [32]Smart bandsFour levels of fitness; excellent, good, medium, poorXGBoost,F-measure99% for XGBoost
Zhang et al. [33]Barometer, gyroscope and accelerometerElevator taking, stair climbing, stillness, escalator taking and walkingXGBoost,F-measure84.19% for XGBoost
Gao et al. [34]Accelerometer, gyroscope, magnetic and pressure sensorStatic mode, dynamic mode and moving modeSDAE with LightGBMAccuracy95.99%
Table 2. Overview of the physical activity classification systems developed using boosting classifiers.
Activity TypeTotal DatasetPercentage (Total Dataset)Train SplitTest Split
Walk172216.72%1226496
Upstairs154414.99%1073471
Downstairs140613.65%986420
Sit177717.25%1286491
Stand190618.51%1374532
Lie194418.88%1407537
Table 3. Confusion matrix of best-performing classifier (GB) using all feature set.
PredictedWalkUpstairsDownstairsSitStandLie
Actual
Walk48664000
Upstairs294356100
Downstairs726386010
Sit020424650
Stand000325000
Lie00000537
Table 4. Confusion matrix of best-performing classifier ADA(RF) using reduced feature set.
PredictedWalkUp-StairsDown-StairsSitStandLie
Actual
Walk49114000
Upstairs3342810000
Downstairs237381000
Sit010436540
Stand000434890
Lie00000537

