Dynamics of Chinese Diet Divergence from Chinese Food Pagoda and Its Association with Adiposity and Influential Factors: 2004–2011


Abstract
1. Introduction
2. Materials and Methods
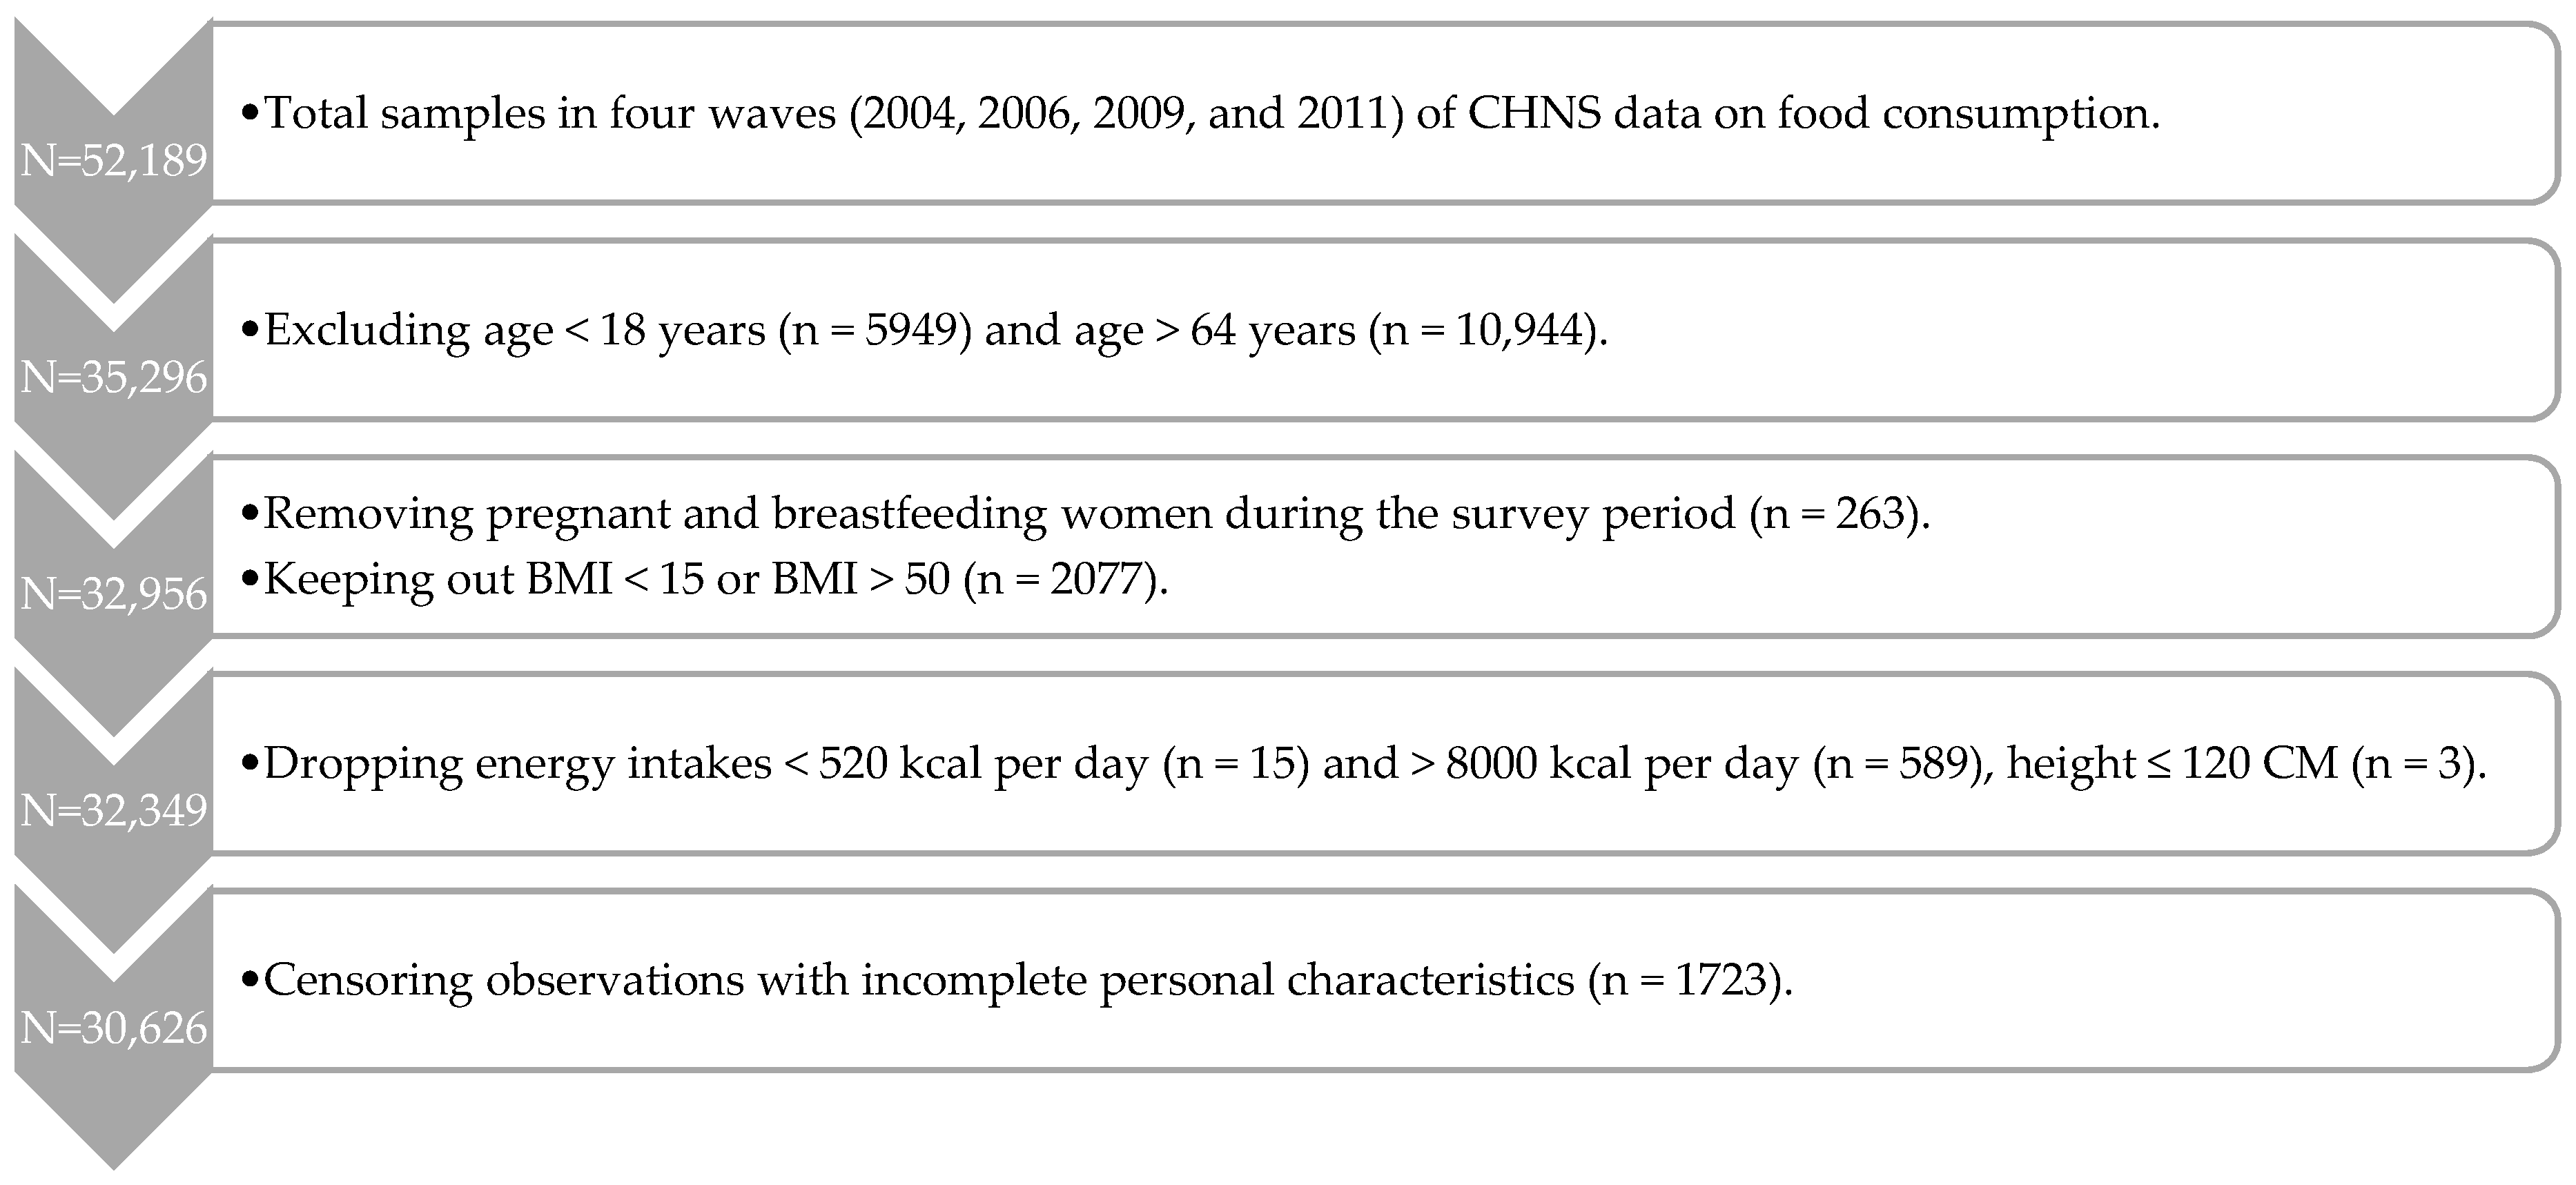
2.1. Study Subjects
2.2. Chinese Food Pagoda 2016
2.3. Assessment of Food Consumption
2.4. Composition of the DQD
2.5. Measurement of Obesity
2.6. Measurement of Covariates
2.7. Statistical Methods
3. Results
3.1. Descriptive Analysis
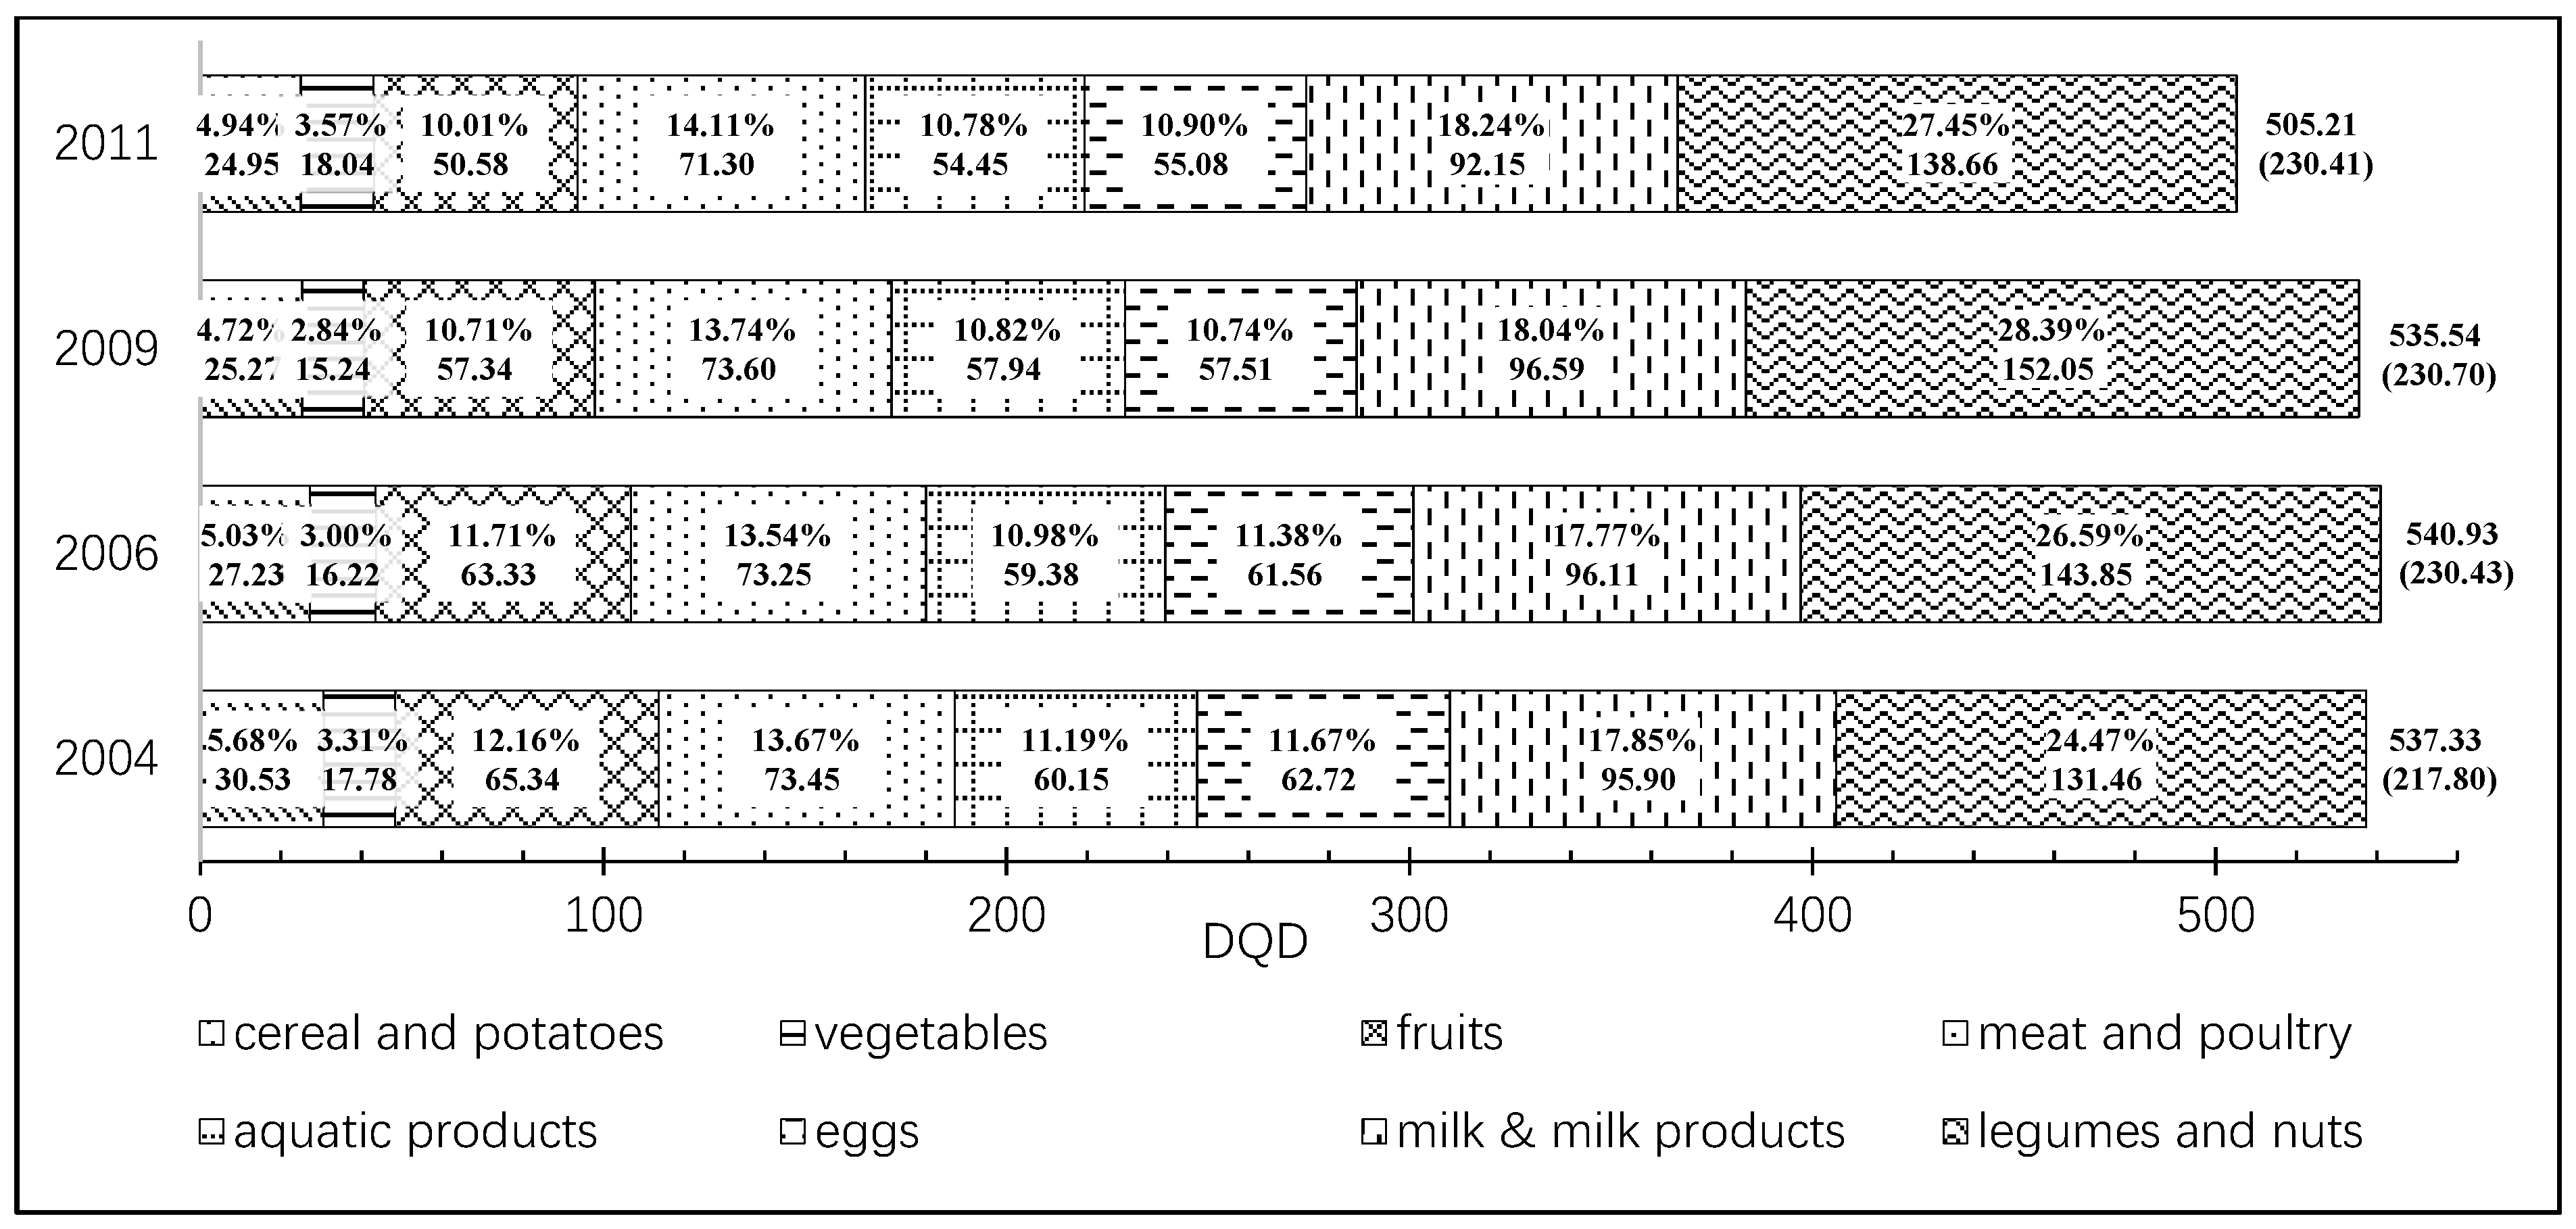
3.2. Dynamics of DQD
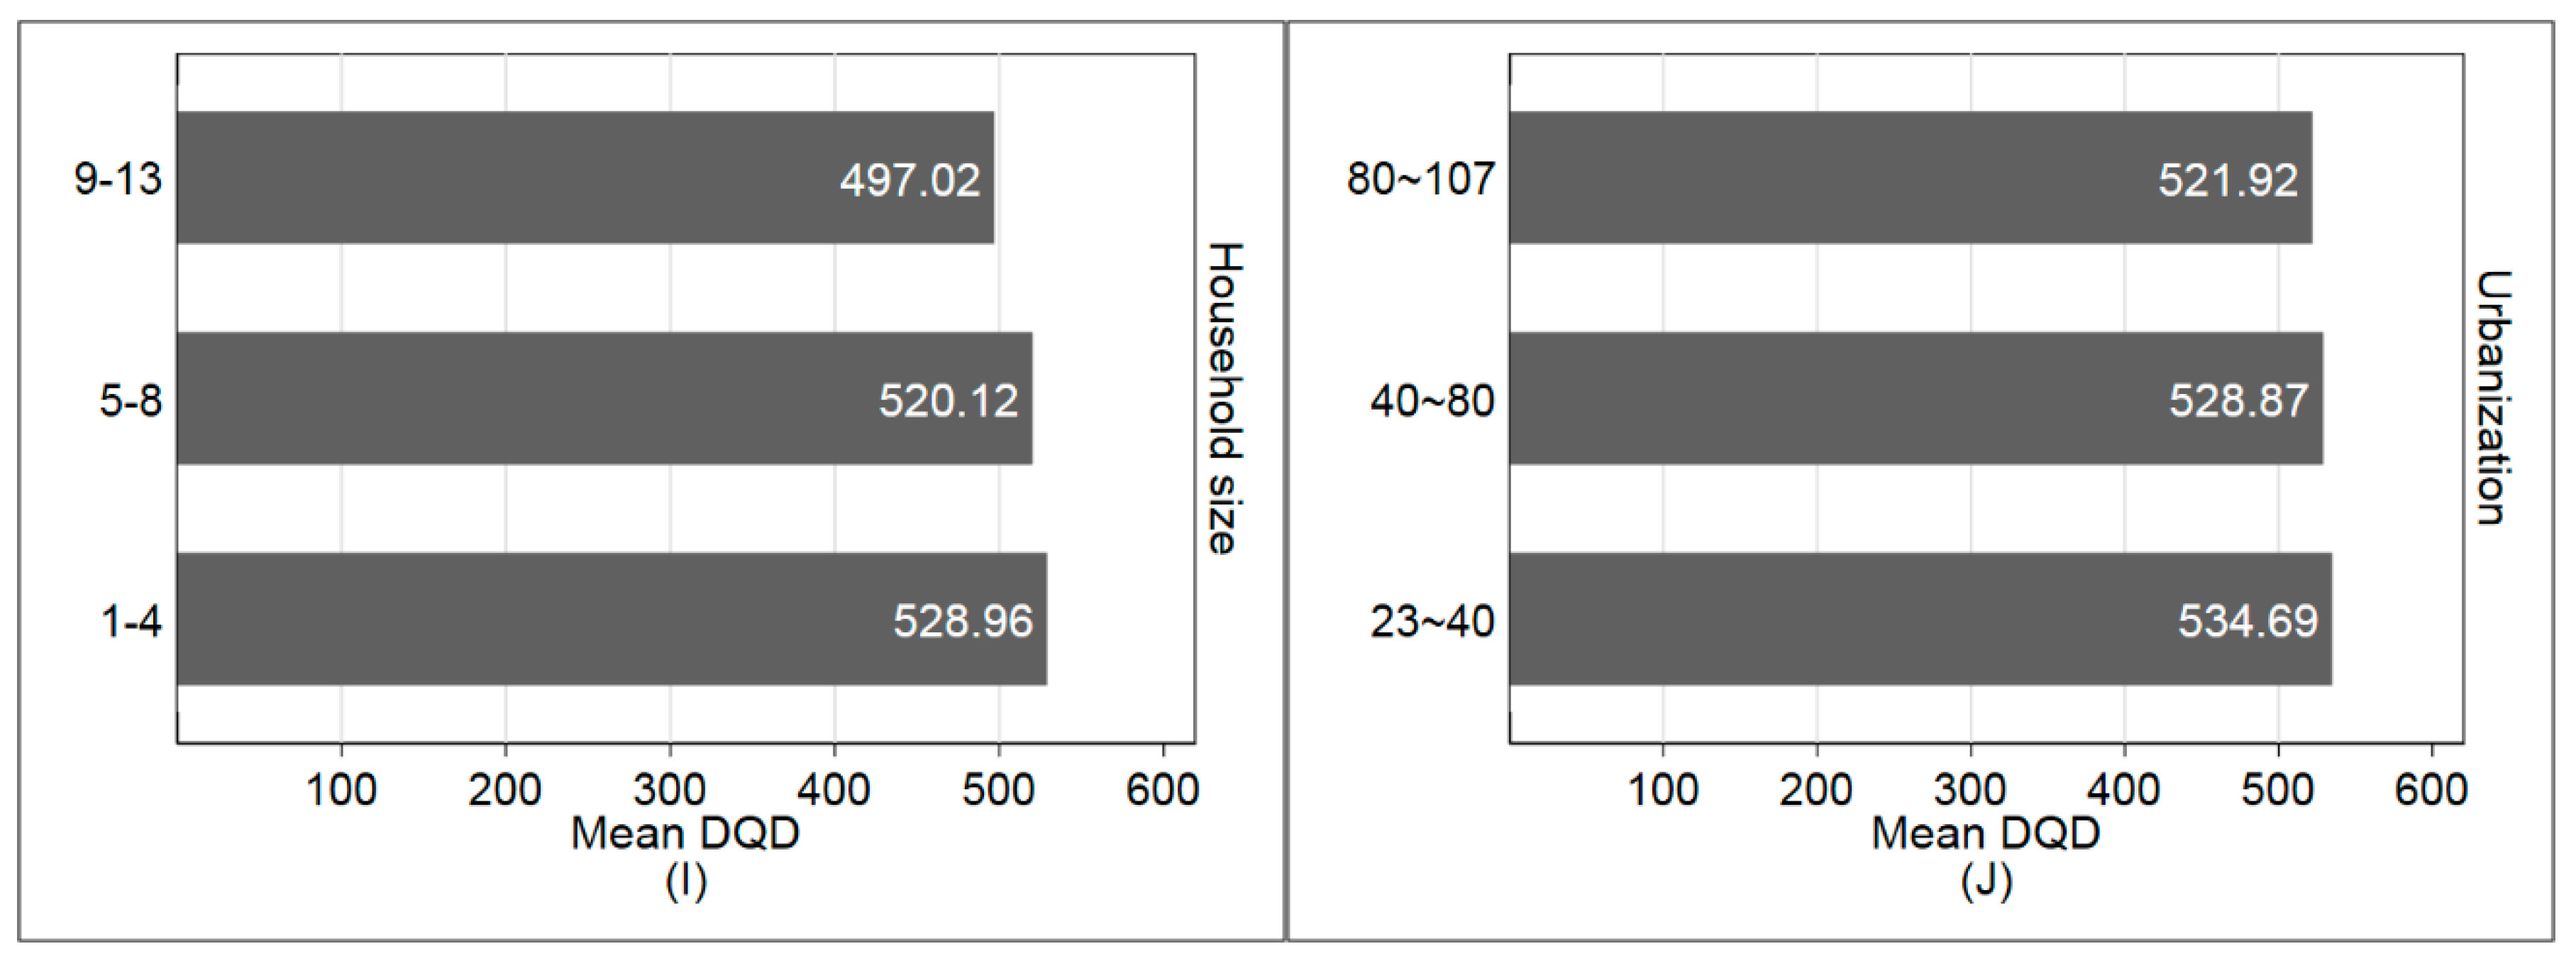
3.3. DQD for Different Subpopulation
3.4. DQD and Its Influential Factors
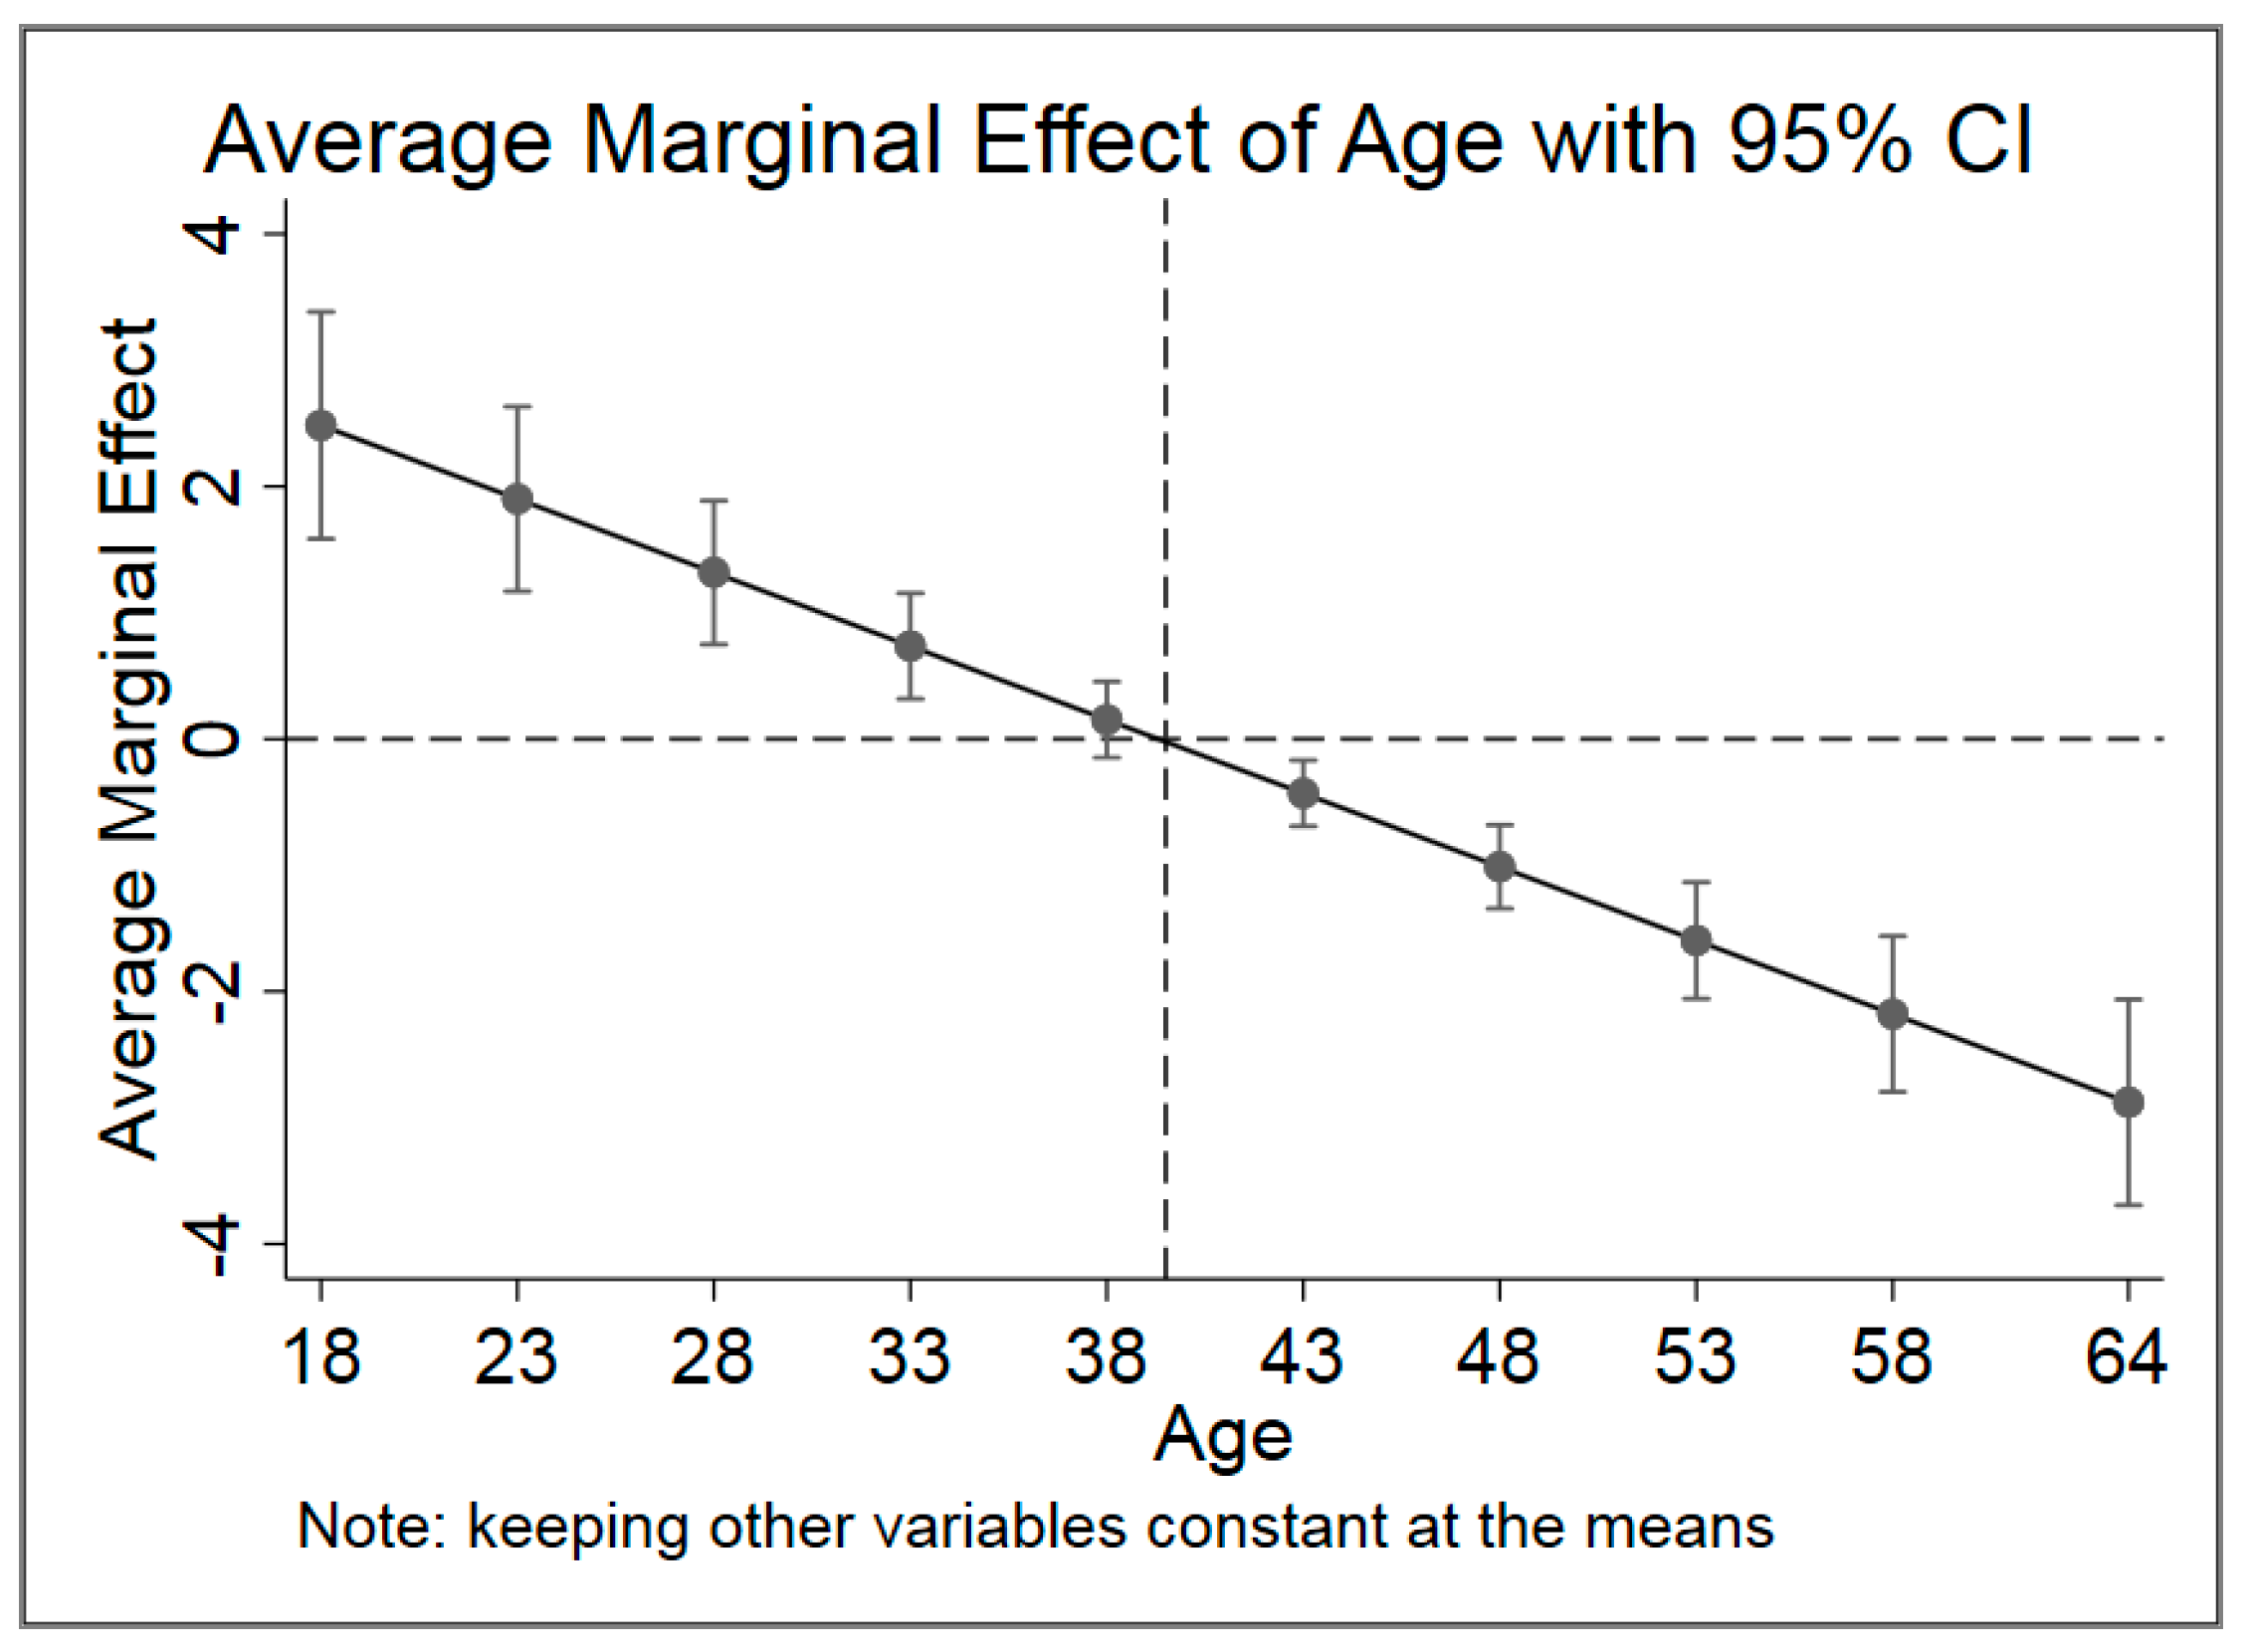
3.4.1. Multivariate Ordinary Least Squares Regression
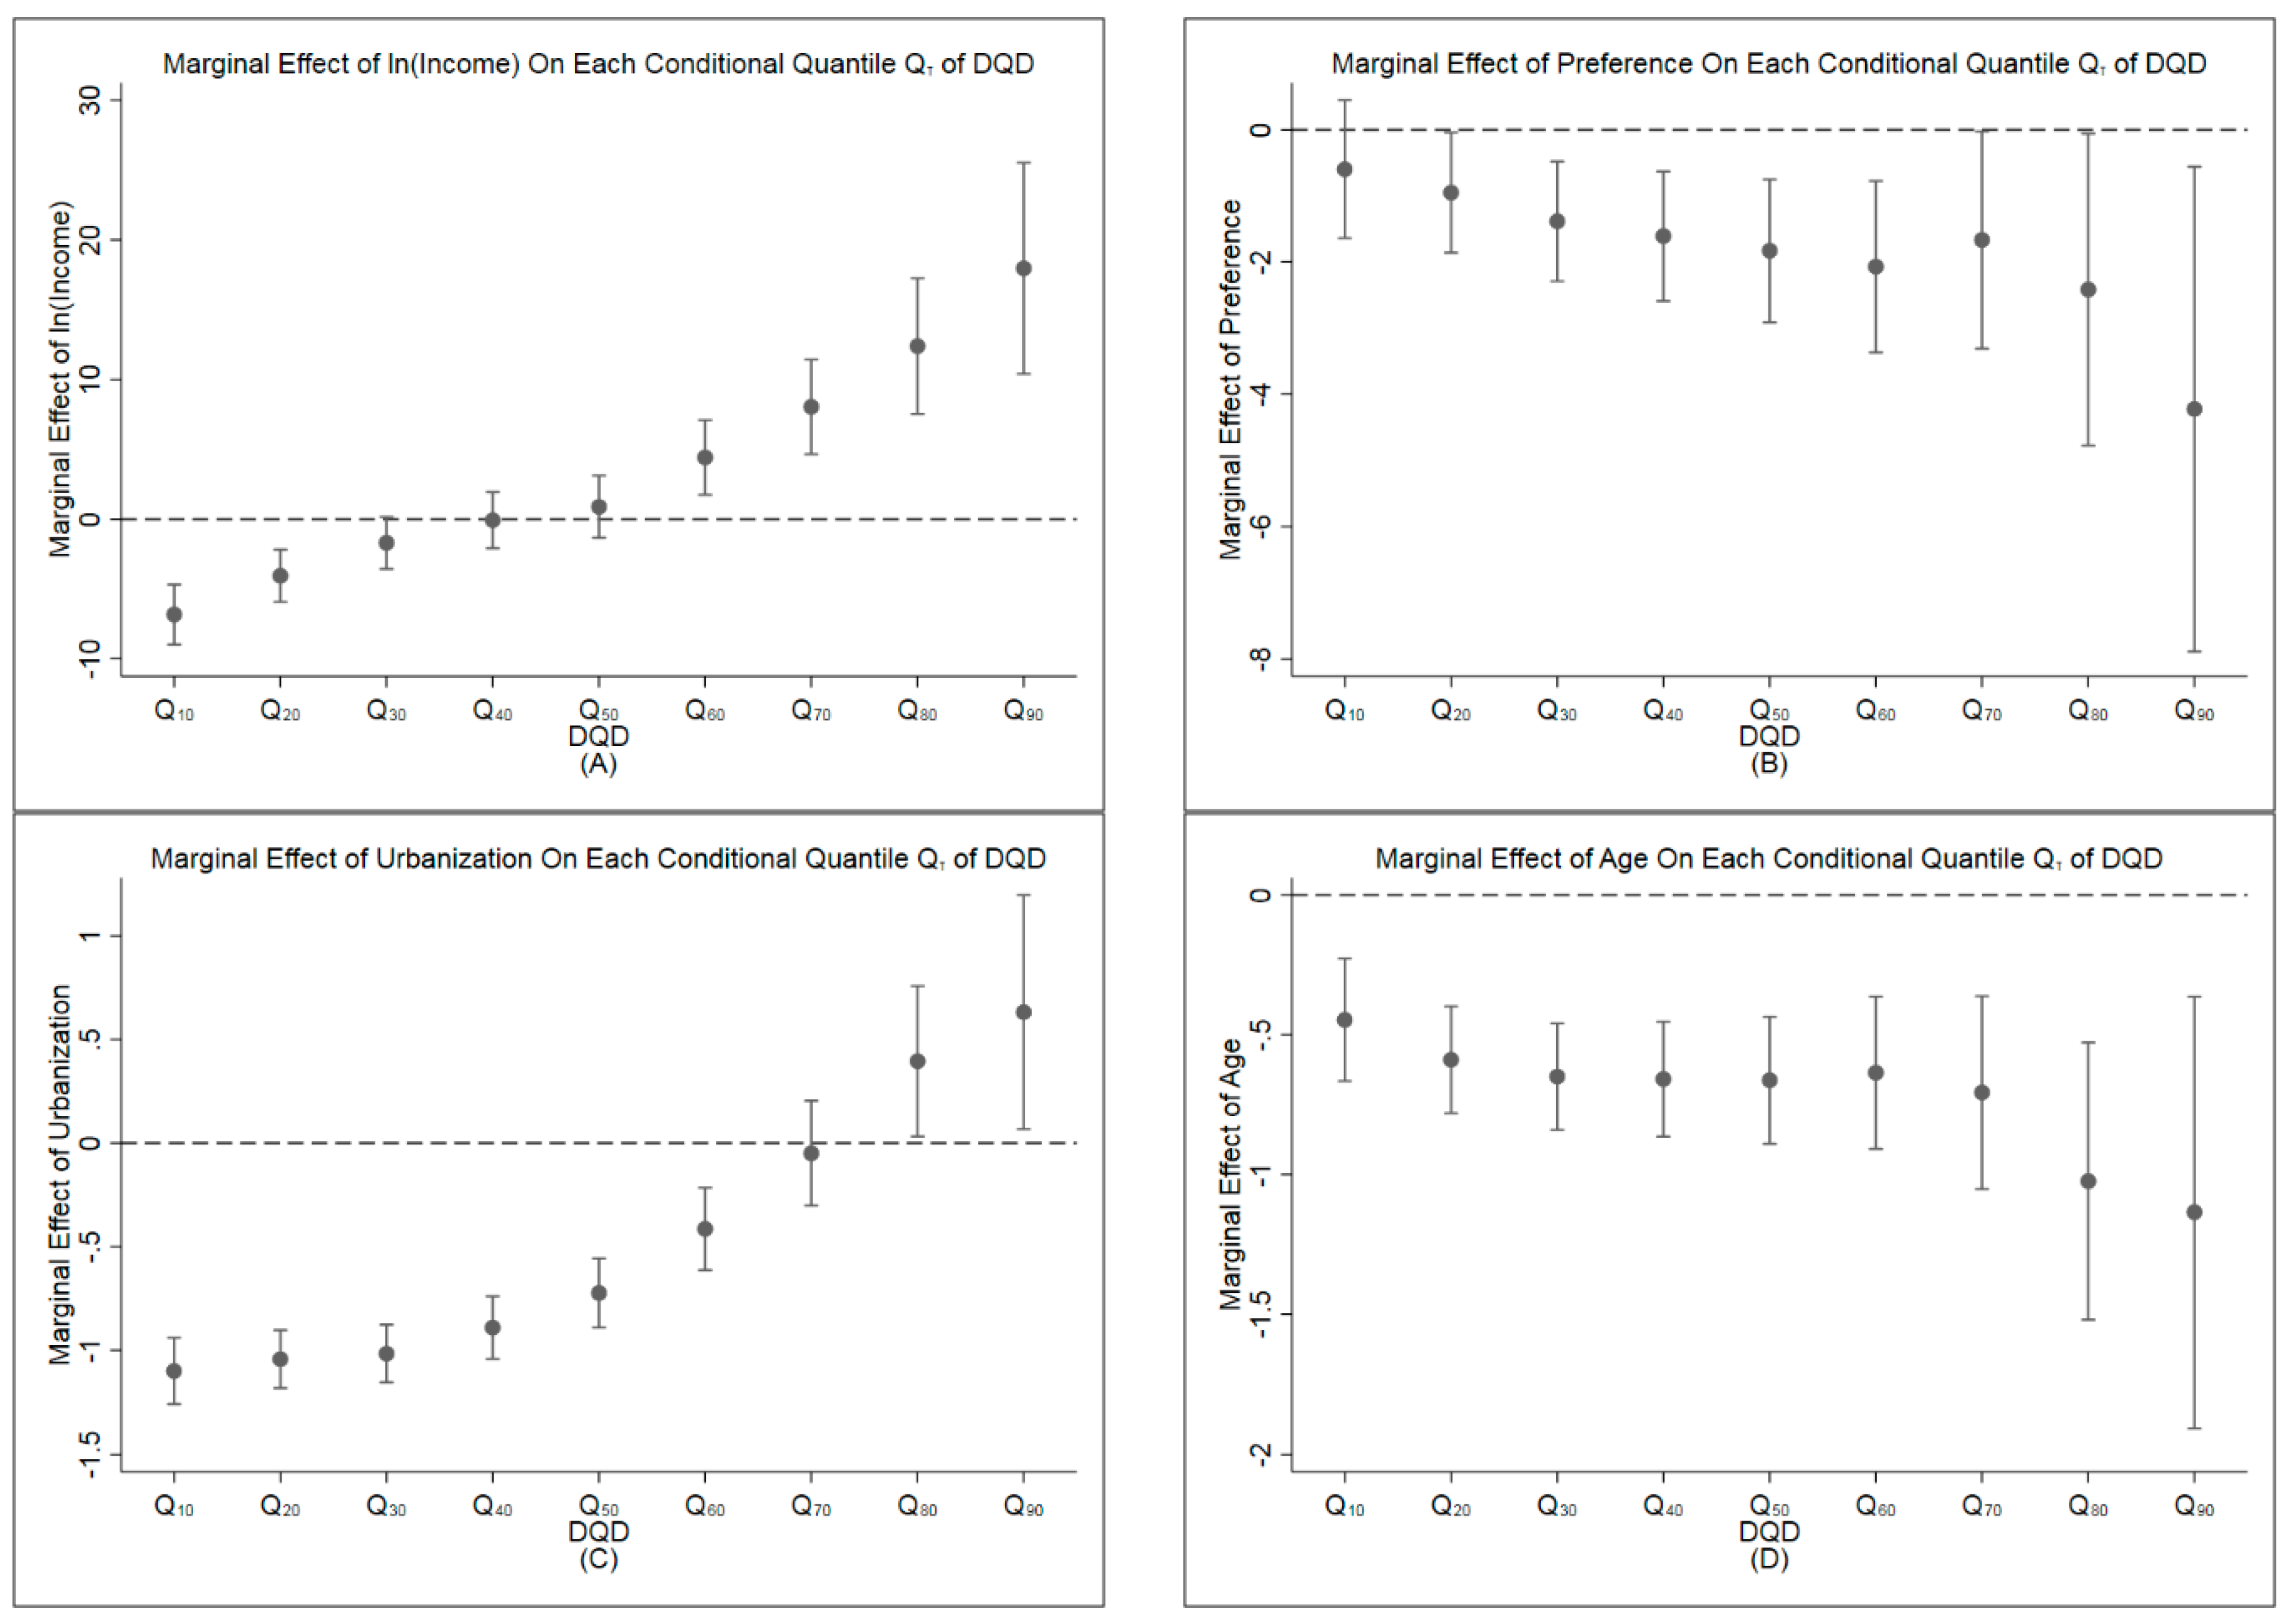
3.4.2. Multivariate Quantile Regressions
3.5. Relationships between DQD and BMI
4. Discussion
4.1. Structural Changes of the DQD over 2004–2011
4.2. The Influencial Factors of DQD
4.3. The Impacts of DQD on BMI
4.4. Limitations
5. Conclusions
Author Contributions
Acknowledgments
Conflicts of Interest
References
- Huang, Y.; Hui, W.; Xu, T.; Health, P. Changing Diet Quality in China during 2004–2011. Int. J. Environ. Res. Public Health 2017, 14, 13. [Google Scholar] [CrossRef]
- Huang, Y.; Tian, X. Food accessibility, diversity of agricultural production and dietary pattern in rural China. Food Policy 2019, 84, 92–102. [Google Scholar] [CrossRef]
- Guo, X.; Mroz, T.A.; Popkin, B.M.; Zhai, F. Structural Change in the Impact of Income on Food Consumption in China, 1989–1993. Econ. Dev. Cult. Chang. 2000, 48, 737–760. [Google Scholar] [CrossRef]
- Tian, X.; Huang, Y.; Wang, H. Deviation of Chinese Adults’ Diet from the Chinese Food Pagoda 2016 and Its Association with Adiposity. Nutrients 2017, 9, 995. [Google Scholar] [CrossRef] [PubMed]
- Tian, X.; Yu, X. Using semiparametric models to study nutrition improvement and dietary change with different indices: The case of China. Food Policy 2015, 53, 67–81. [Google Scholar] [CrossRef]
- Ren, Y.; Li, H.; Wang, X. Family income and nutrition-related health: Evidence from food consumption in China. Soc. Sci. Med. 2019, 232, 58–76. [Google Scholar] [CrossRef] [PubMed]
- Liu, J.; Shively, G.E.; Binkley, J.K. Access to variety contributes to dietary diversity in China. Food Policy 2014, 49, 323–331. [Google Scholar] [CrossRef]
- Gordonlarsen, P.; Wang, H.; Popkin, B.M. Overweight dynamics in Chinese children and adults. Obes. Rev. 2013, 15, 37–48. [Google Scholar] [CrossRef]
- Geng, X.; Zhang, F.; Wang, Y.; Fan, L.; Yao, Y. Health goal priming decreases high-calorie food consumption. Acta Psychol. Sin. 2018, 50, 840–847. (in Chinese). [Google Scholar]
- Kim, S.; Haines, P.S.; Siega-Riz, A.M.; Popkin, B.M. The Diet Quality Index-International (DQI-I) Provides an Effective Tool for Cross-National Comparison of Diet Quality as Illustrated by China and the United States. J. Nutr. 2003, 133, 3476–3484. [Google Scholar] [CrossRef]
- Leila, A.; Parvin, M.; Ahmad, E.; Fereidoun, A. Dietary diversity score and cardiovascular risk factors in Tehranian adults. Public Health Nutr. 2006, 9, 728–736. [Google Scholar]
- Salas-Salvadó, J.; Martinez-González, M.Á.; Bulló, M.; Ros, E. The role of diet in the prevention of type 2 diabetes. Nutr. Metab. Cardiovasc. Dis. 2011, 21, B32–B48. [Google Scholar] [CrossRef] [PubMed]
- Narmaki, E.; Siassi, F.; Fariba, K.; Qorbani, M.; Shiraseb, F.; Ataie-Jafari, A.; Sotoudeh, G. Dietary diversity as a proxy measure of blood antioxidant status in women. Nutrition 2015, 31, 722–726. [Google Scholar] [CrossRef] [PubMed]
- Larsson, S.C.; Åkesson, A.; Wolk, A. Overall diet quality and risk of stroke: A prospective cohort study in women. Atherosclerosis 2014, 233, 27–29. [Google Scholar] [CrossRef] [PubMed]
- Whitcomb, E.A.; Chiu, C.-J.; Taylor, A. Dietary glycemia as a determinant of health and longevity. Mol. Asp. Med. 2015, 46, 14–20. [Google Scholar] [CrossRef] [PubMed]
- Li, Y.; He, Y.; Lai, J.; Wang, D.; Zhang, J.; Fu, P.; Yang, X.; Qi, L. Dietary Patterns Are Associated with Stroke in Chinese Adults. J. Nutr. 2011, 141, 1834–1839. [Google Scholar] [CrossRef] [PubMed]
- McCullough, M.L.; Feskanich, D.; Stampfer, M.J.; Giovannucci, E.L.; Rimm, E.B.; Hu, F.B.; Spiegelman, D.; Hunter, D.J.; Colditz, G.A.; Willett, W.C. Diet quality and major chronic disease risk in men and women: Moving toward improved dietary guidance. Am. J. Clin. Nutr. 2003, 76, 1261–1271. [Google Scholar] [CrossRef]
- Shatenstein, B.; Nadon, S.; Godin, C.; Ferland, G. Diet Quality of Montreal-Area Adults Needs Improvement: Estimates from a Self-Administered Food Frequency Questionnaire Furnishing a Dietary Indicator Score. J. Am. Diet. Assoc. 2005, 105, 1251–1260. [Google Scholar] [CrossRef]
- Guenther, P.M.; Reedy, J.; Krebs-Smith, S.M. Development of the Healthy Eating Index-2005. J. Am. Diet. Assoc. 2008, 108, 1896–1901. [Google Scholar] [CrossRef]
- Woodruff, S.; Hanning, R. Development and implications of a revised Canadian Healthy Eating Index (HEIC-2009). Public Health Nutr. 2010, 13, 820–825. [Google Scholar] [CrossRef]
- Guenther, P.M.; Casavale, K.O.; Reedy, J.; Kirkpatrick, S.I.; Hiza, H.A.B.; Kuczynski, K.J.; Kahle, L.L.; Krebs-Smith, S.M. Update of the Healthy Eating Index: HEI-2010. J. Acad. Nutr. Diet. 2013, 113, 569–580. [Google Scholar] [CrossRef] [PubMed]
- Krebs-Smith, S.M.; Pannucci, T.E.; Subar, A.F.; Kirkpatrick, S.I.; Lerman, J.L.; Tooze, J.A.; Wilson, M.M.; Reedy, J. Update of the Healthy Eating Index: HEI-2015. J. Acad. Nutr. Diet. 2018, 118, 1591–1602. [Google Scholar] [CrossRef] [PubMed]
- Haines, P.S.; Siega-Riz, A.M.; Popkin, B.M. The Diet Quality Index Revised: A measurement instrument tor populations. Eur. Geriatr. Med. 1999, 99, 697–704. [Google Scholar]
- Gerber, M.J.; Scali, J.D.; Michaud, A.; Durand, M.D.; Astre, C.M.; Dallongeville, J.; Romon, M.M. Profiles of a Healthful Diet and its Relationship to Biomarkers in a Population Sample from Mediterranean Southern France. J. Am. Diet. Assoc. 2000, 100, 1164–1171. [Google Scholar] [CrossRef]
- Trichopoulou, A.; Costacou, T.; Bamia, C.; Trichopoulos, D. Adherence to a Mediterranean Diet and Survival in a Greek Population. N. Engl. J. Med. 2003, 348, 2599–2608. [Google Scholar] [CrossRef] [PubMed]
- Panagiotakos, D.B.; Pitsavos, C.; Stefanadis, C. Dietary patterns: A Mediterranean diet score and its relation to clinical and biological markers of cardiovascular disease risk. Nutr. Metab. Cardiovasc. Dis. 2006, 16, 559–568. [Google Scholar] [CrossRef]
- Stookey, J.D.; Wang, Y.; Ge, K.; Lin, H.; Popkin, B.M. Measuring diet quality in china: The INFH-UNC-CH diet quality index. Eur. J. Clin. Nutr. 2000, 54, 811–821. [Google Scholar] [CrossRef]
- Xu, X.; Hall, J.; Byles, J.; Shi, Z. Assessing Dietary Quality of Older Chinese People Using the Chinese Diet Balance Index (DBI). PLoS ONE 2015, 10, e0121618. [Google Scholar] [CrossRef]
- Batis, C.; Mendez, M.A.; Gordon-Larsen, P.; Sotres-Alvarez, D.; Adair, L.; Popkin, B. Using both principal component analysis and reduced rank regression to study dietary patterns and diabetes in Chinese adults. Public Health Nutr. 2016, 19, 195–203. [Google Scholar] [CrossRef]
- Hong, X.; Xu, F.; Wang, Z.; Liang, Y.; Li, J. Dietary patterns and the incidence of hyperglyacemia in China. Public Health Nutr. 2016, 19, 131–141. [Google Scholar] [CrossRef]
- Zeng, F.F.; Xue, W.Q.; Cao, W.T.; Wu, B.H.; Xie, H.L.; Fan, F.; Zhu, H.L.; Chen, Y.M. Diet-quality scores and risk of hip fractures in elderly urban Chinese in Guangdong, China: A case–control study. Osteoporos. Int. 2014, 25, 2131–2141. [Google Scholar] [CrossRef] [PubMed]
- Cheng, G.; Duan, R.; Kranz, S.; Libuda, L.; Zhang, L. Development of a Dietary Index to Assess Overall Diet Quality for Chinese School-Aged Children: The Chinese Children Dietary Index. J. Acad. Nutr. Diet. 2016, 116, 608–617. [Google Scholar] [CrossRef] [PubMed]
- Chan, R.; Leung, J.; Woo, J. A Prospective Cohort Study to Examine the Association Between Dietary Patterns and Sarcopenia in Chinese Community-Dwelling Older People in Hong Kong. J. Am. Med. Dir. Assoc. 2016, 17, 336–342. [Google Scholar] [CrossRef] [PubMed]
- Xu, X.; Hall, J.; Byles, J.; Shi, Z. Do older Chinese people’s diets meet the Chinese Food Pagoda guidelines? Results from the China Health and Nutrition Survey 2009. Public Health Nutr. 2015, 18, 3020–3030. [Google Scholar] [CrossRef]
- Zhou, D.; Yu, X. Calorie Elasticities with Income Dynamics: Evidence from the Literature. Appl. Econ. Perspect. Policy 2015, 37, 575–601. [Google Scholar] [CrossRef]
- Jensen, R.T.; Miller, N.H. A Revealed Preference Approach to Measuring Hunger and Undernutrition; National Bureau of Economic Research, Inc.: Cambridge, MA, USA, 2010. [Google Scholar]
- Salois, M.; Tiffin, R.; Balcombe, K. Impact of Income on Nutrient Intakes: Implications for Undernourishment and Obesity. J. Dev. Stud. 2012, 48, 1716–1730. [Google Scholar] [CrossRef]
- Tian, X.; Yu, X. The demand for nutrients in China. Front. Econ. China 2013, 8, 186–206. [Google Scholar] [CrossRef]
- Popkin, B.M.; Du, S.; Zhai, F.; Zhang, B. Cohort Profile: The China Health and Nutrition Survey—Monitoring and understanding socio-economic and health change in China, 1989–2011. Int. J. Epidemiol. 2009, 39, 1435–1440. [Google Scholar] [CrossRef]
- Zhang, B.; Zhai, F.Y.; Du, S.F.; Popkin, B.M. The China Health and Nutrition Survey, 1989-2011. Obes. Rev. 2014, 15, 2–7. [Google Scholar] [CrossRef]
- Rothermel, J.; Reinehr, T. Metabolic alterations in paediatric GH deficiency. Best Pract. Res. Clin. Endocrinol. Metab. 2016, 30, 757–770. [Google Scholar] [CrossRef]
- Shudai, L.; Li, C.; Li, C.; Zhang, X. Growth Hormone Receptor Mutations Related to Individual Dwarfism. Int. J. Mol. Sci. 2018, 19, 1433. [Google Scholar] [CrossRef]
- Chhabra, Y.; Nelson, C.N.; Plescher, M.; Barclay, J.L.; Smith, A.G.; Andrikopoulos, S.; Mangiafico, S.; Waxman, D.J.; Brooks, A.J.; Waters, M.J. Loss of growth hormone–mediated signal transducer and activator of transcription 5 (STAT5) signaling in mice results in insulin sensitivity with obesity. FASEB J. 2019, 33, 6412–6430. [Google Scholar] [CrossRef] [PubMed]
- Society, C.N. Principle of Chinese Dietary Guideline 2016; People’s Medical Publishing House: Beijing, China, 2016. [Google Scholar]
- Zhai, F.Y.; Du, S.F.; Wang, Z.H.; Zhang, J.G.; Du, W.W.; Popkin, B.M. Dynamics of the Chinese diet and the role of urbanicity, 1991–2011. Obes. Rev. 2014, 15, 16–26. [Google Scholar] [CrossRef] [PubMed]
- Center, C.P. China Health and Nutrition Survey. Available online: http://www.cpc.unc.edu/projects/china (accessed on 25 December 2019).
- World Health Organization. Physical Status: The Use and Interpretation of Anthropometry; World Health Organization: Geneva, Switzerland, 1995; Volume 854, pp. 1–452. [Google Scholar]
- Alkerwi, A.A.; Baydarlioglu, B.; Sauvageot, N.; Stranges, S.; Lemmens, P.; Shivappa, N.; Hébert, J.R. Smoking status is inversely associated with overall diet quality: Findings from the ORISCAV-LUX study. Clin. Nutr. 2017, 36, 1275–1282. [Google Scholar] [CrossRef] [PubMed]
- Hiza, H.A.B.; Casavale, K.O.; Guenther, P.M.; Davis, C.A. Diet Quality of Americans Differs by Age, Sex, Race/Ethnicity, Income, and Education Level. J. Acad. Nutr. Diet. 2013, 113, 297–306. [Google Scholar] [CrossRef] [PubMed]
- Rosário, R.; Santos, R.; Lopes, L.; Agostinis-Sobrinho, C.; Moreira, C.; Mota, J.; Póvoas, S.; Oliveira, A.; Padrão, P.; Moreira, P.; et al. Fruit, vegetable consumption and blood pressure in healthy adolescents: A longitudinal analysis from the LabMed study. Nutr. Metab. Cardiovasc. Dis. 2018, 28, 1075–1080. [Google Scholar] [CrossRef] [PubMed]
- Al-Ghannami, S.; Al-Shammakhi, S.; Al Jawaldeh, A.; Al-Mamari, F.; Gammaria, I.; Al-Aamry, J.; Mabry, R. Rapid assessment of marketing of unhealthy foods to children in mass media, schools and retail stores in Oman. East. Mediterr. Health J. 2019, 25. [Google Scholar] [CrossRef]
- Azeredo, C.M.; de Rezende, L.F.M.; Canella, D.S.; Claro, R.M.; Peres, M.F.T.; Luiz, O.D.C.; França-Junior, I.; Kinra, S.; Hawkesworth, S.; Levy, R.B. Food environments in schools and in the immediate vicinity are associated with unhealthy food consumption among Brazilian adolescents. Prev. Med. 2016, 88, 73–79. [Google Scholar] [CrossRef]
- Jones-Smith, J.C.; Popkin, B.M. Understanding community context and adult health changes in China: Development of an urbanicity scale. Soc. Sci. Med. 2010, 71, 1436–1446. [Google Scholar] [CrossRef]
- Kang, M.; Park, S.-Y.; Shvetsov, Y.B.; Wilkens, L.R.; Marchand, L.L.; Boushey, C.J.; Paik, H.-Y. Gender differences in sociodemographic and lifestyle factors associated with diet quality in a multiethnic population. Nutrition 2019, 66, 147–152. [Google Scholar] [CrossRef]
- Wilson, J.E.; Blizzard, L.; Gall, S.L.; Magnussen, C.G.; Oddy, W.H.; Dwyer, T.; Venn, A.J.; Smith, K.J. An age- and sex-specific dietary guidelines index is a valid measure of diet quality in an Australian cohort during youth and adulthood. Nutr. Res. 2019, 65, 43–53. [Google Scholar] [CrossRef] [PubMed]
- Darmon, N.; Drewnowski, A. Does Social Class Predict Diet Quality? Am. J. Clin. Nutr. 2008, 87, 1107–1117. [Google Scholar] [CrossRef] [PubMed]
- Du, S.; Mroz, T.A.; Zhai, F.; Popkin, B.M. Rapid income growth adversely affects diet quality in China—particularly for the poor! Soc. Sci. Med. 2004, 59, 1505–1515. [Google Scholar] [CrossRef] [PubMed]
- De Paula Matos Souza, J.; Magela de Lima, M.; Martins Horta, P. Diet Quality among the Brazilian Population and Associated Socioeconomic and Demographic Factors: Analysis from the National Dietary Survey 2008-2009. J. Acad. Nutr. Diet. 2019, 119, 1866–1874. [Google Scholar] [CrossRef] [PubMed]
- Fanzo, J. The role of farming and rural development as central to our diets. Physiol. Behav. 2018, 193, 291–297. [Google Scholar] [CrossRef] [PubMed]
- Nie, P.; Ding, L.; Sousa-Poza, A. Decomposing adult obesity trends in China (1991–2011). Econ. Hum. Biol. 2019, 34, 5–15. [Google Scholar] [CrossRef]
- Miao, J.; Wu, X. Urbanization, socioeconomic status and health disparity in China. Health Place 2016, 42, 87–95. [Google Scholar] [CrossRef]
- Gao, Z.; Yu, X.; Lee, J.Y. Consumer demand for diet quality: Evidence from the healthy eating index. Aust. J. Agric. Resour. Econ. 2013, 57, 301–319. [Google Scholar] [CrossRef]


| Category | Food Group | Recommended Intake(g/d) | China Food Composition Table CFCT 2002/2004 (Ingredient Code) |
|---|---|---|---|
| 1 | Cereal and Potatoes | (250, 400) | (11.101, 22.203) |
| 2 | Fruits | (200, 350) | (61.101, 66.206) |
| 3 | Vegetables | (300, 500) | (41.101, 52.011) |
| 4 | Eggs | (40, 50) | (111.101, 114.201) |
| 5 | Aquatic Products | (40, 75) | (121.101, 129.302) |
| 6 | Meat and Poultry | (40, 75) | (81.101, 99.004) |
| 7 | Legumes and Nuts | (25, 35) | (31.101, 39.902), (71.001, 72.026) |
| 8 | Milk & Milk Products | 300+ | (101.101, 109.006) |
| Variable | Description | Mean | SD 1 |
|---|---|---|---|
| DQD | Divergence between real food consumption and CFP 2016 (%) | 527.93 | 228.10 |
| ln(income) | Log per capital income (ln(Yuan/year/capita)) | 8.97 | 1.08 |
| Preference 2 | Sum of preferences for food | 17.89 | 2.13 |
| Urbanization 3 | Urbanization index | 66.60 | 19.97 |
| Region | Dummy for urban = 1 and rural = 0 | 0.33 | 0.47 |
| Urban | The proportion of urban resident (%) | 32.63 | 0.00 |
| Rural | The proportion of rural resident (%) | 67.37 | 0.00 |
| Age | The age of the respondent (years) | 44.83 | 11.73 |
| Gender | Dummy for male = 1 and female = 0 | 0.47 | 0.50 |
| Male | The proportion of male (%) | 47.22 | 0.00 |
| Female | The proportion of female (%) | 52.78 | 0.00 |
| Labor intensity 4 | Level of labor intensity (level) | 2.64 | 1.21 |
| Education | Years of regular school education (years) | 8.34 | 3.93 |
| Meals at home | Proportion of dining at home per day (%) | 2.59 | 0.66 |
| Drinking 5 | Frequency of drinking alcohol (level) | 2.12 | 1.75 |
| Smoking | Number of cigarettes consumed per day | 4.73 | 9.01 |
| Exercise | Exercises time per day (minutes) | 14.21 | 54.82 |
| Sedentary | Sedentary activities time per day (hours) | 5.75 | 4.10 |
| Household size | Number of family members (persons) | 3.74 | 1.48 |
| Teens (aged 6–17) | Proportion of teens aged 6–17 in the family (%) | 8.53 | 14.09 |
| Elders (over 64) | Proportion of elders over 64 in the family (%) | 4.10 | 11.23 |
| Y2006 | Dummy variable for 2006 (%) | 22.51 | 0.00 |
| Y2009 | Dummy variable for 2009 (%) | 23.71 | 0.00 |
| Y2011 | Dummy variable for 2011 (%) | 30.47 | 0.00 |
| DQD | Coefficient | Robust SE | 95% CI of Coef. | Marginal Effect | SE | 95% CI of Marginal Effect |
|---|---|---|---|---|---|---|
| ln(income) | 30.579 *** | 10.299 | (10.393, 50.766) | 5.120 *** | 1.268 | (2.635, 7.605) |
| Preference | 14.572 *** | 5.235 | (4.310, 24.834) | −1.759 *** | 0.669 | (−3.071, −0.447) |
| Urbanization | −1.354 *** | 0.512 | (−2.358, −0.349) | −0.395 *** | 0.099 | (−0.588, −0.201) |
| ln(income)*Preference | −1.821 *** | 0.581 | (−2.960, −0.682) | |||
| ln(income)*Urbanization | 0.107 * | 0.059 | (−0.008, 0.222) | |||
| Region | 26.392 *** | 3.906 | (18.736, 34.048) | |||
| Age | 4.582 *** | 0.776 | (3.061, 6.104) | −0.644 *** | 0.141 | (−0.919, −0.368) |
| Age_square | −0.058 *** | 0.009 | (−0.076, −0.041) | |||
| Gender | 38.468 *** | 3.462 | (31.681, 45.254) | |||
| Labor intensity | 5.259 *** | 1.401 | (2.512, 8.005) | |||
| Education | −2.368 *** | 0.437 | (−3.224, −1.512) | |||
| Meals at home | −9.614 *** | 2.341 | (−14.203, −5.025) | |||
| Drinking | 6.886 *** | 0.977 | (4.971, 8.801) | |||
| Smoking | 0.421 ** | 0.189 | (0.051, 0.791) | |||
| Exercise | 0.025 | 0.026 | (−0.025, 0.076) | |||
| Sedentary | 0.308 | 0.361 | (−0.399, 1.016) | |||
| Household size | −3.381 *** | 0.987 | (−5.315, −1.447) | |||
| Teens (aged 6–17) | −0.655 *** | 0.091 | (−0.833, −0.476) | |||
| Elders (over 64) | −0.181 | 0.118 | (−0.412, 0.051) | |||
| Y2006 | 4.122 | 3.782 | (−3.292, 11.536) | |||
| Y2009 | −0.283 | 3.887 | (−7.902, 7.336) | |||
| Y2011 | −30.888 *** | 3.837 | (−38.409, −23.367) | |||
| Constant | 243.807 *** | 94.032 | (59.500, 428.113) | |||
| F (22, 30,603) | 38.95 | |||||
| p value > F | < 0.001 |
| Quantile | QR_10 | QR_20 | QR_30 | QR_40 | QR_50 | QR_60 | QR_70 | QR_80 | QR_90 |
|---|---|---|---|---|---|---|---|---|---|
| ln(income) | –6.505 | 5.288 | 14.170 ** | 17.588 ** | 32.112 *** | 27.960 *** | 28.994 ** | 48.398 *** | 62.441 ** |
| (8.317) | (7.260) | (7.220) | (7.809) | (8.619) | (10.337) | (13.095) | (18.807) | (29.244) | |
| Preference | 2.201 | 6.109 * | 9.544 *** | 9.854 ** | 15.862 *** | 13.273 *** | 13.440 ** | 20.332 ** | 20.184 |
| (4.128) | (3.604) | (3.583) | (3.876) | (4.278) | (5.130) | (6.499) | (9.334) | (14.515) | |
| Urbanization | –1.808 *** | –1.682 *** | –1.816 *** | –1.592 *** | –1.272 *** | –1.367 ** | –1.287 * | –0.867 | 0.064 |
| (0.457) | (0.399) | (0.397) | (0.429) | (0.473) | (0.568) | (0.719) | (1.033) | (1.606) | |
| ln(income) * Preference | –0.312 | –0.787 ** | –1.218 *** | –1.278 *** | –1.972 *** | –1.711 *** | –1.684 ** | –2.536 ** | –2.721 * |
| (0.452) | (0.394) | (0.392) | (0.424) | (0.468) | (0.561) | (0.711) | (1.022) | (1.589) | |
| ln(income) * Urbanization | 0.079 | 0.071 | 0.089 ** | 0.078 | 0.061 | 0.106 * | 0.138 * | 0.141 | 0.063 |
| (0.051) | (0.045) | (0.044) | (0.048) | (0.053) | (0.063) | (0.080) | (0.115) | (0.180) | |
| Region | 10.854 *** | 15.688 *** | 19.343 *** | 21.634 *** | 22.624 *** | 21.142 *** | 25.839 *** | 34.378 *** | 49.154 *** |
| (3.024) | (2.640) | (2.625) | (2.840) | (3.134) | (3.759) | (4.762) | (6.839) | (10.634) | |
| Age | 1.703 *** | 1.829 *** | 2.621 *** | 3.040 *** | 3.858 *** | 4.304 *** | 4.728 *** | 6.110 *** | 11.897 *** |
| (0.654) | (0.571) | (0.568) | (0.614) | (0.678) | (0.813) | (1.030) | (1.479) | (2.299) | |
| Age_square | –0.024 *** | –0.027 *** | –0.036 *** | –0.041 *** | –0.050 *** | –0.055 *** | –0.061 *** | –0.080 *** | –0.145 *** |
| (0.008) | (0.007) | (0.007) | (0.007) | (0.008) | (0.009) | (0.012) | (0.017) | (0.027) | |
| Gender | 26.722 *** | 25.936 *** | 27.464 *** | 31.401 *** | 36.298 *** | 41.473 *** | 47.039 *** | 54.189 *** | 63.629 *** |
| (2.744) | (2.395) | (2.382) | (2.576) | (2.843) | (3.410) | (4.320) | (6.204) | (9.647) | |
| Labor intensity | 4.375 *** | 4.186 *** | 4.322 *** | 4.742 *** | 4.921 *** | 5.848 *** | 7.327 *** | 8.360 *** | 4.811 |
| (1.164) | (1.016) | (1.011) | (1.093) | (1.207) | (1.447) | (1.833) | (2.633) | (4.094) | |
| Education | –2.460 *** | –2.473 *** | –2.353 *** | –2.295 *** | –2.028 *** | –2.033 *** | –2.068 *** | –2.775 *** | –3.500 *** |
| (0.349) | (0.304) | (0.303) | (0.327) | (0.361) | (0.433) | (0.549) | (0.788) | (1.226) | |
| Meals at home | –1.667 | 0.579 | –2.352 * | –3.009 ** | –5.038 *** | –5.477 *** | –9.017 *** | –10.606 *** | –35.716 *** |
| (1.635) | (1.427) | (1.419) | (1.535) | (1.694) | (2.032) | (2.574) | (3.697) | (5.748) | |
| Drinking | 0.005 | 1.988 *** | 2.889 *** | 3.793 *** | 5.425 *** | 6.025 *** | 8.620 *** | 14.036 *** | 15.066 *** |
| (0.728) | (0.636) | (0.632) | (0.684) | (0.755) | (0.905) | (1.147) | (1.647) | (2.561) | |
| Smoking | 0.288 ** | 0.330 *** | 0.537 *** | 0.412 *** | 0.310 ** | 0.278 | 0.241 | –0.059 | –0.135 |
| (0.139) | (0.121) | (0.120) | (0.130) | (0.144) | (0.172) | (0.218) | (0.313) | (0.487) | |
| Exercise | –0.023 | –0.015 | 0.007 | 0.003 | 0.001 | 0.033 | 0.056 * | 0.101 ** | 0.045 |
| (0.020) | (0.017) | (0.017) | (0.018) | (0.020) | (0.024) | (0.031) | (0.044) | (0.069) | |
| Sedentary | –0.566 ** | –0.583 ** | –0.463 * | –0.196 | –0.065 | 0.177 | 0.618 | 1.266 ** | 1.843 * |
| (0.279) | (0.243) | (0.242) | (0.261) | (0.289) | (0.346) | (0.438) | (0.630) | (0.979) | |
| Household size | –0.776 | –1.505 ** | –1.699 *** | –1.802 ** | –2.879 *** | –3.159 *** | –4.589 *** | –6.344 *** | –11.539 *** |
| (0.764) | (0.667) | (0.663) | (0.717) | (0.792) | (0.950) | (1.203) | (1.728) | (2.686) | |
| Teens (aged 6–17) | –0.122 | –0.243 *** | –0.306 *** | –0.295 *** | –0.357 *** | –0.439 *** | –0.566 *** | –0.872 *** | –1.373 *** |
| (0.078) | (0.068) | (0.068) | (0.073) | (0.081) | (0.097) | (0.123) | (0.177) | (0.275) | |
| Elders (over 64) | –0.215 ** | –0.167 ** | –0.176 ** | –0.193 ** | –0.118 | –0.170 | –0.126 | –0.273 | –0.047 |
| (0.093) | (0.081) | (0.081) | (0.087) | (0.096) | (0.115) | (0.146) | (0.210) | (0.327) | |
| Y2006 | –1.770 | –0.133 | 0.332 | –1.307 | –1.613 | –2.065 | 0.628 | 4.064 | 18.097 * |
| (3.083) | (2.691) | (2.676) | (2.894) | (3.195) | (3.831) | (4.854) | (6.971) | (10.839) | |
| Y2009 | –3.494 | –2.595 | –1.007 | –2.821 | –2.422 | –1.554 | –2.777 | 0.932 | 8.897 |
| (3.177) | (2.773) | (2.757) | (2.983) | (3.292) | (3.948) | (5.001) | (7.183) | (11.169) | |
| Y2011 | –16.319 *** | –18.413 *** | –20.949 *** | –24.889 *** | –26.115 *** | –29.529 *** | –34.920 *** | –42.179 *** | –47.807 *** |
| (3.101) | (2.706) | (2.691) | (2.911) | (3.213) | (3.853) | (4.881) | (7.011) | (10.901) | |
| Constant | 450.487 *** | 388.146 *** | 338.778 *** | 327.235 *** | 209.661 *** | 257.886 *** | 263.140 ** | 127.170 | 124.071 |
| (76.772) | (67.015) | (66.642) | (72.080) | (79.558) | (95.409) | (120.871) | (173.591) | (269.926) |
| Groups | Number of obs. | Mean DQD | Standard Deviation | Difference from Normal | p-Value of t-Test |
|---|---|---|---|---|---|
| Light | 1509 | 512.46 | 202.64 | ||
| Normal | 16781 | 525.13 | 221.67 | ||
| Overweight | 9418 | 532.85 | 234.5 | −7.72 | <0.01 |
| Obesity | 2918 | 536.17 | 254.01 | −11.04 | <0.05 |
© 2020 by the authors. Licensee MDPI, Basel, Switzerland. This article is an open access article distributed under the terms and conditions of the Creative Commons Attribution (CC BY) license (http://creativecommons.org/licenses/by/4.0/).
Share and Cite
Zhou, J.; Leepromrath, S.; Tian, X.; Zhou, D. Dynamics of Chinese Diet Divergence from Chinese Food Pagoda and Its Association with Adiposity and Influential Factors: 2004–2011. Int. J. Environ. Res. Public Health 2020, 17, 507. https://doi.org/10.3390/ijerph17020507
Zhou J, Leepromrath S, Tian X, Zhou D. Dynamics of Chinese Diet Divergence from Chinese Food Pagoda and Its Association with Adiposity and Influential Factors: 2004–2011. International Journal of Environmental Research and Public Health. 2020; 17(2):507. https://doi.org/10.3390/ijerph17020507
Chicago/Turabian StyleZhou, Jiajun, Sirimaporn Leepromrath, Xu Tian, and De Zhou. 2020. "Dynamics of Chinese Diet Divergence from Chinese Food Pagoda and Its Association with Adiposity and Influential Factors: 2004–2011" International Journal of Environmental Research and Public Health 17, no. 2: 507. https://doi.org/10.3390/ijerph17020507
APA StyleZhou, J., Leepromrath, S., Tian, X., & Zhou, D. (2020). Dynamics of Chinese Diet Divergence from Chinese Food Pagoda and Its Association with Adiposity and Influential Factors: 2004–2011. International Journal of Environmental Research and Public Health, 17(2), 507. https://doi.org/10.3390/ijerph17020507