What Drives Households’ Payment for Waste Disposal and Recycling Behaviours? Empirical Evidence from South Africa’s General Household Survey

 ,
,  and
and
Abstract
1. Introduction
2. Methodology
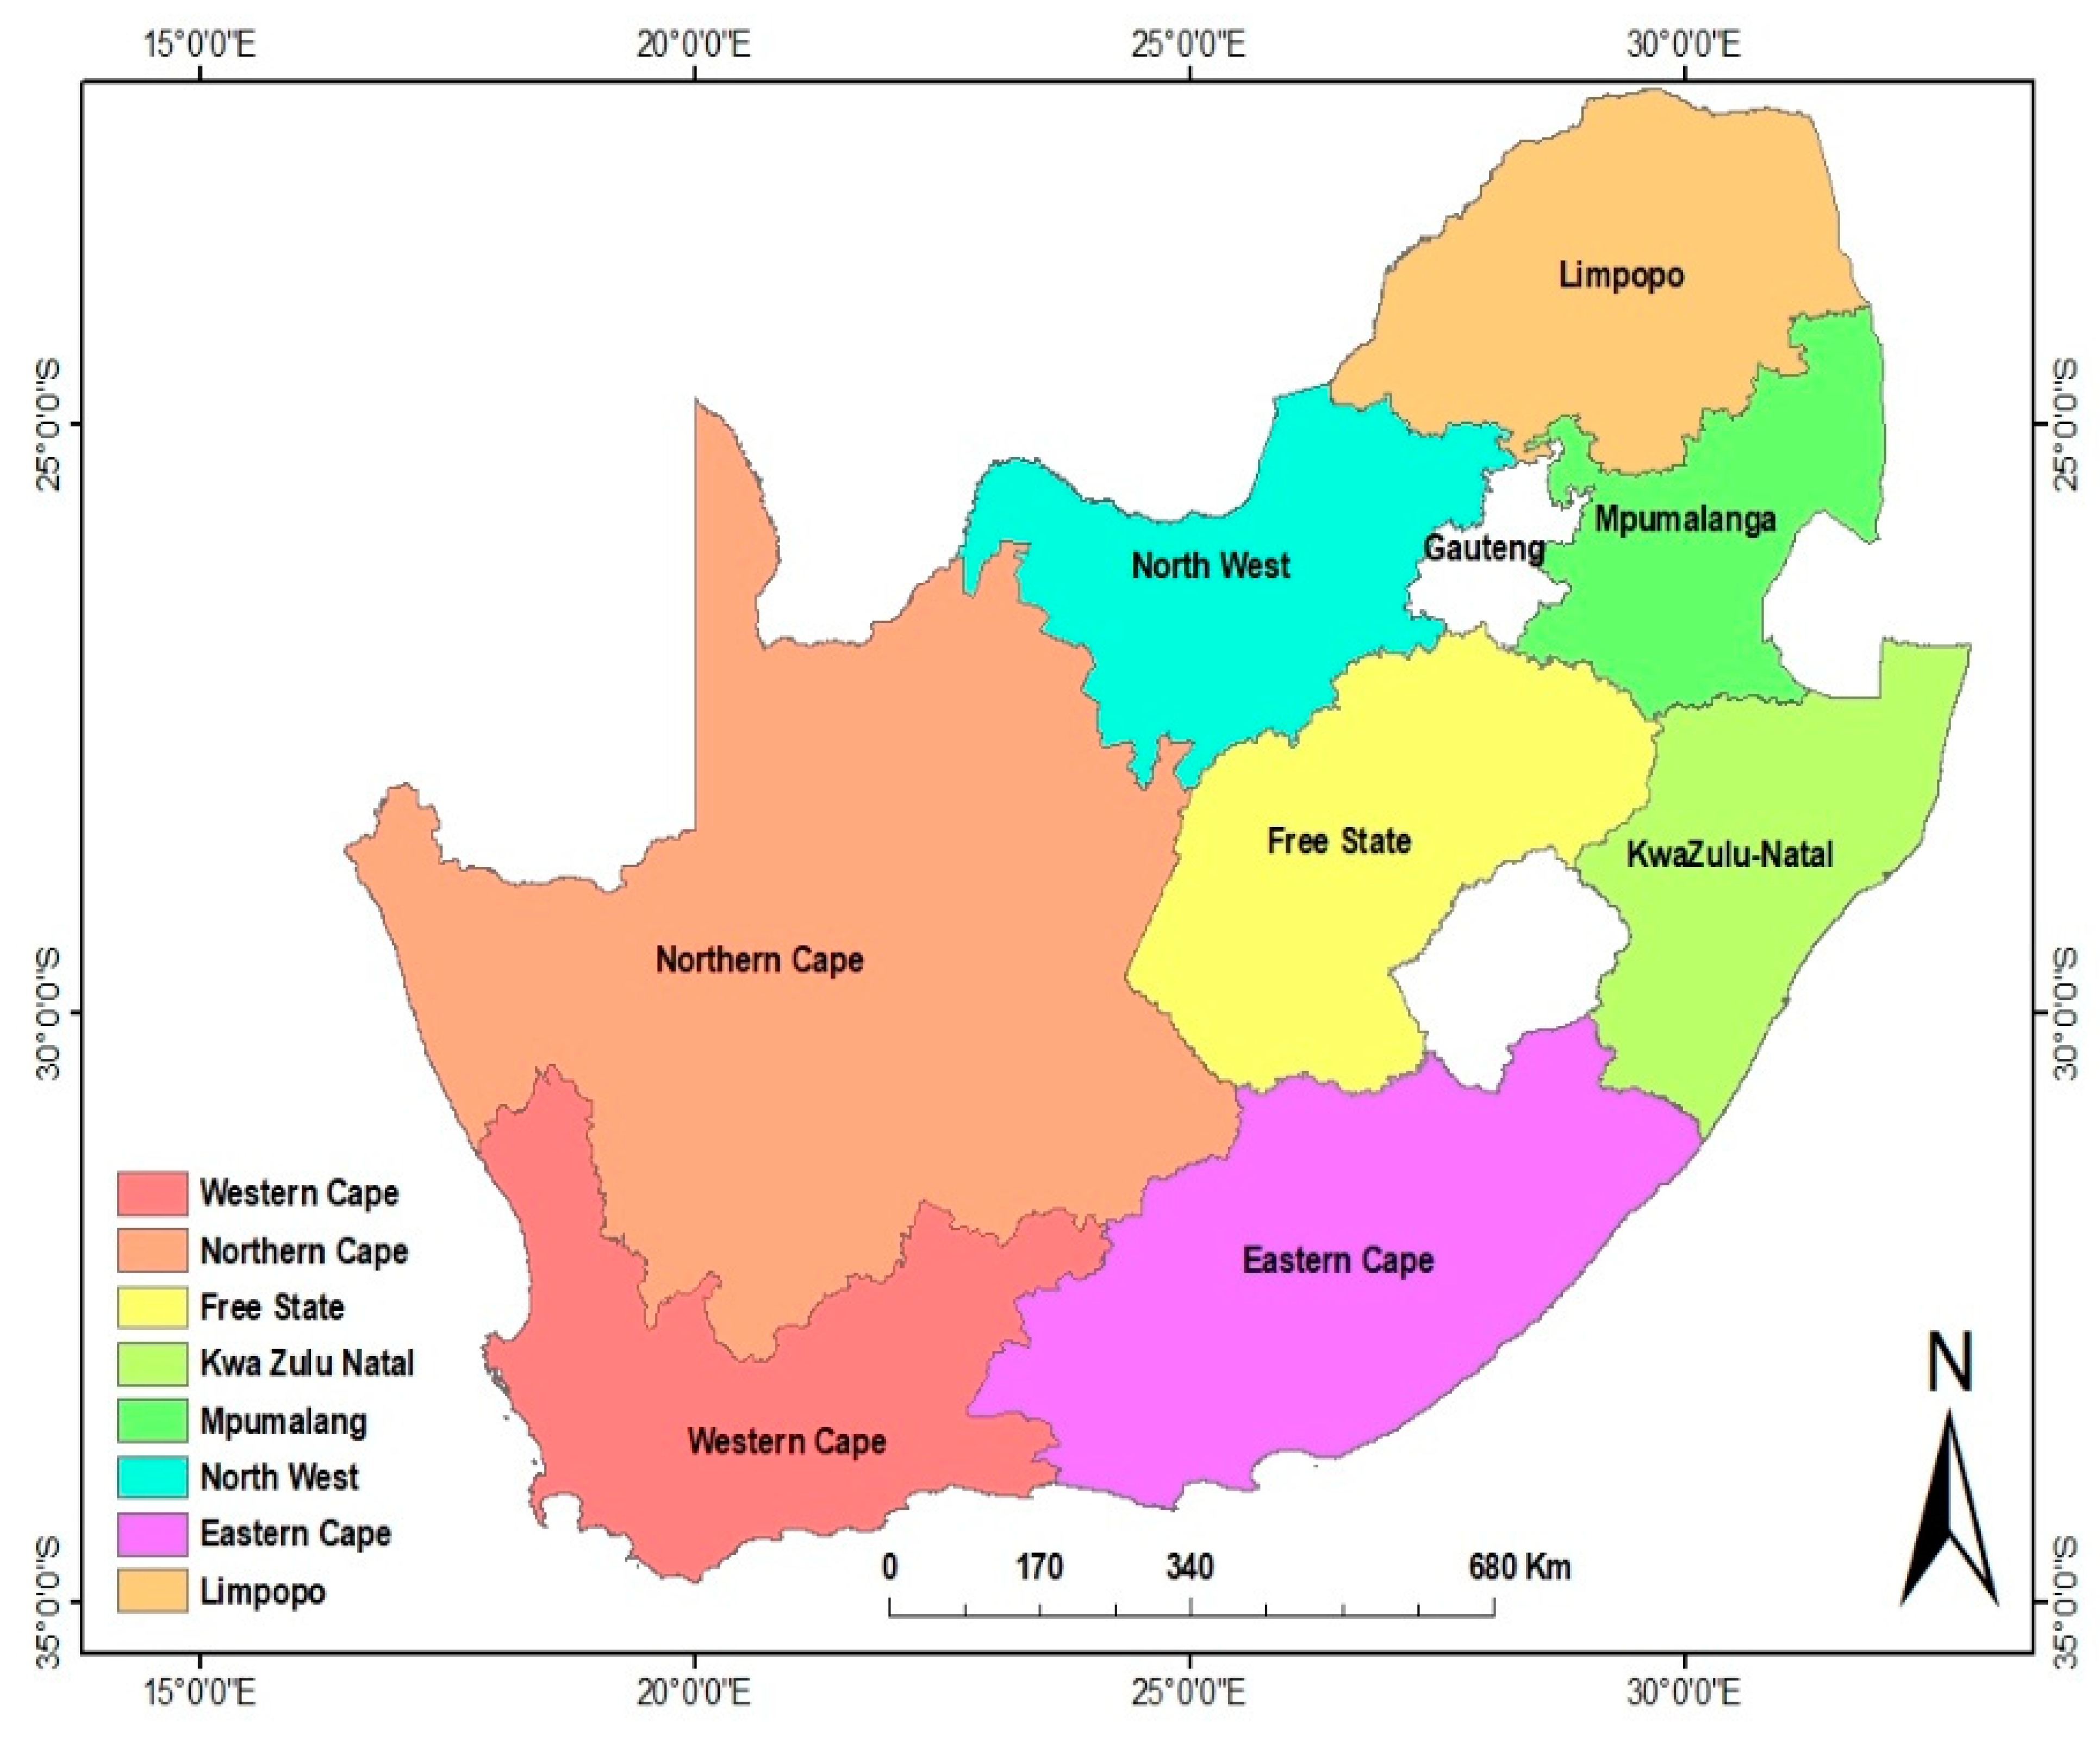
2.1. Study Area
2.2. Data and Sampling Procedures
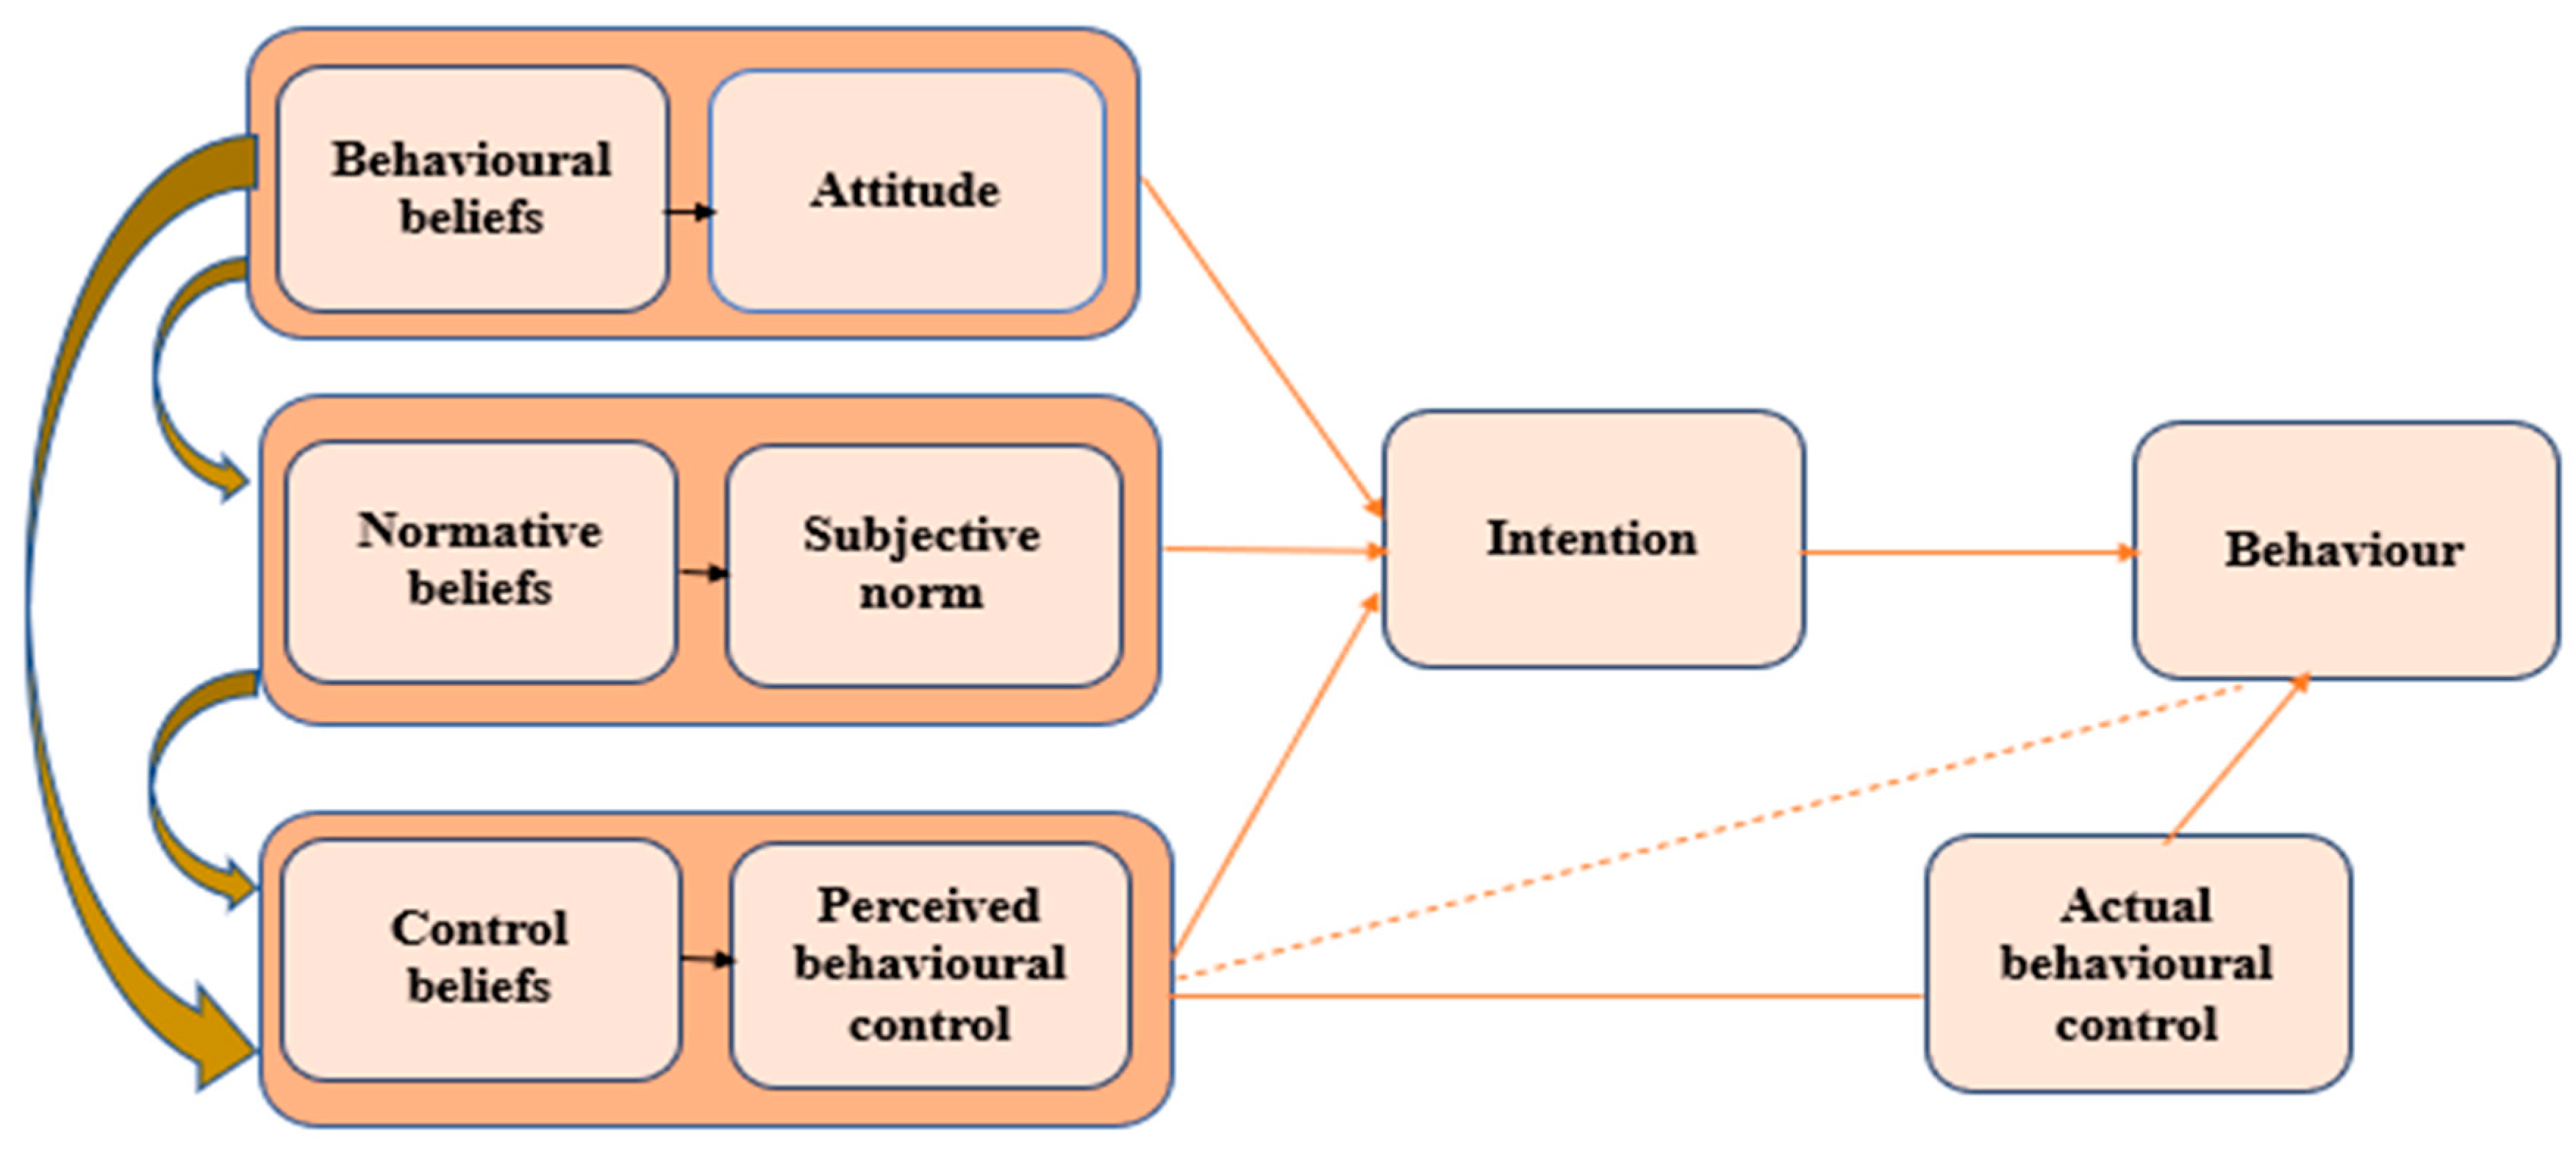
2.3. The Theory of Planned Behaviour
Core Assumptions of TPB
- The intentions of the individual largely reflects their personal attitudes or their perception of the extent of favourability of an act. This will also be influenced by their perceived and cognitive beliefs about the act [42].
- Again, just like in the TRA, the subjective norms that the individual is exposed or privy to will also have an impact on their intentions. This is in recognition of man being, by nature, a social creature, so they will no doubt care about what others think or believe. More often than not, if society demonstrates general favourability towards an act, it is highly likely that the individual will think the same, his intentions largely shaped by the extent of approval (and disapproval) by family, friends, co-workers or pretty much any person he trusts [42,45].
- The intentions and the resulting behaviours of the individual are affected by their perceived behavioural control, or what they think and believe to be their ability to actually perform or engage in the said behaviours [46]. Succeeding literature on the TPB led to the identification of the two facets of this perceived behavioural control:
- ➢
- Internal control: This is basically what the individual perceives their own control to be like. It focuses on how the individual sees themself as being in control when it comes to performing the specific behaviour in question, and this mostly has a lot to do with the sufficiency of their knowledge, skills and abilities, and the amount of discipline they wield while performing the behaviour [42,46].
- ➢
- External control: Other external factors also have a way of shaping how an individual behaves [42,46]. For example, the acceptance or approval of family, friends and peers is likely to influence a person into developing a positive attitude toward a behaviour, bolstering their intention to see the specific action through to the end. Time is also another factor that is external but will no doubt impact one’s level of behavioural control [44].
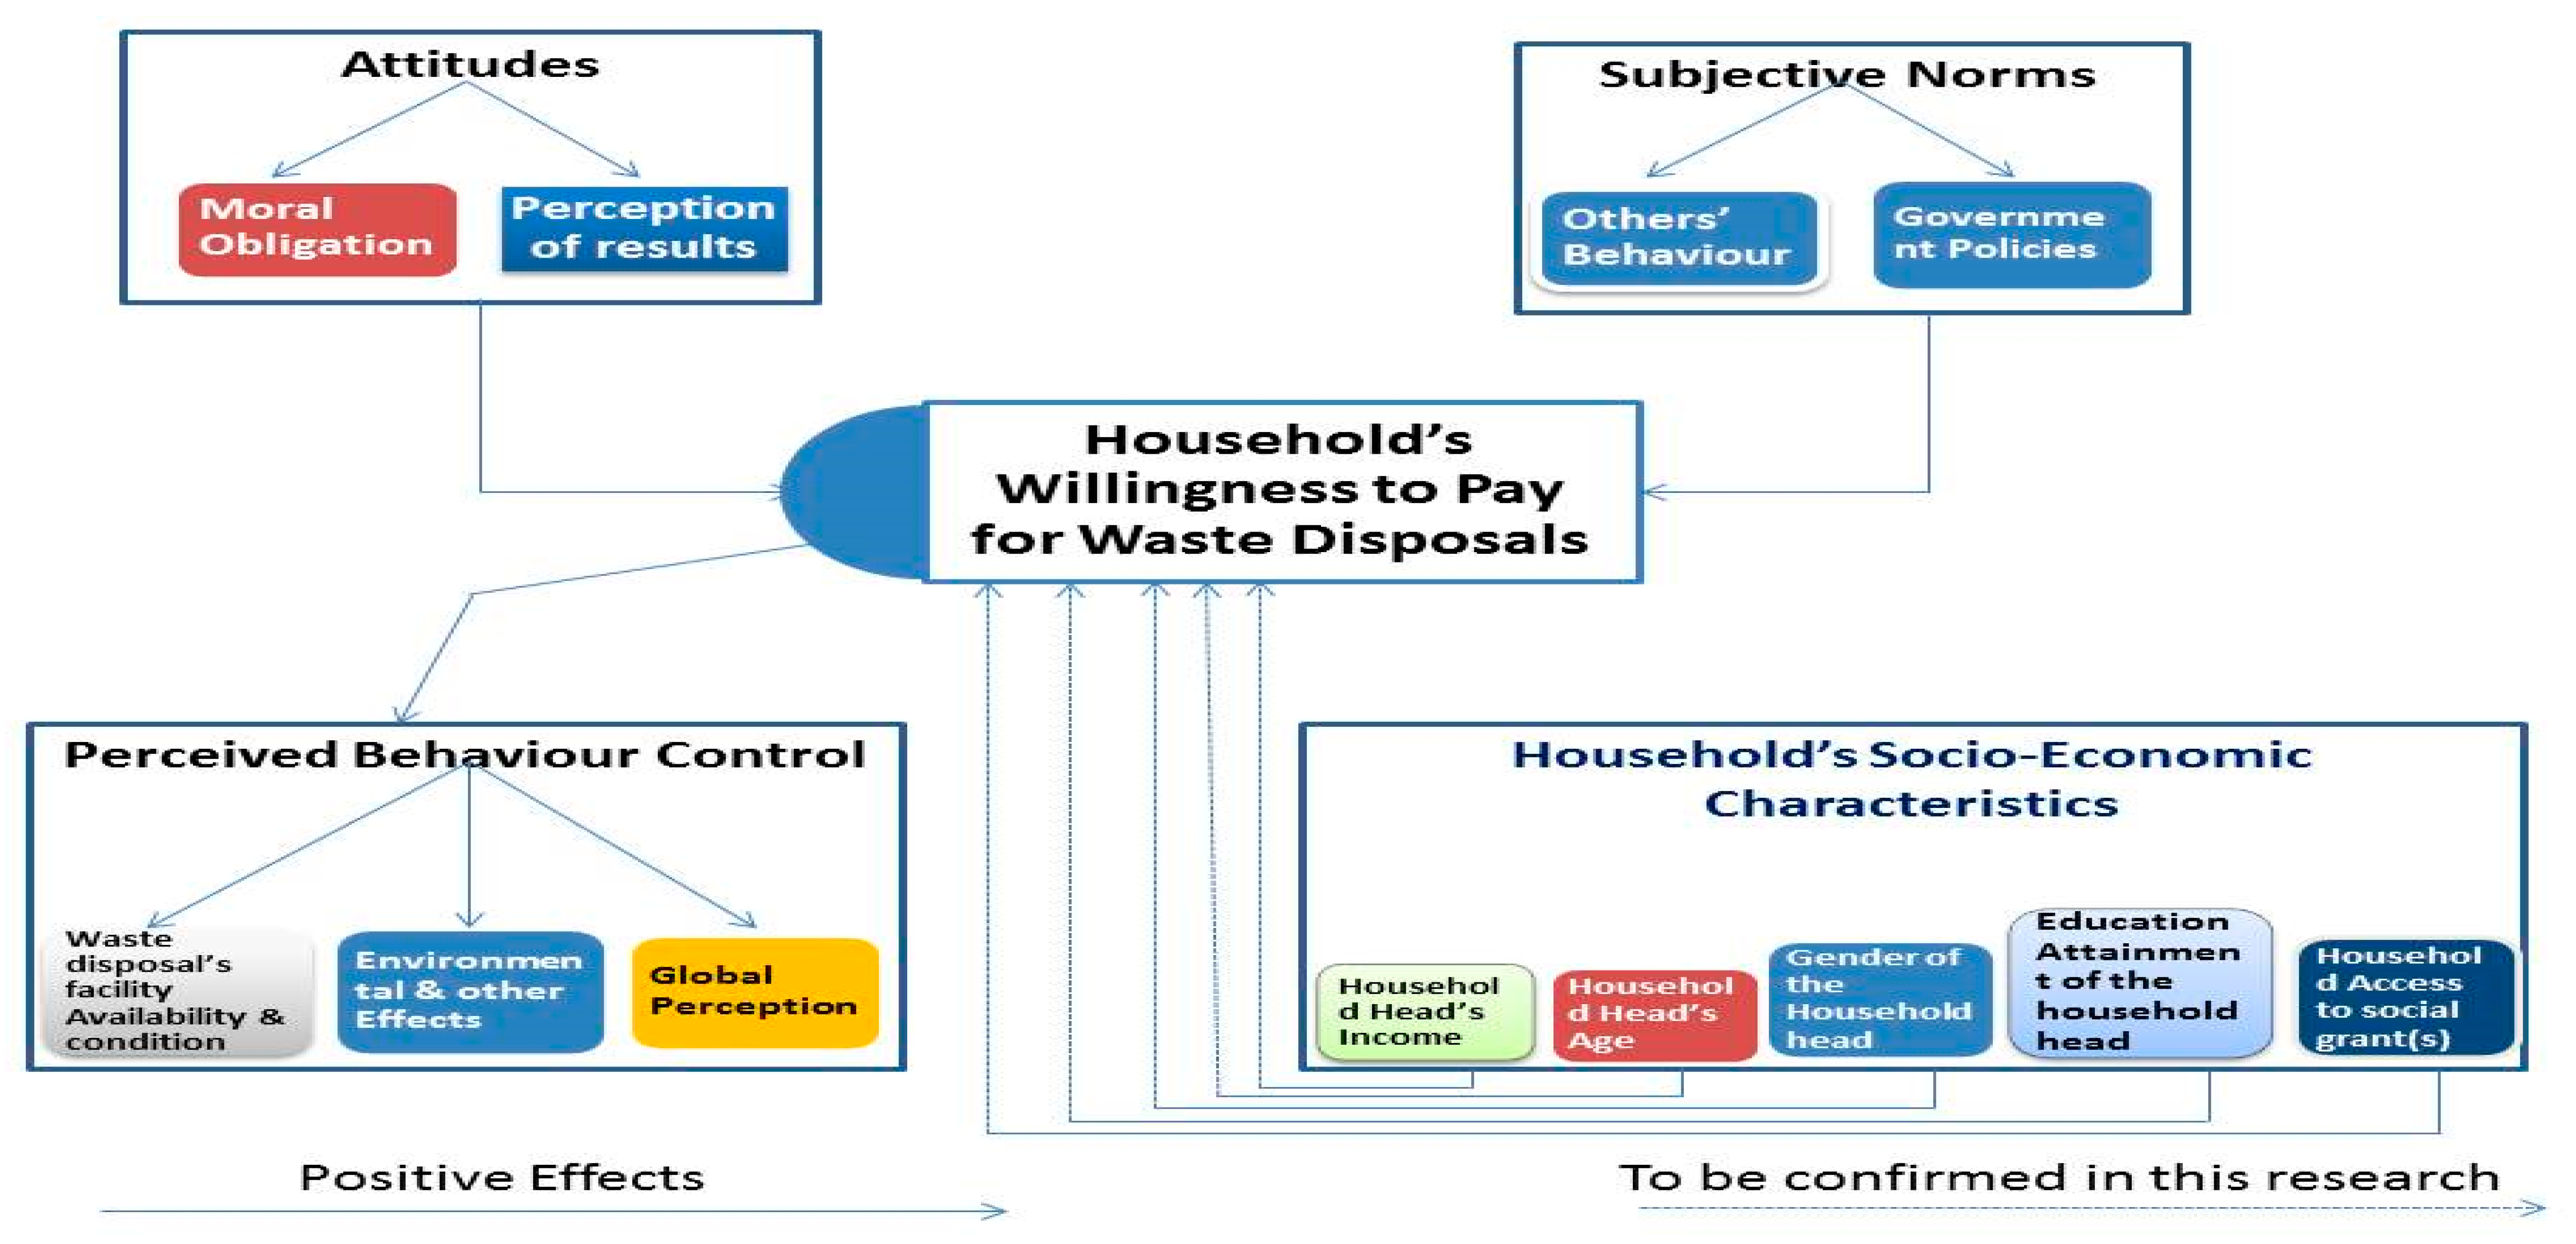
2.4. Planned Behaviour Theory and the Hypothetical Framework
3. Analytical Framework and Estimation Strategy
3.1. Analytical Framework
3.2. Empirical Estimation Strategy: Bivariate Probit Model
4. Results and Discussion
4.1. Distributions of Socio-Economic Variables
4.2. Households’ Waste Disposal Methods and Perception of Environmental Problems
4.3. Paying for Waste Disposal and Recycling Behaviour of the Respondents
4.4. Parameter Estimates for Recycling Behaviour and Payment for Waste Disposal in South Africa
5. Conclusions
Author Contributions
Funding
Acknowledgments
Conflicts of Interest
References
- Mulat, S.; Worku, W.; Minyihun, A. Willingness to pay for improved solid waste management and associated factors among households in Injibara town, Northwest Ethiopia. BMC Res. Notes 2019, 12, 401. [Google Scholar] [CrossRef]
- Dahlén, L.; Lagerkvist, A. Pay as you throw: Strengths and weaknesses of weight-based billing in household waste collection systems in Sweden. Waste Manag. 2010, 30, 23–31. [Google Scholar] [CrossRef] [PubMed]
- Guerrero, L.A.; Maas, G.; Hogland, W. Solid waste management challenges for cities in developing countries. Waste Manag. 2013, 33, 220–232. [Google Scholar] [CrossRef]
- Abarca-Guerrero, L.; Maas, G.; Hogland, W. Solid waste management challenges for cities in developing countries. Rev. Tecnol. Marcha 2015, 28, 141–168. [Google Scholar] [CrossRef]
- Kaza, S.; Yao, L.; Bhada-Tata, P.; Van Woerden, F. What a Waste 2.0: A Global Snapshot of Solid Waste Management to 2050; The World Bank: Washington, DC, USA, 2018. [Google Scholar]
- Tadesse, T. Environmental concern and its implication to household waste separation and disposal: Evidence from Mekelle, Ethiopia. Resour. Conserv. Recycl. 2009, 53, 183–191. [Google Scholar] [CrossRef]
- Tadesse, T.; Hadgu, S. Demand for improved solid waste collection services: A survey in Mekelle city. J. Drylands 2009, 2, 32–39. [Google Scholar]
- Sarkhel, P.; Banerjee, S.; Banerjee, S. Willingness to pay before and after program implementation: The case of Municipal Solid Waste Management in Bally Municipality, India. Environ. Dev. Sustain. 2016, 18, 481–498. [Google Scholar] [CrossRef]
- Afroz, R.; Tudin, R.; Hanaki, K.; Masud, M.M. Selected socio-economic factors affecting the willingness to minimise solid waste in Dhaka city, Bangladesh. J. Environ. Plan. Manag. 2011, 54, 711–731. [Google Scholar] [CrossRef]
- O’Brien, J.; Thondhlana, G. Plastic bag use in South Africa: Perceptions, practices and potential intervention strategies. Waste Manag. 2019, 84, 320–328. [Google Scholar] [CrossRef]
- Rahji, M.; Oloruntoba, E.O. Determinants of households’ willingness-to-pay for private solid waste management services in Ibadan, Nigeria. Waste Manag. Res. 2009, 27, 961–965. [Google Scholar] [CrossRef]
- Medina, M. Solid Wastes, Poverty and the Environment in Developing Country Cities: Challenges and Opportunities; WIDER Working Paper: Helsinki, Finland, 2010. [Google Scholar]
- Gedefaw, M. Assessing the current status of solid waste management of Gondar town, Ethiopia. Int. J. Sci. Technol. Res. 2015, 4, 28–36. [Google Scholar]
- Mombo, F.; Bigirwa, D. The role of Sub-Saharan Africa Countries’ households waste charges on sustainable cities development. Int. J. Waste Resour. 2017, 7, 100265. [Google Scholar] [CrossRef]
- Hoornweg, D.; Bhada-Tata, P. What a Waste: A Global Review of Solid Waste Management; The World Bank: Washington, DC, USA, 2012. [Google Scholar]
- Department of Water Affairs and Forestry (DWARF). Report on Waste Generation Sub-Project; Department of Water Affairs and Forestry: Pretoria, South Africa, 1997.
- Kawai, K.; Tasaki, T. Revisiting estimates of municipal solid waste generation per capita and their reliability. J. Mater. Cycles Waste Manag. 2016, 18, 1–13. [Google Scholar] [CrossRef]
- Muzenda, E.; Ntuli, F.; Pilusa, T.J. Waste management, strategies and situation in South Africa: An overview. Int. J. Environ. Ecol. Eng. 2012, 6, 552–555. [Google Scholar]
- Lumby, A. Government and sustainable development in South Africa: The environmental legislative framework in historical context. S. Afr. J. Econ. Hist. 2005, 20, 65–82. [Google Scholar] [CrossRef]
- Lister, R.; Campling, J. Citizenship: Feminist Perspectives; Macmillan International Higher Education: London, UK, 2017. [Google Scholar]
- Godfrey, L. Facilitating the improved management of waste in South Africa through a national waste information system. Waste Manag. 2008, 28, 1660–1671. [Google Scholar] [CrossRef]
- Friedman, B.; Kahn, P.H.; Borning, A. Value sensitive design and information systems. In The Handbook of Information and Computer Ethics; John Wiley & Sons: Hoboken, NJ, USA, 2008; pp. 69–101. [Google Scholar]
- Watson, R.T.; Boudreau, M.-C.; Chen, A.J. Information systems and environmentally sustainable development: Energy informatics and new directions for the IS community. MIS Q. 2010, 34, 23–38. [Google Scholar] [CrossRef]
- Couzens, E.; Dent, M. Finding NEMA: The National Environmental Management Act, the De Hoop Dam, conflict resolution and alternative dispute resolution in environmental disputes. Potchefstroom Electron. Law J. Potchefstroomse Elektron. Regsblad 2006, 9, 2–51. [Google Scholar]
- Strydom, H.A.; King, N.; Fuggle, R.; Rabie, M.A. Environmental Management in South Africa; Juta and Company Ltd.: Cape Town, South Africa, 2009. [Google Scholar]
- Oelofse, S.H.; Schoonraad, J.; Baldwin, D. Impacts on Waste Planning and Management; Council for Scientific and Industrial Research (CSIR): Pretoria, South Africa, 2016. [Google Scholar]
- Matete, N.; Trois, C. Towards zero waste in emerging countries–a South African experience. Waste Manag. 2008, 28, 1480–1492. [Google Scholar] [CrossRef]
- DEAT. National Waste Management Strategy and Action Plans; Department of Environmental Affairs and Tourism, Government of South Africa: Pretoria, South Africa, 1999.
- Buse, K.; Hawkes, S. Health in the sustainable development goals: Ready for a paradigm shift? Glob. Health 2015, 11, 13. [Google Scholar] [CrossRef]
- Omisore, A.G. Attaining Sustainable Development Goals in sub-Saharan Africa; The need to address environmental challenges. Environ. Dev. 2018, 25, 138–145. [Google Scholar] [CrossRef]
- Oyekale, A.S. Factors explaining households’ cash payment for solid waste disposal and recycling behaviors in South Africa. Sustainability 2015, 7, 15882–15899. [Google Scholar] [CrossRef]
- Cohen, B. Urbanization in developing countries: Current trends, future projections, and key challenges for sustainability. Technol. Soc. 2006, 28, 63–80. [Google Scholar] [CrossRef]
- Kinnaman, T.C. The economics of municipal solid waste management. Waste Manag. 2009, 29, 2615–2617. [Google Scholar] [CrossRef] [PubMed]
- Boateng, K.S.; Agyei-Baffour, P.; Boateng, D.; Rockson, G.N.K.; Mensah, K.A.; Edusei, A.K. Household willingness-to-pay for improved solid waste management services in four major metropolitan cities in Ghana. J. Environ. Public Health 2019, 2019, 5468381. [Google Scholar] [CrossRef] [PubMed]
- Vitor, F.; Mathinho, M. Factors influencing households’ participation in organic waste separation. In Proceedings of the International Solid Waste Association 2009 World Congress, Lisbon, Portugal, 12–15 October 2009; Available online: http://iswa.org (accessed on 4 April 2020).
- Mehlhorn, H. Important Rivers and Their Worldwide Contributions to Epidemics on the Continents. In Parasite and Disease Spread by Major Rivers on Earth; Springer: Berlin, Germany, 2019; pp. 1–111. [Google Scholar]
- Waugh, D. Manufacturing industries (chapter 19), World development (chapter 22). In Geography: An Integrated Approach; Nelson Thornes: Cheltenham, UK, 2000; pp. 563–576. ISBN 0-17-444706-X. [Google Scholar]
- Pritchard, C.; Keen, S. Comparing GDP Health and Military Expenditure, Poverty and Child Mortality of 71 Countries from Different Regions; International Development, IntechOpen: London, UK, 2017; Volume 65, pp. 65–86. [Google Scholar]
- Darkoh, M.B.K. An overview of environmental issues in Southern Africa. Afr. J. Ecol. 2009, 47, 93–98. [Google Scholar] [CrossRef]
- Omotayo, A.O.; Ogunniyi, A.I.; Aremu, A.O. Data on food insufficiency status in South Africa: Insight from the South Africa General Household Survey. Data Brief 2019, 23, 103730. [Google Scholar] [CrossRef]
- Wang, Z.; Dong, X.; Yin, J. Antecedents of urban residents‘separate collection intentions for household solid waste and their willingness to pay: Evidence from China. J. Clean. Prod. 2018, 173, 256–264. [Google Scholar] [CrossRef]
- Ajzen, I. The theory of planned behavior. Organ Behav. Hum. Dec. 1991, 50, 179–211. [Google Scholar] [CrossRef]
- Schlegel, R.P.; DAvernas, J.R.; Zanna, M.P.; DeCourville, N.H.; Manske, S.R. Problem drinking: A problem for the Theory of Reasoned Action? J. Appl. Soc. Psychol. 1992, 22, 358–385. [Google Scholar] [CrossRef]
- Fishbein, M.; Ajzen, I. Understanding Attitudes and Predicting Social Behavior; Englewood Cliffs: Bergen County, NJ, USA, 1980. [Google Scholar]
- Fishbein, M.; Ajzen, I. Belief, attitude, intention, and behavior: An introduction to theory and research. J. Bus. Ventur. 1977, 5, 177–189. [Google Scholar]
- Van den Putte, B.; Hoogstraten, J. The Effect of Variable Order in Measuring the Theory of Reasoned Action; University of Amsterdam: Amsterdam, The Netherlands, 1990. [Google Scholar]
- Sidique, S.F.; Joshi, S.V.; Lupi, F. Factors influencing the rate of recycling: An analysis of Minnesota counties. Resour. Conserv. Recycl. 2010, 54, 242–249. [Google Scholar] [CrossRef]
- Kinnaman, T.C.; Fullerton, D. Garbage and recycling with endogenous local policy. J. Urban Econ. 2000, 48, 419–442. [Google Scholar] [CrossRef]
- Olagunju, K.O.; Ogunniyi, A.I.; Awotide, B.A.; Adenuga, A.H.; Ashagidigbi, W.M. Evaluating the distributional impacts of drought-tolerant maize varieties on productivity and welfare outcomes: An instrumental variable quantile treatment effects approach. Clim. Dev. 2019, 1–11. [Google Scholar] [CrossRef]
- Ogunniyi, A.; Olagunju, K.; Kabir, S.K. Social crisis, terrorism and food poverty dynamics: Evidence from Northern Nigeria. Int. J. Econ. Financ. Issues 2016, 6, 1865–1872. [Google Scholar]
- Oyetunde-Usman, Z.; Olagunju, K.O. Determinants of Food Security and Technical Efficiency among Agricultural Households in Nigeria. Economies 2019, 7, 103. [Google Scholar] [CrossRef]
- Ogunniyi, A.; Oluseyi, O.K.; Adeyemi, O.; Kabir, S.K.; Philips, F. Scaling Up Agricultural Innovation for Inclusive Livelihood and Productivity Outcomes in Sub-Saharan Africa: The Case of Nigeria. Afr. Dev. Rev. 2017, 29, 121–134. [Google Scholar] [CrossRef]
- Burger, R.; Steenekamp, C.L.; Zoch, A.; van der Berg, S. The Middle Class in Contemporary South Africa: Comparing Rival Approaches; Department of Economics, Stellenbosch University: Stellenbosch, South Africa, 2014. [Google Scholar]
- Challcharoenwattana, A.; Pharino, C. Multiple-criteria decision analysis to promote recycling activities at different stages of urbanization. J. Clean. Prod. 2016, 137, 1118–1128. [Google Scholar] [CrossRef]
- Bonal, X. On global absences: Reflections on the failings in the education and poverty relationship in Latin America. Int. J. Educ. Dev. 2007, 27, 86–100. [Google Scholar] [CrossRef]
- Omotayo, A.O.; Nkonki-Mandleni, B.; Khumalo, M.L. Social Protection: A Panacea to Alleviating Poverty in the Republic of South Africa. Acta Univ. Danub. Econ. 2018, 14, 737–748. [Google Scholar]
- Amechi, E.P. Linking environmental protection and poverty reduction in Africa: An analysis of the regional legal responses to environmental protection. Law Env’t Dev. J. 2010, 6, 112. [Google Scholar]
- Fabra, A. The Intersection of Human Rights and Environmental Issues: A Review of institutional developments at the international level. In Proceedings of the Joint UNEP-OHCHR Expert Seminar on Human Rights and the Environment, Geneva, Switzerland, 14–16 January 2002; pp. 14–16. [Google Scholar]
- Lamichhane, K.M.; Babcock, R.W., Jr. Survey of attitudes and perceptions of urine-diverting toilets and human waste recycling in Hawaii. Sci. Total Environ. 2013, 443, 749–756. [Google Scholar] [CrossRef]
- Jones, N.; Evangelinos, K.; Halvadakis, C.; Iosifides, T.; Sophoulis, C. Social factors influencing perceptions and willingness to pay for a market-based policy aiming on solid waste management. Resour. Conserv. Recycl. 2010, 54, 533–540. [Google Scholar] [CrossRef]
- Flatø, M.; Muttarak, R.; Pelser, A. Women, weather, and woes: The triangular dynamics of female-headed households, economic vulnerability, and climate variability in South Africa. World Dev. 2017, 90, 41–62. [Google Scholar] [CrossRef]
- Tibesigwa, B.; Visser, M. Assessing gender inequality in food security among small-holder farm households in urban and rural South Africa. World Dev. 2016, 88, 33–49. [Google Scholar] [CrossRef]
- Rogan, M. Poverty and headship in post-apartheid South Africa, 1997–2006. Soc. Indic. Res. 2013, 113, 491–511. [Google Scholar] [CrossRef]
- Tibesigwa, B.; Visser, M. Small-Scale Subsistence Farming, Food Security, Climate Change and Adaptation in South Africa: Male-Female Headed Households and Urban-Rural Nexus; ERSA Working Paper: Cape Town, South Africa, 2015; pp. 1–32. [Google Scholar]
- Rivera-Torres, P.; Garcés-Ayerbe, C. Development of pro-environmental conduct in individuals and its determinants. Reis 2018, 163, 59–78. [Google Scholar]
- Rogan, M. Gender and multidimensional poverty in South Africa: Applying the global multidimensional poverty index (MPI). Soc. Indic. Res. 2016, 126, 987–1006. [Google Scholar] [CrossRef]
- Horrell, S.; Krishnan, P. Poverty and productivity in female-headed households in Zimbabwe. J. Dev. Stud. 2007, 43, 1351–1380. [Google Scholar] [CrossRef]
- Hosegood, V.; Timaeus, I.M. Household composition and dynamics in KwaZulu Natal, South Africa: Mirroring social reality in longitudinal data collection. In African Households: Censuses and Surveys; Routledge: Abingdon, UK, 2016; pp. 98–117. [Google Scholar]
- Hamer, G. Solid waste treatment and disposal: Effects on public health and environmental safety. Biotechnol. Adv. 2003, 22, 71–79. [Google Scholar] [CrossRef]
- Al-Khatib, I.A.; Kontogianni, S.; Nabaa, H.A.; Al-Sari, M.I. Public perception of hazardousness caused by current trends of municipal solid waste management. Waste Manag. 2015, 36, 323–330. [Google Scholar] [CrossRef] [PubMed]
- Boadi, K.O.; Kuitunen, M. Environmental and health impacts of household solid waste handling and disposal practices in third world cities: The case of the Accra Metropolitan Area, Ghana. J. Environ. Health 2005, 68, 32–36. [Google Scholar] [PubMed]
- Al-Khatib, I.A.; Sato, C. Solid health care waste management status at health care centers in the West Bank–Palestinian Territory. Waste Manag. 2009, 29, 2398–2403. [Google Scholar] [CrossRef]
- Makgae, M. Key areas in waste management: A South African perspective. Integr. Waste Manag. 2011, 2, 1169. [Google Scholar]
- Ogola, G.O.; Gale, S.C.; Haider, A.; Shafi, S. The financial burden of emergency general surgery: National estimates 2010 to 2060. J. Trauma Acute Care Surg. 2015, 79, 444–448. [Google Scholar] [CrossRef] [PubMed]
- Anderson, B.A.; Romani, J.H.; Wentzel, M.; Phillips, H.E. Recycling Behavior among Urban South Africans: The Role of Race and Social Status; Population Studies Center Research Report: Ann Arbor, MI, USA, 2013. [Google Scholar]
- Kahinda, J.-M.M.; Taigbenu, A.E.; Boroto, J.R. Domestic rainwater harvesting to improve water supply in rural South Africa. Phys. Chem. Earth Parts A/B/C 2007, 32, 1050–1057. [Google Scholar] [CrossRef]
- Cann, K.; Thomas, D.R.; Salmon, R.; Wyn-Jones, A.; Kay, D. Extreme water-related weather events and waterborne disease. Epidemiol. Infect. 2013, 141, 671–686. [Google Scholar] [CrossRef]
- Yong, J.Y.; Klemeš, J.J.; Varbanov, P.S.; Huisingh, D. Cleaner energy for cleaner production: Modelling, simulation, optimisation and waste management. J. Clean. Prod. 2016, 111, 1–16. [Google Scholar] [CrossRef]
- Chidiebere, O.A.; Abubakar, M.; Shabako, J.G. Municipal Solid Waste Management in African Cities: A Case Study of Lagos State, Nigeria. Malays. J. Civ. Eng. 2018, 30, 1–12. [Google Scholar] [CrossRef]
- Ezeah, C.; Roberts, C.L. Waste governance agenda in Nigerian cities: A comparative analysis. Habitat Int. 2014, 41, 121–128. [Google Scholar] [CrossRef]
- Nixon, H.; Saphores, J.-D.M. Financing electronic waste recycling Californian households’ willingness to pay advanced recycling fees. J. Environ. Manag. 2007, 84, 547–559. [Google Scholar] [CrossRef] [PubMed]
- Blaine, T.W.; Lichtkoppler, F.R.; Jones, K.R.; Zondag, R.H. An assessment of household willingness to pay for curbside recycling: A comparison of payment card and referendum approaches. J. Environ. Manag. 2005, 76, 15–22. [Google Scholar] [CrossRef] [PubMed]
- Olagunju, K.O.; Adeoti, A.; Ogunniyi, A. Determinants of households’ willingness to pay for potable water in Oyo State, Nigeria. Int. J. Innov. and Sci. Res. 2015, 16, 103–113. [Google Scholar]
- Guerin, D.; Crete, J.; Mercier, J. A multilevel analysis of the determinants of recycling behavior in the European countries. Soc. Sci. Res. 2001, 30, 195–218. [Google Scholar] [CrossRef]
- Omotayo, A.O.; Ijatuyi, E.J.; Olorunfemi, O.D.; Agboola, P.T. Food Security Situation among South African Urban Agricultural Households: Evidence from Limpopo Province. Acta Univ. Danub. Econ. 2018, 14, 60–74. [Google Scholar]
- Whitmarsh, L. Are flood victims more concerned about climate change than other people? The role of direct experience in risk perception and behavioural response. J. Risk Res. 2008, 11, 351–374. [Google Scholar] [CrossRef]


| Socio-Economic Variables | Percentage Distribution of the South African Provinces | |||||||||
|---|---|---|---|---|---|---|---|---|---|---|
| WCP | ECP | NCP | FSP | KZNP | NWP | GP | MP | LP | Pooled | |
| Age (Years) | 49 | 52 | 51 | 49 | 49 | 49 | 47 | 48 | 50 | 49 |
| Income (Rands) | 12,167.65 | 7740.40 | 8518.34 | 13,614.60 | 9282.93 | 7966.12 | 16,037.47 | 14,302.99 | 5508.31 | 11,099.07 |
| Social Grants (%) | 20.91 | 27.75 | 9.25 | 12.39 | 33.37 | 14.24 | 49.96 | 17.48 | 23.73 | 21.90 |
| Formal Education (%) | 88.43 | 96.91 | 78.36 | 76.31 | 87.76 | 86.89 | 91.36 | 89.41 | 81.31 | 89.97 |
| Gender | ||||||||||
| Male (%) | 73.23 | 69.17 | 74.20 | 59.76 | 74.27 | 14.22 | 22.75 | 58.47 | 48.07 | 56.29 |
| Female (%) | 26.77 | 30.83 | 25.80 | 40.24 | 25.73 | 85.78 | 77.25 | 41.53 | 51.93 | 43.71 |
| Waste Disposal Methods among Households | Percentage Distribution of the South African Provinces | |||||||||
|---|---|---|---|---|---|---|---|---|---|---|
| WCP | ECP | NCP | FSP | KZNP | NWP | GP | MP | LP | Pooled | |
| Local authority/private company at least once a week | 70.00 | 55.47 | 33.11 | 10.21 | 59.11 | 33.42 | 40.47 | 11.55 | 30.12 | 46.24 |
| Local authority/private less often than once a week | 15.11 | 7.24 | 0.14 | 0.00 | 15.17 | 7.06 | 0.16 | 3.21 | 12.91 | 14.11 |
| Community members contracted | 1.12 | 1.02 | 2.45 | 0.00 | 4.56 | 9.12 | 2.45 | 5.45 | 4.17 | 5.01 |
| Community members contracted by the municipalities less often than once a week | 7.13 | 3.14 | 5.47 | 7.70 | 8.11 | 9.92 | 2.24 | 0.13 | 5.47 | 9.18 |
| Community members at least once a week | 60.47 | 64.99 | 57.00 | 34.17 | 37.72 | 25.01 | 53.41 | 60.47 | 44.17 | 49.86 |
| Community members at less often than once a week | 1.36 | 2.33 | 8.40 | 3.41 | 0.05 | 4.21 | 4.16 | 1.23 | 3.41 | 28.64 |
| Communal refuse dump/container | 84.49 | 71.14 | 80.00 | 62.77 | 70.42 | 53.07 | 63.71 | 51.34 | 74.99 | 75.68 |
| Own refuse dump | 1.29 | 10.78 | 0.10 | 0.84 | 0.69 | 1.31 | 27.74 | 3.14 | 2.33 | 8.90 |
| Dump or leave rubbish anywhere | 0.07 | 0.13 | 0.42 | 1.15 | 1.14 | 4.22 | 2.24 | 2.33 | 3.41 | 11.83 |
| Other places | 0.42 | 0.40 | 6.07 | 1.27 | 1.26 | 0.14 | 3.11 | 0.78 | 7.24 | 12.31 |
| Missing responses | 0.03 | 0.14 | 2.42 | 2.81 | 1.05 | 0.07 | 2.14 | 0.40 | 6.47 | 10.12 |
| Environmental Problems | Percentage Distribution of the South African Provinces | |||||||||
|---|---|---|---|---|---|---|---|---|---|---|
| WCP | ECP | NCP | FSP | KZNP | NWP | GP | MP | LP | Pooled | |
| Irregular or no waste removal | 10.01 | 13.27 | 14.42 | 5.93 | 15.96 | 16.81 | 23.90 | 8.36 | 11.35 | 18.86 |
| Littering | 33.27 | 25.71 | 36.52 | 24.03 | 28.42 | 40.21 | 25.82 | 39.01 | 13.31 | 35.70 |
| Water pollution | 9.21 | 8.52 | 3.21 | 4.05 | 7.06 | 5.11 | 14.42 | 5.19 | 4.17 | 8.09 |
| Air pollution | 11.06 | 10.11 | 4.02 | 4.19 | 9.12 | 4.12 | 11.33 | 6.64 | 5.08 | 8.94 |
| Land degradation | 10.72 | 11.42 | 4.07 | 5.15 | 17.17 | 6.54 | 22.26 | 9.41 | 15.57 | 14.91 |
| Noise pollution | 9.80 | 10.00 | 3.13 | 8.08 | 0.56 | 3.39 | 4.04 | 7.11 | 7.29 | 3.95 |
| Willingness to Pay for Waste | Percentage Distribution of the South African Provinces | |||||||||
|---|---|---|---|---|---|---|---|---|---|---|
| WCP | ECP | NCP | FSP | KZNP | NWP | GP | MP | LP | Pooled | |
| Paying | ||||||||||
| Yes | 45.10 | 16.24 | 31.83 | 92.02 | 87.85 | 80.98 | 31.66 | 19.98 | 21.63 | 58.46 |
| No | 31.63 | 82.15 | 50.35 | 7.60 | 6.05 | 16.18 | 48.78 | 17.36 | 74.56 | 39.50 |
| Do not know | 27.66 | 0.18 | 16.24 | 0.68 | 1.16 | 2.58 | 18.76 | 0.09 | 1.50 | 0.21 |
| Missing | 0.61 | 1.43 | 1.57 | 0.00 | 4.94 | 0.26 | 0.80 | 63.35 | 2.29 | 1.83 |
| Willing to pay | ||||||||||
| Yes | 7.46 | 25.68 | 71.28 | 90.81 | 92.42 | 47.23 | 37.10 | 14.68 | 8.85 | 33.21 |
| No | 29.07 | 56.52 | 4.45 | 8.65 | 6.91 | 22.80 | 43.88 | 20.91 | 51.29 | 31.61 |
| Do not know | 0.46 | 16.24 | 1.71 | 0.54 | 0.66 | 10.21 | 18.76 | 64.03 | 39.61 | 34.35 |
| Missing | 70.47 | 1.55 | 2.55 | 0.00 | 0.00 | 19.77 | 0.26 | 0.38 | 0.25 | 0.85 |
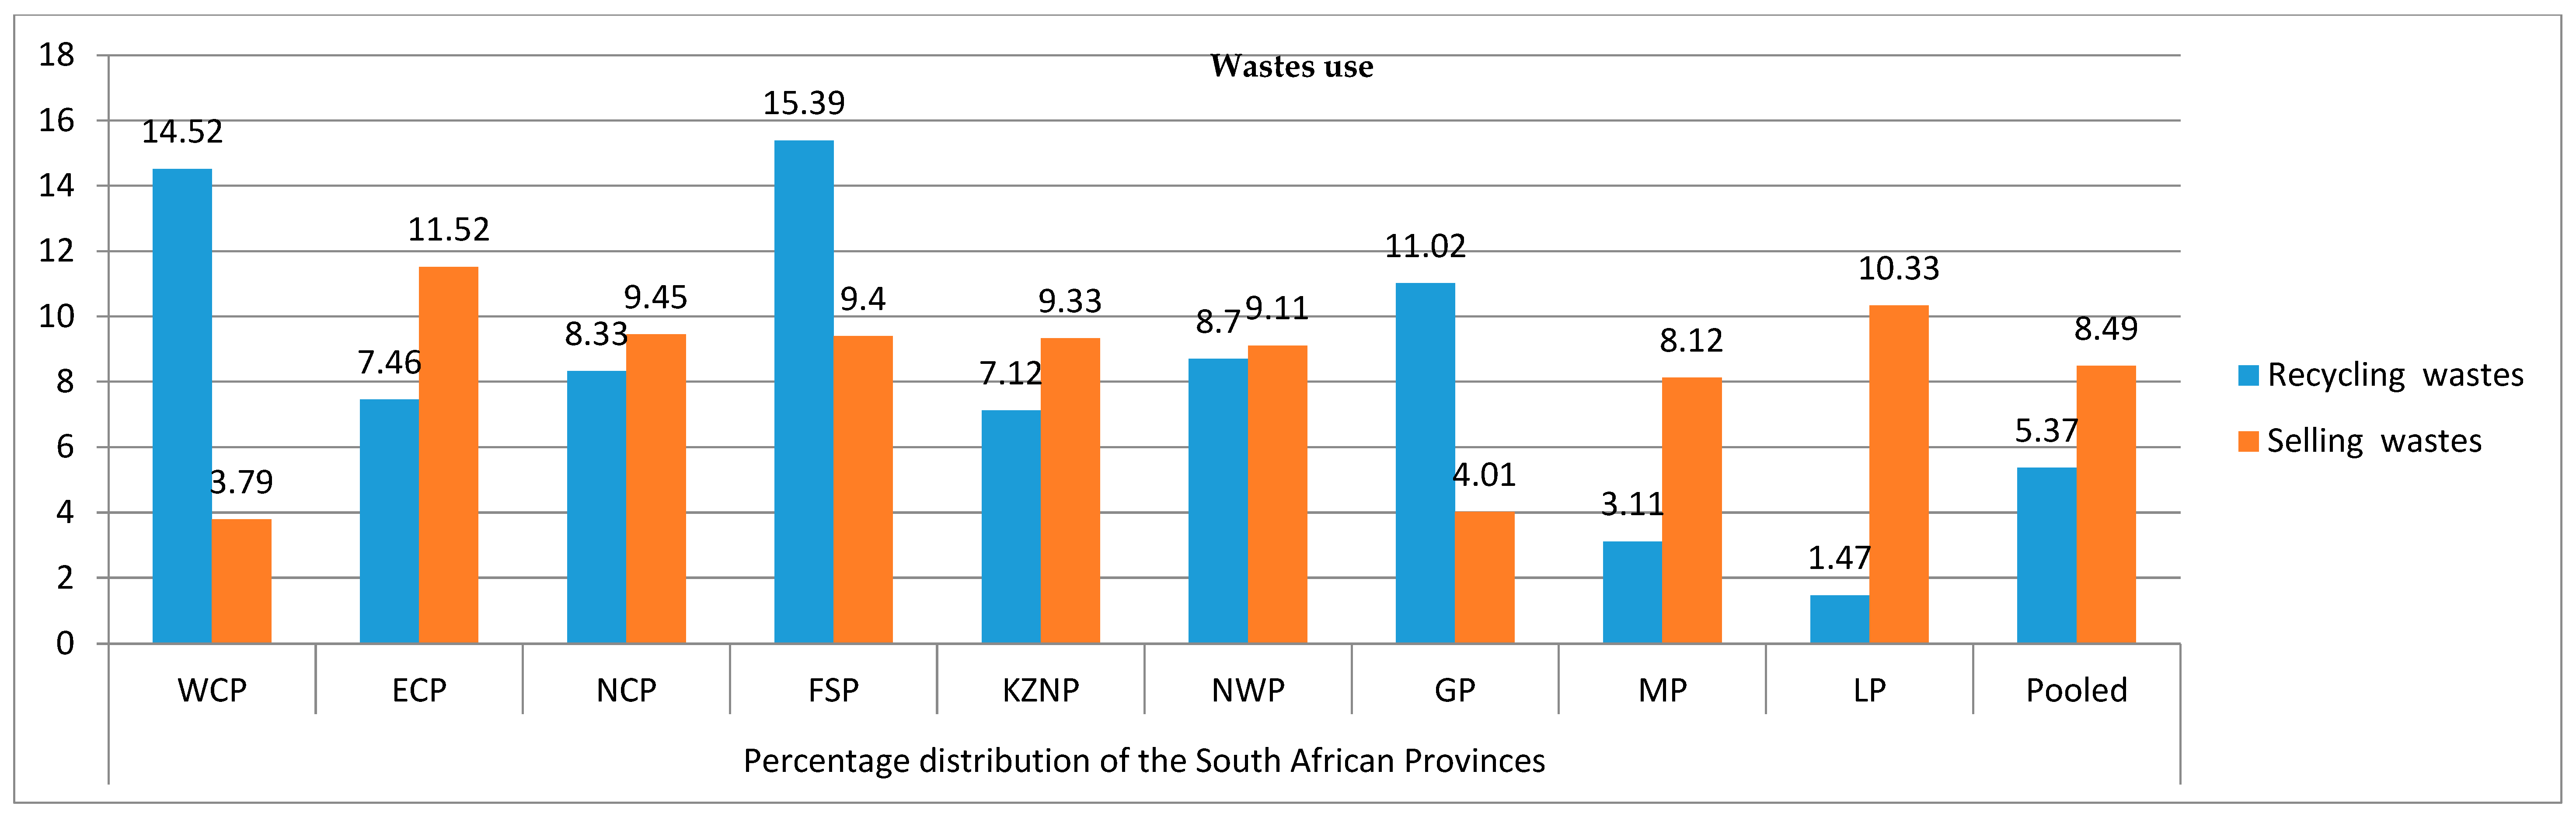
| Materials Being Recycled | Percentage Distribution of the South African Provinces | |||||||||
|---|---|---|---|---|---|---|---|---|---|---|
| WCP | ECP | NCP | FSP | KZNP | NWP | GP | MP | LP | Pooled | |
| Paper | 8.33 | 4.78 | 9.81 | 10.56 | 8.65 | 2.91 | 0.54 | 2.55 | 0.46 | 4.31 |
| Glass | 1.71 | 0.54 | 0.66 | 0.00 | 4.45 | 1.71 | 0.46 | 1.55 | 0.56 | 1.03 |
| Plastics | 7.46 | 1.28 | 3.21 | 1.33 | 0.51 | 5.56 | 1.20 | 3.00 | 0.51 | 2.01 |
| Metal | 1.28 | 1.56 | 1.81 | 0.00 | 0.00 | 0.56 | 0.00 | 0.00 | 0.51 | 0.36 |
| Oil | 1.52 | 2.11 | 0.00 | 1.71 | 1.28 | 0.00 | 0.51 | 0.56 | 0.00 | 0.51 |
| Socio-Economic Variables | Household’s Recycling Behaviour | Payment for Waste Disposal | |||||
|---|---|---|---|---|---|---|---|
| Coefficient | Std. Error | Prob. | Coefficient | Std. Error | Prob. | Tolerance | |
| Income (Rands) | 0.0021 | 0.0000 | 0.0000 | 0.0030 | 0.0004 | 0.0000 | 0.5341 |
| Household head’s age (Years) | −0.0311 | 0.0000 | 0.0000 | 0.4532 | 0.0034 | 0.0000 | 0.8721 |
| Formal education (%) | 0.0216 | 0.0001 | 0.0000 | 0.5432 | 0.0267 | 0.0000 | 0.9841 |
| Access to social grant (%) | 0.0218 | 0.0012 | 0.0000 | 0.3139 | 0.0394 | 0.0000 | 0.6723 |
| Gender (%) | −0.1179 | 0.0816 | 0.1480 | 0.0579 | 0.0124 | 0.0102 | 0.8672 |
| Dispose of refuse anywhere (%) | 0.1167 | 0.1211 | 0.1239 | 0.6754 | −0.1243 | 0.0000 | 0.8941 |
| Irregular or no waste removal (%) | 0.2171 | 0.1891 | 0.1109 | 0.1229 | −0.0332 | 0.0000 | 0.5561 |
| Littering (%) | 0.1121 | 0.0010 | 0.0010 | 0.7452 | 0.9812 | 0.1289 | 0.8871 |
| Water pollution (%) | 0.3218 | 0.0081 | 0.0000 | 0.1876 | 0.0182 | 0.0004 | 0.8631 |
| Air pollution (%) | 0.1891 | 0.1771 | 0.1127 | 0.0405 | 0.0037 | 0.0000 | 0.7611 |
| Land degradation (%) | 0.0114 | 0.0012 | 0.0000 | 0.0342 | 0.0457 | 0.1182 | 0.9611 |
| Noise pollution (%) | 0.2111 | 0.2101 | 0.3423 | 0.5341 | −0.4991 | 0.1002 | 0.4155 |
| Western Cape—WC (%) | 0.5231 | 0.1271 | 0.0000 | 0.0034 | 0.0001 | 0.0000 | 0.7842 |
| Eastern Cape—EC (%) | 0.3271 | 0.0782 | 0.0001 | 0.0738 | 0.0032 | 0.0011 | 0.8790 |
| Northern Cape—NC (%) | −0.0125 | 0.0421 | 0.3290 | 0.0113 | 0.1241 | 0.1209 | 0.7677 |
| Free State—FS (%) | 0.0212 | 0.1287 | 0.2902 | 0.1109 | 0.7320 | 0.4995 | 0.5479 |
| North West—NW (%) | −0.2109 | 0.3322 | 0.2120 | 0.0220 | −0.0090 | 0.0000 | 0.6682 |
| Mpumalanga—MP (%) | 0.1199 | 0.2331 | 0.6721 | 0.2391 | −0.4590 | 0.3290 | 0.5322 |
| Constant term | 0.0728 | 0.0002 | 0.0000 | 0.3203 | 0.0311 | 0.0003 | |
| AthRho | 0.1871 | 0.0214 | 0.0000 | 0.1984 | 0.1990 | 0.0000 | |
| Rho | 0.1784 | 0.0067 | 0.1713 | 0.1002 | |||
| Log likelihood | −16,762.872 | ||||||
| Number of Observations = 21,225; chi2 = 78.90, Prob chi2 = 0.0000 | |||||||
© 2020 by the authors. Licensee MDPI, Basel, Switzerland. This article is an open access article distributed under the terms and conditions of the Creative Commons Attribution (CC BY) license (http://creativecommons.org/licenses/by/4.0/).
Share and Cite
Omotayo, A.O.; Omotoso, A.B.; Daud, A.S.; Ogunniyi, A.I.; Olagunju, K.O. What Drives Households’ Payment for Waste Disposal and Recycling Behaviours? Empirical Evidence from South Africa’s General Household Survey. Int. J. Environ. Res. Public Health 2020, 17, 7188. https://doi.org/10.3390/ijerph17197188
Omotayo AO, Omotoso AB, Daud AS, Ogunniyi AI, Olagunju KO. What Drives Households’ Payment for Waste Disposal and Recycling Behaviours? Empirical Evidence from South Africa’s General Household Survey. International Journal of Environmental Research and Public Health. 2020; 17(19):7188. https://doi.org/10.3390/ijerph17197188
Chicago/Turabian StyleOmotayo, Abiodun Olusola, Abeeb Babatunde Omotoso, Adebola Saidat Daud, Adebayo Isaiah Ogunniyi, and Kehinde Oluseyi Olagunju. 2020. "What Drives Households’ Payment for Waste Disposal and Recycling Behaviours? Empirical Evidence from South Africa’s General Household Survey" International Journal of Environmental Research and Public Health 17, no. 19: 7188. https://doi.org/10.3390/ijerph17197188
APA StyleOmotayo, A. O., Omotoso, A. B., Daud, A. S., Ogunniyi, A. I., & Olagunju, K. O. (2020). What Drives Households’ Payment for Waste Disposal and Recycling Behaviours? Empirical Evidence from South Africa’s General Household Survey. International Journal of Environmental Research and Public Health, 17(19), 7188. https://doi.org/10.3390/ijerph17197188