Article

Evidence-Based Considerations Exploring Relations between SARS-CoV-2 Pandemic and Air Pollution: Involvement of PM2.5-Mediated Up-Regulation of the Viral Receptor ACE-2

1
Laboratory of Clinical Biochemistry, University Hospital Sant’Andrea, Department of Neurosciences, Mental Health and Sensory Organs, Faculty of Medicine and Psychology, Sapienza University, via di Grottarossa 1035, 00189 Rome, Italy
2
School of Engineering, University of Basilicata, viale dell’Ateneo Lucano 10, 85100 Potenza, Italy
3
Laboratory of Clinical Biochemistry, University Hospital Sant’Andrea, via di Grottarossa 1035, 00189 Rome, Italy
4
Structural Bioinformatics Group, Charité–Universitätsmedizin Berlin, Philippstr. 12, 10115 Berlin, Germany
5
General Direction, University Hospital Sant’Andrea, via di Grottarossa 1035, 00189 Rome, Italy
6
Department of Human Neuroscience, Sapienza University, Piazzale Aldo Moro, 5, 00185 Rome, Italy
*
Author to whom correspondence should be addressed.
Int. J. Environ. Res. Public Health 2020, 17(15), 5573; https://doi.org/10.3390/ijerph17155573
Submission received: 6 July 2020 / Revised: 27 July 2020 / Accepted: 31 July 2020 / Published: 2 August 2020
(This article belongs to the Section Infectious Disease Epidemiology)

Abstract

:
The COVID-19/SARS-CoV-2 pandemic struck health, social and economic systems worldwide, and represents an open challenge for scientists —coping with the high inter-individual variability of COVID-19, and for policy makers —coping with the responsibility to understand environmental factors affecting its severity across different geographical areas. Air pollution has been warned of as a modifiable factor contributing to differential SARS-CoV-2 spread but the biological mechanisms underlying the phenomenon are still unknown. Air quality and COVID-19 epidemiological data from 110 Italian provinces were studied by correlation analysis, to evaluate the association between particulate matter (PM)2.5 concentrations and incidence, mortality rate and case fatality risk of COVID-19 in the period 20 February–31 March 2020. Bioinformatic analysis of the DNA sequence encoding the SARS-CoV-2 cell receptor angiotensin-converting enzyme 2 (ACE-2) was performed to identify consensus motifs for transcription factors mediating cellular response to pollutant insult. Positive correlations between PM2.5 levels and the incidence (r = 0.67, p < 0.0001), the mortality rate (r = 0.65, p < 0.0001) and the case fatality rate (r = 0.7, p < 0.0001) of COVID-19 were found. The bioinformatic analysis of the ACE-2 gene identified nine putative consensus motifs for the aryl hydrocarbon receptor (AHR). Our results confirm the supposed link between air pollution and the rate and outcome of SARS-CoV-2 infection and support the hypothesis that pollution-induced over-expression of ACE-2 on human airways may favor SARS-CoV-2 infectivity.

1. Introduction

Northern Italy was among the first and worst SARS-CoV-2 affected regions in Europe. After about four months from the identification of the primary infection, the Lombardia Region still counts for about half of the total cases, new infections and total deaths. The peculiarity of the pandemic spread in a relatively small part of the country may represent a milestone to dissect and assess single factors contributing to the exacerbation of the pandemic. Italy is a small, densely populated, highly interconnected country. Industrial production and per capita wealth are distributed from north to south following a descending trend [1]. Thus, the high human mobility (national and international) in North Italy, which represents the industrial and business core of Italy, was suggested as the primary catalyzing factor for the SARS-CoV-2 spreading [2]. Yet, this is just a part of the story since other Italian regions, as Veneto, bordering on Lombardia, with a similar economic and socio-demographic background, or Lazio (Central Italy, where Rome is located) with a similar exposition to human mobility, were much less hurt. Regional differences in the health management system have also been hypothesized as additional factors affecting the intensity of the pandemic [3], especially in the early phase, before the onset of strict containment policies by the National government. The third macroscopic factor markedly different between Lombardia and the rest of Italy is the level of air pollution. Since the relationships between air pollution and different respiratory diseases are widely recognized [4,5,6], a causative role in the SARS-CoV-2 pandemic has also been hypothesized. To test the hypothesis and to estimate the extent to which exposition to air pollution can increase the risk of viral infections, we performed a statistical analysis correlating the number of infected people and COVID-19 mortality indexes in the period 20 February–31 March 2020 to the particulate matter (PM)2.5 concentration levels in 110 Italian provinces in the period 16–26 February 2020. The analysis categorized in terms of provinces allowed better appreciation of the effects of differential air pollution levels on viral infection rate and severity.
We suggest a possible biological connection between PM2.5 exposure and the human SARS-CoV-2 receptor protein ACE-2 (angiotensin-converting enzyme 2), supported by a bioinformatic analysis of the ACE-2 gene promoter region. PM2.5 particles contain different molecules, including polycyclic aromatic hydrocarbons (PAHs), heavy metals and volatile compounds [7,8,9]. PAHs are known to stimulate eukaryotic cell response by activating the transcription factor aryl hydrocarbon receptor (AhR), which in turn activates the expression of target genes by the binding of specific DNA consensus motifs, the xenobiotic response element (XRE) and the non-canonical xenobiotic response element (NC-XRE) [10,11,12,13]. We identified such motifs in the regulative region of the ACE-2 gene.

2. Materials and Methods

2.1. Data Sources and Statistics

The effective impact of PM2.5 particles on COVID-19 infection outbreak is expected to be strongly dependent on particles persistency in the air, i.e., on the duration of the effective exposure of the human respiratory system throughout the weeks preceding the pandemic onset. Thus, considering a possible time gap between population exposure to enhanced PM2.5 concentration levels and the onset of the infection and the eventual death of patients, we carried out a study to correlate the number and outcome (e.g., mortality) of COVID-19 cases in the period 20 February–31 March 2020 versus the corresponding average PM2.5 concentration values observed in the period 15–26 February 2020.
PM2.5 concentration measurements at ground level were carried out by one air quality monitoring station for each province. The ground-based network of air quality monitoring stations is run by the Regional and Provincial Environment Agencies, which manage air quality monitoring networks on behalf of regional and national governments. For those provinces for which PM2.5 concentration measurements from ground stations were not available, corresponding analyses produced by the Copernicus Atmosphere Monitoring Service (CAMS) of the European Centre for Medium-Range Weather Forecasts (ECMWF) were used, since these PM2.5 values reproduce well measurements from ground stations (Figure 1). ECMWF–CAMS analyses are provided with hourly resolution and a grid size of 10 × 10 km. The CAMS near-real-time reanalysis is the most recent global reanalysis data set of atmospheric composition and air quality [14], with a demonstrated unprecedented level of accuracy and space–time resolution.
Data on the population for all Italian provinces has been extracted from the ISTAT Dataset [15], while the number of infected patients has been extracted from the Italian Civil Protection Department database [16]. The number of deaths due to COVID-19 over the time period 20 February–31 March 2020 for the 110 Italian provinces are from the Italian Statistics Institute (ISTAT) report [1].
Data include 107 provinces as four provinces in Southern Sardinia (Carbonia-Iglesias, Ogliastra, Olbia-Tempio and Medio Campidano) have been grouped together as “Sud Sardegna”.
The “incidence of the pathology”, which quantifies the frequency with which a pathology appears in a particular population [17], was defined as the number of infected people in a province over the province population (infected/population ratio). The “mortality rate” for COVID-19 was defined as the number of deaths normalized to the province population [18], which quantifies the frequency of death occurrence in a defined population. The “case fatality rate” (CFR) [19], also called case fatality risk or case fatality ratio, is defined as the proportion of people who die from a specified pathology among all individuals diagnosed with the pathology over a certain period of time.
To study correlations between the above-mentioned indexes and the level of PM2.5, a linear fit was applied to the data using a linear regression function. Assuming that population exposure to enhanced PM2.5 concentration levels should precede enhanced susceptibility to viral infection, we sought to correlate number and outcome (e.g., mortality) of COVID-19 cases in the period 20 February–31 March 2020 versus the corresponding average PM2.5 concentration values observed in the period 15–26 February 2020. Statistics were performed using the statistical software Origin (v7.0220) by OriginLab Corporation.

2.2. Bioinformatic Analysis of the ACE-2 Gene

The regulative DNA sequence (promoter region) upstream of the protein coding region of the ACE-2 gene was analyzed by the BKL TRANSFAC software from Biobase Gmbh [20], which allows the identification of binding sites (e.g., consensus DNA motifs) for transcription factors. Briefly, the ACE-2 Reference Sequence (NG_012575.1) was obtained from the NCBI Nucleotide Database [21]. Five DNA kilobases spanning the promoter region were scanned to detect the XRE core element: 5′-GCGTG-3′ [12] and the NC-XRE core element 5′-GGGA-3′ [13].

3. Results

3.1. Covid-19/PM2.5 Correlations

The PM2.5/PM10 concentrations in Italy, as provided by the near-real-time ECMWF-CAMS analysis few days before the identification of the “patient one”, are shown in Figure 2. Compared to the limit values of 25 µg/m3 for PM2.5 and 50 µg/m3 for PM10 stated by the WHO Air quality guideline [22], large areas in the Po Valley presented diffused and high concentrations of particulate matter, with a peak of intensity roughly corresponding with the Lombardia Region. In particular, enhanced PM concentrations were present over a large portion of the Po Valley, with levels of PM2.5 up to 70 µg/m3 and levels of PM10 up to 50 µg/m3 in Lombardia. Interestingly, while PM10 concentrations are typically higher than PM2.5 concentrations, comparable amounts of these two species were found in the last two weeks of February 2020 in most areas of the Po Valley (data not shown), with temporary situations where PM2.5 concentrations were found to be systematically higher than corresponding PM10 values by approximately 10 µg/m3. Figure 2 testifies to one of these occurrences. More specifically, the 12-days preceding the pandemic onset in Italy (15 to 26 February 2020) were characterized by high particle pollution, with elevated and persistent PM2.5 levels over large portions of the Po Valley, with an average value for the period exceeding 40 µg/m3. In this same period, PM2.5 concentration analyses in two Lombard cities, Bergamo and Brescia, revealed very high peak values (up to ~80 µg/m3) at specific times of the day, such peaks being not detected by daily-averaged ground station measurements (Figure 1).
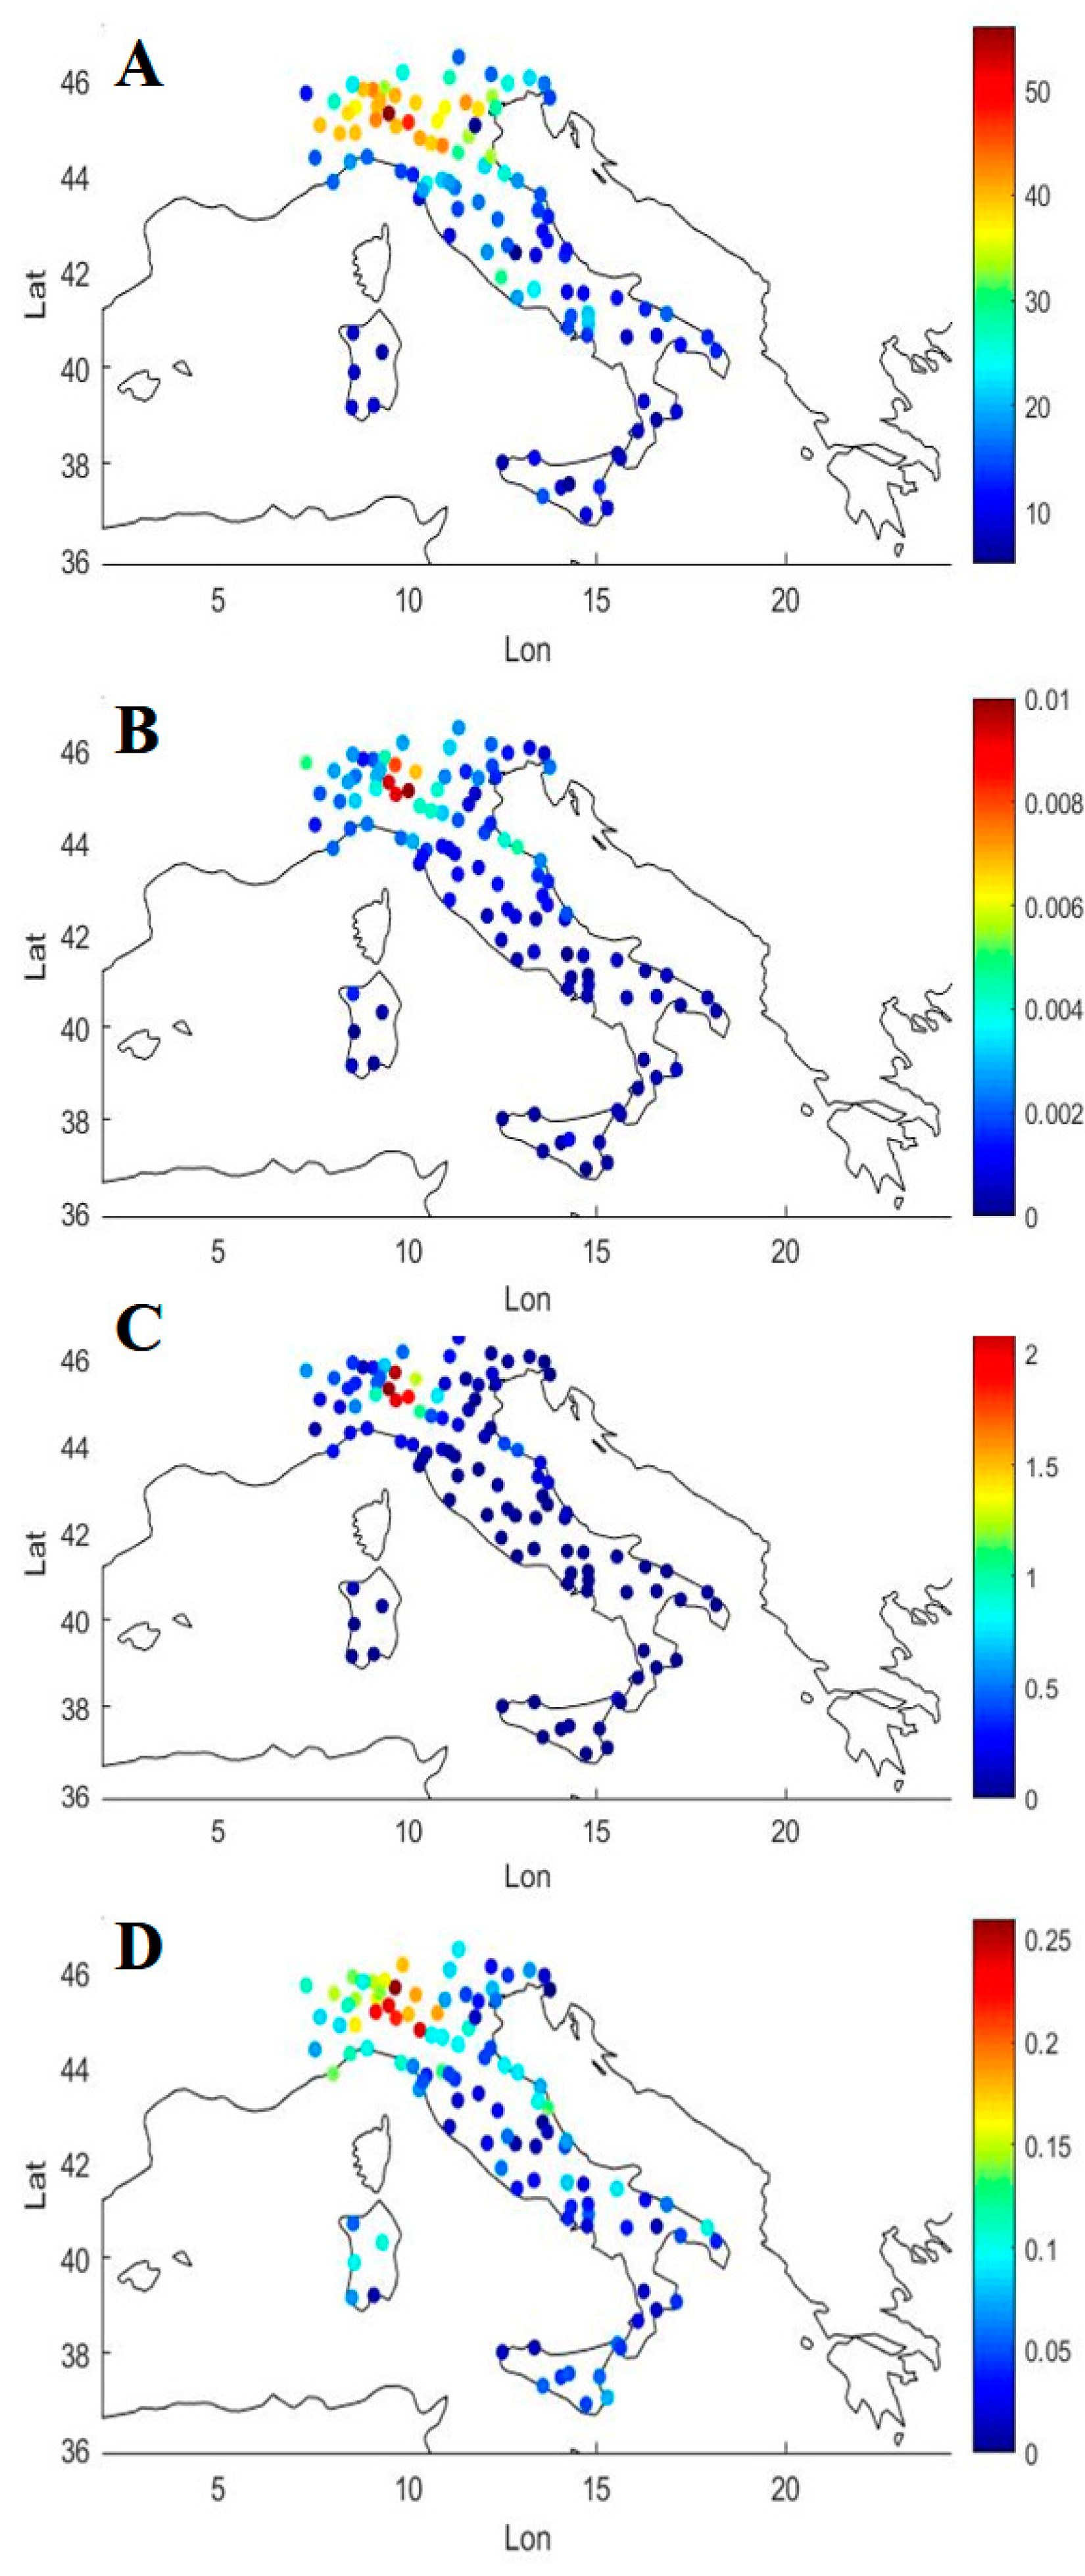
Surface PM2.5 concentration measurements from ground stations and COVID-19 epidemiology are shown in Figure 3 for the 110 Italian provinces with color-coded maps. Visual inspection reveals good overlap in the intensity scale between PM2.5 concentration values, averaged over the period 15–26 February 2020 (panel A), and COVID-19 epidemiology over the period 20 February–31 March 2020, e.g., the incidence of COVID-19 cases (panel B), the mortality rate (panel C) and the case fatality rate (panel D).
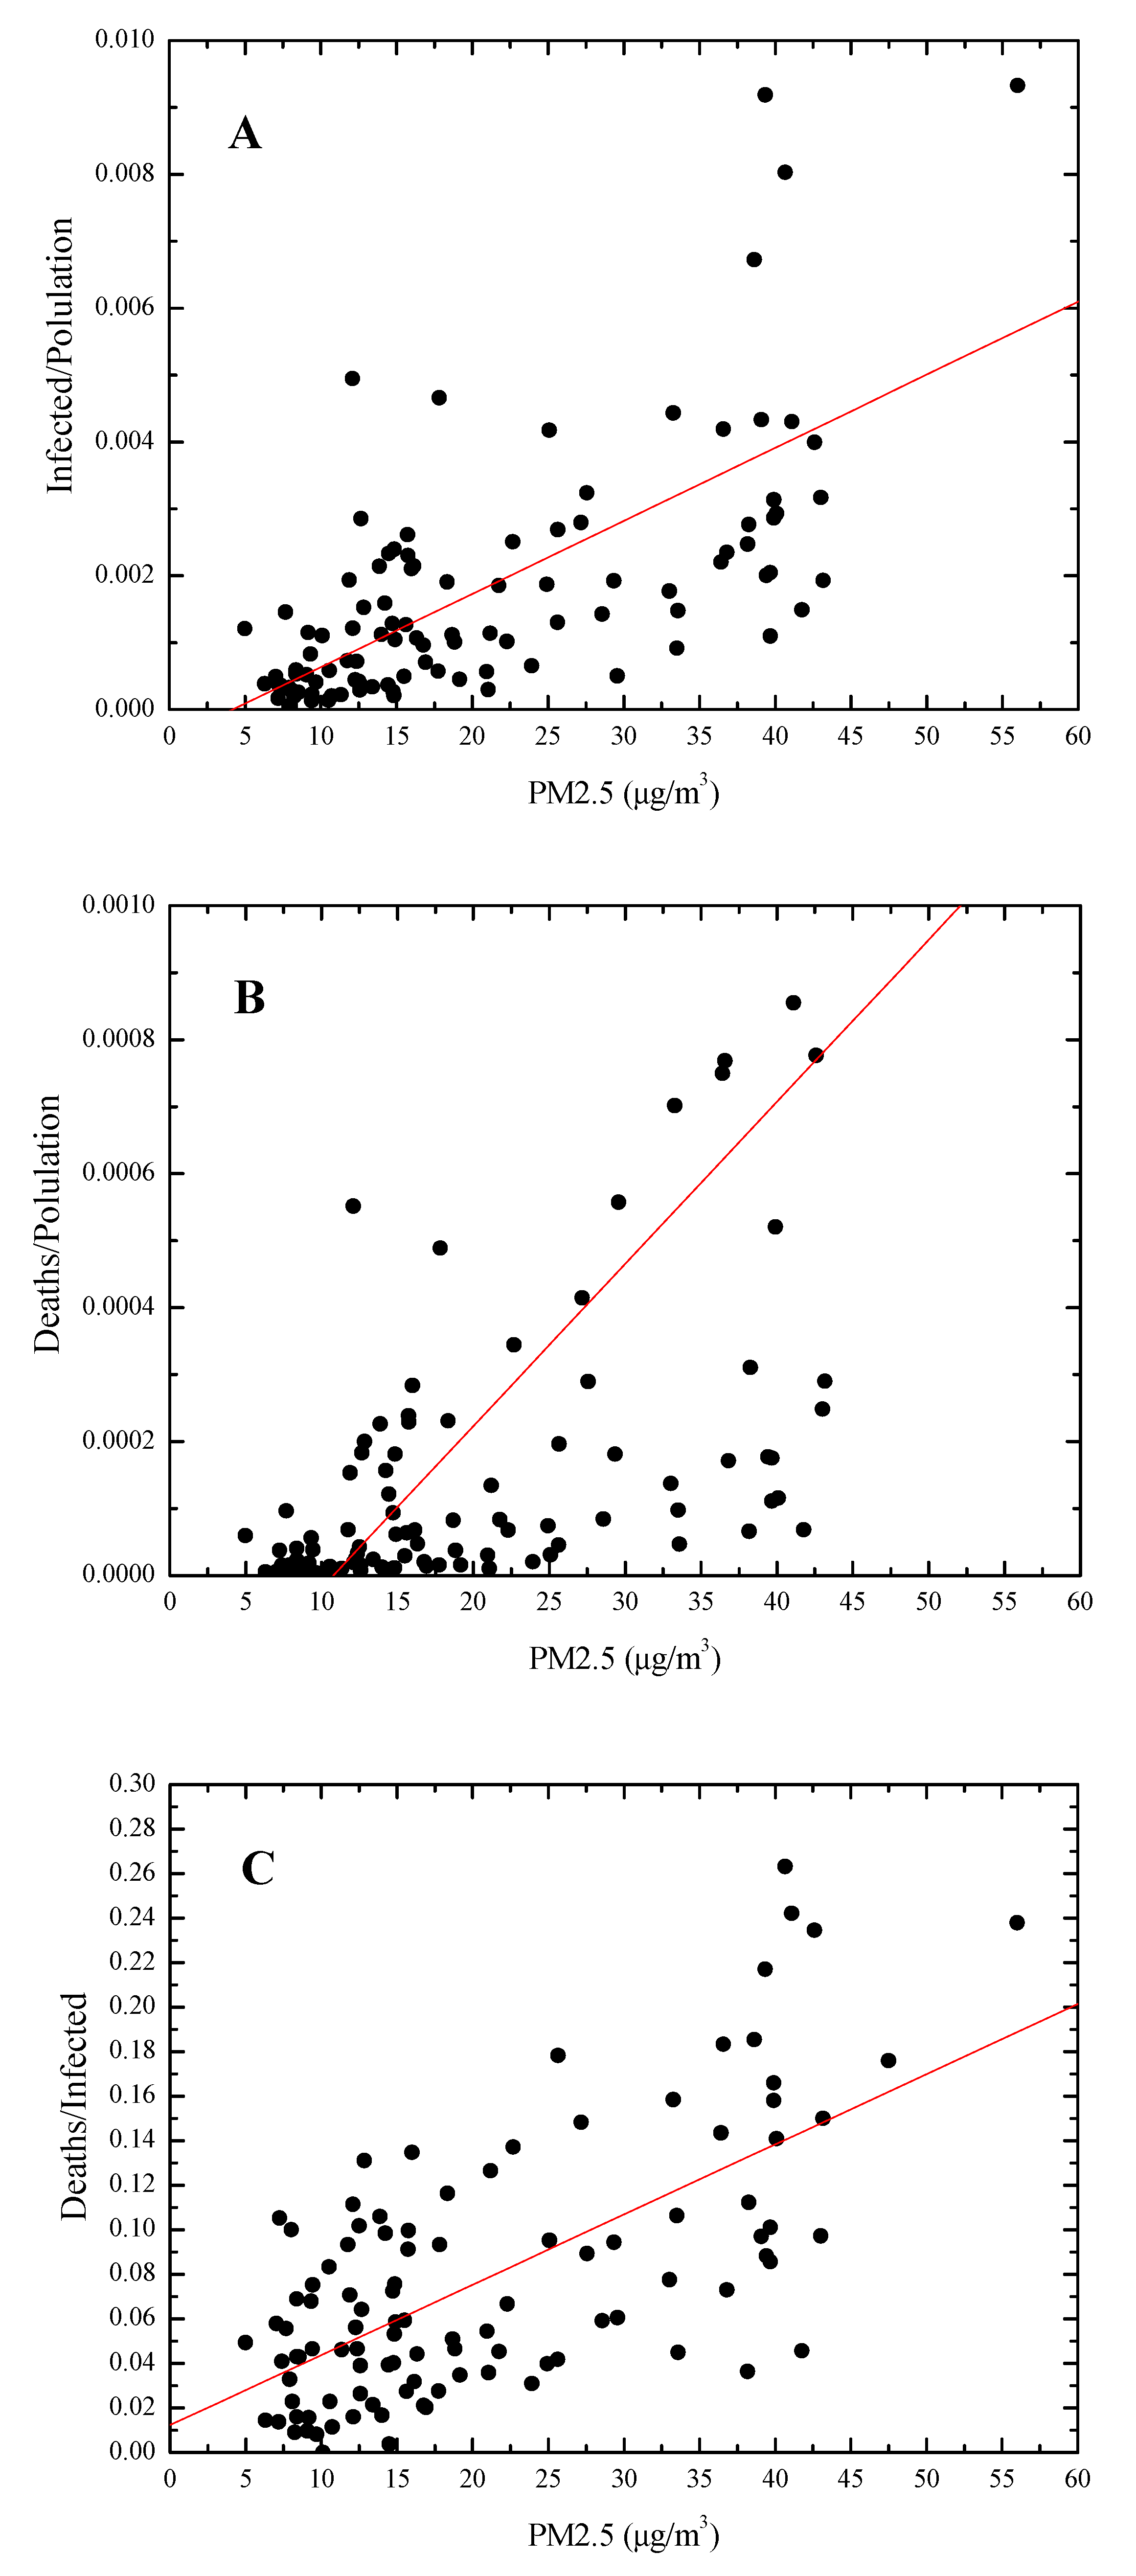
The correlations between PM2.5 and COVID-19 cases and outcome were statistically significant. In detail, we found a positive correlation (r = 0.67, p < 0.0001) between the average PM2.5 level in the period 15–26 February 2020 and the incidence of COVID-19 (infected/population ratio) in the period 20 February–31 March 2020 (Figure 4, panel A). The slope of the regression line, that was (1.1 ± 0.1) × 10-4 m3/µg, implies a tripling (from 0.065 to 0.2%) of the infection rate for average PM2.5 concentration levels increasing from 10 to 22 µg/m3.
The average PM2.5 level was positively correlated also with the mortality rate (r = 0.65, p < 0.0001) and with the case fatality rate (r = 0.7, p < 0.0001) (Figure 4, panels B, C). The case fatality rate (deaths/infected ratio) appears to be strongly dependent on PM2.5 concentration, with a slope of the regression line of (3.1 ± 0.3) × 10-3 m3/µg which implies a doubling (from 4.5 to 9%) of the mortality rate of infected patients for average PM2.5 concentration levels increasing from 10 to 25 µg/m3.
None of the analyzed parameters correlated with the population density of the Italian provinces (r = 0.045, p = 0.65 for the infection rate; r = 0.19, p = 0.051 for the mortality rate, r = 0.093, p = 0.34 for the case fatality rate).

3.2. Bionformatic Analysis

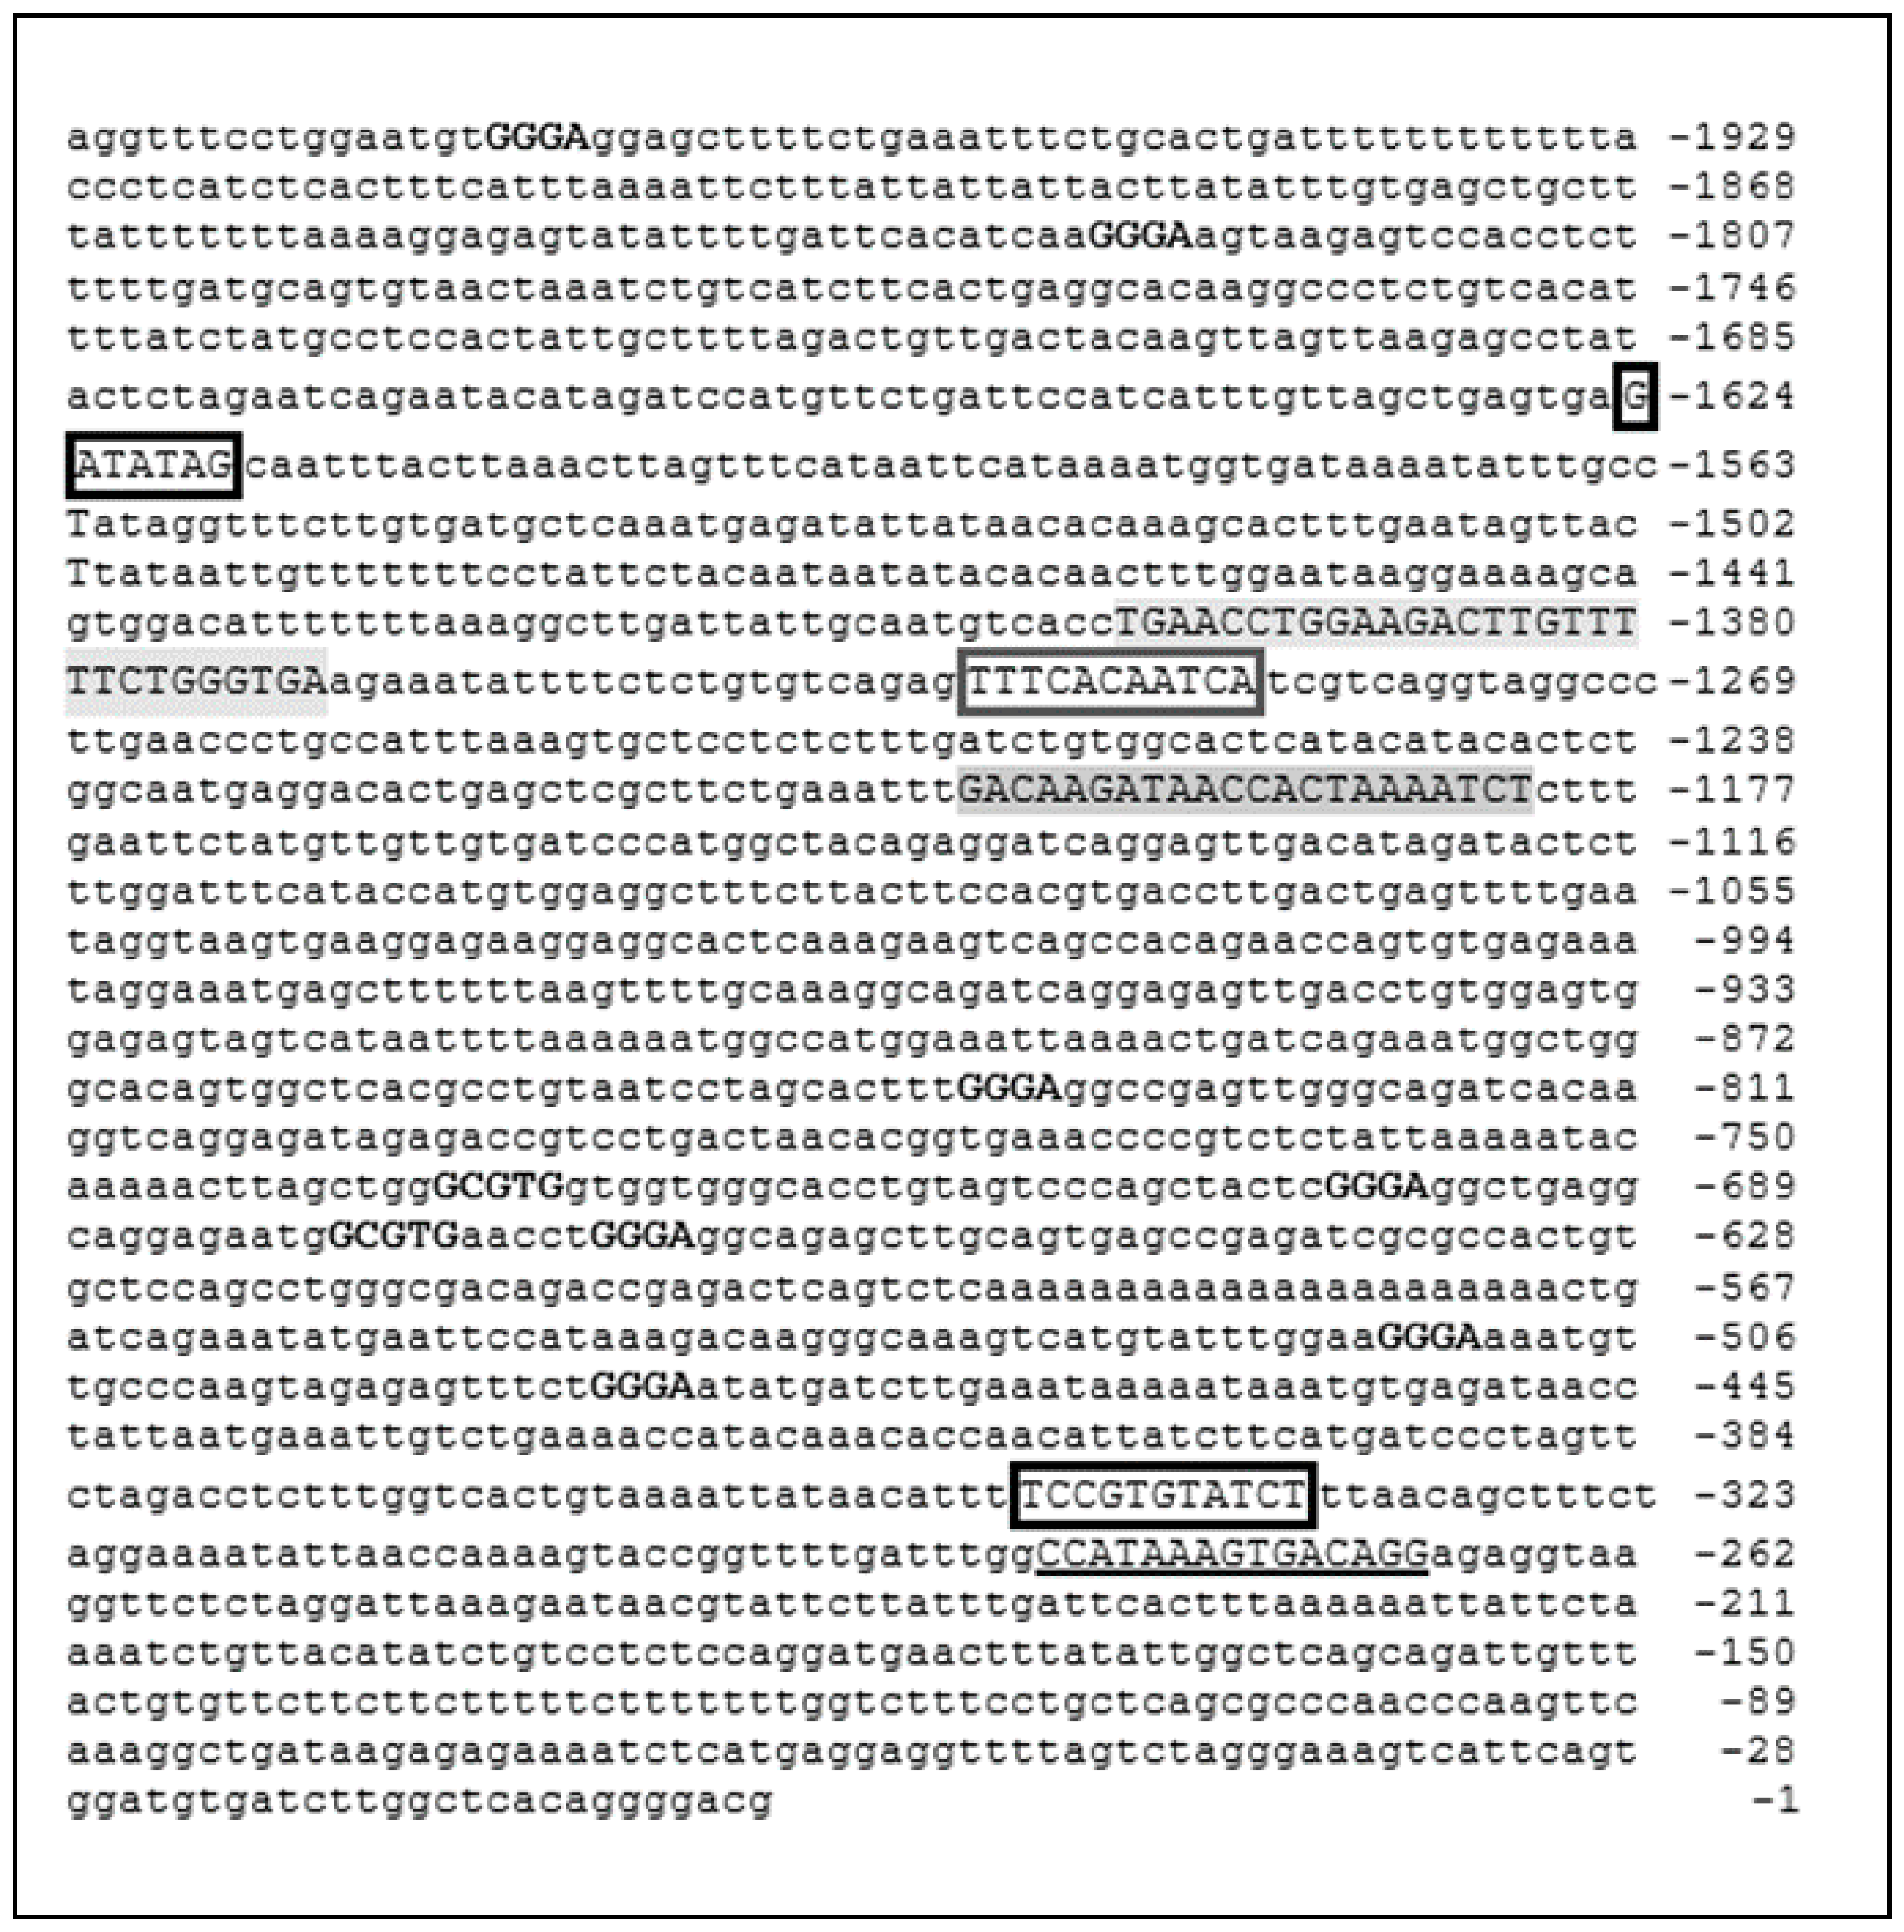
The DNA sequence of the ACE-2 promoter region is reported in Figure 5. Two XREs have been identified at position −673/−677 and −730/−734 and seven NC-XREs have been identified at position −481/−484, −512/−515, −663/−666, −697/−700, −833/−837, −1824/−1827 and −1960/−1963.

4. Discussion

In Italy, the SARS-CoV-2 pandemic strongly affected the northern part of the country, compared to other areas with similar socio–economic and demographic backgrounds or similar exposure to human movements. In the early pandemic phase, this geographical pattern could not be sufficiently explained by the containment effect of legal restrictions to human movements, which started on 9 March 2020.
North Italy is among the most air-polluted regions of the world [23]. Atmospheric concentrations of PM2.5 and PM10 are interrelated within atmospheric chemical processes involving volatile organic compounds and ozone. Primary sources of PM2.5/PM10 particles, mainly associated with biomass combustion (pellet stoves or wood), diesel engines, and vehicular mobility, are predominant in Northern Italy, but secondary aerosol formation represents an additional important source.
Enhanced levels of PM2.5 particles were observed over the two-month period January–February 2020 preceding the virus pandemic spread. WHO air quality guidelines for PM2.5 (<25 µg/m3) were exceeded on ~45 days over this two-month period in the most part of the Po Valley, where major effects in terms of infections and casualties occurred, with levels up to 60–70 µg/m3 observed within the 2–3 weeks preceding the contagious activation and with an average value in the period 15–26 February 2020 exceeding 40 µg/m3 over large portions of the Po Valley (data not shown).
Long-term exposure to particulate matter (PM), fine particles, and nitrogen compounds is well recognized as a risk factor for all-cause deaths, lung cancer, and other pulmonary pathologies [24,25,26]. The relationship between air pollution and viral respiratory infections has been poorly investigated, but a recent study from Murtas and Russo [27] describes a significant association between the increased mortality observed in winter 2016–2017 in Milan (Lombardia) and a combination of influenza and high levels (60 and 70 μg/m3) of PM10. Furthermore, a specific link between the mortality rate of the 2002 SARS-CoV-1 infection in China and air pollution has been evidenced [28]. Many papers are now appearing describing correlations between air pollutant and SARS-CoV-2 spreading. Different reports from China, which was first affected by the pandemic and has relevant pollution problems, found significant links between different pollutants, including PM2.5, and COVID-19 confirmed cases [29,30] and similar associations were evidenced in the United States [31]. In Italy, the association of pollution with increased rates of COVID-19 cases was first proposed by Conticini et al. [32]. Soon after, Fattorini and Regoli [33] demonstrated a statistically significant correlation with various pollutants (NO2, O3, PM2.5 and PM10) with the number of COVID-19 cases in 71 Italian provinces. The association with total confirmed and daily new cases of infection and with total deaths was then confirmed in the city of Milan (Lombardia) [34]. During the preparation of the present manuscript, a paper from Frontera et al. reported a correlation between regional level of PM2.5 and infection rates [35], also suggesting the up-regulation of ACE-2, driven by pollution, as a candidate molecular mechanism to explain the phenomenon.
Being confirmatory of previous general results, data from our study give an in-deep look at the strength of correlation between PM2.5 and the extent of the COVID-19 outbreak. In particular, we performed correlation analysis: (i) considering data from all Italian provinces and (ii) considering the COVID-19 cases and outcomes normalized by the population (incidence and mortality rate) or by the infected population (case fatality risk). This approach allowed us to take into account the high variability in both population density and air pollution levels, which are typical conditions of the Italian territory, and which might represent confounding factors in the correlation analysis. Indeed, we obtained higher correlation coefficients than previously reported data evaluating the absolute number of cases [34]. Furthermore, correlating air quality data collected in a time window moved back a few days compared to the epidemiological data, we ascertained that the level of people’s exposure to the environmental “risk factor” was persistent in the analysed period, and that the exposition period (4–5 days) was enough to induce a biological response in human tissues.
The analysis showed that the infection rate triples for average PM2.5 concentration levels increasing from 10 to 25 µg/m3 and the case fatality risk doubles for average PM2.5 concentration levels increasing from 10 to 22 µg/m3, strengthening the supposed role of PM2.5 as an enhancer of both SAS-CoV-2 infectivity and virulence, e.g., the severity of the disease as measured by its lethality. The demonstration of a definite implication of air pollution in the present viral pandemic should have strong implications for future directions of environmental policies from national and international governments. However, it is difficult to imagine, in the near future, a firm commitment to reduce pollution from lawyers and economical stakeholders. Thus, it is essential to identify the molecular pathways specifically triggered by prolonged exposition to pollutants, and which may in turn act as predisposing factors for viral infection. This knowledge would allow the design of prophylactic or treatment strategies to mitigate the increased risk to exposed populations. Enhanced persistence of the virus in the air, promotion of a pro-inflammatory state, immune dysregulation, disturbance of pulmonary surfactant homeostasis and increased expression of the viral receptor ACE-2 [36] have been proposed as possible links between air pollution and COVID-19. The latter represents a general mechanism supposed to increase the susceptibility to SARS-CoV-2 infection through an elevated number of viral receptors on the host cells. The novel coronavirus enters the cell through binding of the capsid Spike protein to the cellular surface protein ACE-2, an enzyme involved in regulation of cardiovascular physiology and with a clear role in regulation of inflammation processes. The differential expression level of ACE-2 in various human tissues explains the COVID-19 symptomatology: it is extensively expressed in the upper part of the esophagus, in the lung, in enterocytes [37]. This suggests that pathophysiologic conditions involving increased expression of ACE-2 in the upper respiratory tract and lungs, making available more viral entry sites, might enhance susceptibility to infection and eventually exacerbate the progression of the disease. Accordingly, the different prevalence and severity of COVID-19 in male and females gave rise to the hypothesis of differential, gender-related expression of ACE-2. Even if a clear evidence of such sex difference is not available, an interesting paper from Gemmati et al. [38] recently emphasized that ACE-2 is an X-linked gene, and that mosaicism in heterozygous female may contribute to protective mechanisms compared to the hemizygous male. Similarly, ACE-2 up-regulation following treatment with anti-hypertensive drugs such a angiotensin AT1 receptor blockers, has been proposed as contributing to the increased susceptibility of aged peoples to COVID-19 [39]. On the contrary children, having very a low SARS-CoV-2 infection rate, present a notable reduction of ACE-2 in nasal epithelium compared to adults [40]. Finally, in smokers increased ACE-2 expression has been reported compared to non-smokers [41], suggesting smoke as an additional risk factor for SARS-CoV-2 infection. The issue is debated, since early epidemiological data do not support the hypothesis, albeit important bias in these statistics has been highlighted [42]. However, lung inflammatory conditions other than smoking have been related to dysregulation of ACE-2 expression, such as bacterial infections, chronic obstructive pulmonary disease and pulmonary fibrosis [43,44,45].
The eventual up-regulation of ACE-2 in response to pro-inflammatory stimuli might be explained by its physiological role in the renin-angiotensin system. This pathway includes the angiotensinogen-converting enzyme (ACE) and ACE-2, which act with opposite effects to regulated inflammation: whereas ACE elicits production of pro-inflammatory factors, ACE-2 hinders their expression, enhancing anti-inflammatory molecules. The balance between ACE and ACE-2 activities determines the progression or the quenching of the inflammation process and the exposure to pro-inflammatory molecules stimulates, as a defense mechanism, the expression of ACE-2. Air pollution, particularly PM2.5, are among the exogenous triggers of inflammation in upper and lower airways. Indeed, in vivo experiments using a mouse model clearly demonstrated that instillation of PM 2.5 in the lungs induces ACE-2 over-expression [46], and that following persistent exposure to the noxious particles, the augmented ACE-2 activity induces protection against inflammation.
In summary, the hypothesized scenario is that prolonged exposition to PM2.5 of the population in North Italy promotes a pro-inflammatory milieu in the airways, inducing stable up-regulation of ACE-2 as a cellular response aimed to contrast the progression of the inflammatory state. However, this causes the exposition, on the surface of respiratory cells, of a greater number of docking sites for the entry by the virus, favoring infectivity. Notably, following the binding of the viral spike protein, the level of ACE-2 on the cell surface decreases [47], shifting the ACE/ACE-2 balance towards activation of the inflammatory cascade, which represent a hallmark of COVID-19.
Here we report the first supporting evidence for the proposed biological mechanism, describing the presence, in the regulative region of the ACE-2 gene, of putative consensus motifs for the transcription factor AhR. AhR is stimulated by many endogenous and exogenous signals, including environmental pollutants such as PAHs and other noxious molecules contained in PM [48,49,50], and different ligands may specifically activate different genes’ subsets [51]. Besides the primary role in chemical defense by up-regulation of detoxifying xenobiotic enzymes, transforming toxicants into metabolites more easily excreted from the body [52], AhR acts to regulate microbial defense, organ development, immunity and inflammation [53].
The specific subsets of genes regulated by ligand-activated AhR are determined by modulation of its activities through cooperation with a plethora of regulative proteins, [53] and by the specific DNA sequences in the target genes. Indeed, the extent to which a target gene is up-regulated depends on the number, the sequence and the position of consensus binding motifs. These features might affect the affinity of the transcription factor for the DNA sequence and also the eventual cooperation with other regulative proteins bound to different DNA motifs.
We identified a total of nine putative DNA consensus motifs for the binding of AhR (2 XRE, 7 NC-XRE), proximal to various putative binding motifs for core and regulative transcriptional factors (Figure 5). This observation is strongly suggestive and supporting of the hypothesis that pollution-induced over-expression of ACE-2 may favor SARS-CoV-2 infectivity. However, to definitely demonstrate that AhR may control the actual protein level of ACE-2, in vitro studies investigating the effect of disruption (by mutational analysis) of putative AhR binding DNA motifs in the ACE-2 gene should be performed.

5. Conclusions

It is to be pointed out that a positive correlation between COVID-19 epidemiologic data and PM2.5 concentration levels does not imply a direct and univocal causation, but PM2.5 pollution is certainly one of several factors that influenced the pandemic outbreak in Northern Italy in the period February–March 2020. Interestingly, population density seems far less important than PM pollution in COVID-19 diffusion dynamics. Further investigations are needed to confirm that air pollution may modulate ACE-2 expression by activation of the AhR, and comparison of ACE-2 expression in the airways of people living in high polluted areas, compared to people living in healthier environments, would be fundamental.

Author Contributions

Conceptualization, M.B., R.P., S.F. and M.S.; Data curation, M.B., P.D.G., G.G. and R.P.; Formal analysis, P.D.G. and G.G.; Investigation, G.G. and O.D.L.; Methodology, P.D.G., G.G. and O.D.L.; Project administration, M.S.; Supervision, M.B., A.M. and M.S.; Writing—original draft, M.B. and P.D.G.; Writing—review and editing, M.B., P.D.G., G.G. and S.F. All authors have read and agreed to the published version of the manuscript.

Funding

This research received no external funding.

Acknowledgments

We wish to acknowledge Stefano Natali and MEEO S.r.l. for the provision of ECMWF-CAMS analysis data and its graphical display through the ADAM platform (https://adamplatform.eu). We also wish to thank Benedetto De Rosa for his support in the graphical display of the epidemiologic data.

Conflicts of Interest

The authors declare no conflict of interest.

References

  1. Petrelli, A.; Di Napoli, A.; Perez, M.; Gargiulo, L. The health status of the immigrant population in Italy: Evidence from multipurpose surveys of the Italian National Institute of Statistics (Istat). Epidemiol. Prev. 2017, 41, 1–68. [Google Scholar] [PubMed]
  2. Wells, C.R.; Sah, P.; Moghadas, S.M.; Pandey, A.; Shoukat, A.; Wang, Y.; Wang, Z.; Meyers, L.A.; Singer, B.H.; Galvani, A.P. Impact of international travel and border control measures on the global spread of the novel 2019 coronavirus outbreak. Proc. Natl. Acad. Sci. USA 2020, 117, 7504–7509. [Google Scholar] [CrossRef] [PubMed] [Green Version]
  3. Capalbo, C.; Aceti, A.; Simmaco, M.; Bonfini, R.; Rocco, M.; Ricci, A.; Napoli, C.; Rocco, M.; Alfonsi, V.; Teggi, A.; et al. The Exponential Phase of the Covid-19 Pandemic in Central Italy: An Integrated Care Pathway. Int. J. Environ. Res. Public Health 2020, 17, 3792. [Google Scholar] [CrossRef] [PubMed]
  4. Schraufnagel, D.E.; Balmes, J.R.; Cowl, C.T.; De Matteis, S.; Jung, S.H.; Mortimer, K.; Perez-Padilla, R.; Rice, M.B.; Riojas-Rodriguez, H.; Sood, A.; et al. Air Pollution and Noncommunicable Diseases: A Review by the Forum of International Respiratory Societies’ Environmental Committee, Part 1: The Damaging Effects of Air Pollution. Chest 2019, 155, 409–416. [Google Scholar] [CrossRef] [Green Version]
  5. Burney, P.; Amaral, A.F.S. Air pollution and chronic airway disease: Is the evidence always clear? Lancet 2019, 394, 2198–2200. [Google Scholar] [CrossRef]
  6. Manisalidis, I.; Stavropoulou, E.; Stavropoulos, A.; Bezirtzoglou, E. Environmental and Health Impacts of Air Pollution: A Review. Front. Public Health 2020, 8. [Google Scholar] [CrossRef] [Green Version]
  7. Wang, S.; Ji, Y.; Zhao, J.; Lin, Y.; Lin, Z. Source apportionment and toxicity assessment of PM2.5-bound PAHs in a typical iron-steel industry city in northeast China by PMF-ILCR. Sci. Total Environ. 2020, 713, 136428. [Google Scholar] [CrossRef]
  8. Li, Y.; Lin, T.; Wang, F.; Ji, T.; Guo, Z. Seasonal variation of polybrominated diphenyl ethers in PM2.5 aerosols over the East China Sea. Chemosphere 2015, 119, 675–681. [Google Scholar] [CrossRef]
  9. Wang, K.; Wang, W.; Li, L.; Li, J.; Wei, L.-L.; Chi, W.; Hong, L.; Zhao, Q.; Jiang, J. Seasonal concentration distribution of PM1.0 and PM2.5 and a risk assessment of bound trace metals in Harbin, China: Effect of the species distribution of heavy metals and heat supply. Sci. Rep. 2020, 10, 8160. [Google Scholar] [CrossRef]
  10. Moorthy, B.; Chu, C.; Carlin, D.J. Polycyclic Aromatic Hydrocarbons: From Metabolism to Lung Cancer. Toxicol. Sci. 2015, 145, 5–15. [Google Scholar] [CrossRef] [Green Version]
  11. Ma, Q. Induction of CYP1A1. The AhR/DRE paradigm: Transcription, receptor regulation, and expanding biological roles. Curr. Drug Metab. 2001, 2, 149–164. [Google Scholar] [CrossRef] [PubMed]
  12. Wright, E.J.; De Castro, K.P.; Joshi, A.D.; Elferink, C.J. Canonical and non-canonical aryl hydrocarbon receptor signaling pathways. Curr. Opin. Toxicol. 2017, 2, 87–92. [Google Scholar] [CrossRef] [PubMed]
  13. Huang, G.; Elferink, C.J. A novel nonconsensus xenobiotic response element capable of mediating aryl hydrocarbon receptor-dependent gene expression. Mol. Pharmacol. 2011, 81, 338–347. [Google Scholar] [CrossRef] [Green Version]
  14. Inness, A.; Engelen, R.; Flemming, J. The new CAMS global reanalysis of atmospheric composition. ECMWF Newsl. 2019, 15, 37–43. [Google Scholar]
  15. ISTAT DataSet. Available online: http://dati.istat.it/Index.aspx?DataSetCode=DCIS_POPRES1 (accessed on 12 June 2020).
  16. Italian Civil Protection Department database. Available online: https://www.arcgis.com/apps/opsdashboard/index.html#/b0c68bce2cce478eaac82fe38d4138b1 (accessed on 12 June 2020).
  17. Shields, L.; Twycross, A. The difference between incidence and prevalence. Paediatr. Nurs. 2003, 15, 50–51. [Google Scholar] [CrossRef]
  18. Gülmezoglu, A.M.; Say, L.; Betrán, A.P.; Villar, J.; Piaggio, G. WHO systematic review of maternal mortality and morbidity: Methodological issues and challenges. BMC Med. Res. Methodol. 2004, 4, 16. [Google Scholar] [CrossRef] [Green Version]
  19. Harrington, R.A. Case Fatality Rate. Encyclopædia Britannica Website. Available online: https://www.britannica.com/science/case-fatality-rate (accessed on 12 June 2020).
  20. TRANSFAC. 2020. Available online: http://genexplain.com/transfac/ (accessed on 12 June 2020).
  21. NCBI Nucleotide Database. Available online: https://www.ncbi.nlm.nih.gov/nucleotide/ (accessed on 12 June 2020).
  22. WHO Air Quality Guidelines for Particulate Matter, Ozone, Nitrogen Dioxide and Sulfur Dioxide. Global Update 2005. Available online: https://apps.who.int/iris/bitstream/handle/10665/69477/WHO_SDE_PHE_OEH_06.02_eng.pdf?sequence=1 (accessed on 12 June 2020).
  23. Carugno, M.; Consonni, D.; Randi, G.; Catelan, D.; Grisotto, L.; Bertazzi, P.A.; Biggeri, A.; Baccini, M. Air pollution exposure, cause-specific deaths and hospitalizations in a highly polluted Italian region. Environ. Res. 2016, 147, 415–424. [Google Scholar] [CrossRef] [Green Version]
  24. Beelen, R.; Raaschou-Nielsen, O.; Stafoggia, M.; Andersen, Z.J.; Weinmayr, G.; Hoffmann, B.; Wolf, K.; Samoli, E.; Fischer, P.; Nieuwenhuijsen, M. Effects of long-term exposure to air pollution on natural cause mortality: An analysis of 22 European cohorts within the multicenter ESCAPE project. Lancet 2014, 383, 785–795. [Google Scholar] [CrossRef]
  25. Li, T.; Zhang, Y.; Wang, J.; Xu, D.; Yin, Z.; Chen, H.-S.; Lv, Y.; Luo, J.; Zeng, Y.; Liu, Y.; et al. All-cause mortality risk associated with long-term exposure to ambient PM2·5 in China: A cohort study. Lancet Public Health 2018, 3, e470–e477. [Google Scholar] [CrossRef] [Green Version]
  26. Losacco, C.; Perillo, A. Particulate matter air pollution and respiratory impact on humans and animals. Environ. Sci. Pollut. Res. 2018, 25, 33901–33910. [Google Scholar] [CrossRef]
  27. Murtas, R.; Russo, B. Effects of pollution, low temperature and influenza syndrome on the excess mortality risk in winter 2016–2017. MC Public Health 2019, 19, 1445. [Google Scholar] [CrossRef] [PubMed]
  28. Cui, Y.; Zhang, Z.F.; Froines, J.; Zhao, J.; Wang, H.; Yu, S.Z.; Detels, R. Air Pollution and Case Fatality of SARS in the People’s Republic of China: An Ecologic Study. Environ. Health 2003, 2, 15. [Google Scholar] [CrossRef] [PubMed] [Green Version]
  29. Yongjian, Z.; Jingu, X.; Fengming, H.; Liqing, C. Association between short-term exposure to air pollution and COVID-19 infection: Evidence from China. Sci. Total Environ. 2020, 727, 138704. [Google Scholar]
  30. Xu, H.; Yan, C.; Fu, Q.; Xiao, K.; Yu, Y.; Han, D.; Wang, W.; Cheng, J. Possible environmental effects on the spread of COVID-19 in China. Sci. Total Environ. 2020, 731, 139211. [Google Scholar] [CrossRef]
  31. Liang, D.; Shi, L.; Zhao, J.; Liu, P.; Schwartz, J.; Gao, S.; Sarnat, J.A.; Liu, Y.; Ebelt, S.T.; Scovronick, N.C.; et al. Urban Air Pollution May Enhance COVID-19 Case-Fatality and Mortality Rates in the United States. medRxiv 2020. preprint. [Google Scholar]
  32. Conticini, E.; Frediani, B.; Caro, D. Can atmospheric pollution be considered a co-factor in extremely high level of SARS-CoV-2 lethality in Northern Italy? Environ. Pollut. 2020, 261, 114465. [Google Scholar] [CrossRef]
  33. Fattorini, D.; Regoli, F. Role of the chronic air pollution levels in the Covid-19 outbreak risk in Italy. Environ. Pollut. 2020, 264, 114732. [Google Scholar] [CrossRef]
  34. Zoran, M.A.; Savastru, R.S.; Savastru, D.M.; Tautan, M.N. Assessing the relationship between surface levels of PM2.5 and PM10 particulate matter impact on COVID-19 in Milan, Italy. Sci. Total Environ. 2020, 738, 139825. [Google Scholar] [CrossRef]
  35. Frontera, A.; Cianfanelli, L.; Vlachos, K.; Landoni, G.; Cremona, G. Severe air pollution links to higher mortality in COVID-19 patients: The “double-hit” hypothesis. J. Infect. 2020. [Google Scholar] [CrossRef]
  36. Al Huraimel, K.; Alhosani, M.; Kunhabdulla, S.; Stietiya, M.H. SARS-CoV-2 in the environment: Modes of transmission, early detection and potential role of pollutions. Sci. Total Environ. 2020, 744, 140946. [Google Scholar] [CrossRef]
  37. Babadaei, M.M.N.; Hasan, A.; Bloukh, S.H.; Edis, Z.; Sharifi, M.; Kachooei, E.; Falahati, M. The expression level of angiotensin-converting enzyme 2 determines the severity of COVID-19: Lung and heart tissue as targets. J. Biomol. Struct. Dyn. 2020, 1–7. [Google Scholar] [CrossRef]
  38. Gemmati, D.; Bramanti, B.; Serino, M.L.; Secchiero, P.; Zauli, G.; Tisato, V. COVID-19 and Individual Genetic Susceptibility/Receptivity: Role of ACE1/ACE2 Genes, Immunity, Inflammation and Coagulation. Might the Double X-Chromosome in Females Be Protective against SARS-CoV-2 Compared to the Single X-Chromosome in Males? Int. J. Mol. Sci. 2020, 21, 3474. [Google Scholar] [CrossRef] [PubMed]
  39. Devaux, C.A.; Rolain, J.-M.; Raoult, D. ACE2 receptor polymorphism: Susceptibility to SARS-CoV-2, hypertension, multi-organ failure, and COVID-19 disease outcome. J. Microbiol. Immunol. Infect. 2020, 53, 425–435. [Google Scholar] [CrossRef] [PubMed]
  40. Bunyavanich, S.; Do, A.; Vicencio, A. Nasal Gene Expression of Angiotensin-Converting Enzyme 2 in Children and Adults. JAMA 2020, 323, 2427–2429. [Google Scholar] [CrossRef] [PubMed]
  41. Leung, J.M.; Yang, C.X.; Tam, A.; Shaipanich, T.; Hackett, T.-L.; Singhera, G.K.; Dorscheid, D.R.; Sin, D. ACE-2 expression in the small airway epithelia of smokers and COPD patients: Implications for COVID-19. Eur. Respir. J. 2020, 55, 2000688. [Google Scholar] [CrossRef] [Green Version]
  42. Leung, J.M.; Yang, C.X.; Sin, D.D. Reply to: “Current smoking is not associated with COVID-19”. Eur. Respir. J. 2020, 55, 2001340. [Google Scholar] [CrossRef]
  43. Sodhi, C.P.; Nguyen, J.; Yamaguchi, Y.; Werts, A.; Lu, P.; Ladd, M.; Fulton, W.B.; Kovler, M.L.; Wang, S.; Prindle, T.; et al. A Dynamic Variation of Pulmonary ACE2 Is Required to Modulate Neutrophilic Inflammation in Response to Pseudomonas aeruginosa Lung Infection in Mice. J. Immunol. 2019, 203, 3000–3012. [Google Scholar] [CrossRef]
  44. Xue, T.; Wei, N.; Xin, Z.; Qingyu, X. Angiotensin-converting enzyme-2 overexpression attenuates inflammation in rat model of chronic obstructive pulmonary disease. Inhal. Toxicol. 2014, 26, 14–22. [Google Scholar] [CrossRef]
  45. Zisman, L.S.; Keller, R.S.; Weaver, B.; Lin, Q.; Speth, R.; Bristow, M.R.; Canver, C.C. Increased angiotensin-(1-7)-forming activity in failing human heart ventricles: Evidence for upregulation of the angiotensin-converting enzyme Homologue ACE2. Circulation 2003, 108, 1707–1712. [Google Scholar] [CrossRef] [Green Version]
  46. Lin, C.I.; Tsai, C.H.; Sun, Y.L.; Hsieh, W.Y.; Lin, Y.C.; Chen, C.Y.; Lin, C.S. Instillation of particulate matter 2.5 induced acute lung injury and attenuated the injury recovery in ACE2 knockout mice. Int. J. Biol. Sci. 2018, 14, 253–265. [Google Scholar] [CrossRef] [Green Version]
  47. Kuba, K.; Imai, Y.; Rao, S.; Gao, H.; Guo, F.; Guan, B.; Huan, Y.; Yang, P.; Zhang, Y.; Deng, W.; et al. A crucial role of angiotensin converting enzyme 2 (ACE2) in SARS coronavirus—Induced lung injury. Nat. Med. 2005, 11, 875–879. [Google Scholar] [CrossRef] [PubMed]
  48. Nebert, D.W. Aryl hydrocarbon receptor (AHR): “pioneer member” of the basic-helix/loop/helix per-Arnt-sim (bHLH/PAS) family of “sensors” of foreign and endogenous signals. Prog. Lipid Res. 2017, 67, 38–57. [Google Scholar] [CrossRef] [PubMed]
  49. Rothhammer, V.; Quintana, F.J. The aryl hydrocarbon receptor: An environmental sensor integrating immune responses in health and disease. Nat. Rev. Immunol. 2019, 19, 184–197. [Google Scholar] [CrossRef] [PubMed]
  50. Vogel, C.F.A.; Kado, S.Y.; Kobayashi, R.; Liu, X.; Wong, P.; Na, K.; Durbin, T.; Okamoto, R.A.; Kado, N.Y. Inflammatory marker and aryl hydrocarbon receptor-dependent responses in human macrophages exposed to emissions from biodiesel fuels. Chemosphere 2018, 220, 993–1002. [Google Scholar] [CrossRef] [PubMed] [Green Version]
  51. Carlson, E.A.; McCulloch, C.; Koganti, A.; Goodwin, S.B.; Sutter, T.R.; Silkworth, J.B. Divergent Transcriptomic Responses to Aryl Hydrocarbon Receptor Agonists between Rat and Human Primary Hepatocytes. Toxicol. Sci. 2009, 112, 257–272. [Google Scholar] [CrossRef] [PubMed] [Green Version]
  52. Vogel, C.F.; Van Winkle, L.S.; Esser, C.; Haarmann-Stemmann, T. The aryl hydrocarbon receptor as a target of environmental stressors—Implications for pollution mediated stress and inflammatory responses. Redox Biol. 2020, 34, 101530. [Google Scholar] [CrossRef]
  53. Bock, K.W. Aryl hydrocarbon receptor (AHR): From selected human target genes and crosstalk with transcription factors to multiple AHR functions. Biochem. Pharmacol. 2019, 168, 65–70. [Google Scholar] [CrossRef]
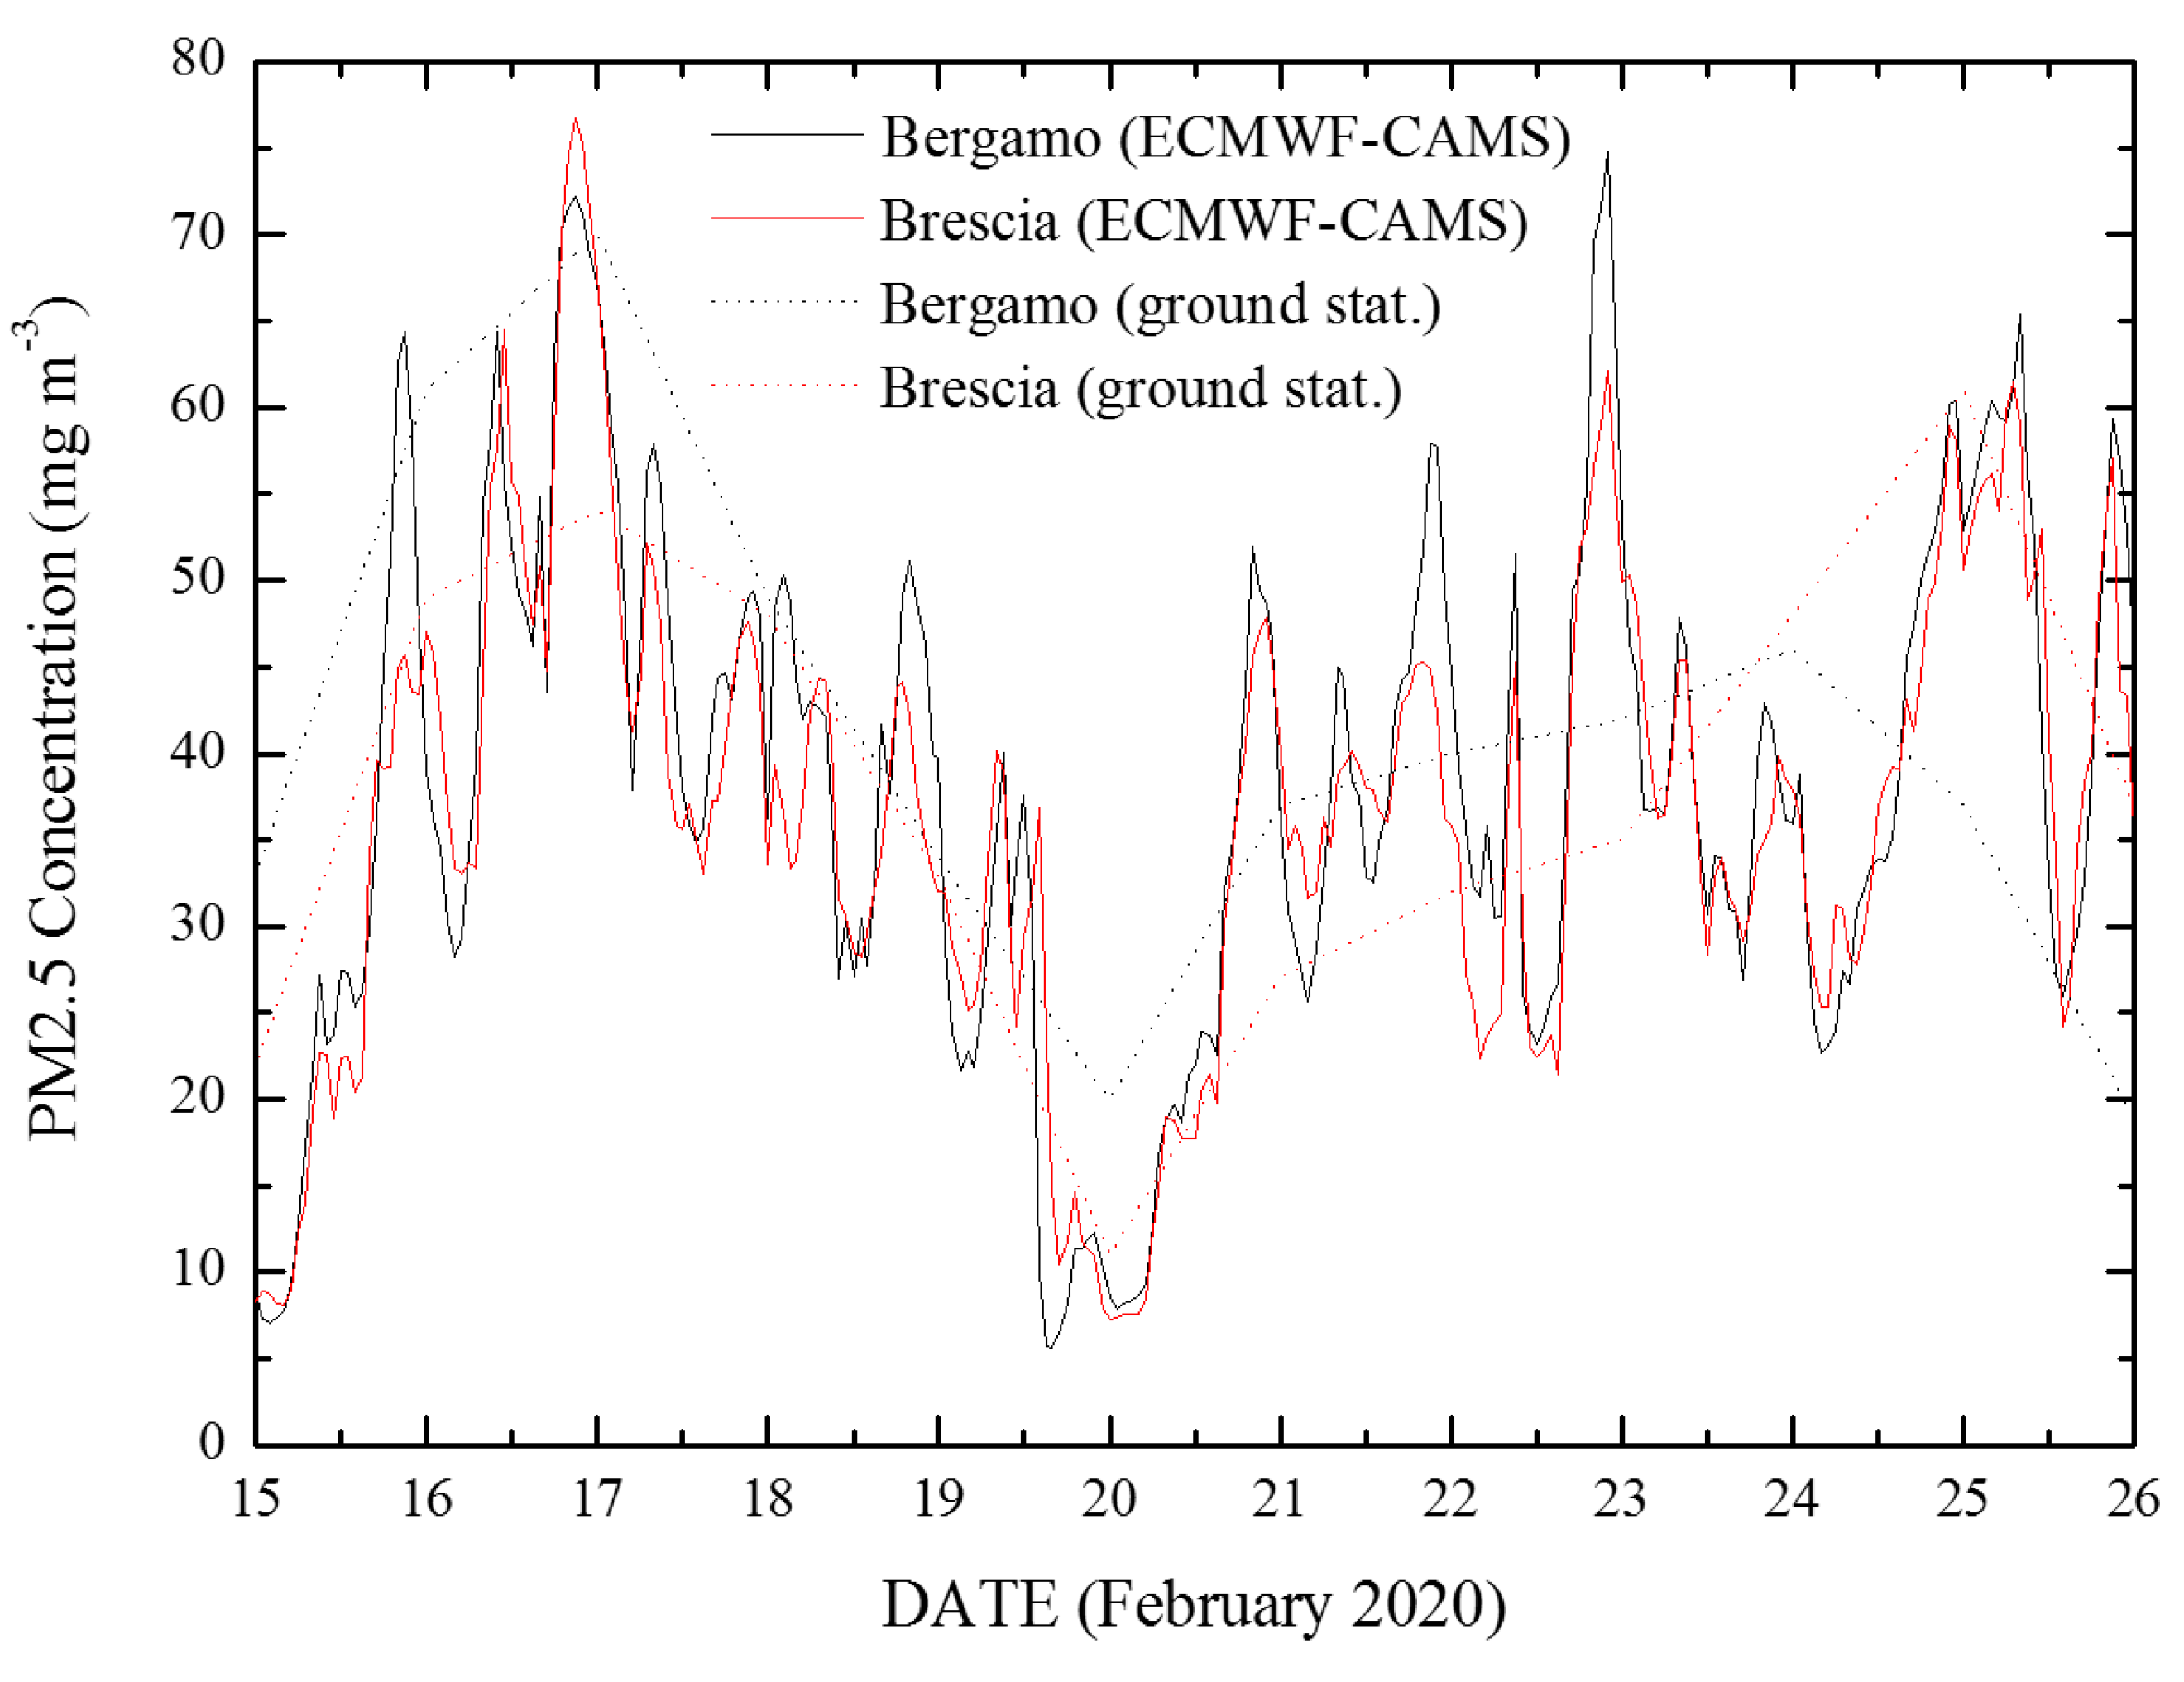
Figure 1. Particulate matter (PM2.5) concentration levels over the period 15–26 February 2020 as measured by the two ground stations in Bergamo (via Meucci, 45°41′24′′ N, 09°38′28′′ E) and Brescia (Villaggio Sereno, 45°31′04′′ N, 10°10′41′′ E), together with the data from near-real-time European Centre for Medium-Range Weather Forecasts (ECMWF)–Copernicus Atmosphere Monitoring Service (CAMS) analysis.
Ijerph 17 05573 g001
Figure 2. PM2.5 (A) and PM10 (B) concentration levels at 00:00 Coordinated Universal Time (UTC) on 16 February 2020 from near-real-time ECMWF–CAMS analysis over an area extending over the latitudinal interval 36–48° N and the longitudinal interval 5–20° E.
Ijerph 17 05573 g002
Figure 3. PM2.5 concentrations averaged over the period 15–26 February 2020 for the 110 Italian Provinces (A); incidence of COVID-19 (B), mortality rate (C) and case fatality risk (D) over the period 20 February–31 March 2020.
Ijerph 17 05573 g003
Figure 4. Linear regression analysis correlating the average PM2.5 concentration values in the period 15–26 February 2020 with the incidence of the pathology (A), the mortality rate (B) and the case fatality rate (C) in the period 20 February–31 March 2020.
Ijerph 17 05573 g004
Figure 5. DNA sequence of the promoter region of the ACE-2 gene. Numbers indicate the position of the nucleotide upstream of the starting site for protein production. Core XRE (GCGTG) and NC-XRE (GGGA) motifs are shown in bold. Additional regulative consensus motifs are showed as follows: TATA box (underlined); GATA motifs (black boxed); STAT/FOXA/FOXO/Ets/GR/p53 motif (light grey); GATA/HNF1 motif (dark grey); C/EBP motif (grey boxed).
Ijerph 17 05573 g005