Drivers’ Visual Attention Characteristics under Different Cognitive Workloads: An On-Road Driving Behavior Study


Abstract
1. Introduction
2. Experimental Design
2.1. Participants
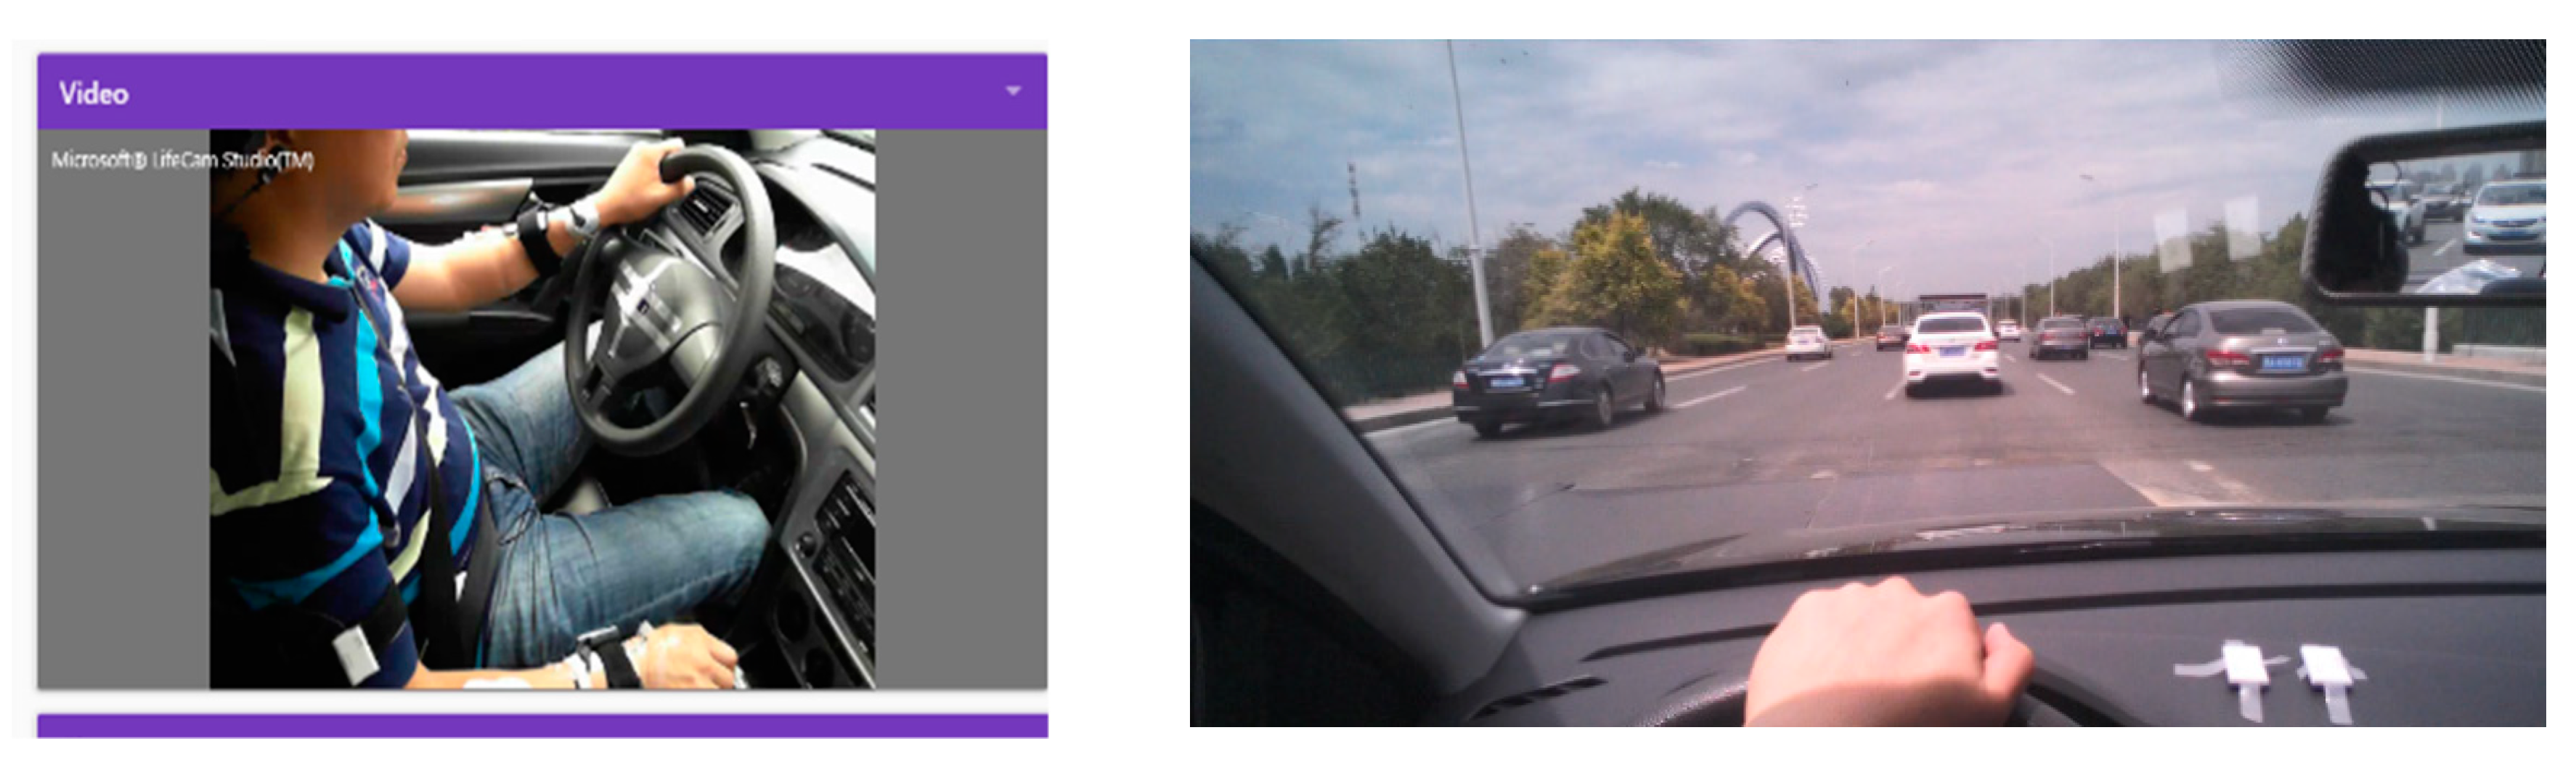
2.2. Apparatus
2.3. Driving Tasks
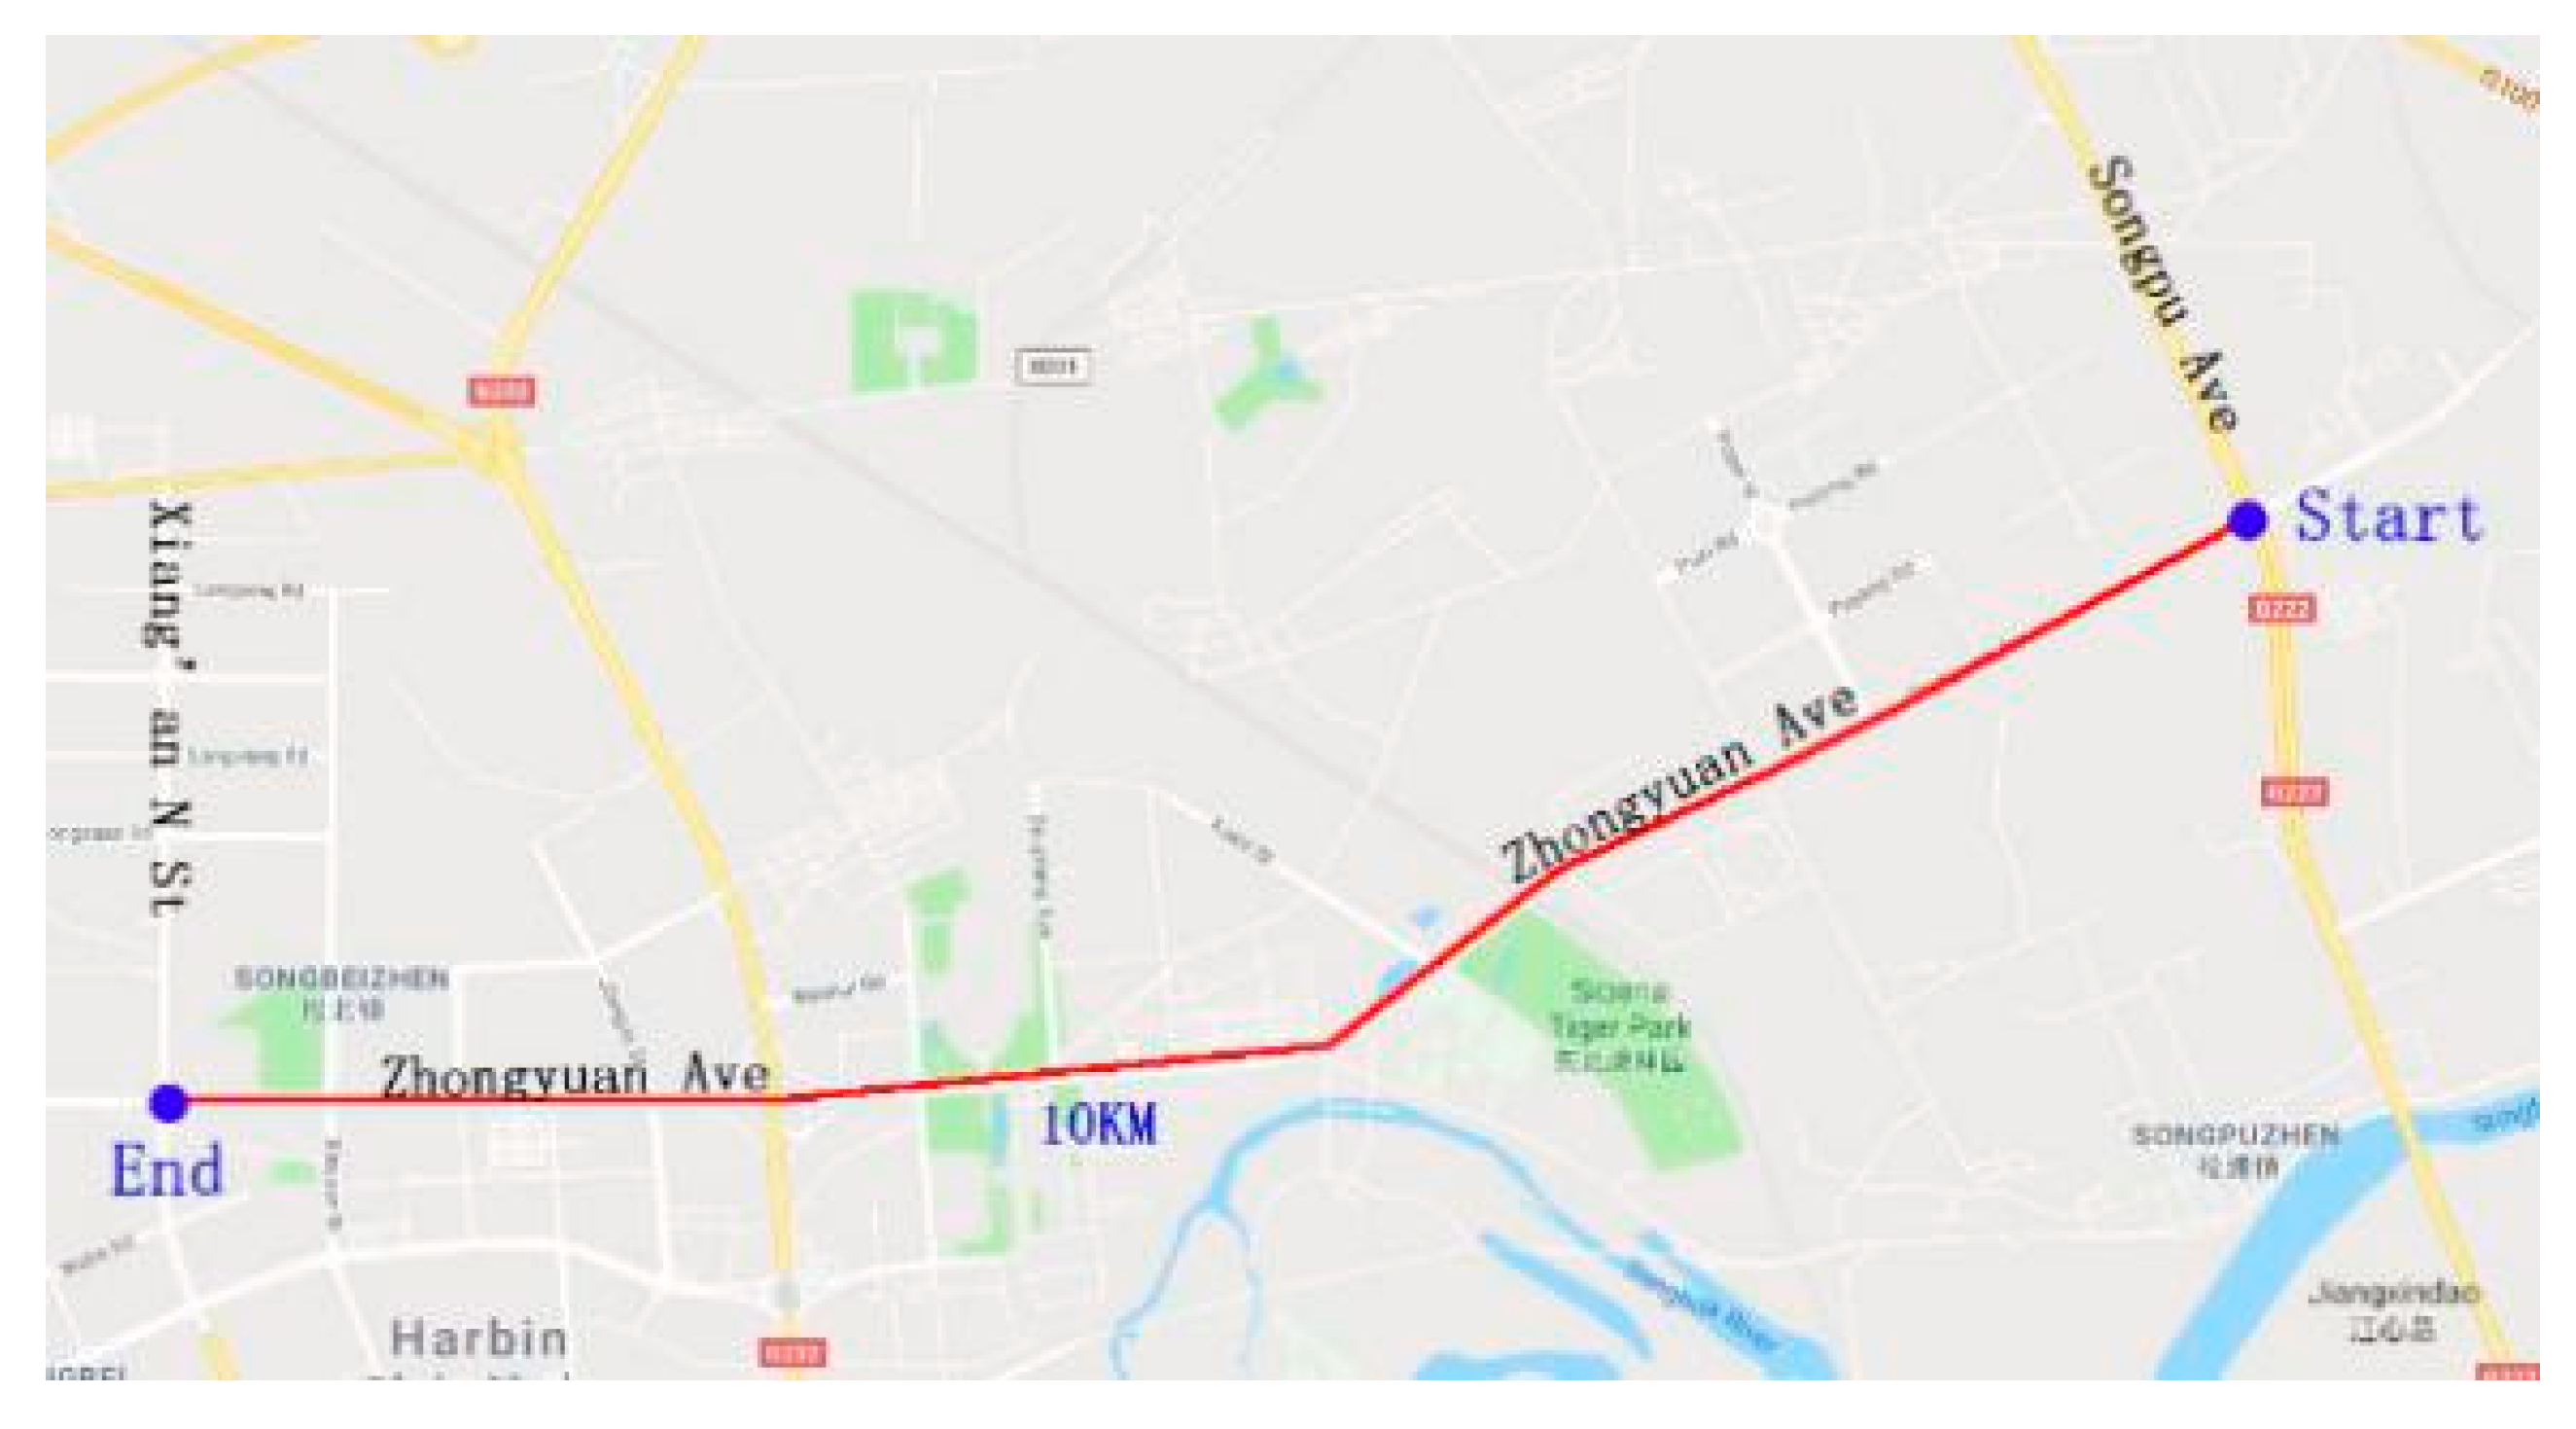
2.4. Experimental Routes
2.5. Experimental Process
- (1)
- The experimental staff prepared the test notification. The test subject was informed of the whole process and the subject filled in the personal information form. Then, the staff placed the equipment on the test subject.
- (2)
- The staff guided the drivers into the test vehicle, switched on all the test equipment, and completed the calibration and synchronization of the equipment. Once the drivers were ready, they drove around the safety area for approximately 15 min to become accustomed to the setting.
- (3)
- The participants entered the designated test section to start driving and the staff recorded data from the start time of the test. The participants performed the prescribed operations under the guidance of the staff unless safety hazards arose. Data continued to be collected during the test to capture the driving environment and drivers’ behavior under different environments.
- (4)
- On a specific road section, the drivers performed the cognitive workload task while maintaining the main driving task. They completed the corresponding mathematical calculation according to the experimental design setting. In case hazardous situations occurred, the drivers had the option to terminate the task.
- (5)
- After the test, the staff turned off the test equipment and assisted the test subject to take off the test equipment. The participants completed the questionnaire and received the test compensation (200 RMB). The staff compiled, copied, and archived the test data.
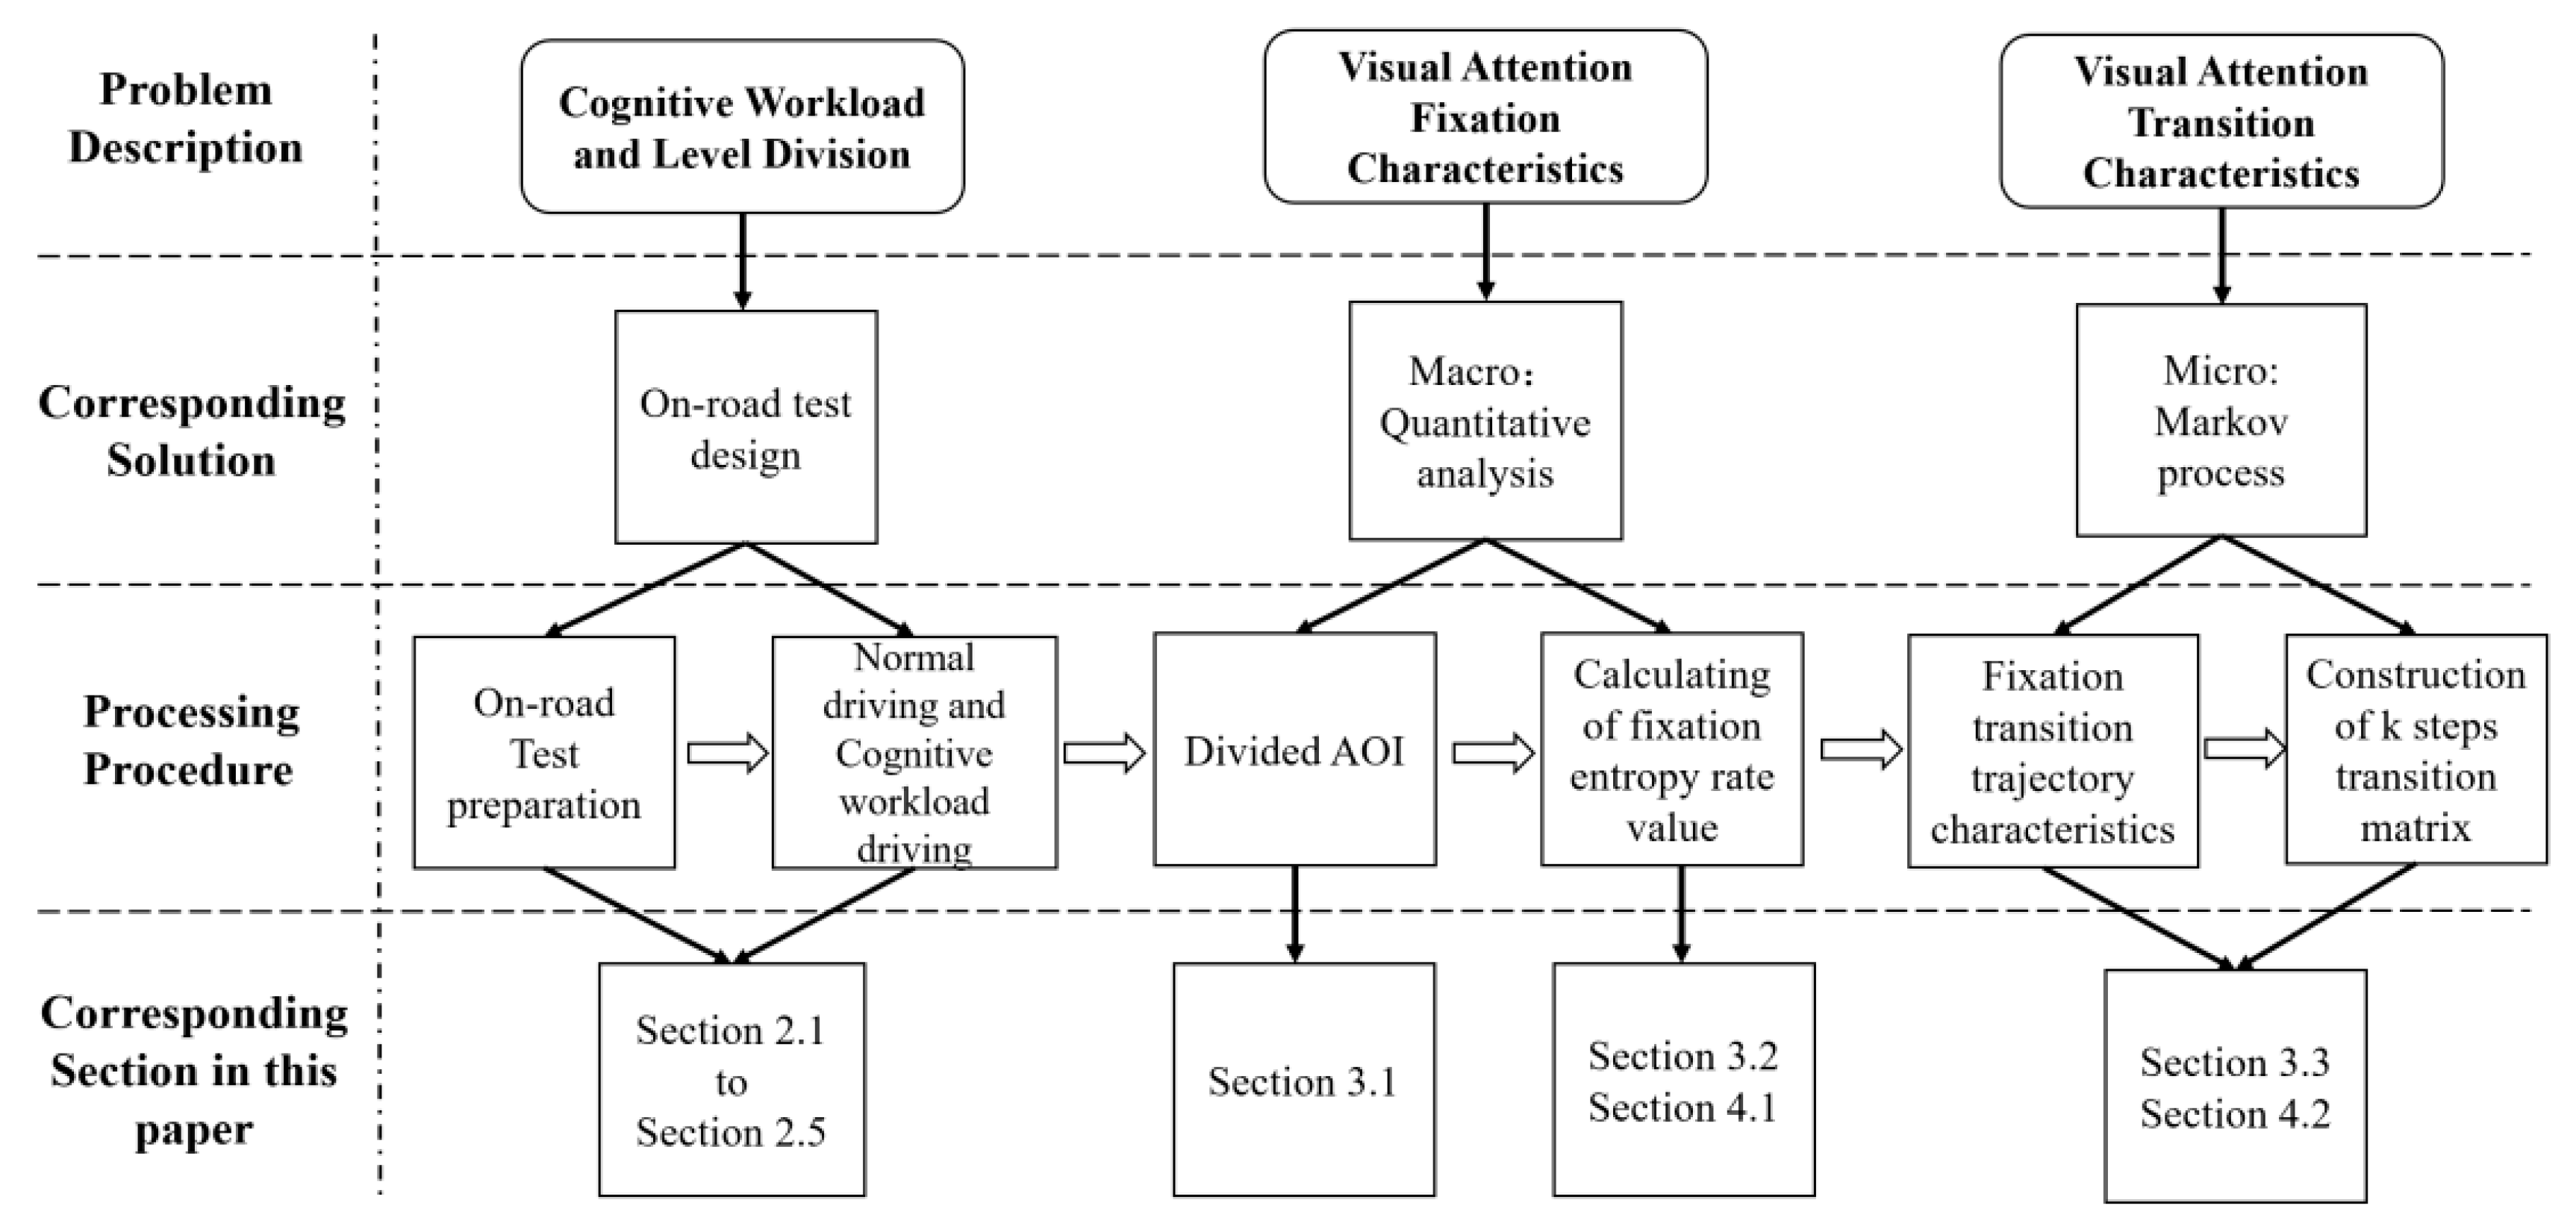
3. Methodology
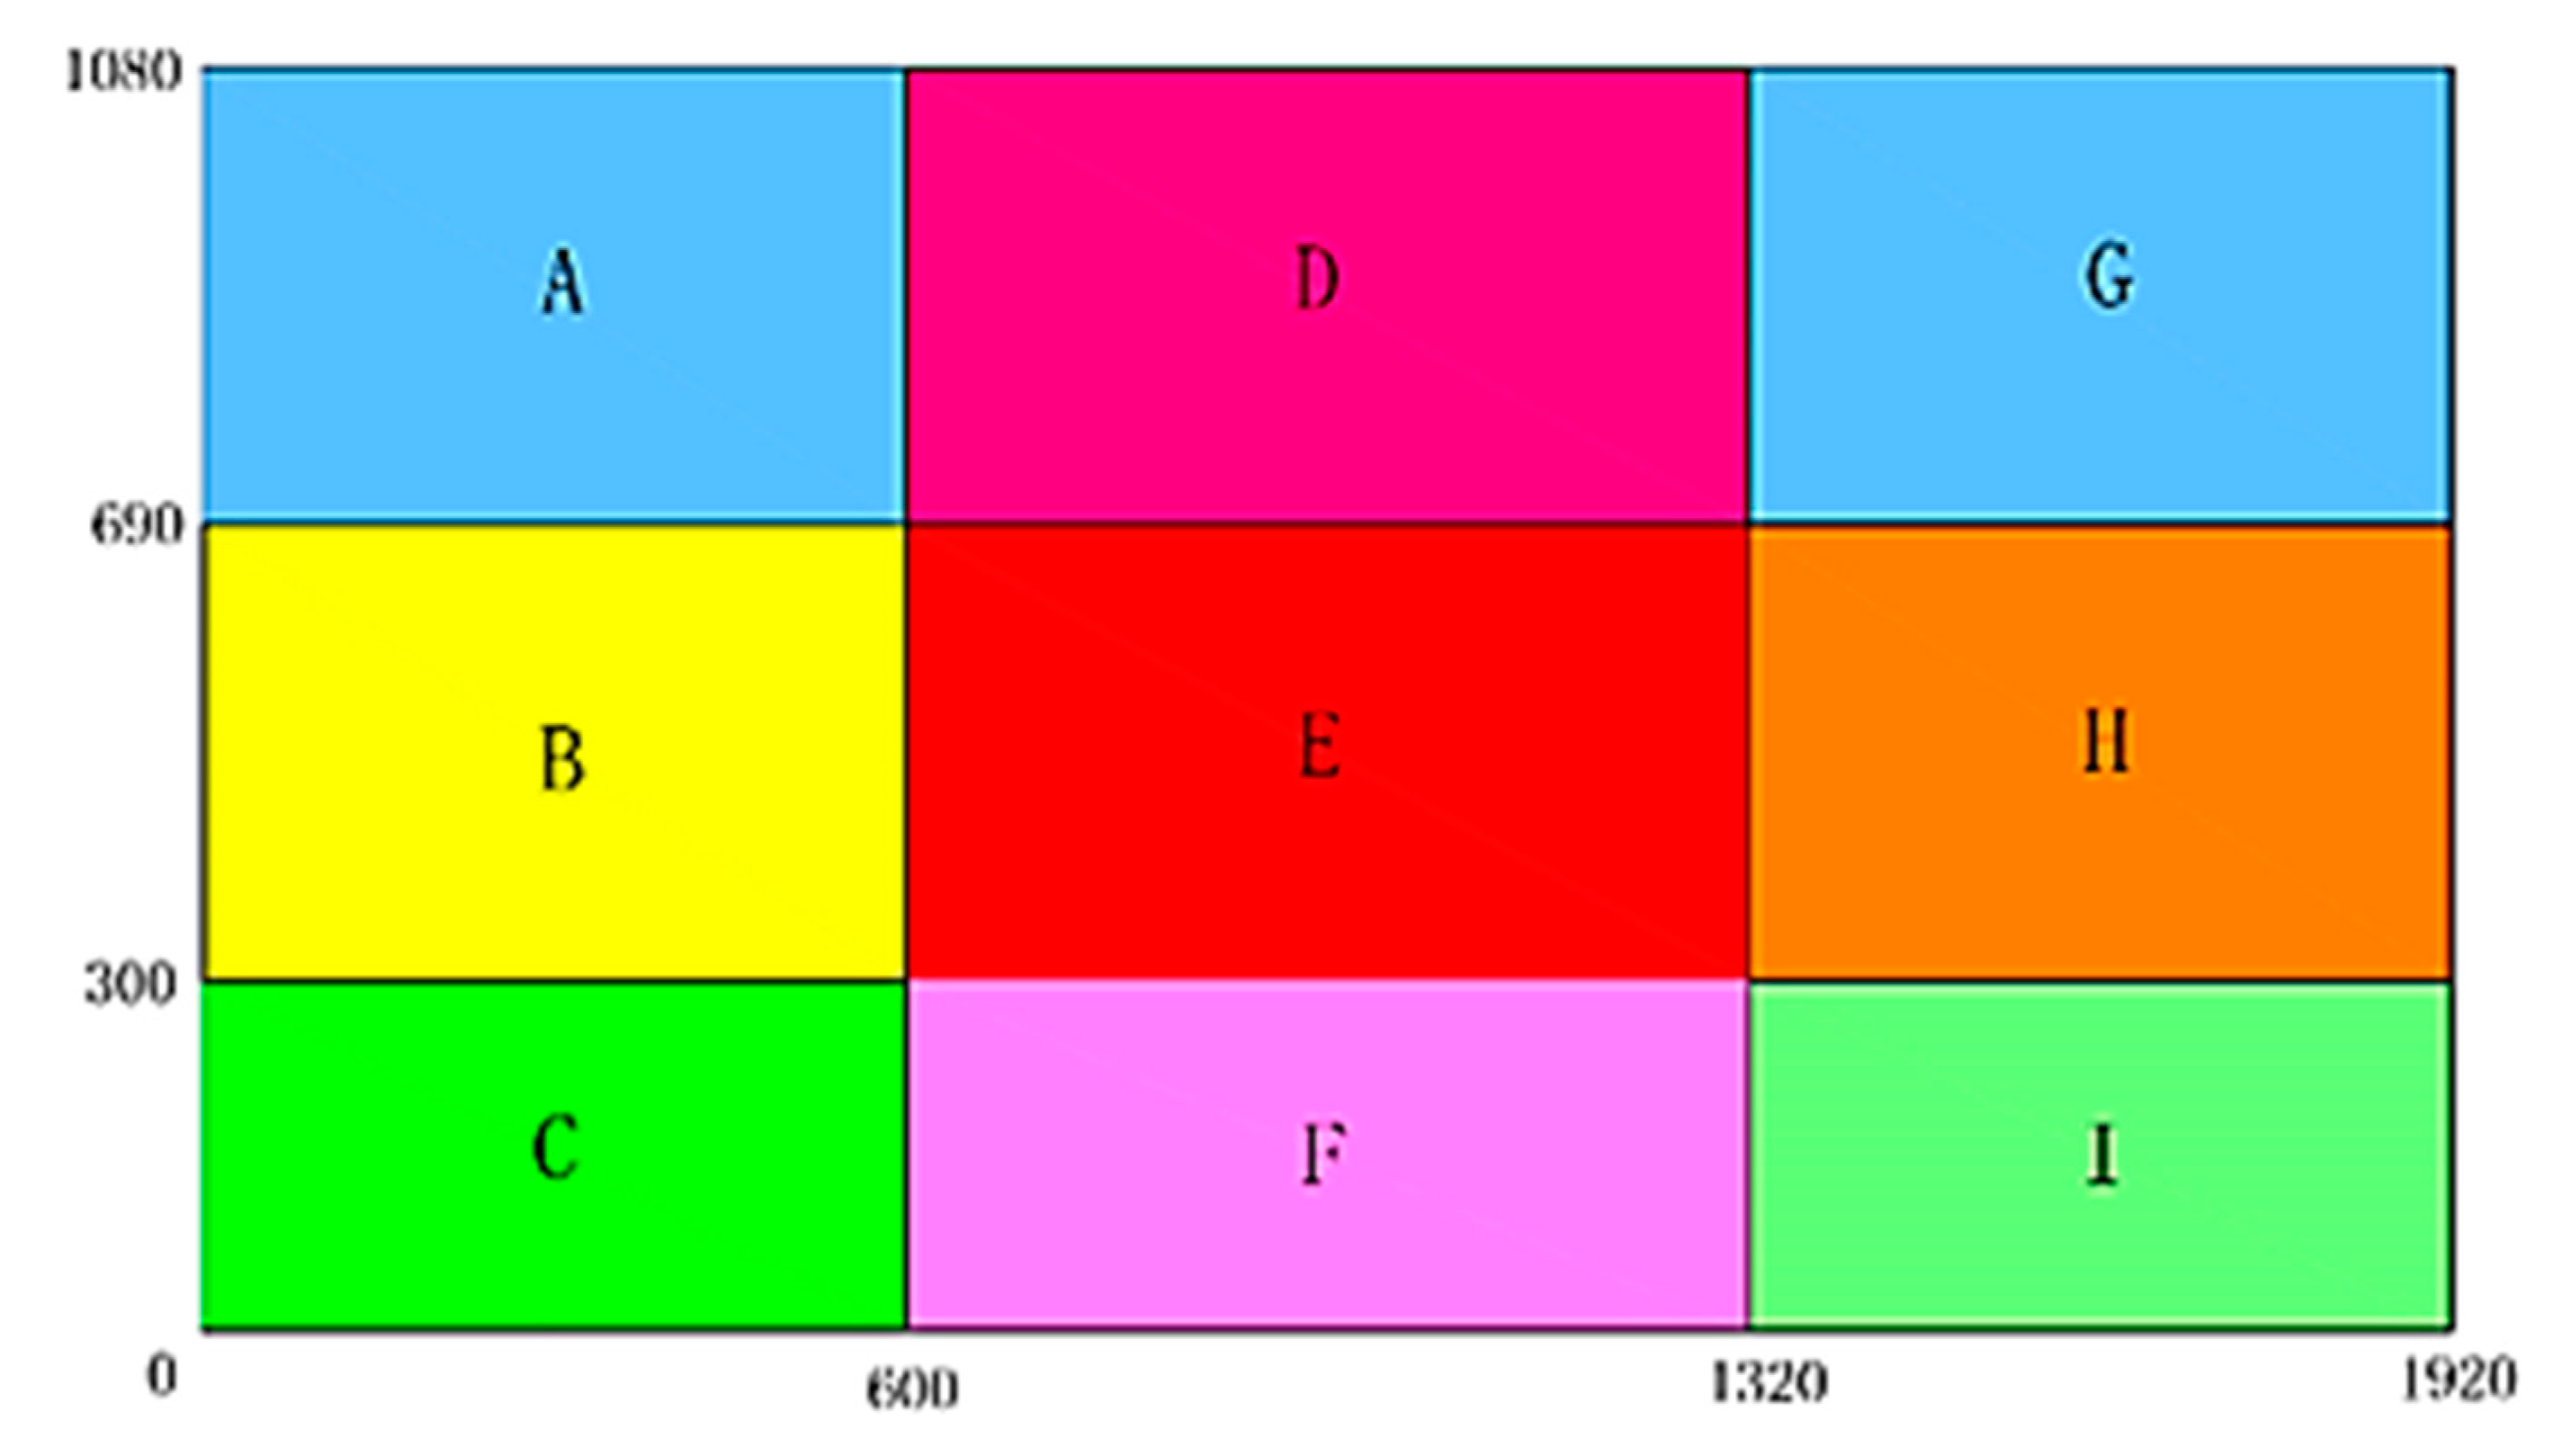
3.1. Area of Interest (AOI) Division of Fixation
3.2. Research Method of Driver Visual Attention Fixation Characteristics
3.3. Research Method of Driver Visual Attention Transition Characteristics
4. Results and Discussion
4.1. Analysis of Drivers’ Visual Attention Fixation Characteristics
4.2. Analysis of Drivers’ Visual Attention Transition Characteristics under Different States
4.2.1. Visual Transition Trajectory Characteristics
4.2.2. Visual Attention Transition Characteristics in Various Areas
4.2.3. Visual Attention Characteristics in Steady State
5. Limitations and Future Work
- (1)
- At present, we only studied the overall accuracy of mathematical calculations under different cognitive workload conditions, but did not consider the relationship between mathematical calculation accuracy and driver’s visual attention. Future research will take calculation accuracy as an indicator to analyze the influence of different cognitive workloads on such accuracy.
- (2)
- At present, there is no analysis of the visual entropy of different cognitive levels, but only the whole process of driving. The next step will be to explore its changes under different levels of cognition.
- (3)
- Other comprehensive eye movement indicators, such as pupil diameter change and blink frequency, can be considered to analyze the visual attention of drivers under the cognitive workload condition. Dynamic AOI division will also be adopted for research.
- (4)
- More participants will be recruited to explore the visual attention characteristics of drivers under cognitive workload and we will add some driving simulation experiments for supplementary comparative analysis.
- (5)
- At present, we have generated three different degrees of cognitive workload for participants through the calculation of mathematical problems. In future work, we will quantify the indicators and give specific definitions for the three different levels.
6. Conclusions
- (1)
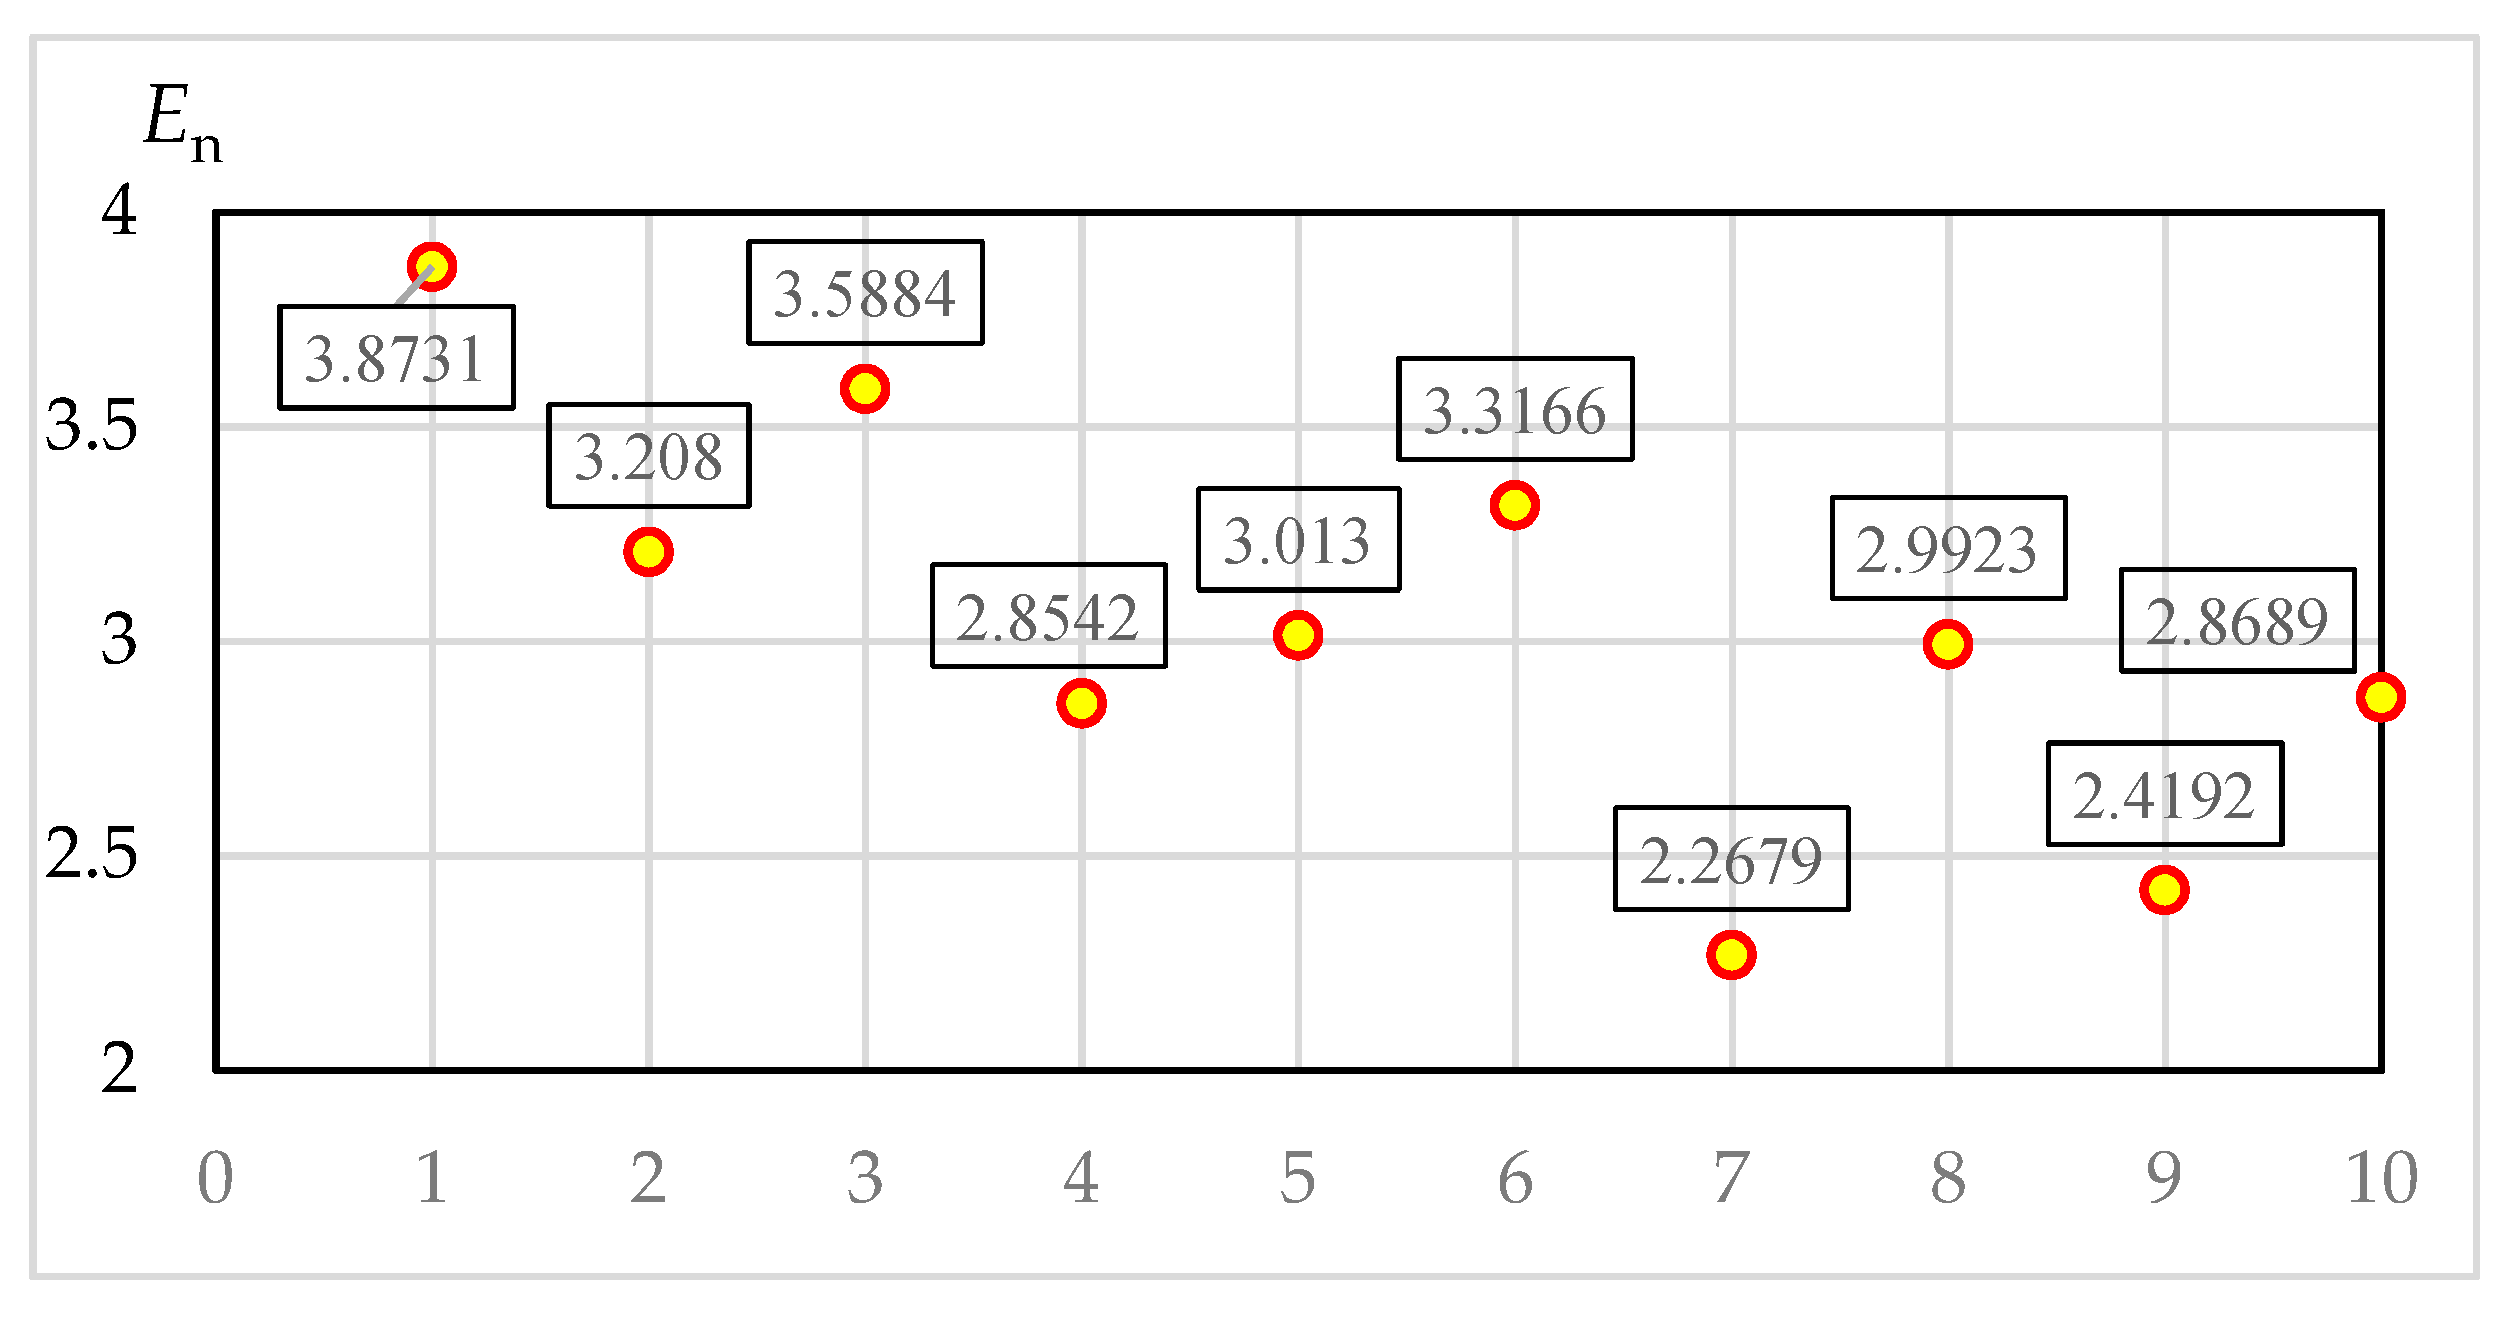
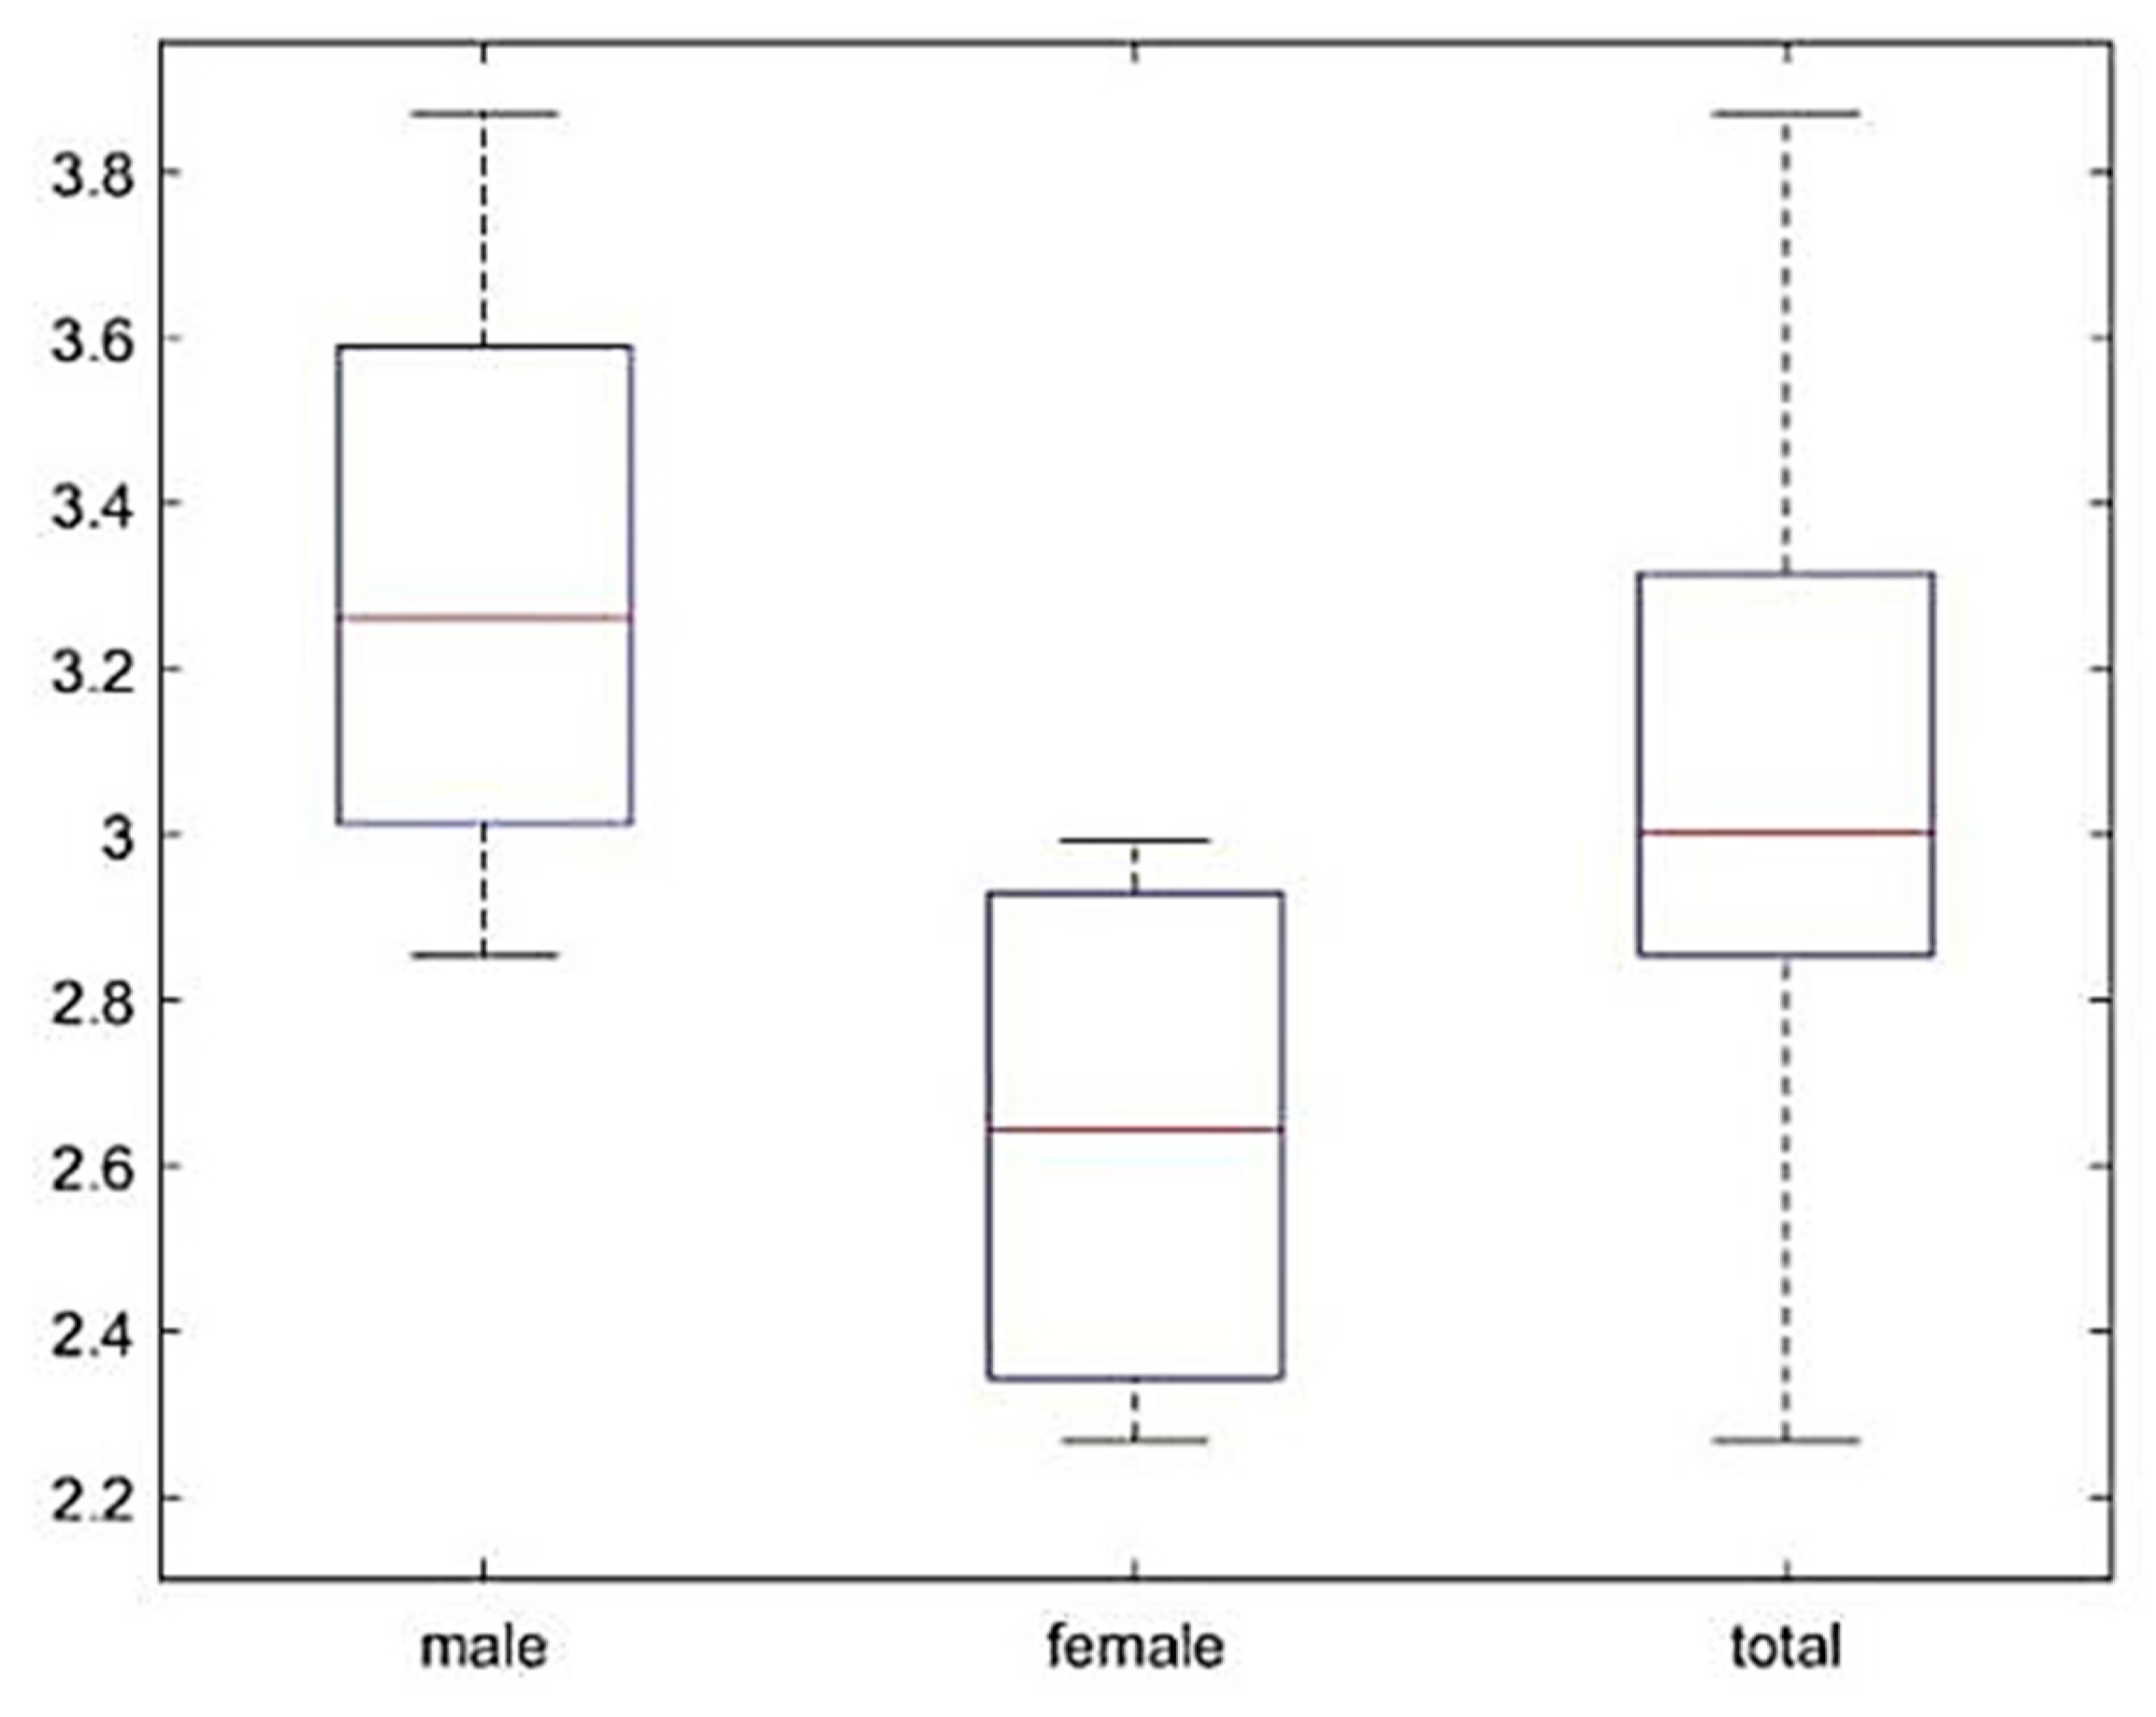
- Drivers’ fixation entropy rate values for each area are calculated from the experimental data and their visual attention is measured by a quantitative method. The comparison between male and female drivers shows that the mean fixation entropy rate of males is 23.08% higher than that of female drivers.
- (2)
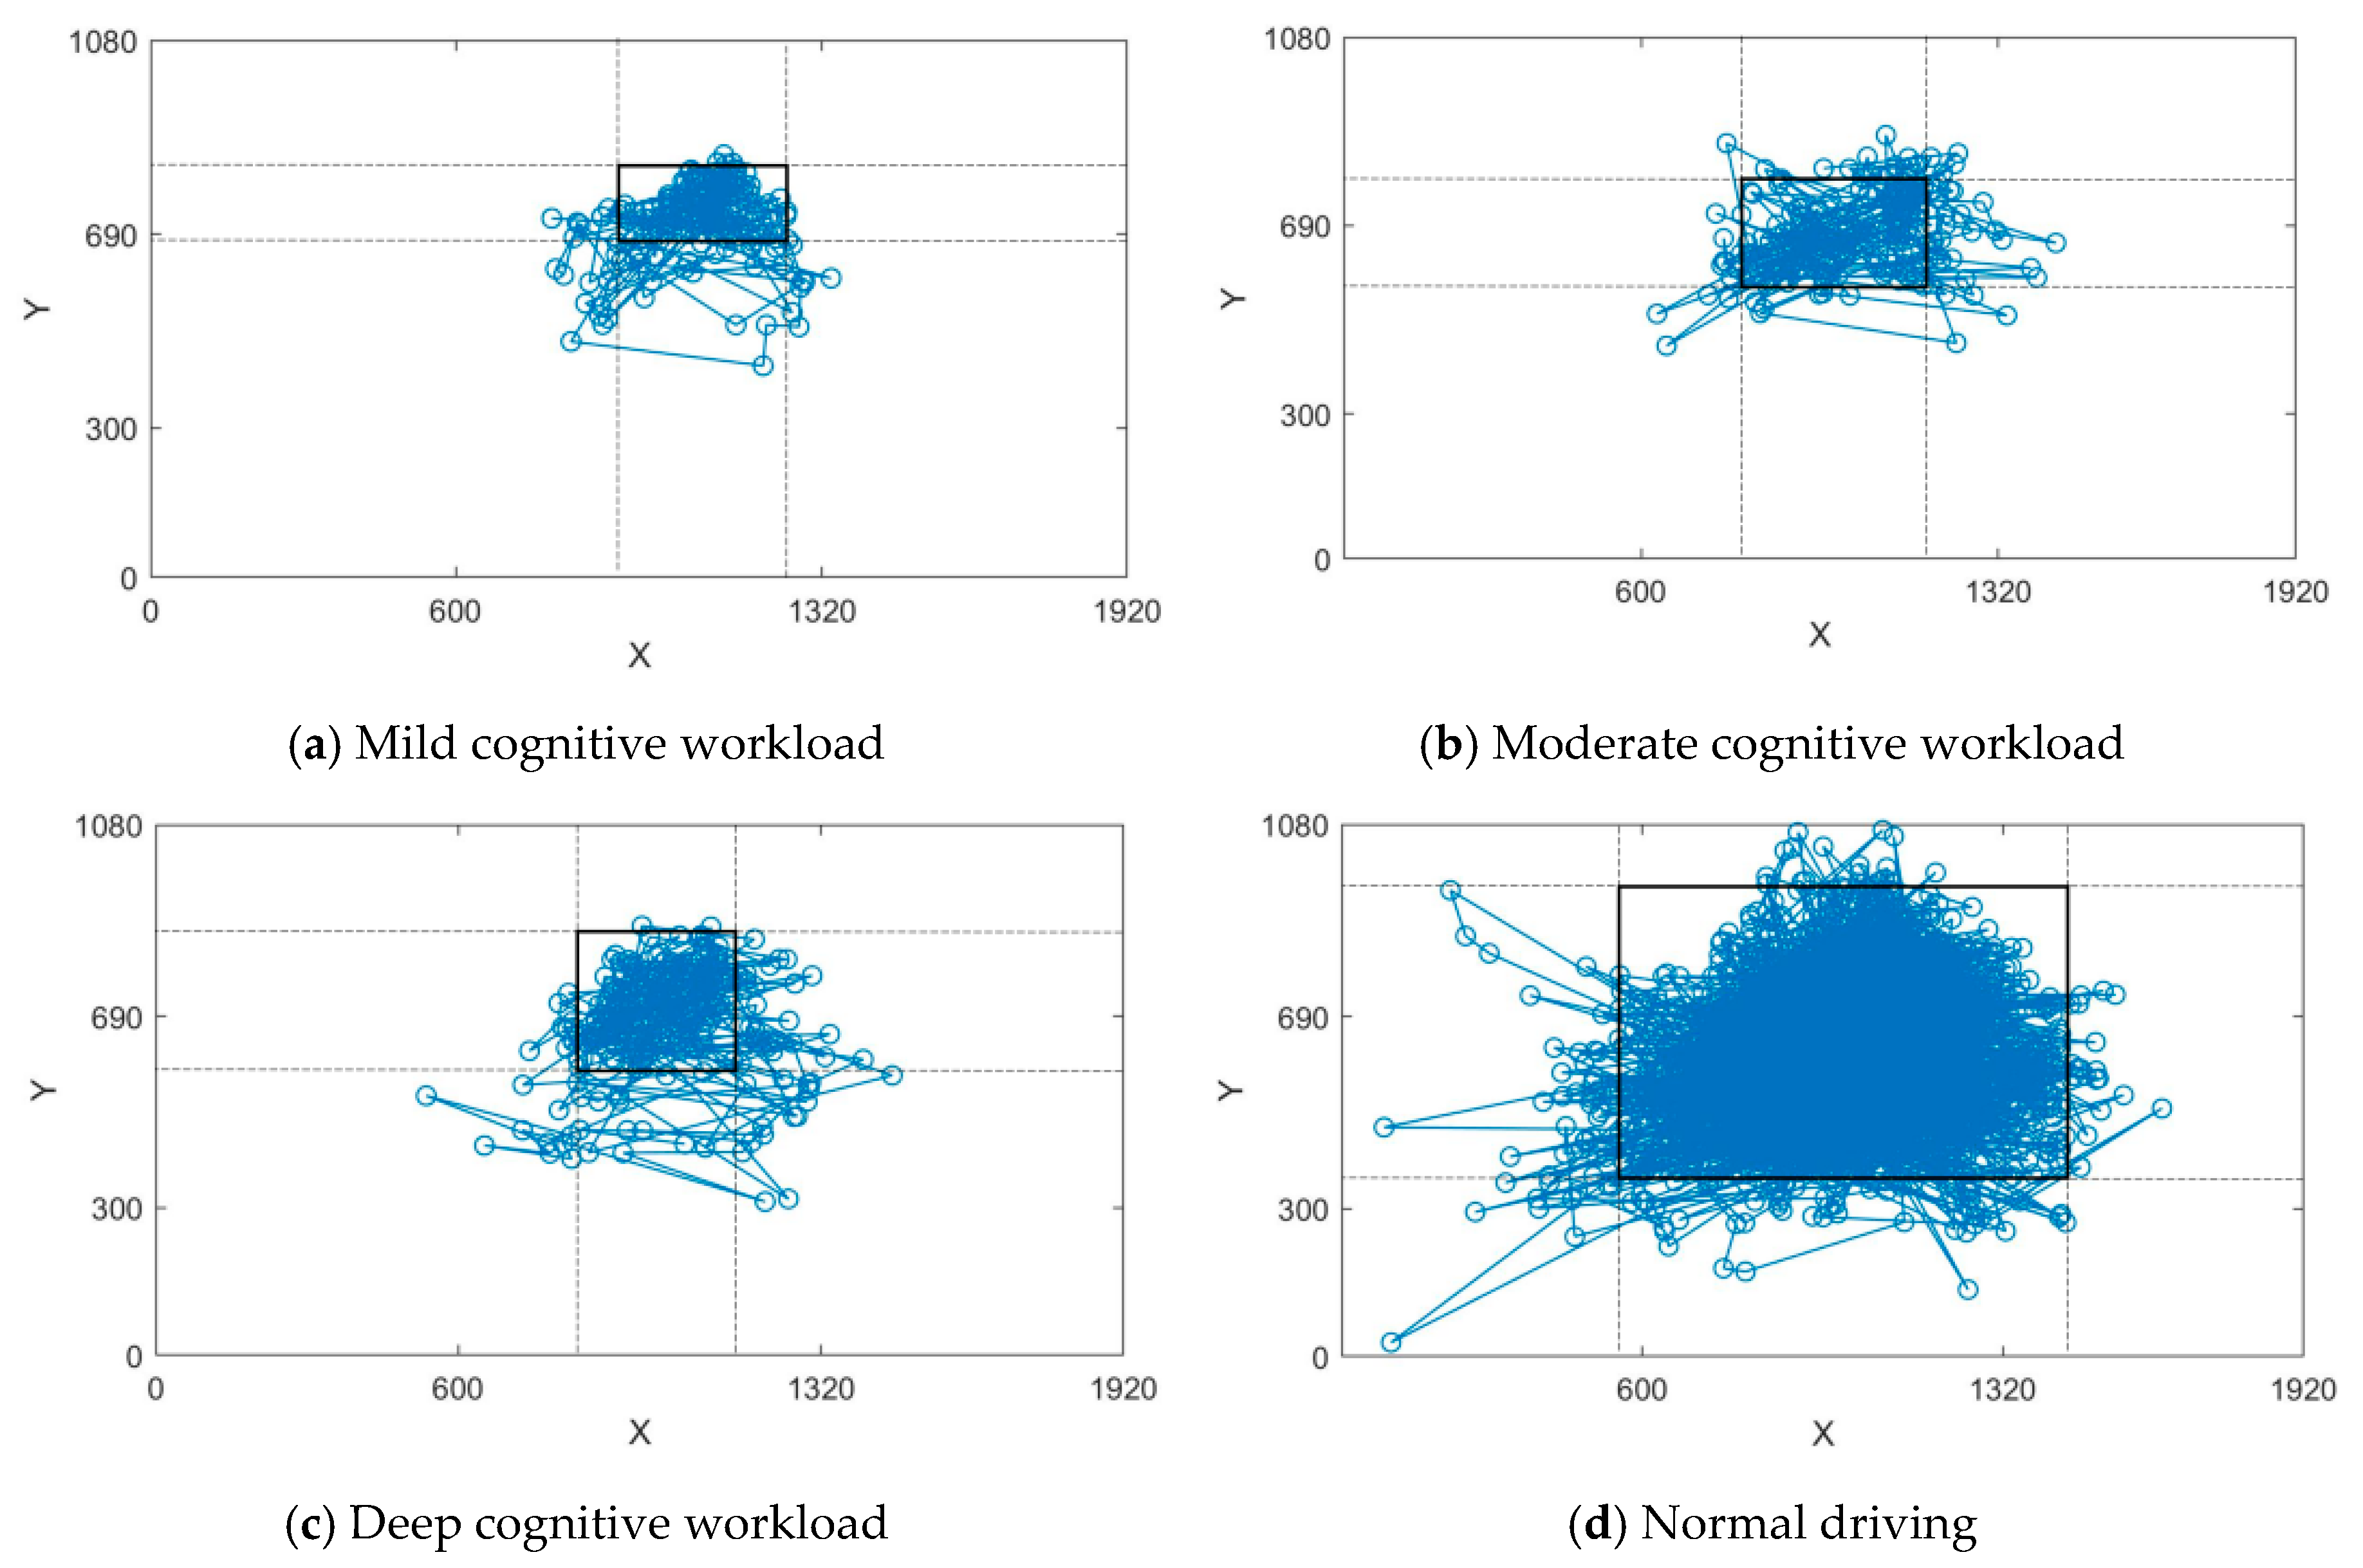
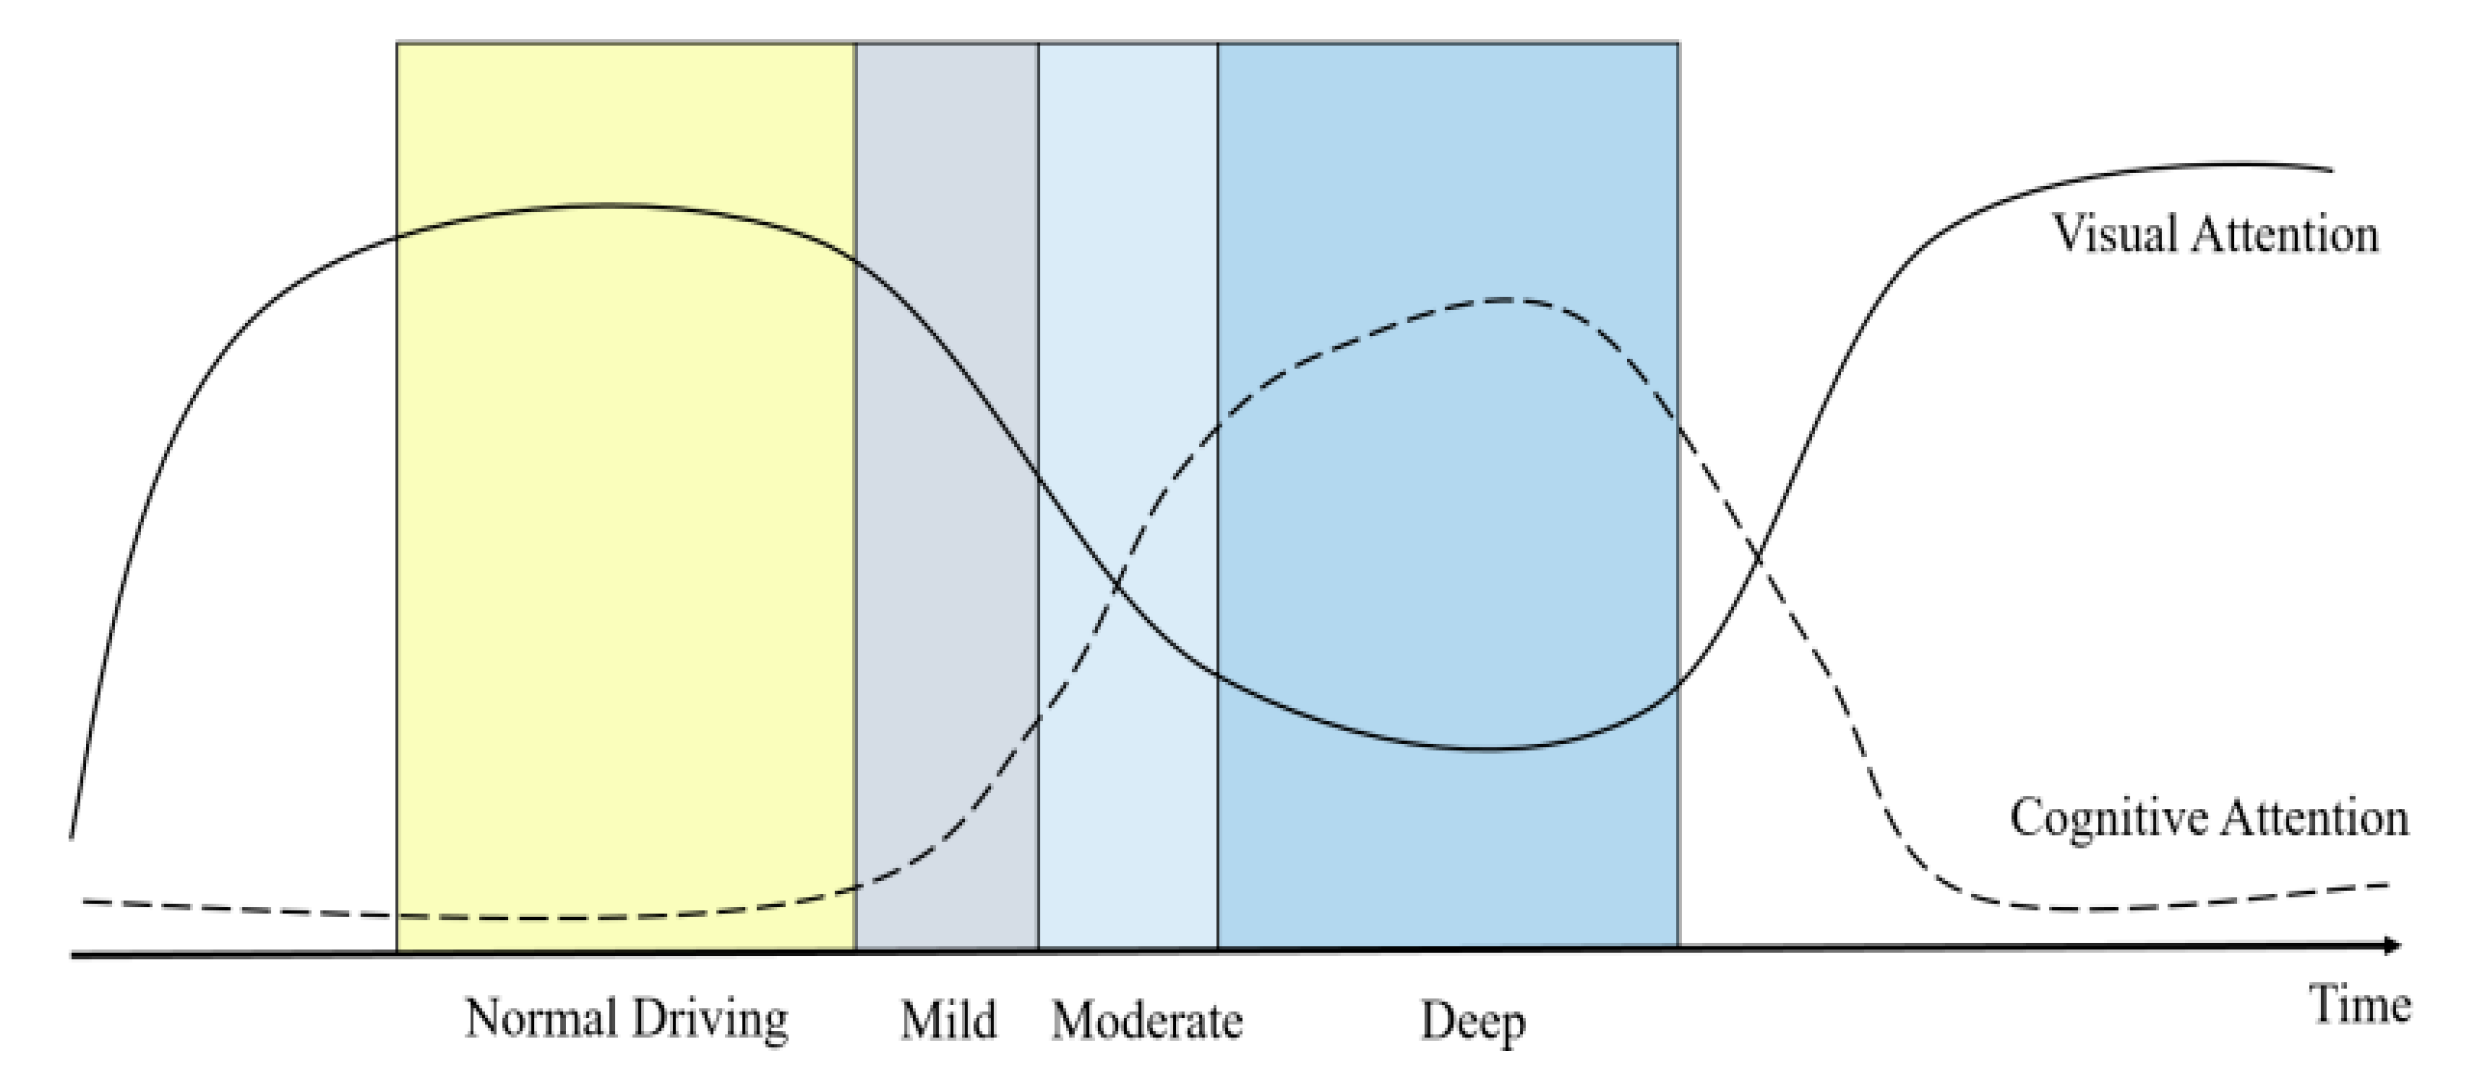
- Under normal circumstances of driving, drivers can cover almost the front fixation area. In the case of mild workload, drivers’ eyes are mainly focused on the distant area directly in front. As cognitive workload increases, the area where the eyes are shifted moves toward the junction between the near and far areas directly in front. The relationship between cognitive and visual occupying attention resources is also analyzed. When driving normally, visual resources are sufficient. When cognitive workload occurs, visual and cognitive resources have a competitive relationship. As the degree of cognitive workload increases, cognitive attention occupies resources more than the visual.
- (3)
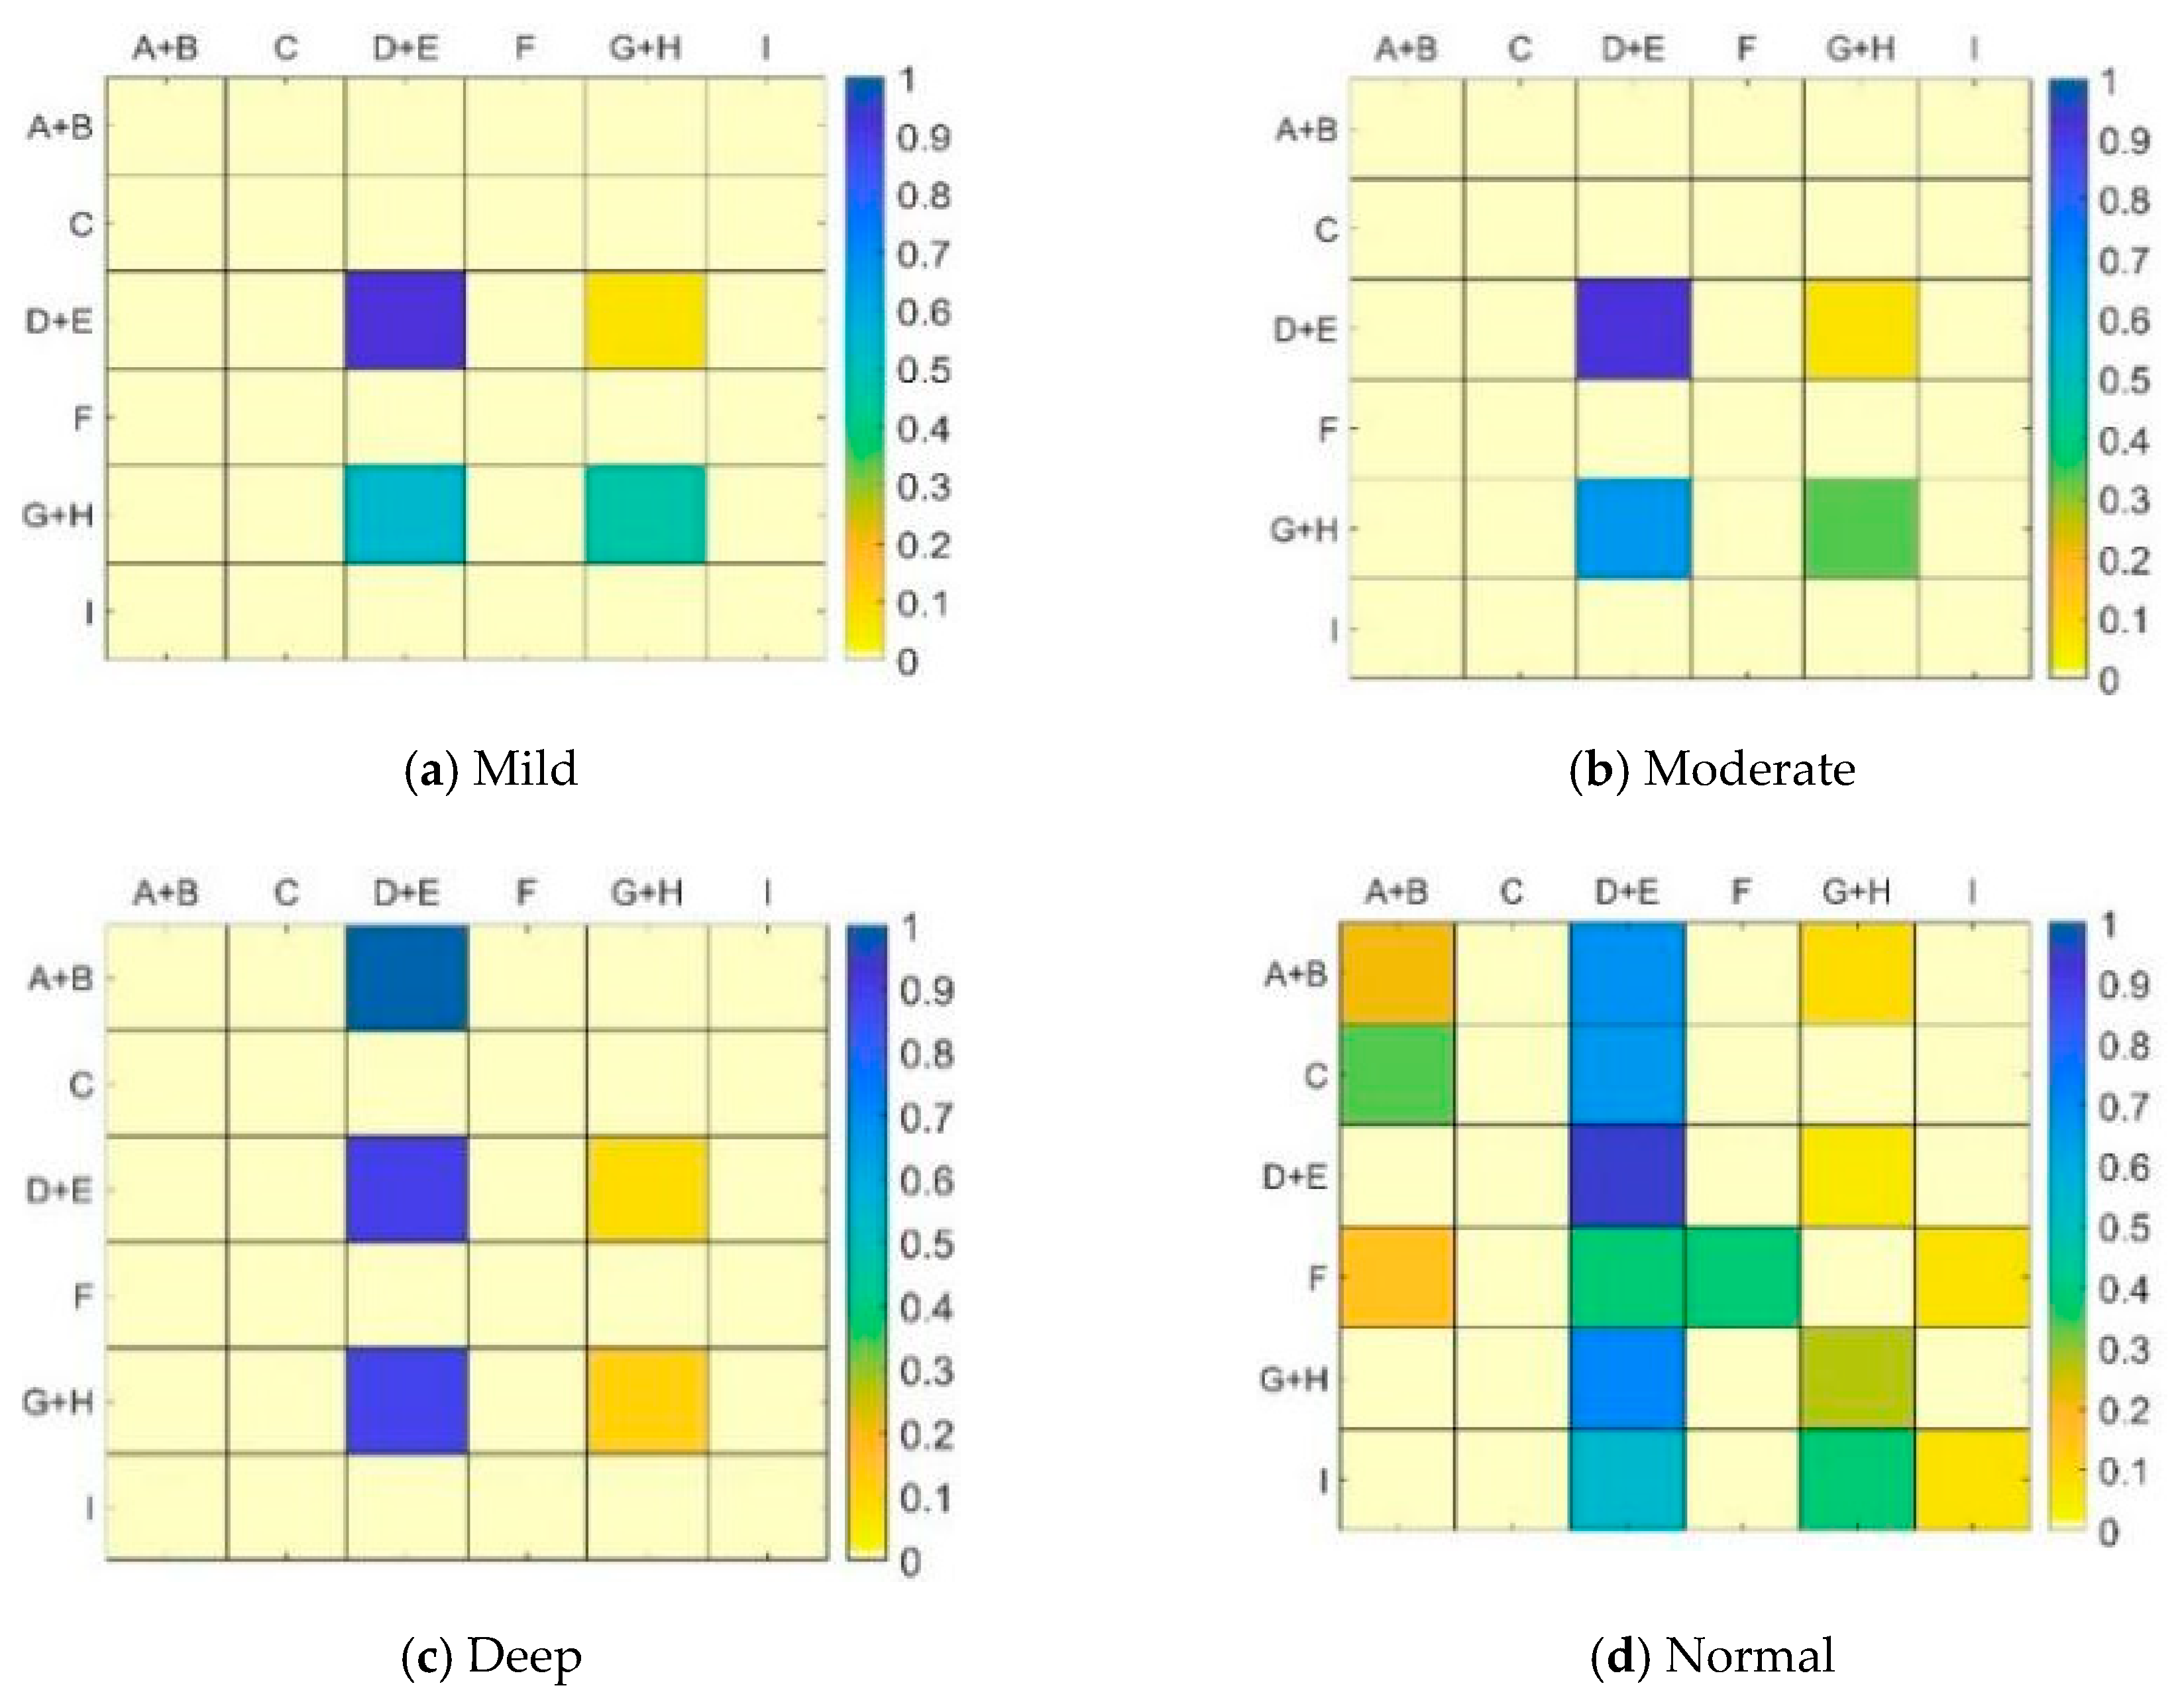
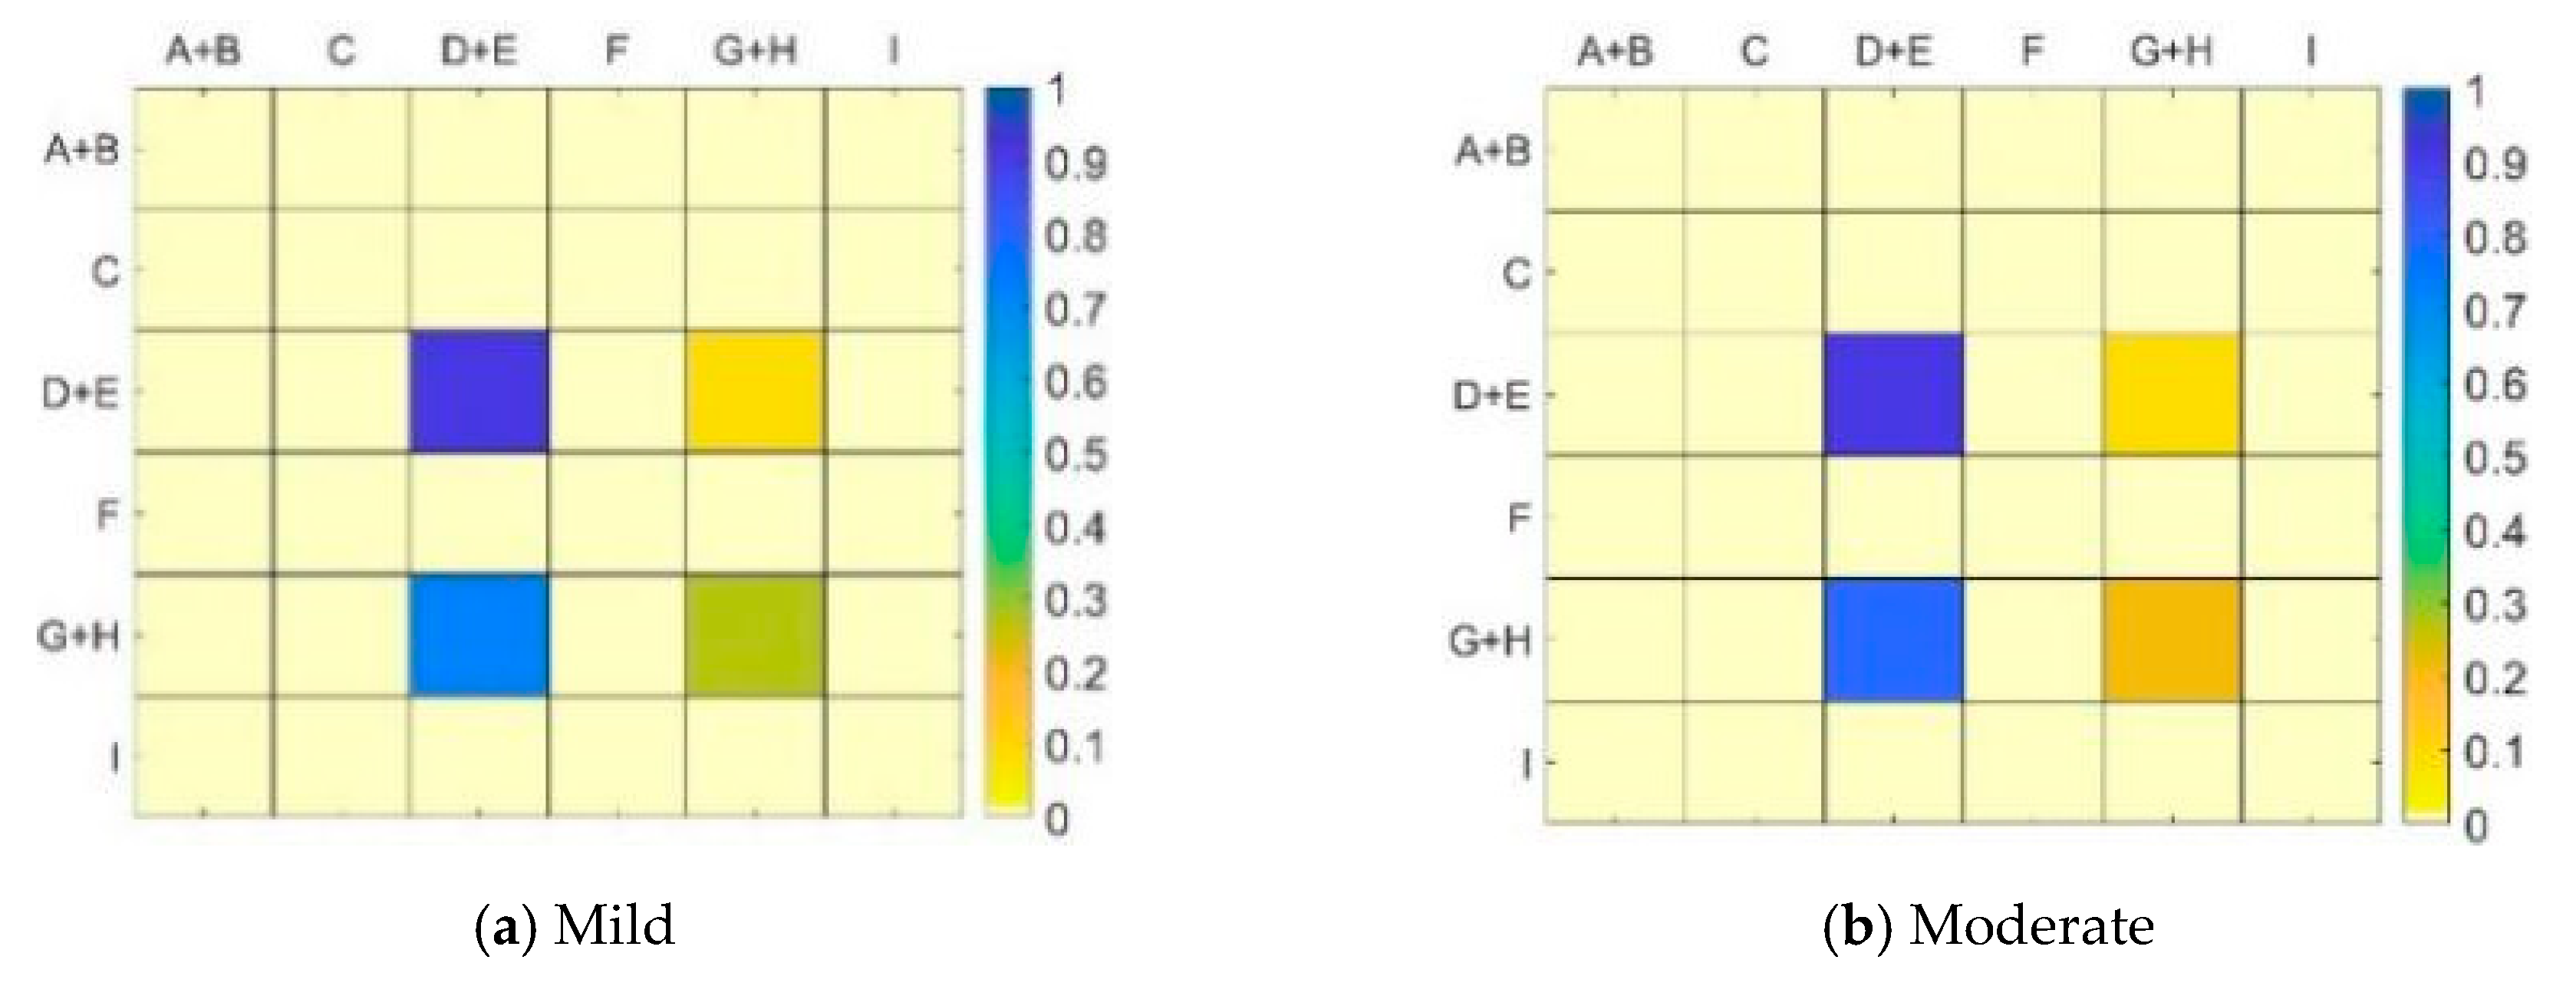
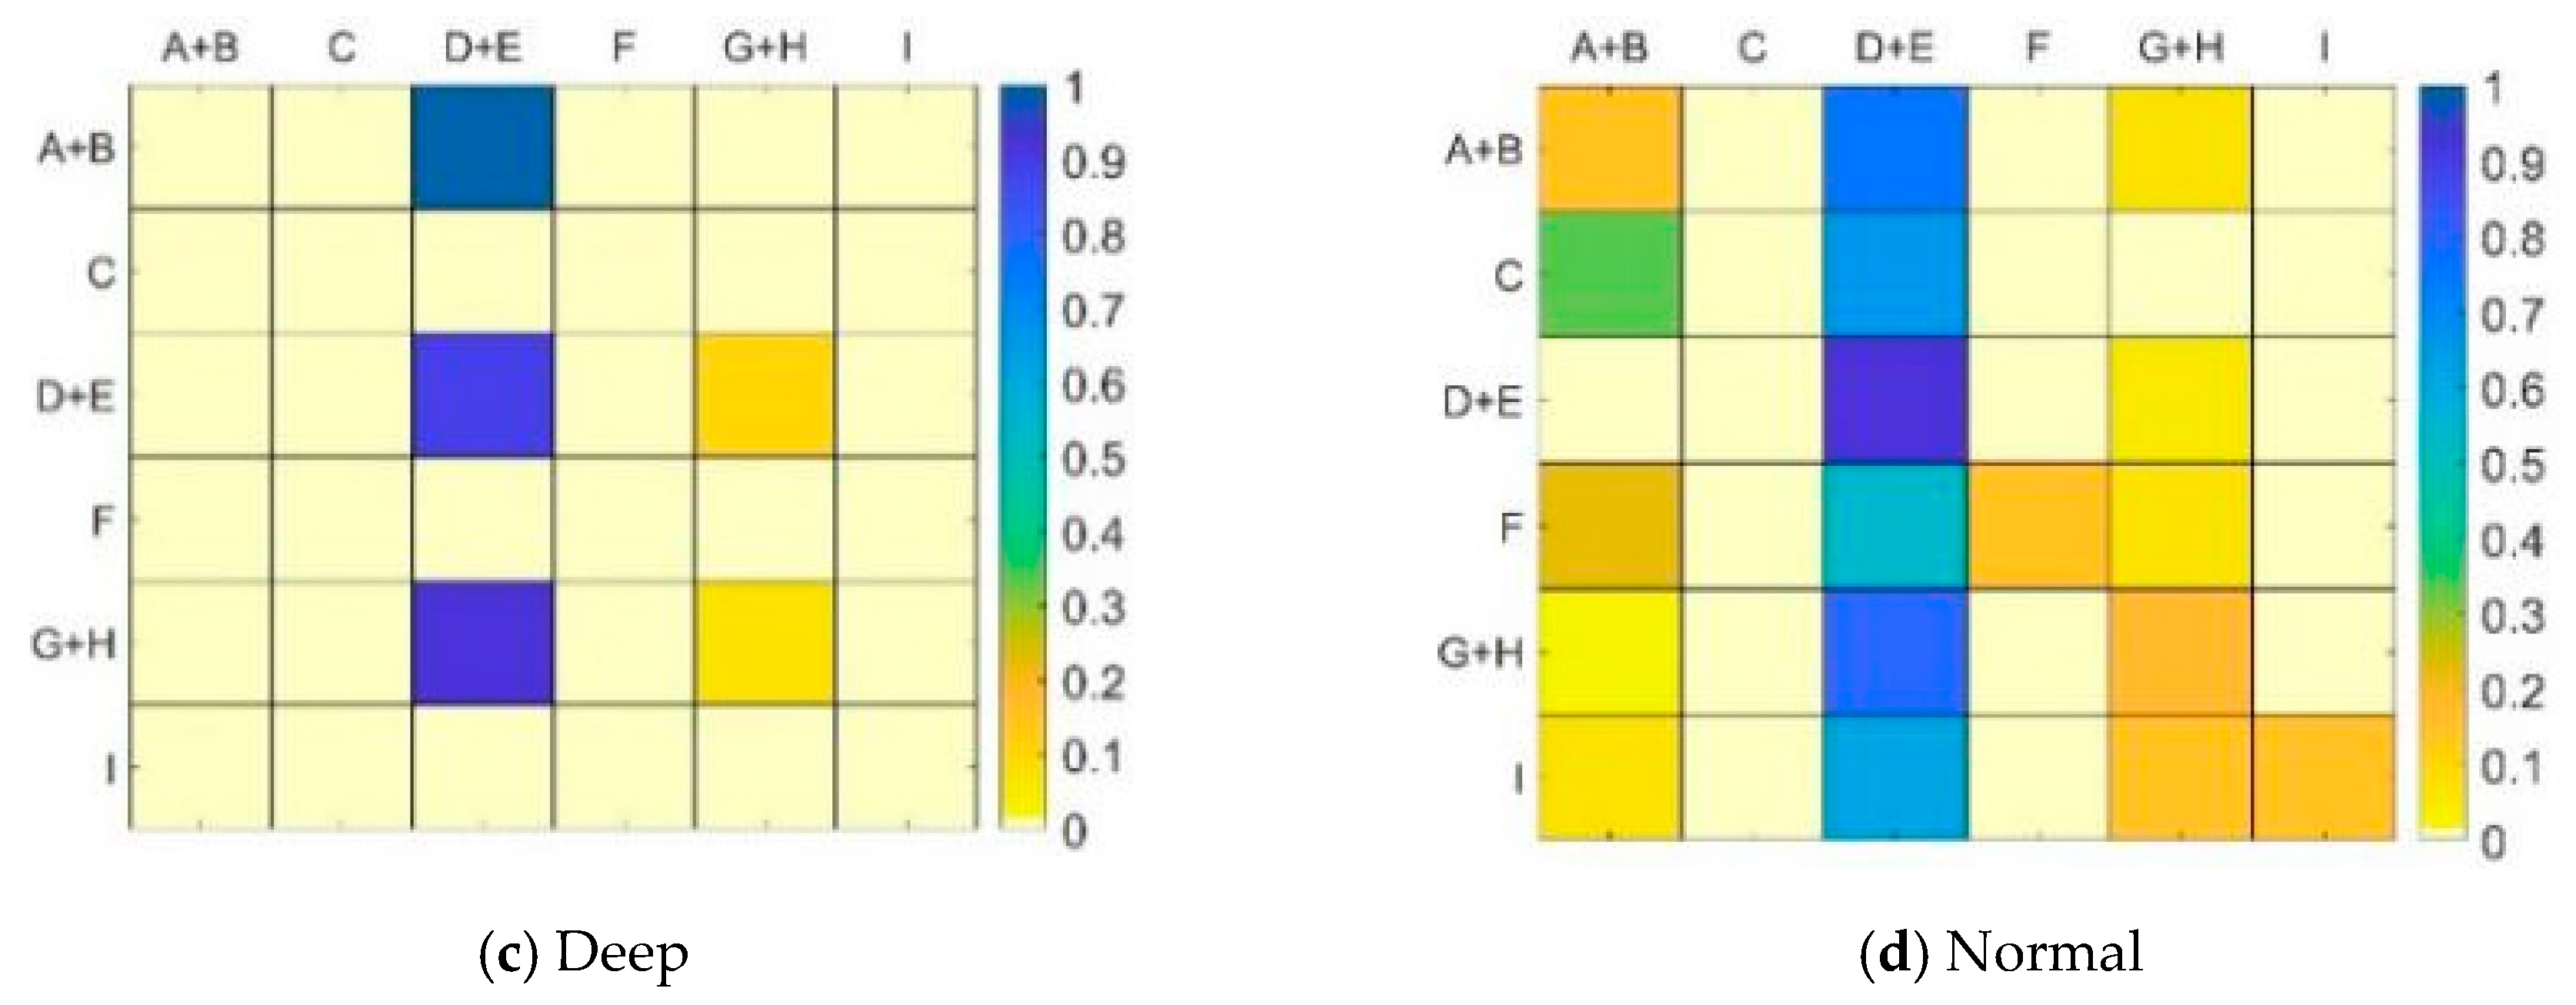
- Under normal circumstances of driving, drivers’ vision can be transferred well among various areas. Under mild and moderate cognitive workloads, drivers’ eyes shift between the front and right of the current lane and the number of times the drivers’ eyes stay in the fixation area in front of the current lane decreases as workload increases.
- (4)
- Under normal circumstances of driving, in-vehicle transfer is not a continuous behavior. Eyes shift to the left and the front area very quickly. In mild and moderate workloads, the proportion of drivers’ vision transition from the right side to the front area is increased, whereas the proportion of continuous stay in the right area is significantly reduced. Therefore, under the influence of mild and moderate cognitive workloads, drivers’ eyes still shift to the right and front areas. However, the proportion of improvement decreases as workload increases. In the case of in-depth workload, no significant change is observed in the one- and two-step transition probabilities of the drivers’ vision.
- (5)
- The geometry of the road is not considered because the driver’s line of sight is on the curve or tangent of the road and the effect on dynamic vision exists. This issue will be further considered in the next work.
Author Contributions
Funding
Conflicts of Interest
References
- Lee, J.D. Dynamics of Driver Distraction: The process of engaging and disengaging. Ann. Adv. Automot. Med. 2014, 58, 24–32. [Google Scholar] [PubMed]
- Merat, N.; Lee, J.D. Preface to the special section on human factors and automation in vehicles: Designing highly automated vehicles with the driver in mind. Hum. Factors 2012, 54, 681–686. [Google Scholar] [CrossRef] [PubMed]
- Summala, H. Towards understanding motivational and emotional factors in driver behaviour: Comfort through satisficing. In Modelling Driver Behavior in Automotive Environments; Cacciabue, P.C., Ed.; Springer: London, UK, 2007; pp. 189–207. [Google Scholar]
- Hancock, P.A.; Mouloua, M.; Senders, J.W. On the philosophical foundations of the distracted driver and driving distraction. In Driver Distraction. Theory, Effects and Mitigation; Regan, M.A., Lee, J.D., Young, K.L., Eds.; CRC Press: Boca Raton, FL, USA, 2009; pp. 11–30. [Google Scholar]
- Regan, M.A.; Lee, J.D.; Young, K. Driver Distraction: Theory, Effects, and Mitigation, 1st ed.; CRC Press: Boca Raton, FL, USA, 2009. [Google Scholar]
- Lee, J.D.; Regan, M.A. Advances in Research and Countermeasures. In Driver Distraction and Inattention; CRC Press: Boca Raton, FL, USA, 2017. [Google Scholar]
- National Highway Traffic Safety Administration. Distracted Driving in Fatal Crashes, 2017; Traffic Safety Facts Research Note. Report No. DOT HS 812 700; NHTSA’s National Center for Statistics and Analysis: Washington, DC, USA, 2019. [Google Scholar]
- Mourant, R.R.; Rockwell, T.H. Mapping Eye-Movement Patterns to the Visual Scene in Driving: An Exploratory Study. Hum. Factors 1970, 12, 81–87. [Google Scholar] [CrossRef] [PubMed]
- Reimer, B.; Mehler, B.; Wang, Y.; Coughlin, J.F. A Field Study on the Impact of Variations in Short-Term Memory Demands on Drivers’ Visual Attention and Driving Performance Across Three Age Groups. Hum. Factors 2012, 54, 454–468. [Google Scholar] [CrossRef] [PubMed]
- Strayer, D.L.; Turrill, J.; Cooper, J.M.; Coleman, J.R.; Medeiros-Ward, N.; Biondi, F. Assessing cognitive distraction in the automobile. Hum. Factors 2015, 57, 1301–1323. [Google Scholar] [CrossRef] [PubMed]
- Harbluk, J.L.; Noy, Y.I.; Trbovich, P.L.; Eizenman, M. An on-road assessment of cognitive distraction: Impacts on drivers’ visual behavior and braking performance. Accid. Anal. Prev. 2007, 39, 372–379. [Google Scholar] [CrossRef] [PubMed]
- Gomez, J.P.; Akleman, D.; Akleman, E.; Pavlidis, I. Causality Effects of Interventions and Stressors on Driving Behaviors under Typical Conditions. Mathematics 2018, 6, 139. [Google Scholar] [CrossRef]
- Horberry, T.; Anderson, J.; Regan, M.A.; Triggs, T.J.; Brown, J. Driver Distraction: The Effects of Concurrent In-Vehicle Tasks, Road Environment Complexity and Age on Driving Performance. Accid. Anal. Prev. 2006, 38, 185–191. [Google Scholar] [CrossRef]
- Dua, I.; Nami, A.U.; Jawahar, C.V.; Padmanabhan, V. AutoRate: How attentive is the driver? In Proceedings of the 14th IEEE International Conference on Automatic Face & Gesture Recognition, Lille, France, 14–18 May 2019. [Google Scholar]
- Xia, Y.; Zhang, D.; Kim, J.; Nakayama, K.; Zipser, K.; Whitney, D. Predicting Driver Attention in Critical Situations. arXiv 2018, arXiv:1711.06406v3. [Google Scholar]
- Yu, F.; Xian, W.; Chen, Y.; Liu, F.; Liao, M.; Madhavan, V.; Darrell, T. BDD100K: A Diverse Driving Video Database with Scalable Annotation Tooling. arXiv 2018, arXiv:1805.04687. [Google Scholar]
- Fernández-Isabel, A.; Peixoto, P.; de Diego, I.M.; Conde, C.; Cabello, E. Combining dynamic finite state machines and text-based similarities to represent human behavior. Eng. Appl. Artif. Intell. 2019, 85, 504–516. [Google Scholar] [CrossRef]
- Birrell, S.A.; Fowkes, M. Glance behaviours when using an in-vehicle smart driving aid: A real-world, on-road driving study. Transp. Res. Part F Traffic Psychol. Behav. 2014, 22, 113–125. [Google Scholar] [CrossRef]
- Mackenzie, A.K.; Harris, J.M. A Link between Attentional Function, Effective Eye Movements, and Driving Ability. J. Exp. Psychol. Hum. Percept. Perform. 2017, 43, 381–394. [Google Scholar] [CrossRef] [PubMed]
- Underwood, G. Visual attention and the transition from novice to advanced driver. Ergonomics 2007, 50, 1235–1249. [Google Scholar] [CrossRef] [PubMed]
- Belyusar, D.; Reimer, B.; Mehler, B.; Coughlin, J.F. A field study on the effects of digital billboards on glance behavior during highway driving. Accid. Anal. Prev. 2016, 88, 88–96. [Google Scholar] [CrossRef] [PubMed]
- Zhang, W.H.; Dai, J.; Pei, Y.; Li, P.; Yan, Y.; Chen, X. Drivers’ Visual Search Patterns during Overtaking Maneuvers on Freeway. Int. J. Environ. Res. Public Health 2016, 13, 1159. [Google Scholar] [CrossRef]
- Yamani, Y.; Bıçaksız, P.; Unverricht, J.; Samuel, S. Impact of information bandwidth of in-vehicle technologies on drivers’ attention maintenance performance: A driving simulator study. Transp. Res. Part F Traffic Psychol. Behav. 2018, 59, 195–202. [Google Scholar] [CrossRef]
- Risteska, M.; Donmez, B.; Chen, H.Y.; Modi, M. Prevalence of Engagement in Single versus Multiple Types of Secondary Tasks: Results from the Naturalistic Engagement in Secondary Task (NEST) Dataset. Transp. Res. Rec. 2018, 2672, 1–10. [Google Scholar] [CrossRef]
- Mackenzie, A.K.; Harris, J.M. Eye movements and hazard perception in active and passive driving. Vis. Cogn. 2015, 23, 736–757. [Google Scholar] [CrossRef]
- Xian, H.C.; Jin, L.S. The Effects of Using In-Vehicle Computer on Driver Eye Movements and Driving Performance. Adv. Mech. Eng. 2014, 7, 981908. [Google Scholar] [CrossRef]
- Munoz, M.; Reimer, B.; Lee, J.; Mehler, B.; Fridman, L. Distinguishing patterns in drivers’ visual attention allocation using Hidden Markov Models. Transp. Res. Part F Traffic Psychol. Behav. 2016, 43, 90–103. [Google Scholar] [CrossRef]
- Fridman, L.; Toyoda, H.; Seaman, S.; Seppelt, B.; Angell, L.; Lee, J.; Mehler, B.; Reimer, B. What Can Be Predicted from Six Seconds of Driver Glances? arXiv 2016. [Google Scholar] [CrossRef]
- Desmet, C.; Diependaele, K. An eye-tracking study on the road examining the effects of hands-free phoning on visual attention. Transp. Res. Part F Traffic Psychol. Behav. 2019, 60, 549–559. [Google Scholar] [CrossRef]
- Stapel, J.; Mullakkal-Babu, F.A.; Happee, R. Automated driving reduces perceived workload, but monitoring causes higher cognitive load than manual driving. Transp. Res. Part F Traffic Psychol. Behav. 2019, 60, 590–605. [Google Scholar] [CrossRef]
- Biswas, P.; Prabhakar, G. Detecting drivers’ cognitive load from saccadic intrusion. Transp. Res. Part F Traffic Psychol. Behav. 2018, 54, 63–78. [Google Scholar] [CrossRef]
- Ahlstrom, C.; Kircher, K. Changes in glance behaviour when using a visual eco-driving system—A field study. Appl. Ergon. 2017, 58, 414–423. [Google Scholar] [CrossRef]
- Recarte, A.M.; Nunes M, L. Mental Workload While Driving: Effects on Visual Search, Discrimination, and Decision Making. J. Exp. Psychol. Appl. 2003, 9, 119–137. [Google Scholar] [CrossRef]
- Chapman, P.; Underwood, G.; Roberts, K. Visual search patterns in trained and untrained novice drivers. Transp. Res. Part F Traffic Psychol. Behav. 2002, 5, 157–167. [Google Scholar] [CrossRef]
- Falkmer, T.; Gregersen, N. Fixation patterns of learner drivers with and without cerebral palsy when driving in real traffic envirnments. Transp. Res. Part F Traffic Psychol. Behav. 2001, 4, 171–185. [Google Scholar] [CrossRef]
- Andersson, R.; Larsson, L.; Holmqvist, K.; Stridh, M.; Nyström, M. One algorithm to rule them all? An evaluation and discussion of ten eye movement event-detection algorithms. Behav. Res. Mothods 2017, 49, 616–637. [Google Scholar] [CrossRef]
- Salvucci, D.D.; Goldberg, J.H. Identifying fixations and saccades in eye-tracking protocols. In Proceedings of the 2000 Symposium on Eye Tracking Research & Applications, Palm Beach Gardens, FL, USA, 6–8 November 2000. [Google Scholar]
- Gilland, J. Driving, Eye-Tracking and Visual Entropy: Exploration of Age and Task Effects; Department of Psychology, The University of South Dakota: Vermillion, SD, USA, 2008. [Google Scholar]
- Ma, Y.; Hu, B.; Chan, C.-Y.; Qi, S.; Fan, L. Distractions intervention strategies for in-vehicle secondary tasks: An on-road test assessment of driving task demand based on real-time traffic environment. Transp. Res. Part D Transp. Environ. 2018, 63, 747–754. [Google Scholar] [CrossRef]
- Falkmer, T.; Gregersen, N.P. A Comparison of Eye Movement Behavior of Inexperienced and Experienced Drivers in Real Traffic Environments. Optom. Vis. Sci. 2005, 82, 732–739. [Google Scholar] [CrossRef] [PubMed]
- Bao, S.; Boyle, L.N. Age-related differences in visual scanning at median-divided highway intersections in rural areas. Accid. Anal. Prev. 2009, 41, 146–152. [Google Scholar] [CrossRef] [PubMed]
- Li, S.; Ji, B.-K.; Sun, W.-C.; Wang, L.-H.; Yang, Z.-K. Study on the Influence of Driving Experience on Visual Characteristic. Adv. Mech. Eng. 2013, 5, 790813. [Google Scholar] [CrossRef]
- Wu, F.W.; Fu, R.; Niu, Z.L. Driver’s Fixation Transition Mode during Lane Changing Process. J. Transp. Syst. Eng. Inf. Technol. 2014, 14, 68–73. [Google Scholar]
- Le, A.S.; Suzuki, T.; Aoki, H. Evaluating driver cognitive distraction by eye tracking: From simulator to driving. Transp. Res. Interdiscip. Perspect. 2020, 4, 100087. [Google Scholar] [CrossRef]
- Engström, J.; Johansson, E.; Östlund, J. Effects of visual and cognitive load in real and simulated motorway driving. Transp. Res. Part F Traffic Psychol. Behav. 2005, 8, 97–120. [Google Scholar] [CrossRef]


| Driver Characteristics | All of the Participants | |||
|---|---|---|---|---|
| Mean | Standard Deviation | Number (Person) | Percentage (%) | |
| Gender | — | — | 10 | — |
| Male | — | — | 6 | 60 |
| Female | — | — | 4 | 40 |
| Age (Year) | 34.00 | 8.65 | 10 | — |
| ≤25 | 25.00 | 0.00 | 2 | 20 |
| (25, 40) | 32.30 | 4.61 | 6 | 60 |
| ≥40 | 48.00 | 5.00 | 2 | 20 |
| Driving Experience (Year) | 7.00 | 6.96 | 10 | — |
| ≤2 | 1.67 | 0.47 | 3 | 30 |
| (2, 8) | 3.67 | 0.94 | 3 | 30 |
| ≥8 | 13.50 | 6.95 | 4 | 40 |
| Driving Mileage (10,000 Km) | 5.72 | 6.37 | 10 | — |
| ≤2 | 0.93 | 0.58 | 4 | 40 |
| (2, 5) | 3.27 | 1.03 | 3 | 30 |
| ≥5 | 14.57 | 4.35 | 3 | 30 |
| Collision Accidents in the Past Three Years | — | — | 10 | — |
| None | — | — | 6 | 60 |
| Once | — | — | 3 | 30 |
| More than Once | — | — | 1 | 10 |
| Educational Background | — | — | 10 | — |
| Bachelor | — | — | 2 | 20 |
| Master | — | — | 6 | 60 |
| PhD | — | — | 2 | 20 |
| Using Mobile Phone During Driving | — | — | 10 | — |
| Hardly Ever | — | — | 3 | 30 |
| Sometimes | — | — | 5 | 50 |
| Always | — | — | 2 | 20 |
| Tasks | Level | Type and Example | Question Number | Total Number | Limited Time for Each Question (s) |
|---|---|---|---|---|---|
| Simple | Mild | Addition calculation of 2-digit positive numbers without carry (21 + 23 =) | 3 | 5 | 6 |
| Subtraction calculation of 2-digit positive numbers without borrowing (25 − 12 =) | 2 | ||||
| General | Moderate | Addition calculation of 2-digit positive numbers with carrying (16 + 17 =) | 2 | 3 | 10 |
| Subtraction calculation of 2-digit positive numbers with borrowing (54 −18 =) | 1 | ||||
| Complex | Deep | Subtraction calculation of 2-digit negative numbers (18 − 33 =) | 1 | 2 | 15 |
| Continuous addition calculation of 2-digit positive numbers (12 + 23 + 36 =) | 1 |
| Serial | Fixation Area | Fixation Target | |
|---|---|---|---|
| A | Left side | Distant area on the left side | Vehicles and traffic signs far from the left side or opposite lanes |
| B | Near area on the left side | Vehicles and traffic signs near the left side or opposite lanes | |
| C | Bottom left side | Left mirror and nearby area | |
| D | Front side | Far ahead | Distant area of the current driving lane |
| E | Near area in the front side | Near area of the current driving lane | |
| F | In-vehicle area | In-vehicle targets, including on-board devices such as dashboard steering wheel | |
| G | Right side | Distant area on the right side | Vehicles and traffic signs far away from the right side, rearview mirrors |
| H | Near area on the right side | Vehicles and traffic signs near the right side | |
| I | Bottom right side | Glove box, right mirror, and nearby area | |
| Area | Driver Number | |||||||||
|---|---|---|---|---|---|---|---|---|---|---|
| 1 | 2 | 3 | 4 | 5 | 6 | 7 | 8 | 9 | 10 | |
| Average Fixation Duration (ms) | ||||||||||
| A | 126.46 | 125.26 | 136.20 | 125.75 | 205.37 | 90.10 | 133.60 | 0.04 | 163.33 | 100.91 |
| B | 135.82 | 149.60 | 162.55 | 103.13 | 231.01 | 135.96 | 140.03 | 113.68 | 183.41 | 188.57 |
| C | 150.91 | 80.00 | 111.11 | 0.09 | 100.10 | 170.00 | 0.12 | 220.04 | 103.33 | 220.00 |
| D | 153.32 | 231.81 | 184.57 | 194.81 | 239.28 | 125.58 | 116.56 | 92.51 | 161.86 | 98.18 |
| E | 175.58 | 251.43 | 218.14 | 185.45 | 217.37 | 141.99 | 145.83 | 163.95 | 184.77 | 176.83 |
| F | 195.96 | 173.76 | 192.40 | 146.51 | 259.27 | 158.31 | 108.81 | 147.43 | 143.76 | 133.75 |
| G | 163.94 | 80.00 | 108.24 | 148.72 | 102.18 | 125.93 | 97.50 | 60.00 | 111.11 | 0.09 |
| H | 156.79 | 113.96 | 131.83 | 129.12 | 101.05 | 123.11 | 147.85 | 168.13 | 173.83 | 190.18 |
| I | 170.59 | 138.57 | 137.53 | 171.43 | 120.01 | 137.04 | 113.33 | 121.25 | 120.87 | 116.67 |
| Area | Driver Number | |||||||||
|---|---|---|---|---|---|---|---|---|---|---|
| 1 | 2 | 3 | 4 | 5 | 6 | 7 | 8 | 9 | 10 | |
| Regional Fixation Probability (%) | ||||||||||
| A | 2.21 | 1.21 | 1.24 | 1.49 | 17.18 | 0.12 | 1.23 | 0.01 | 0.19 | 0.12 |
| B | 3.76 | 0.49 | 1.39 | 0.45 | 2.86 | 3.39 | 0.10 | 0.78 | 0.74 | 1.06 |
| C | 0.68 | 0.01 | 0.09 | 0.01 | 0.02 | 0.08 | 0.01 | 0.12 | 0.06 | 0.09 |
| D | 38.66 | 59.72 | 48.87 | 13.13 | 8.91 | 9.16 | 2.75 | 0.13 | 1.37 | 0.44 |
| E | 44.61 | 35.05 | 39.67 | 76.51 | 68.41 | 75.08 | 86.91 | 76.25 | 74.13 | 61.91 |
| F | 2.93 | 2.11 | 2.62 | 0.86 | 1.91 | 6.01 | 2.36 | 3.93 | 1.95 | 1.73 |
| G | 2.98 | 0.36 | 0.33 | 5.06 | 0.50 | 0.78 | 0.29 | 0.01 | 0.10 | 0.01 |
| H | 3.37 | 0.78 | 1.44 | 1.00 | 0.17 | 4.53 | 5.83 | 18.04 | 21.16 | 34.34 |
| I | 0.80 | 0.25 | 4.34 | 1.47 | 0.02 | 0.85 | 0.50 | 0.70 | 0.27 | 0.28 |
| Type | The Statistics of Basic Description | ||||||
| Items | N | Mean | Median | SD | SEM | Kurtosis | Skewness |
| En | 10 | 3.04016 | 3.03679 | 0.4885195 | 0.1544834 | −0.182 | 0.068 |
| Type | The Results of Normal Distribution | ||||||
| Item | Kolmogorov-smirnov | Shapiro-wilk | |||||
| Statistical data | df | Sig. | Statistical data | df | Sig. | ||
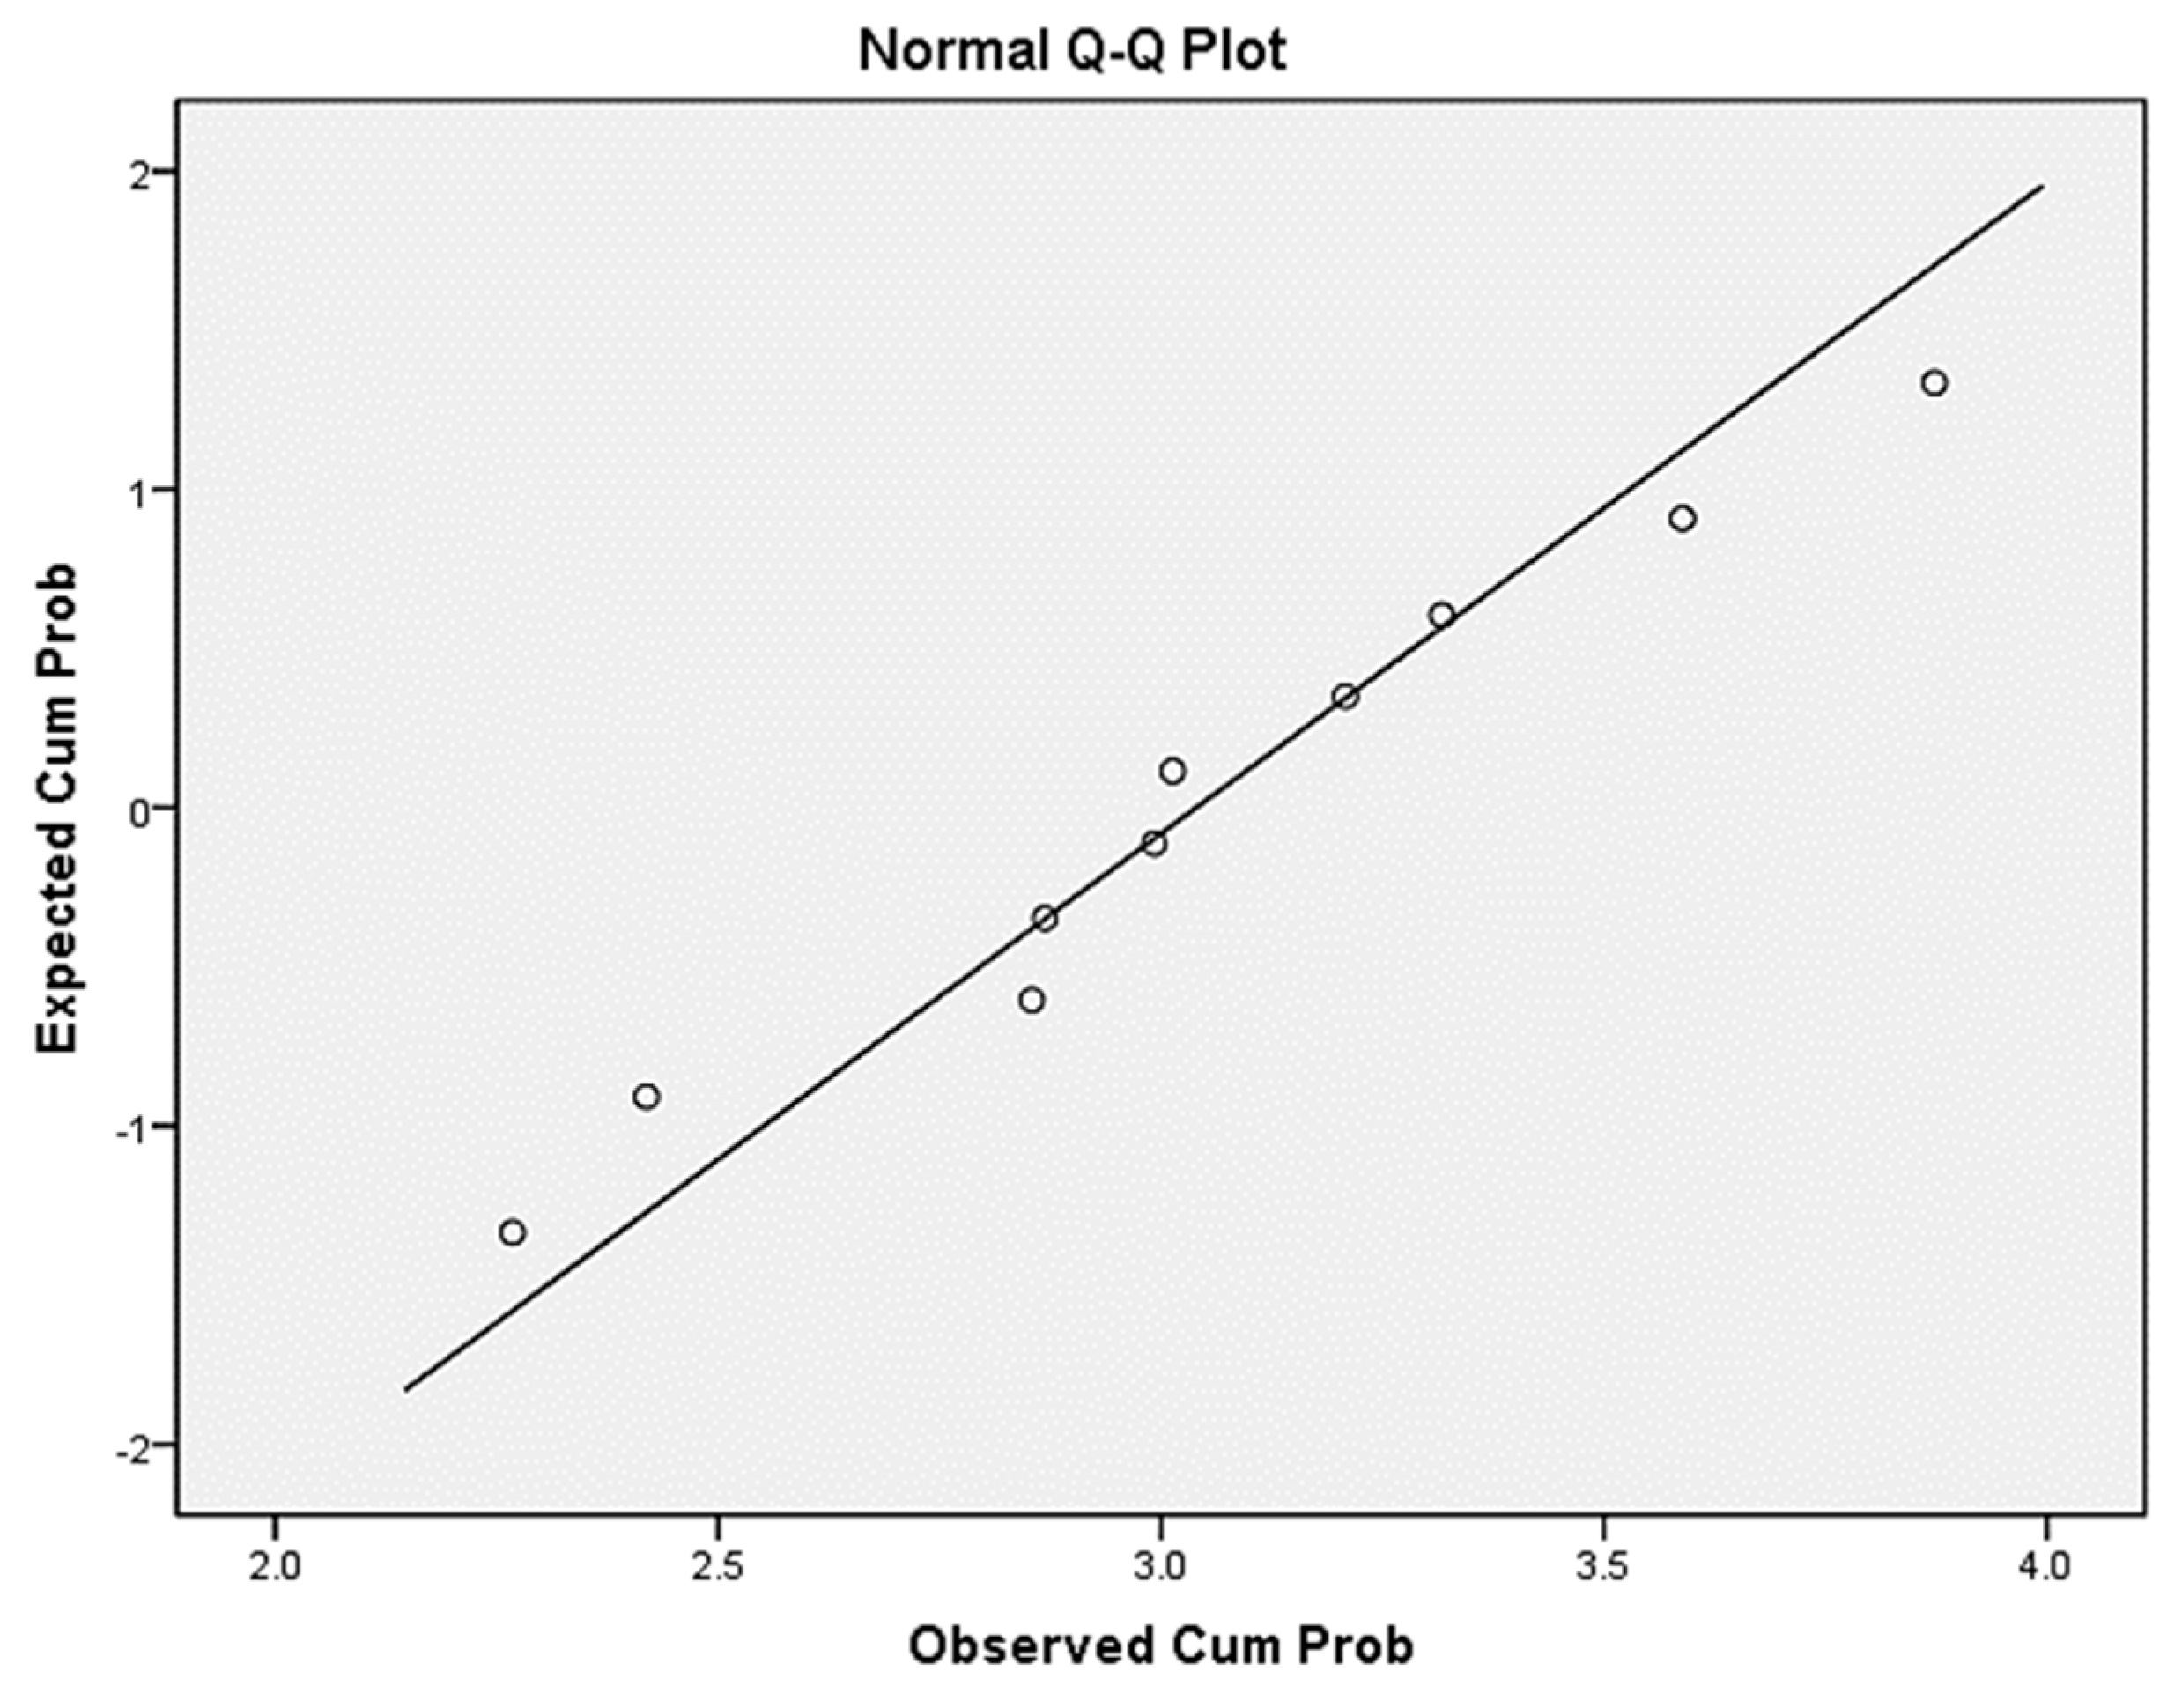
| En | 0.152 | 10 | 0.200 | 0.975 | 10 | 0.933 | |
| State | Mild | Moderate | Normal Driving | |||
|---|---|---|---|---|---|---|
| Transition Area | G + H to D + E | G + H to D + E | F to A + B | A + B to D + E | F to D + E | I to I |
| One-step | 0.5455 | 0.6667 | 0.1539 | 0.6753 | 0.3846 | 0.0769 |
| Two-step | 0.7273 | 0.7826 | 0.2308 | 0.7532 | 0.5385 | 0.1538 |
| Increase Proportion | 33.31% | 17.38% | 49.97% | 11.54% | 40.02% | 100% |
| State | Mild | Moderate | Normal Driving | |||
|---|---|---|---|---|---|---|
| Transition Area | G + H to G + H | G + H to G + H | A + B to A + B | F to F | G + H to G + H | I to G + H |
| One-step | 0.4545 | 0.3333 | 0.2078 | 0.3846 | 0.2680 | 0.3846 |
| Two-step | 0.2727 | 0.2174 | 0.1558 | 0.1538 | 0.1808 | 0.1538 |
| Reduce proportion | 40% | 34.77% | 25.02% | 60.01% | 32.54% | 60.01% |
© 2020 by the authors. Licensee MDPI, Basel, Switzerland. This article is an open access article distributed under the terms and conditions of the Creative Commons Attribution (CC BY) license (http://creativecommons.org/licenses/by/4.0/).
Share and Cite
Ma, Y.; Qi, S.; Zhang, Y.; Lian, G.; Lu, W.; Chan, C.-Y. Drivers’ Visual Attention Characteristics under Different Cognitive Workloads: An On-Road Driving Behavior Study. Int. J. Environ. Res. Public Health 2020, 17, 5366. https://doi.org/10.3390/ijerph17155366
Ma Y, Qi S, Zhang Y, Lian G, Lu W, Chan C-Y. Drivers’ Visual Attention Characteristics under Different Cognitive Workloads: An On-Road Driving Behavior Study. International Journal of Environmental Research and Public Health. 2020; 17(15):5366. https://doi.org/10.3390/ijerph17155366
Chicago/Turabian StyleMa, Yanli, Shouming Qi, Yaping Zhang, Guan Lian, Weixin Lu, and Ching-Yao Chan. 2020. "Drivers’ Visual Attention Characteristics under Different Cognitive Workloads: An On-Road Driving Behavior Study" International Journal of Environmental Research and Public Health 17, no. 15: 5366. https://doi.org/10.3390/ijerph17155366
APA StyleMa, Y., Qi, S., Zhang, Y., Lian, G., Lu, W., & Chan, C.-Y. (2020). Drivers’ Visual Attention Characteristics under Different Cognitive Workloads: An On-Road Driving Behavior Study. International Journal of Environmental Research and Public Health, 17(15), 5366. https://doi.org/10.3390/ijerph17155366