Detecting the Pedestrian Shed and Walking Route Environment of Urban Parks with Open-Source Data: A Case Study in Nanjing, China


Abstract
1. Introduction
2. Materials and Methods
2.1. Case Study of the Park
2.2. Data Description
2.3. Indices
3. Results
3.1. Service Capacity and Pedestrian Environment at Park Level
3.2. Service Capacity and Pedestrian Environment of Entrances
3.2.1. Service Capacity of Entrances
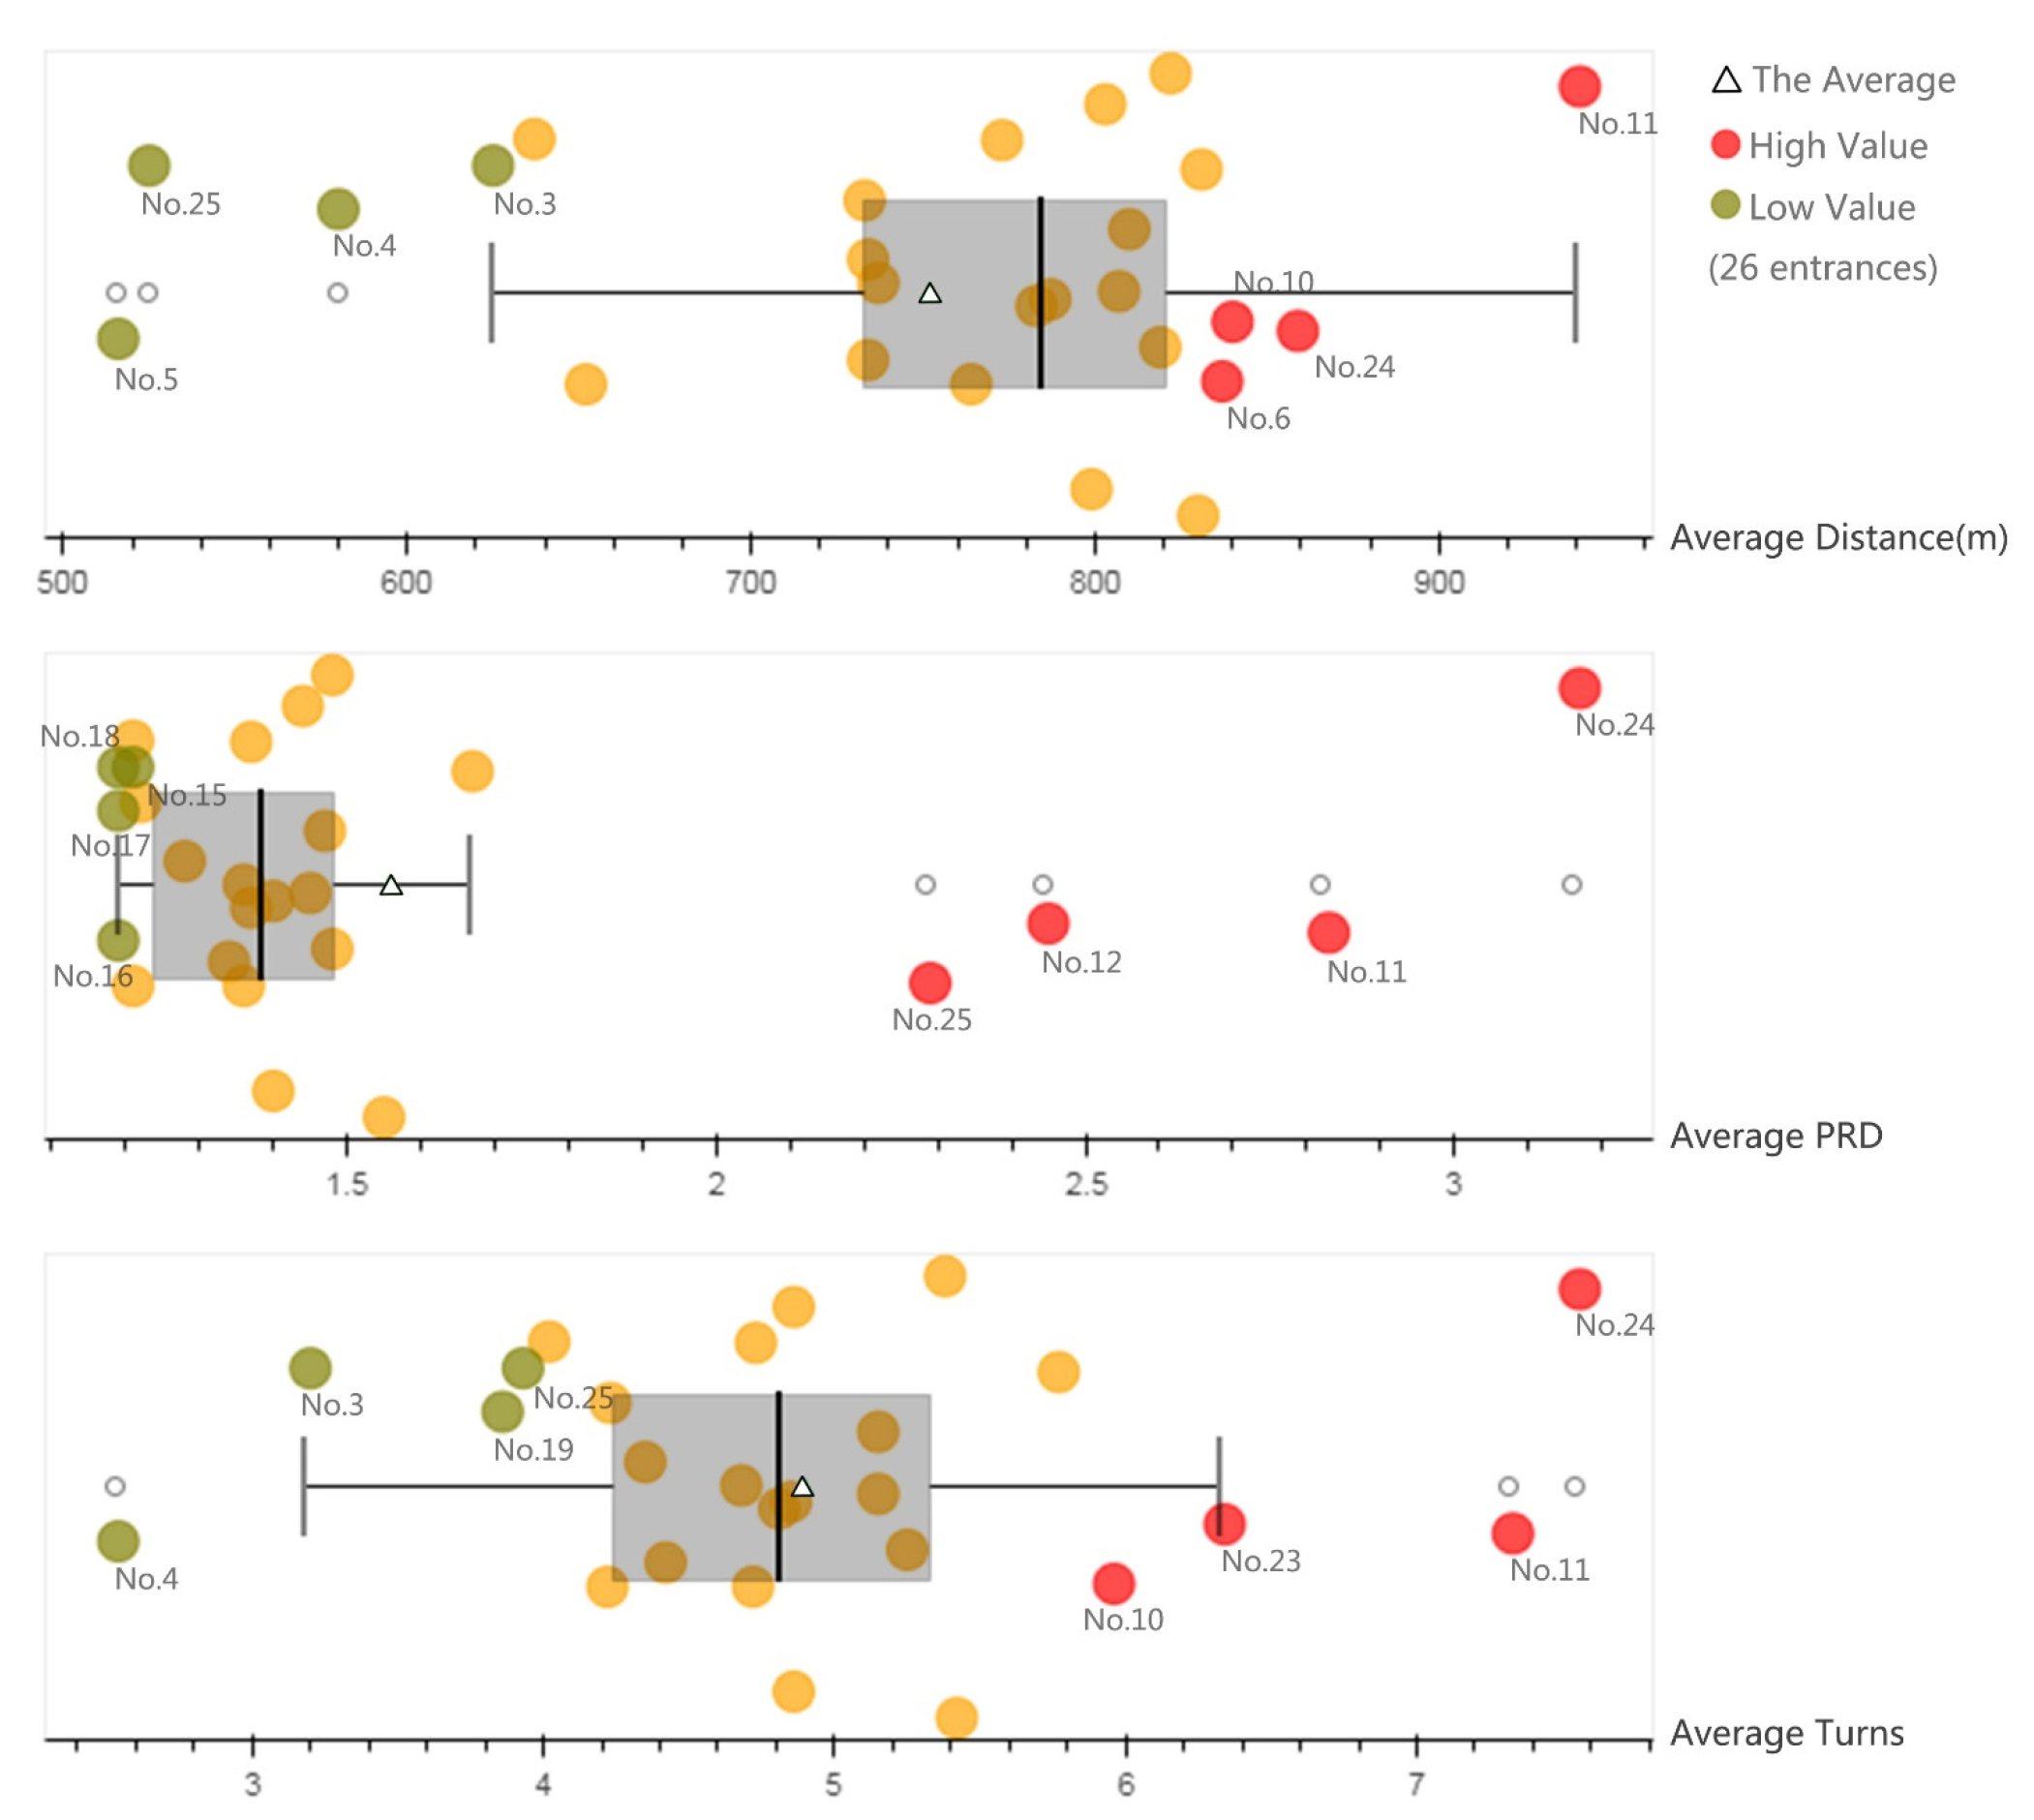
3.2.2. Pedestrian Environment of Entrances
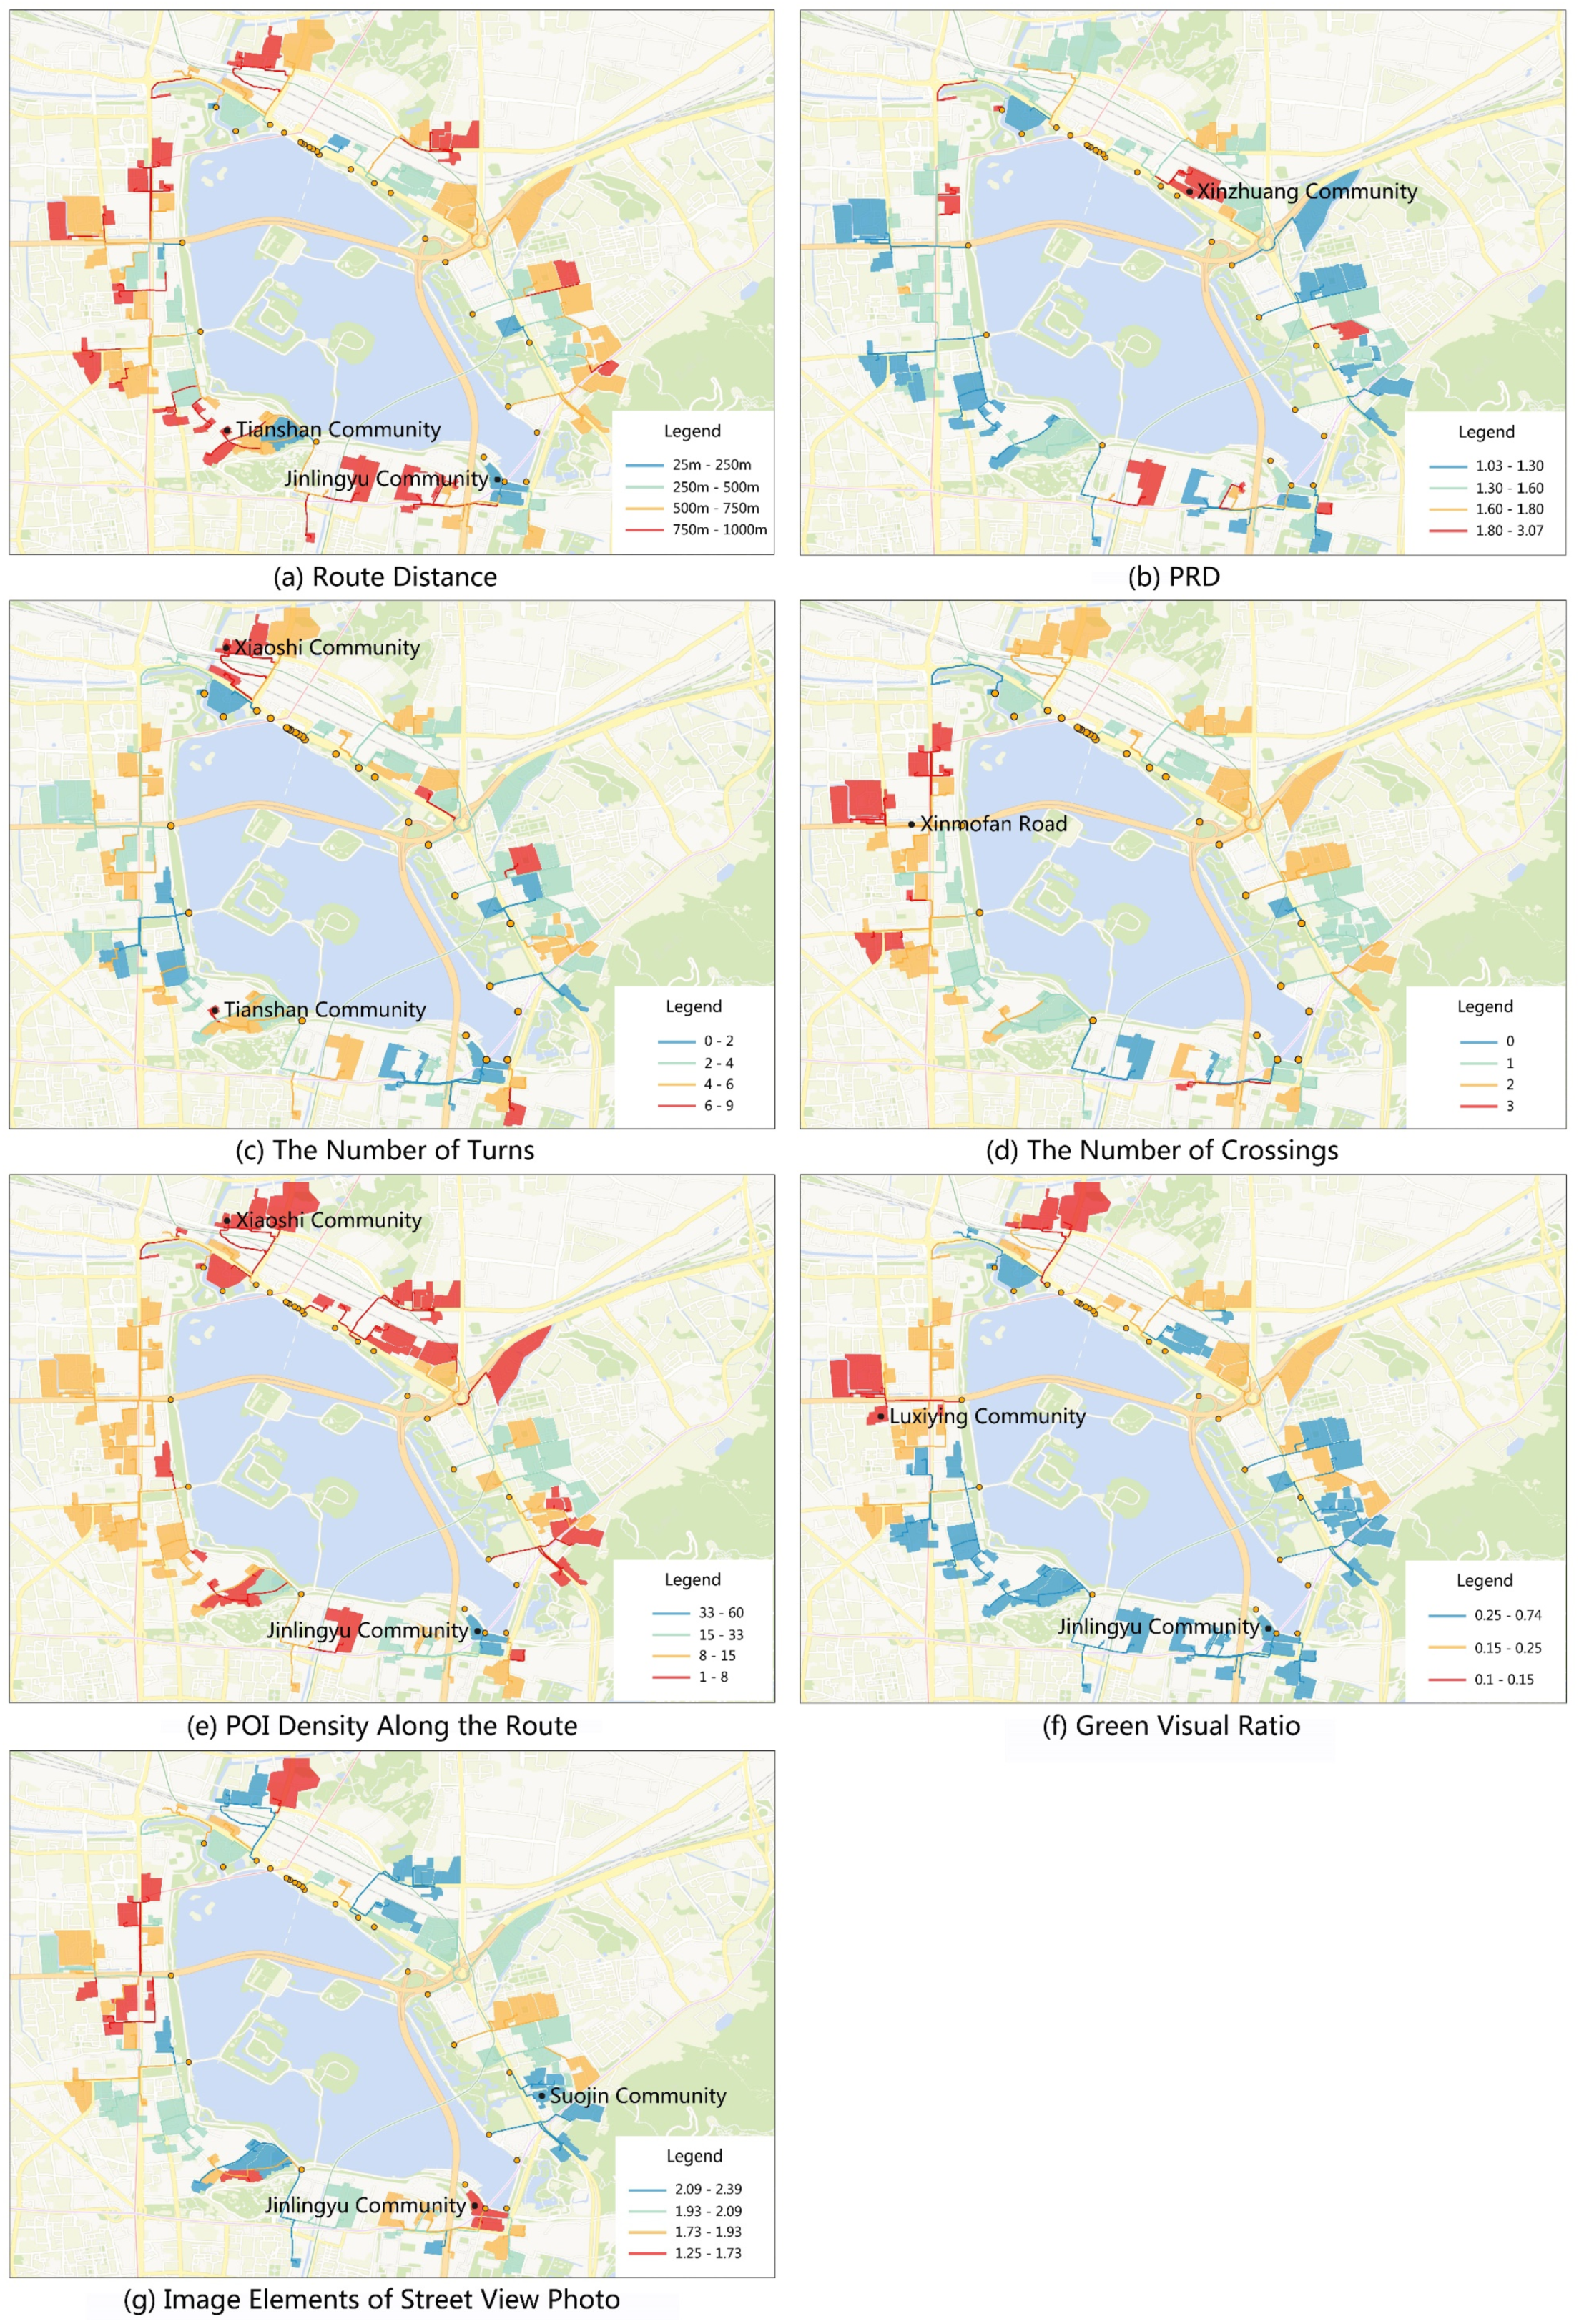
3.3. Pedestrian Environment of the Routes from Communities to the Park
4. Discussion
5. Conclusions
6. Patents
- Computer software copyright: Peripheral walking routes extractor software [abbreviation: Lines] V1.0
- Computer software copyright: POI extractor software [abbreviation: POIs] V1.0
- Computer software copyright: AOI extractor software [abbreviation: AOIs] V1.0
- Computer software copyright: Walking simulation trip generator software [abbreviation: Walking] V1.0
- Computer software copyright: Street view map extractor software [abbreviation: StreetPictures] V1.0
- Computer software copyright: Image green vision extractor software [abbreviation: GreenRate] V1.0
Author Contributions
Funding
Acknowledgments
Conflicts of Interest
References
- Blanck, H.M.; Allen, D.; Bashir, Z.; Gordon, N.; Goodman, A.; Merriam, D.; Candace, R. Let’s go to the park today: The role of parks in obesity prevention and improving the public’s health. Child. Obes. 2012, 8, 423–428. [Google Scholar] [CrossRef] [PubMed]
- Dills, J.E.; Rutt, C.; Karen, G.M. Objectively measuring route-to-park walkability in Atlanta, Georgia. Environ. Behav. 2012, 44, 841–860. [Google Scholar] [CrossRef]
- Cutts, B.B.; Darby, K.J.; Boone, C.G.; Brewis, A. City structure, obesity, and environmental justice: An integrated analysis of physical and social barriers to walkable streets and park access. Soc. Sci. Med. 2009, 69, 1314–1322. [Google Scholar] [CrossRef] [PubMed]
- Takano, T.; Nakamura, K.; Watanabe, M. Urban residential environments and senior citizens’ longevity in megacity areas: The importance of walkable green spaces. J. Epidemiol. Community Health 2002, 56, 913–918. [Google Scholar] [CrossRef]
- Rigolon, A.; Toker, Z.; Gasparian, N. Who has more walkable routes to parks? An environmental justice study of safe routes to parks in neighborhoods of Los Angeles. J. Urban Aff. 2018, 40, 576–591. [Google Scholar] [CrossRef]
- Greenwald, M.; Boarnet, M. Built environment as determinant of walking behavior: Analyzing nonwork pedestrian travel in Portland, Oregon. transp. Res. Rec. 2001, 1780, 33–41. [Google Scholar] [CrossRef]
- Kaczynski, A.T.; Henderson, K.A. Parks and recreation settings and active living: A review of associations with physical activity function and intensity. J. Phys. Activ. Health 2008, 5, 619–632. [Google Scholar] [CrossRef]
- Owen, N.; Humpel, N.; Leslie, E.; Bauman, A.; Sallis, J.F. Understanding environmental influences on walking: Review and research agenda. Am. J. Prev. Med. 2004, 27, 67–76. [Google Scholar] [CrossRef]
- Grow, H.M.; Saelens, B.E.; Kerr, J.; Durant, N.H.; Norman, G.J.; Sallis, J.F. Where are youth active? Roles of proximity, active transport, and the built environment. Med. Sci. Sports Exerc. 2008, 40, 2071–2079. [Google Scholar] [CrossRef]
- Eugenie, L.B. Radburn and the American Planning Movement. J. Am. Plan. Assoc. 1980, 46, 424–431. [Google Scholar]
- And, C.M.L.; Ahn, K.H. Is Kentlands Better than Radburn? The American Garden City and New Urbanist Paradigms. J. Am. Plan. Assoc. 2003, 69, 50–71. [Google Scholar] [CrossRef]
- Mumford, L. The neighborhood and the neighborhood unit. Town Plan. Rev. 1954, 24, 256–270. [Google Scholar] [CrossRef]
- Shannon, R.; Mant, J.; Dessewffy, M.; Harrison, L. 20-Minute Neighbourhoods: Creating a More Liveable Melbourne. J. Transp. Health. 2019, 14, 100773. [Google Scholar] [CrossRef]
- Jinan Urban Planning Bureau. Planning Guidance of 15-Minute Community-Life Circle in Jinan, 1st ed.; Jinan Urban Planning Bureau: Jinan, China, 2019; pp. 1–4.
- Shanghai Urban Planning and Land Resources Administration Bureau. Planning Guidance of 15-Minute Community-Life Circle, 1st ed.; Shanghai Urban Planning and Land Resources Administration Bureau: Shanghai, China, 2016; pp. 21–46.
- Tan, P.Y.; Samsudin, R. Effects of spatial scale on assessment of spatial equity of urban park provision. Landsc. Urban Plan. 2017, 158, 139–154. [Google Scholar] [CrossRef]
- Tang, Z.; Gu, S. An evaluation of social performance in the distribution of urban parks in the central city of Shanghai: From spatial equity to social equity. Urban Plan. Forum 2015, 2, 48–56. [Google Scholar]
- Carr, L.J.; Dunsiger, S.I.; Marcus, B.H. Validation of walk score for estimating access to walkable amenities. Br. J. Sports Med. 2011, 45, 1144–1148. [Google Scholar] [CrossRef]
- Frank, L.D.; Schmid, T.L.; Sallis, J.F.; Chapman, J.; Saelens, B.E. Linking objectively measured physical activity with an objectively measured urban form: Findings from Smartraq. Am. J. Prev. Med. 2005, 28, 117–125. [Google Scholar] [CrossRef]
- Talen, E. Pedestrian access as a measure of urban quality. Plan. Pract. Res. 2002, 17, 257–278. [Google Scholar] [CrossRef]
- Oliver, L.N.; Schuurman, N.; Hall, A.W. Comparing circular and network buffers to examine the influence of land use on walking for leisure and errands. Int. J. Health Geogr. 2007, 6, 41. [Google Scholar] [CrossRef]
- Sandalack, B.A.; Alaniz Uribe, F.G.; et al. Neighborhood type and walkshed size. J. Urban. 2013, 6, 236–255. [Google Scholar]
- Liu, W.; Chen, W.; Dong, C. Spatial decay of recreational services of urban parks: Characteristics and influencing factors. Urban For. Urban Green. 2017, 25, 130–138. [Google Scholar] [CrossRef]
- Xu, M.; Xin, J.; Su, S.; Weng, M.; Cai, Z. Social inequalities of park accessibility in Shenzhen, China: The role of park quality, transport modes, and hierarchical socioeconomic characteristics. J. Transp. Geogr. 2017, 62, 38–50. [Google Scholar] [CrossRef]
- Hess, P.; Moudon, A.; Snyder, M.; Stanilov, K. Site design and pedestrian travel. Transp. Res. Rec. 1999, 1674, 9–19. [Google Scholar] [CrossRef]
- Natsushi, O.A. Study on evaluation of green landscape-consideration on green evaluation method for good landscape formation. Res. Rep. 2006, 142, 4–13. [Google Scholar]
- Navickas, L.; Olszewska, A.; Mantadelis, T. CLASS: Contemplative landscape automated scoring system. In Proceedings of the 2016 24th Mediterranean Conference on Control and Automation (MED), Athens, Greece, 21–24 June 2016; pp. 1180–1185. [Google Scholar]
- Clifton, K.J.; Andrea, D.L.S.; Rodriguez, D. The development and testing of an audit for the pedestrian environment. Landsc. Urban Plan. 2007, 80, 95–110. [Google Scholar] [CrossRef]
- Pikora, T.J.; Bull, F.C.L.; Jamrozik, K.; Knuiman, M.; Giles-Corti, B.; Donovan, R.J. Developing a reliable audit instrument to measure the physical environment for physical activity. Am. J. Prev. Med. 2002, 23, 187–194. [Google Scholar] [CrossRef]
- Lee, T.; Jung, S.; Ha, J. Pedestrian environment evaluation for health-friendly apartment complexes: Focused on Busan. Archit. Res. 2015, 17, 93–99. [Google Scholar] [CrossRef]
- Lee, C.; Moudon, A.V. The 3Ds + R: Quantifying land use and urban form correlates of walking. Transp. Res. Part D Transp. Environ. 2006, 11, 204–215. [Google Scholar] [CrossRef]
- Rundle, A.G.; Bader, M.D.; Richards, C.A.; Neckerman, K.M.; Teitler, J.O. Using Google street view to audit neighborhood environments. Am. J. Prev. Med. 2011, 40, 94–100. [Google Scholar] [CrossRef]
- Yang, J.; Wu, H.; Zhen, Y. Research on characteristics and interactive mechanism of street walkability through multi-source big data: Nanjing central district as a case study. Int. Urban Plan. 2019, 34, 33–42. [Google Scholar]
- Location Search Service. Baidu Map API. 2020. Available online: http://lbsyun.baidu.com/index.php?title=webapi/guide/webservice-placeapi (accessed on 1 October 2017).
- Wang, F.; Chen, C.; Xiu, C.; Zhang, P. Location analysis of retail stores in Changchun, China: A street centrality perspective. Cities 2014, 41, 54–63. [Google Scholar] [CrossRef]
- Walking Algorithm of Baidu Map API. Baidu Map API. 2020. Available online: http://lbsyun.baidu.com/index.php?title=webapi/directionlite-v1 (accessed on 4 March 2020).
- Industry Classification of Baidu Map. Baidu Map API. 2020. Available online: http://lbsyun.baidu.com/index.php?title=lbscloud/poitags (accessed on 11 May 2020).
- Oh, K.; Jeong, S. Assessing the spatial distribution of urban parks using GIS. Landsc. Urban Plan. 2007, 82, 25–32. [Google Scholar] [CrossRef]
- Scoppa, M.; Bawazir, K.; Alawadi, K. Walking the superblocks: Street layout efficiency and the Sikkak system in Abu Dhabi. Sustain. Cities Soc. 2018, 38, 359–369. [Google Scholar] [CrossRef]
- Stangl, P. The pedestrian route directness test: A new level-of-service model. Urban Des. Int. 2012, 17, 228–238. [Google Scholar] [CrossRef]
- Zijlstra, E.; Hagedoorn, M.; Krijnen, W.P.; van der Schans, C.P.; Mobach, M.P. Route complexity and simulated physical ageing negatively influence wayfinding. Appl. Ergon. 2016, 56, 62–67. [Google Scholar] [CrossRef]
- Jiao, J.; Chen, Y.; He, N. Plan pedestrian friendly environments around subway stations: Lessons from Shanghai, China. J. Urban Des. 2017, 22, 796–811. [Google Scholar] [CrossRef]
- Jane, J. The Death and Life of Great American Cities, 2nd ed.; Randon House Trade Publishing: New York, NY, USA, 2006; pp. 25–78. [Google Scholar]
- Koji, A. Relationship between the expansion of the field of view and the amount of green. Gard. Mag. 1987, 51, 1–10. [Google Scholar]
- Introduction to Baidu Image Recognition. Baidu AI Open Platform. 2020. Available online: https://cloud.baidu.com/doc/IMAGERECOGNITION/s/Kk3bcxbxj (accessed on 14 April 2020).
- Xu, Z.; Xu, Q.; Wang, Y.; Zhang, J.; Liu, J.; Xu, F. Association of sedentary behavior and depression among college students majoring in design. Int. J. Environ. Res. Public Health 2020, 17, 3545. [Google Scholar] [CrossRef] [PubMed]
- Giles-Corti, B.; Donovan, R.J. The relative influence of individual, social and physical environment determinants of physical activity. Soc. Sci. Med. 2002, 54, 1793–1812. [Google Scholar] [CrossRef]
- Troped, P.J.; Cromley, E.K.; Fragala, M.S.; Melly, S.J.; Brownson, R.C. Development and reliability and validity testing of an audit tool for trail/path characteristics: The path environment audit tool (PEAT). J. Phys. Act. Health 2006, 3, S158–S175. [Google Scholar] [CrossRef]
- Xu, Z.; Wang, Y.; Xu, Q.; Han, L.; Xu, F. Comparative research of audit tools on built environment for active living. Landsc. Archit. Front. 2020, 8, 52–73. [Google Scholar] [CrossRef]


| Index | Definition | Comment |
|---|---|---|
| Service POIs | The number of residential building POIs within pedestrian shed of the whole park or a specific entrance (Figure 1). | Describes the amount of residential buildings that the park (or its entrances) can serve [23]. |
| Service area | The total area of communities within the pedestrian shed of the whole park or a specific entrance (Figure 1). | Describes the area that Xuanwu Lake Park (or its entrances) can serve [38]. |
| Service population | The population within serviced communities. | Describe how many residents Xuanwu Lake Park (or its entrances) can serve [38]. |
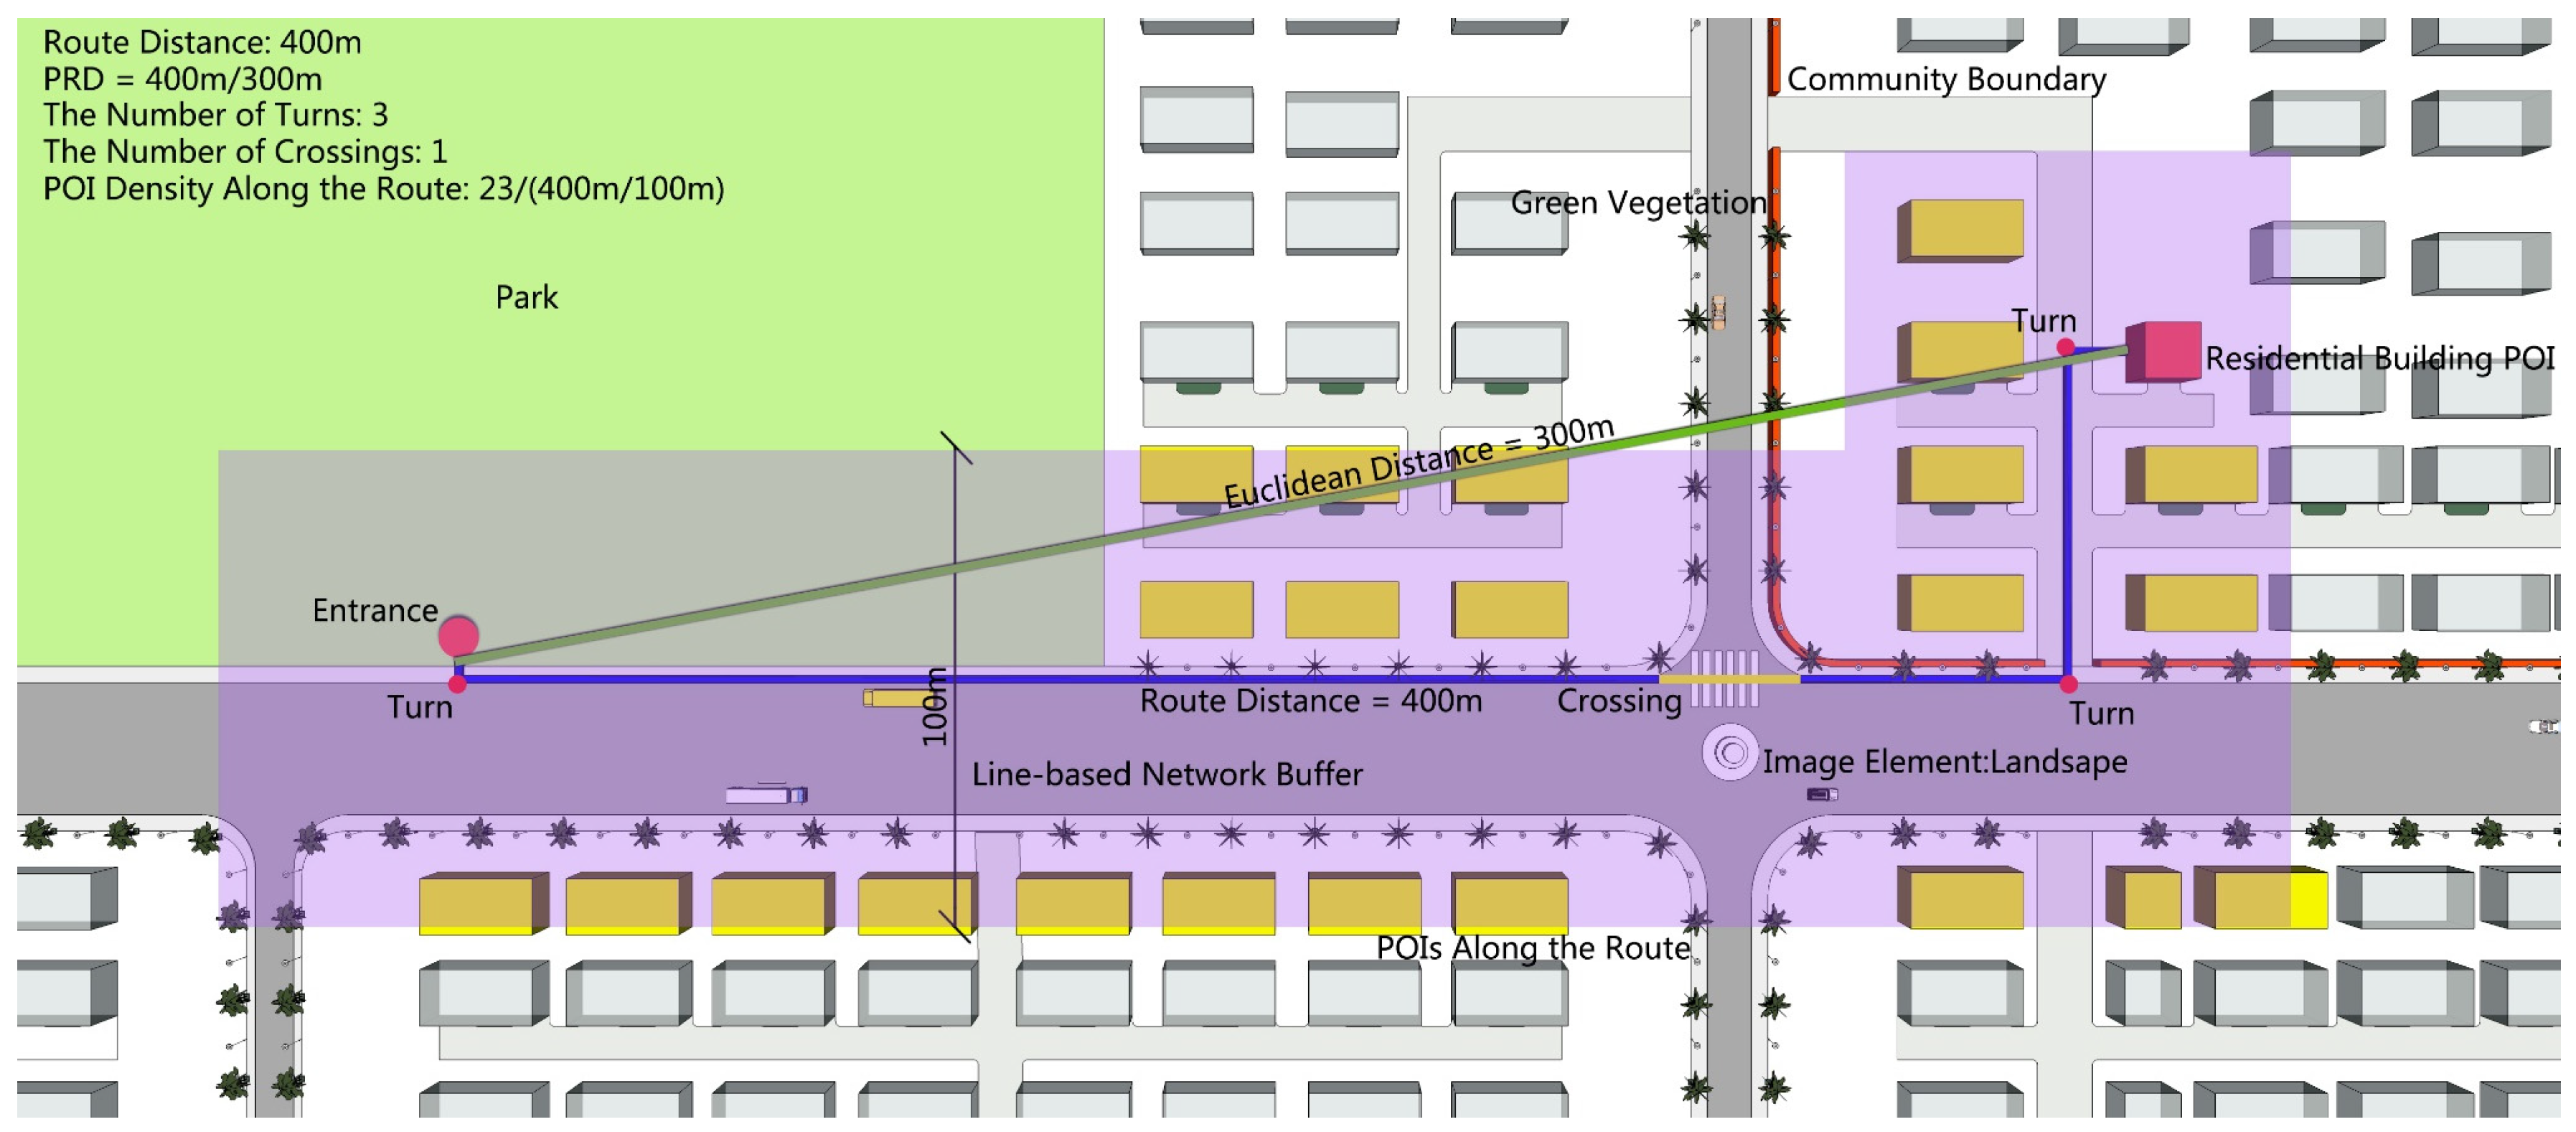
| Route distance | Distance of the route from residential building POIs to a park entrance (Figure 2). | Describes the distance of walking routes based on Baidu Map. These routes were derived from the travel navigation function of Baidu Map, and were the shortest routes in the walking algorithm of the Baidu Map API [36]. |
| Pedestrian route directness (PRD) | The ratio of route distance to Euclidean distance (always greater than or equal to 1), reflects the degree of pedestrian route directness (Figure 2). | When the block scale is suitable and the road network is porous, the PRD is relatively low. In some western cities, the PRD in well-connected grid areas is generally less than 1.3. The sectors with low pedestrian permeability (more significant than 1.6) tend to be suburbs dominated by end roads [25,39]. The higher the PRD of a route, the more turns it has; however, the two are not linearly correlated [40]. |
| The number of turns | The number of turns along a walking route (Figure 2). | To reflect the smoothness of walking, the number of times pedestrians need to turn to cope with the road conditions. This affects the wayfinding performance of people [41]. After a ground survey, the number of turns were found to be consistent with the actual direction changes. |
| The number of crossings | The number of crossings a walking route would traverse (Figure 2). | To reflect the smoothness of walking, the perceived safety of pedestrians, and the degree of traffic risk. Crossings mean to cross the road or sidewalk [42]. Considering the ground survey, the number of crossings were consistent with the actual crossing times of pedestrians. |
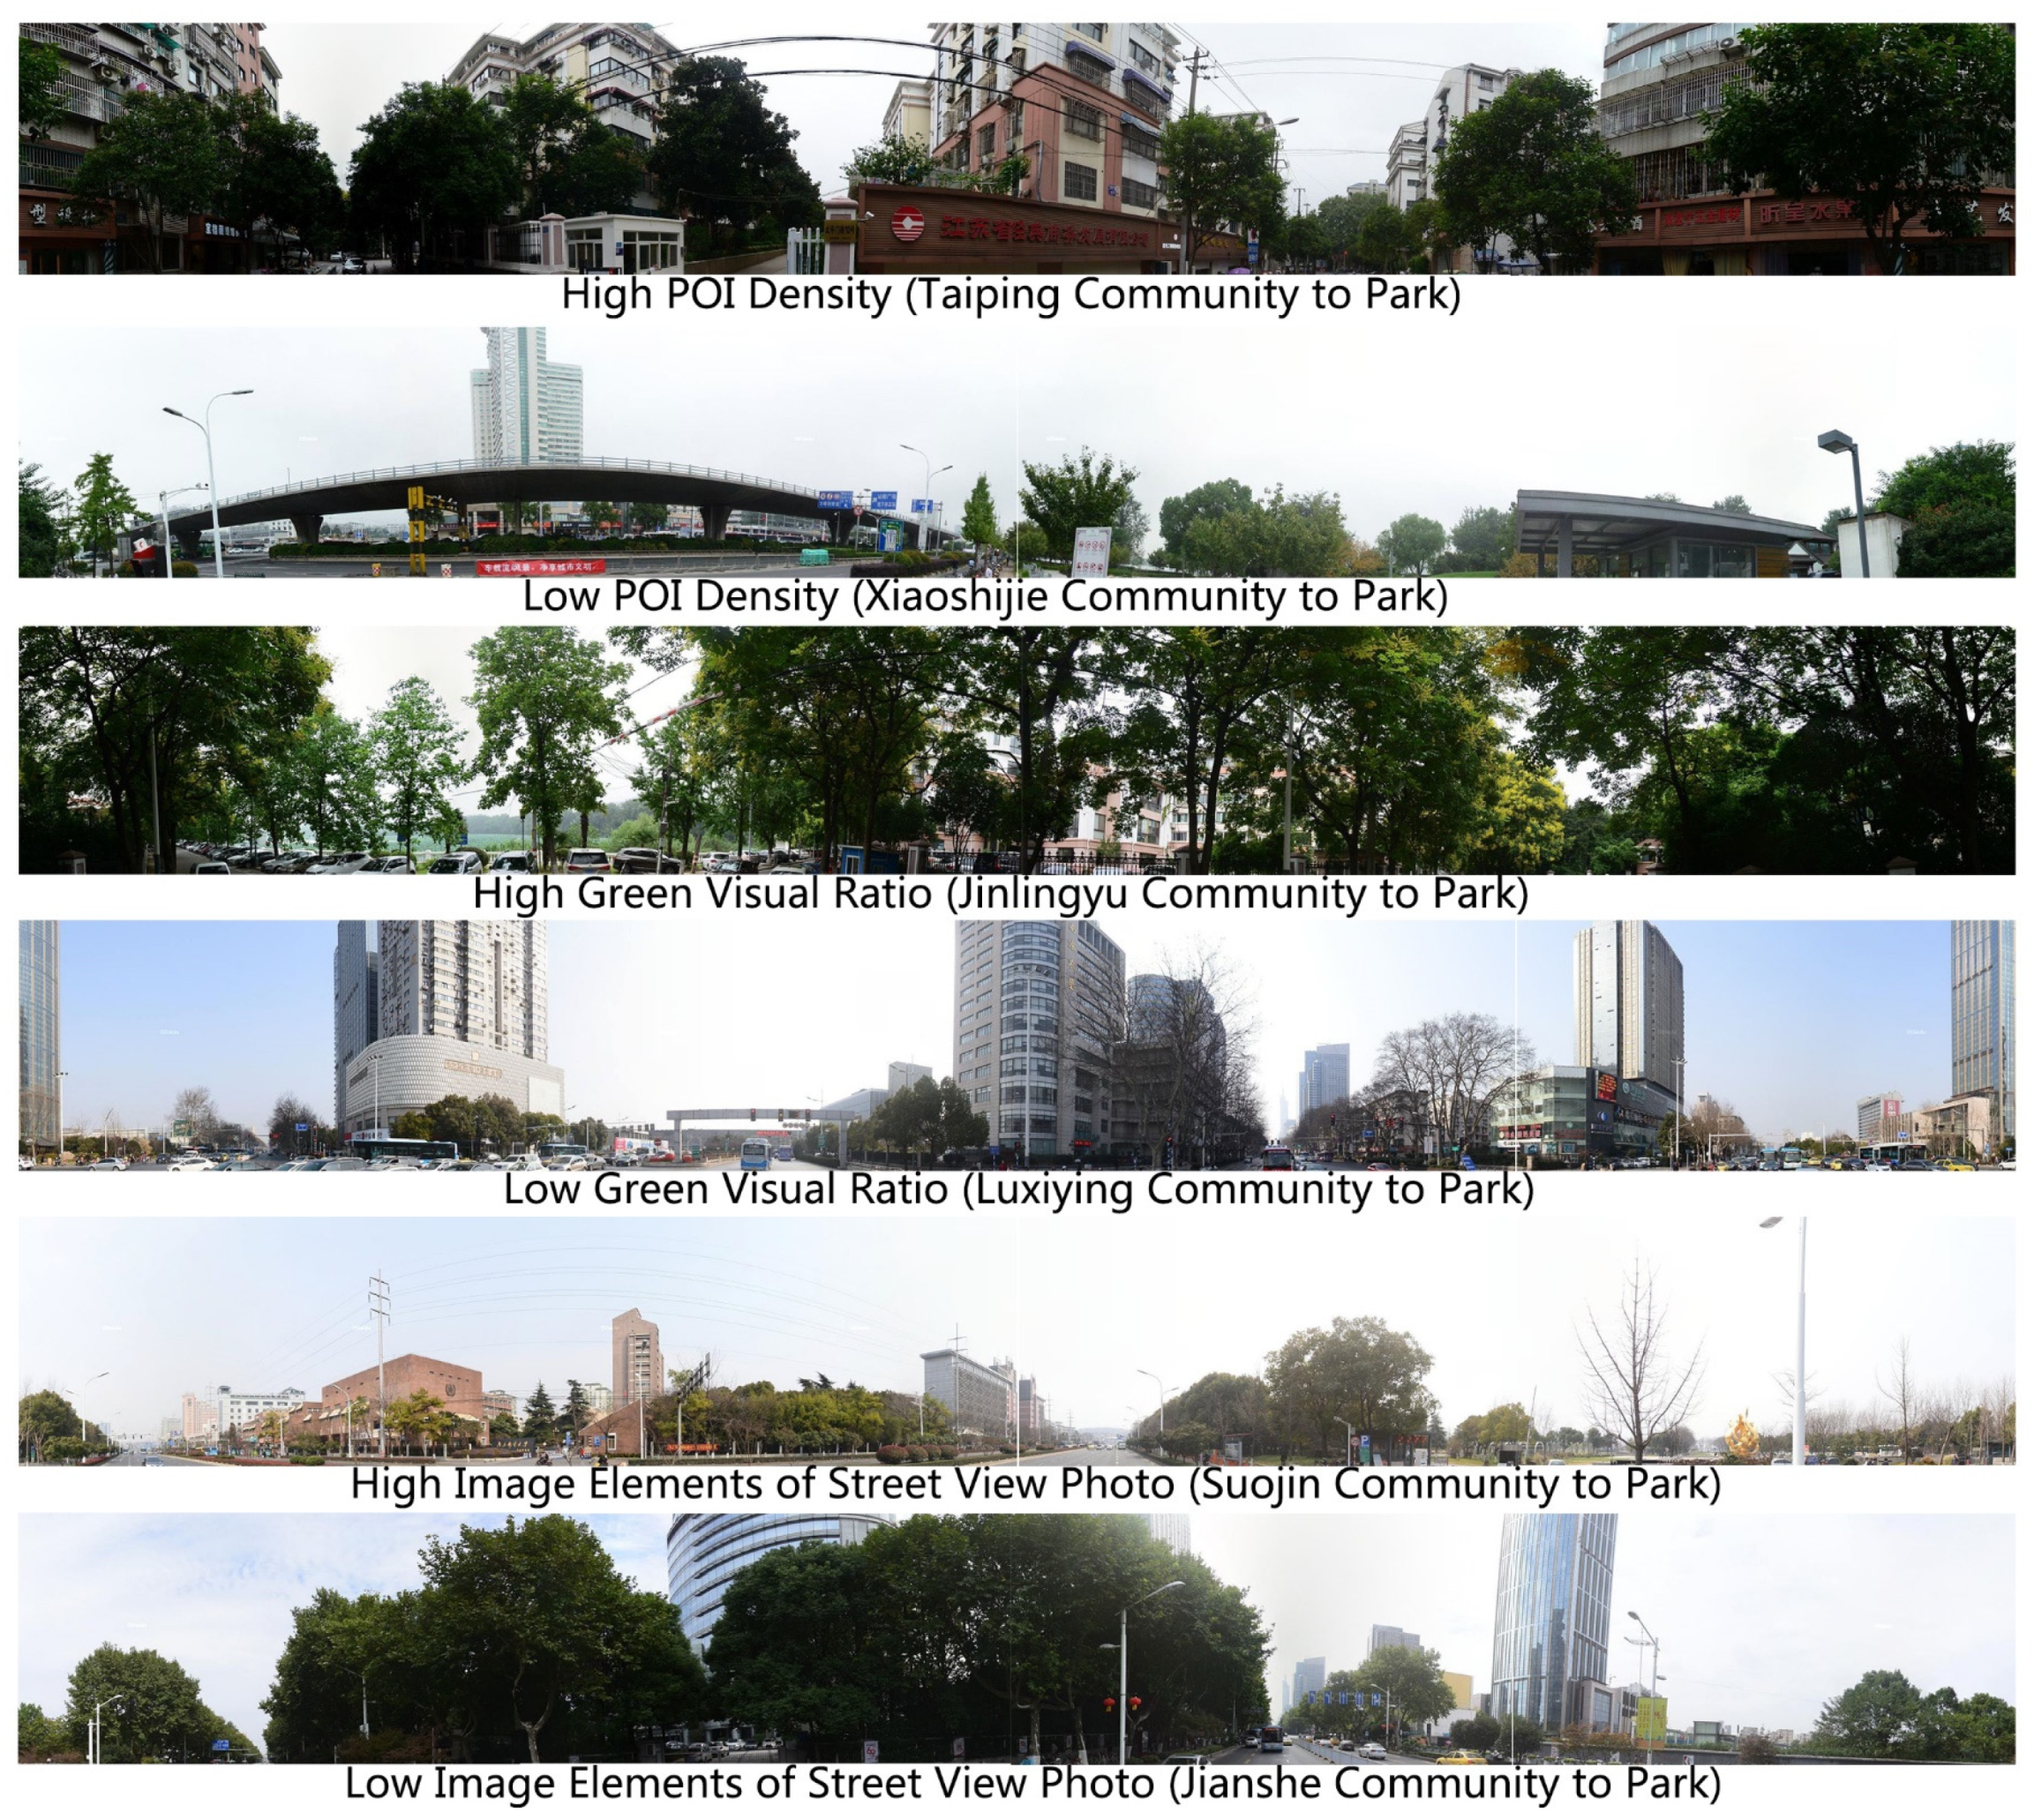
| POI density along the route | POI density along the route is measured by the ratio of the number of POIs in the 100 m line-based network buffer per 100 m distance (Figure 2). | In the walking route, the more POIs along the street, the higher the street safety and vitality [43]. |
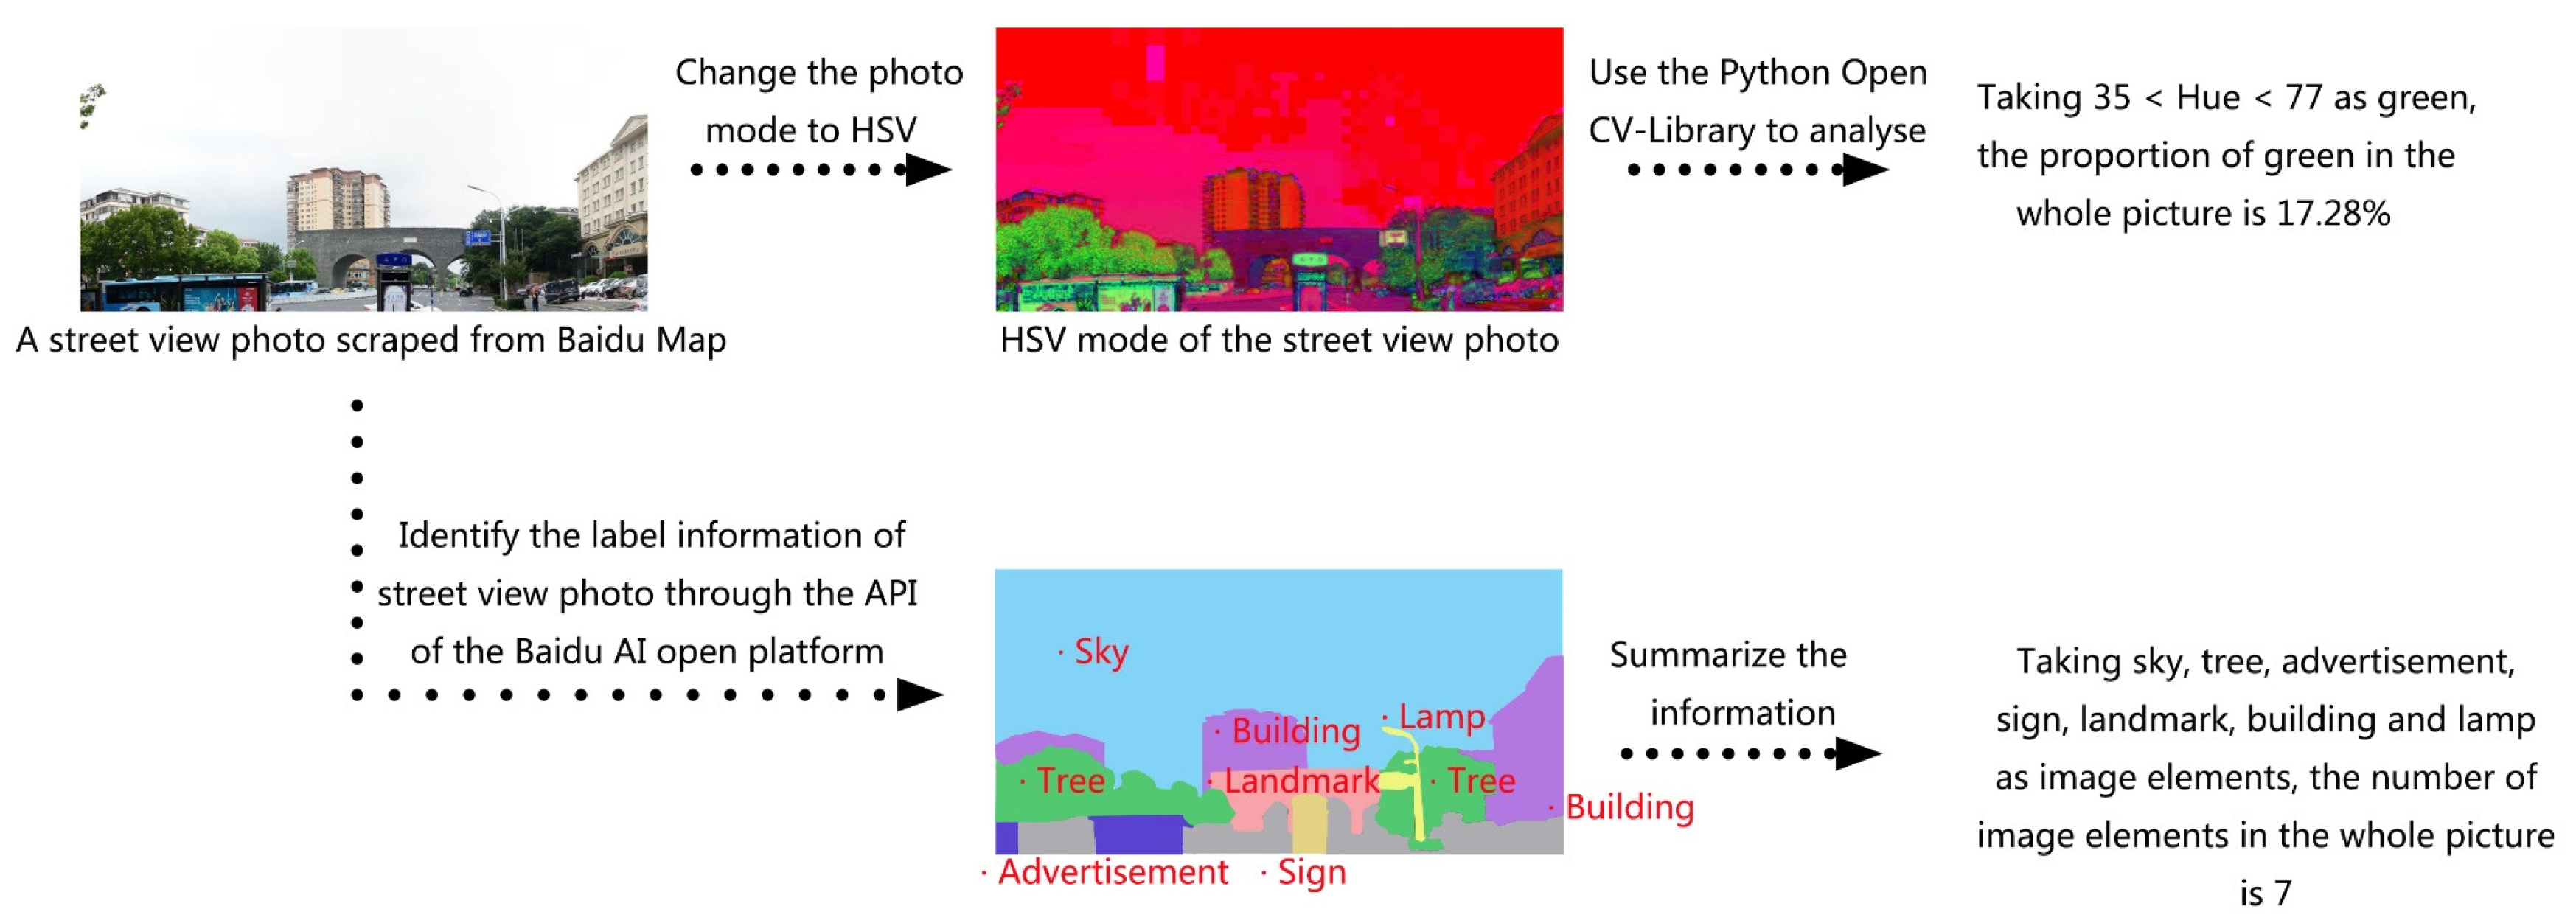
| Green visual ratio | The green visual ratio was obtained by analyzing the hue of street view photos through the Python OpenCV Library. The average value was taken as the green visual ratio of a route (Figure 3). | This refers to the proportion of green vegetation seen by pedestrians, which emphasizes the three-dimensional visual effect and represents a higher level of urban greening. When the green visual ratio is higher than 25%, people will feel better about the surrounding environment. When it is less than 15%, people’s perception of green quantity is poor [26,44]. |
| Image elements of street view photo | Scenery such as sky, buildings, water, landmarks, natural scenery, railings, seats, street lamps, signs, and so on, are classified as image elements by identifying the label information of street view photos through the API of the Baidu AI Open Platform [45]. In a route, the ratio of total image elements to the number of street view photos was taken as the image elements of street view photo (Figure 3). | In the walking route, the landscape (such as sky, trees, and landmarks) and facilities (such as railings, seats, and streetlights) can improve the pedestrian walking experience [27]. The more identifying tag elements, the more image elements there are suitable for walking. |
| Euclidean Distance Buffer Method | Route-Based Method | |||||||
|---|---|---|---|---|---|---|---|---|
| Distance | Service POIs | Service Area (ha) | Service Population | Average PRD | Service POIs | Service Area (ha) | Service Population | Average PRD |
| 500 m | 276 | 54.23 | 8960 | 1.96 | 153 | 23.93 | 4029 | 1.57 |
| 1000 m | 1148 | 379.59 | 87,505 | 1.58 | 664 | 206.88 | 44,540 | 1.56 |
© 2020 by the authors. Licensee MDPI, Basel, Switzerland. This article is an open access article distributed under the terms and conditions of the Creative Commons Attribution (CC BY) license (http://creativecommons.org/licenses/by/4.0/).
Share and Cite
Zhou, Z.; Xu, Z. Detecting the Pedestrian Shed and Walking Route Environment of Urban Parks with Open-Source Data: A Case Study in Nanjing, China. Int. J. Environ. Res. Public Health 2020, 17, 4826. https://doi.org/10.3390/ijerph17134826
Zhou Z, Xu Z. Detecting the Pedestrian Shed and Walking Route Environment of Urban Parks with Open-Source Data: A Case Study in Nanjing, China. International Journal of Environmental Research and Public Health. 2020; 17(13):4826. https://doi.org/10.3390/ijerph17134826
Chicago/Turabian StyleZhou, Zhenqi, and Zhen Xu. 2020. "Detecting the Pedestrian Shed and Walking Route Environment of Urban Parks with Open-Source Data: A Case Study in Nanjing, China" International Journal of Environmental Research and Public Health 17, no. 13: 4826. https://doi.org/10.3390/ijerph17134826
APA StyleZhou, Z., & Xu, Z. (2020). Detecting the Pedestrian Shed and Walking Route Environment of Urban Parks with Open-Source Data: A Case Study in Nanjing, China. International Journal of Environmental Research and Public Health, 17(13), 4826. https://doi.org/10.3390/ijerph17134826