Article

Urban Atmospheric Environment Quality Assessment by Naturally Growing Bryophytes in Central China

1
Key Laboratory of Arable Land Conservation (Middle and Lower Reaches of Yangtze River), Ministry of Agriculture, College of Resources and Environment, Huazhong Agricultural University, Wuhan 430070, China
2
College of Geography and Environmental Science, Northwest Normal University, Lanzhou 730070, China
3
Department of Soil Science, Faculty of Agricultural Sciences and Technology, Bahauddin Zakariya University, Multan 60080, Pakistan
*
Author to whom correspondence should be addressed.
Int. J. Environ. Res. Public Health 2020, 17(12), 4537; https://doi.org/10.3390/ijerph17124537
Submission received: 6 May 2020 / Revised: 30 May 2020 / Accepted: 9 June 2020 / Published: 24 June 2020
(This article belongs to the Section Environmental Health)

Abstract

:
Bryophytes are popular biomonitoring plants for atmospheric environments. The objectives of this study were to examine the characteristics of bryophyte communities, determine a suitable monitor species, and assess urban atmospheric environment quality by the joint use of bryophyte features and chemical properties in a large city in China. A pleurocarpous feather moss Haplocladium angustifolium was recognized as a good biomonitor of atmospheric deposition in central China by investigating bryophyte communities and habitat environment in various ecological function regions of the urban areas in Wuhan. The concentrations of trace elements, including As, Cd, Co, Cr, Cu, Mn, Ni, V, Pb, and Zn, in moss and soil samples from 25 sampling sites were analyzed by inductively coupled plasma mass spectrometry. The concentrations of Cd and Zn in Haplocladium angustifolium collected from the entire study area were much higher than those in substrate soil. Cd was at the highest ecological risk level among the 10 elements, which contributed 34.5% to the potential ecological risk index (RI). An RI value of 392.8 indicated that urban atmospheric quality in Wuhan was in a considerable potential ecological risk. The index of atmospheric purity, regarding species richness, cover, and frequency of bryophytes, was spatially and negatively correlated with RI, also demonstrated the atmospheric quality. Effective measures should be considered to alleviate certain airborne trace element contamination and protect the environment and human health in this metropolis.

1. Introduction

Atmospheric pollution due to population growth and shift, the increases in urbanization and industrialization, and the continuous increase of motorized transportation is one of the major problems in urban areas and is a source of great public concern regarding environmental and health consequences [1,2,3]. Various approaches and models for environmental assessment, particularly air quality assessment, such as sampling of bulk, dry, or wet deposition, and the measurement of living organisms including insects, birds, cryptogams (bryophytes and lichens), angiospermous leaves and barks, or gymnospermous needles, have been applied [4,5]. Bryophytes are popular indicator/monitor plants because they cause fewer technical and analytical problems than lichens or tree bark [6,7,8] and can be considered to be complementary to conventional bulk deposition analysis for addressing temporal and spatial patterns [9]. The investigation of naturally growing bryophytes in specific regions is appropriate for extensive monitoring studies [10,11] and for understanding the responses of bryophytes to atmospheric environmental heterogeneity [12]. However, atmospheric deposition of trace elements cannot be accurately estimated from the concentrations of trace elements in bryophyte tissues [9], and it is impossible to isolate their effects from those of other environmental variables [13].
When using naturally growing bryophytes as biomonitors, either the composition and structure of bryophyte communities (species richness, cover, and life forms) and the development of certain bryophytes is considered [14], or certain depositions, which are mainly trace elements, such as nitrogen and sulfur, are measured in such native moss species as Hypnum cupressiforme, Haplocladium microphyllum, Pleurozium schreberi, and Pseudocleropodium purum [6,15,16]. The types of moss species which could be selected for bioindication/biomonitoring and assessment of the environment of a certain area depend on not only their morphological and physicochemical characteristics, but also on their occurrence and abundance in the study region [17,18]. The structural and ecological characteristics responsible for the adaptation of bryophytes to an urban environment with open habitat and the existence of pollution are their high capacity for vegetative propagation and growth forms with short turfs, cushions, or mats [19,20].
Biomonitoring techniques by bryophytes have been widely employed worldwide, especially in Europe [21,22]. In China, mosses have been used as biomonitors to assess atmospheric quality in several studies and cities [23,24,25]. However, several cities in the process of rapid urbanization, such as Wuhan, have not been included. Considering the drawbacks of chemical analysis of atmospheric deposition, the joint use of bryophyte features and chemical properties via the index of atmospheric purity (IAP) method and accumulation of airborne pollutants, which has been applied only in few studies, was employed to evaluate an urban environment in this study [14,26]. The current study aimed (1) to examine the characteristics of bryophyte communities, and then to choose the most suitable indicator species in a large city (i.e., Wuhan) in central China, and (2) to assess the atmospheric environment in urban areas by using the bryophytes.

2. Materials and Methods

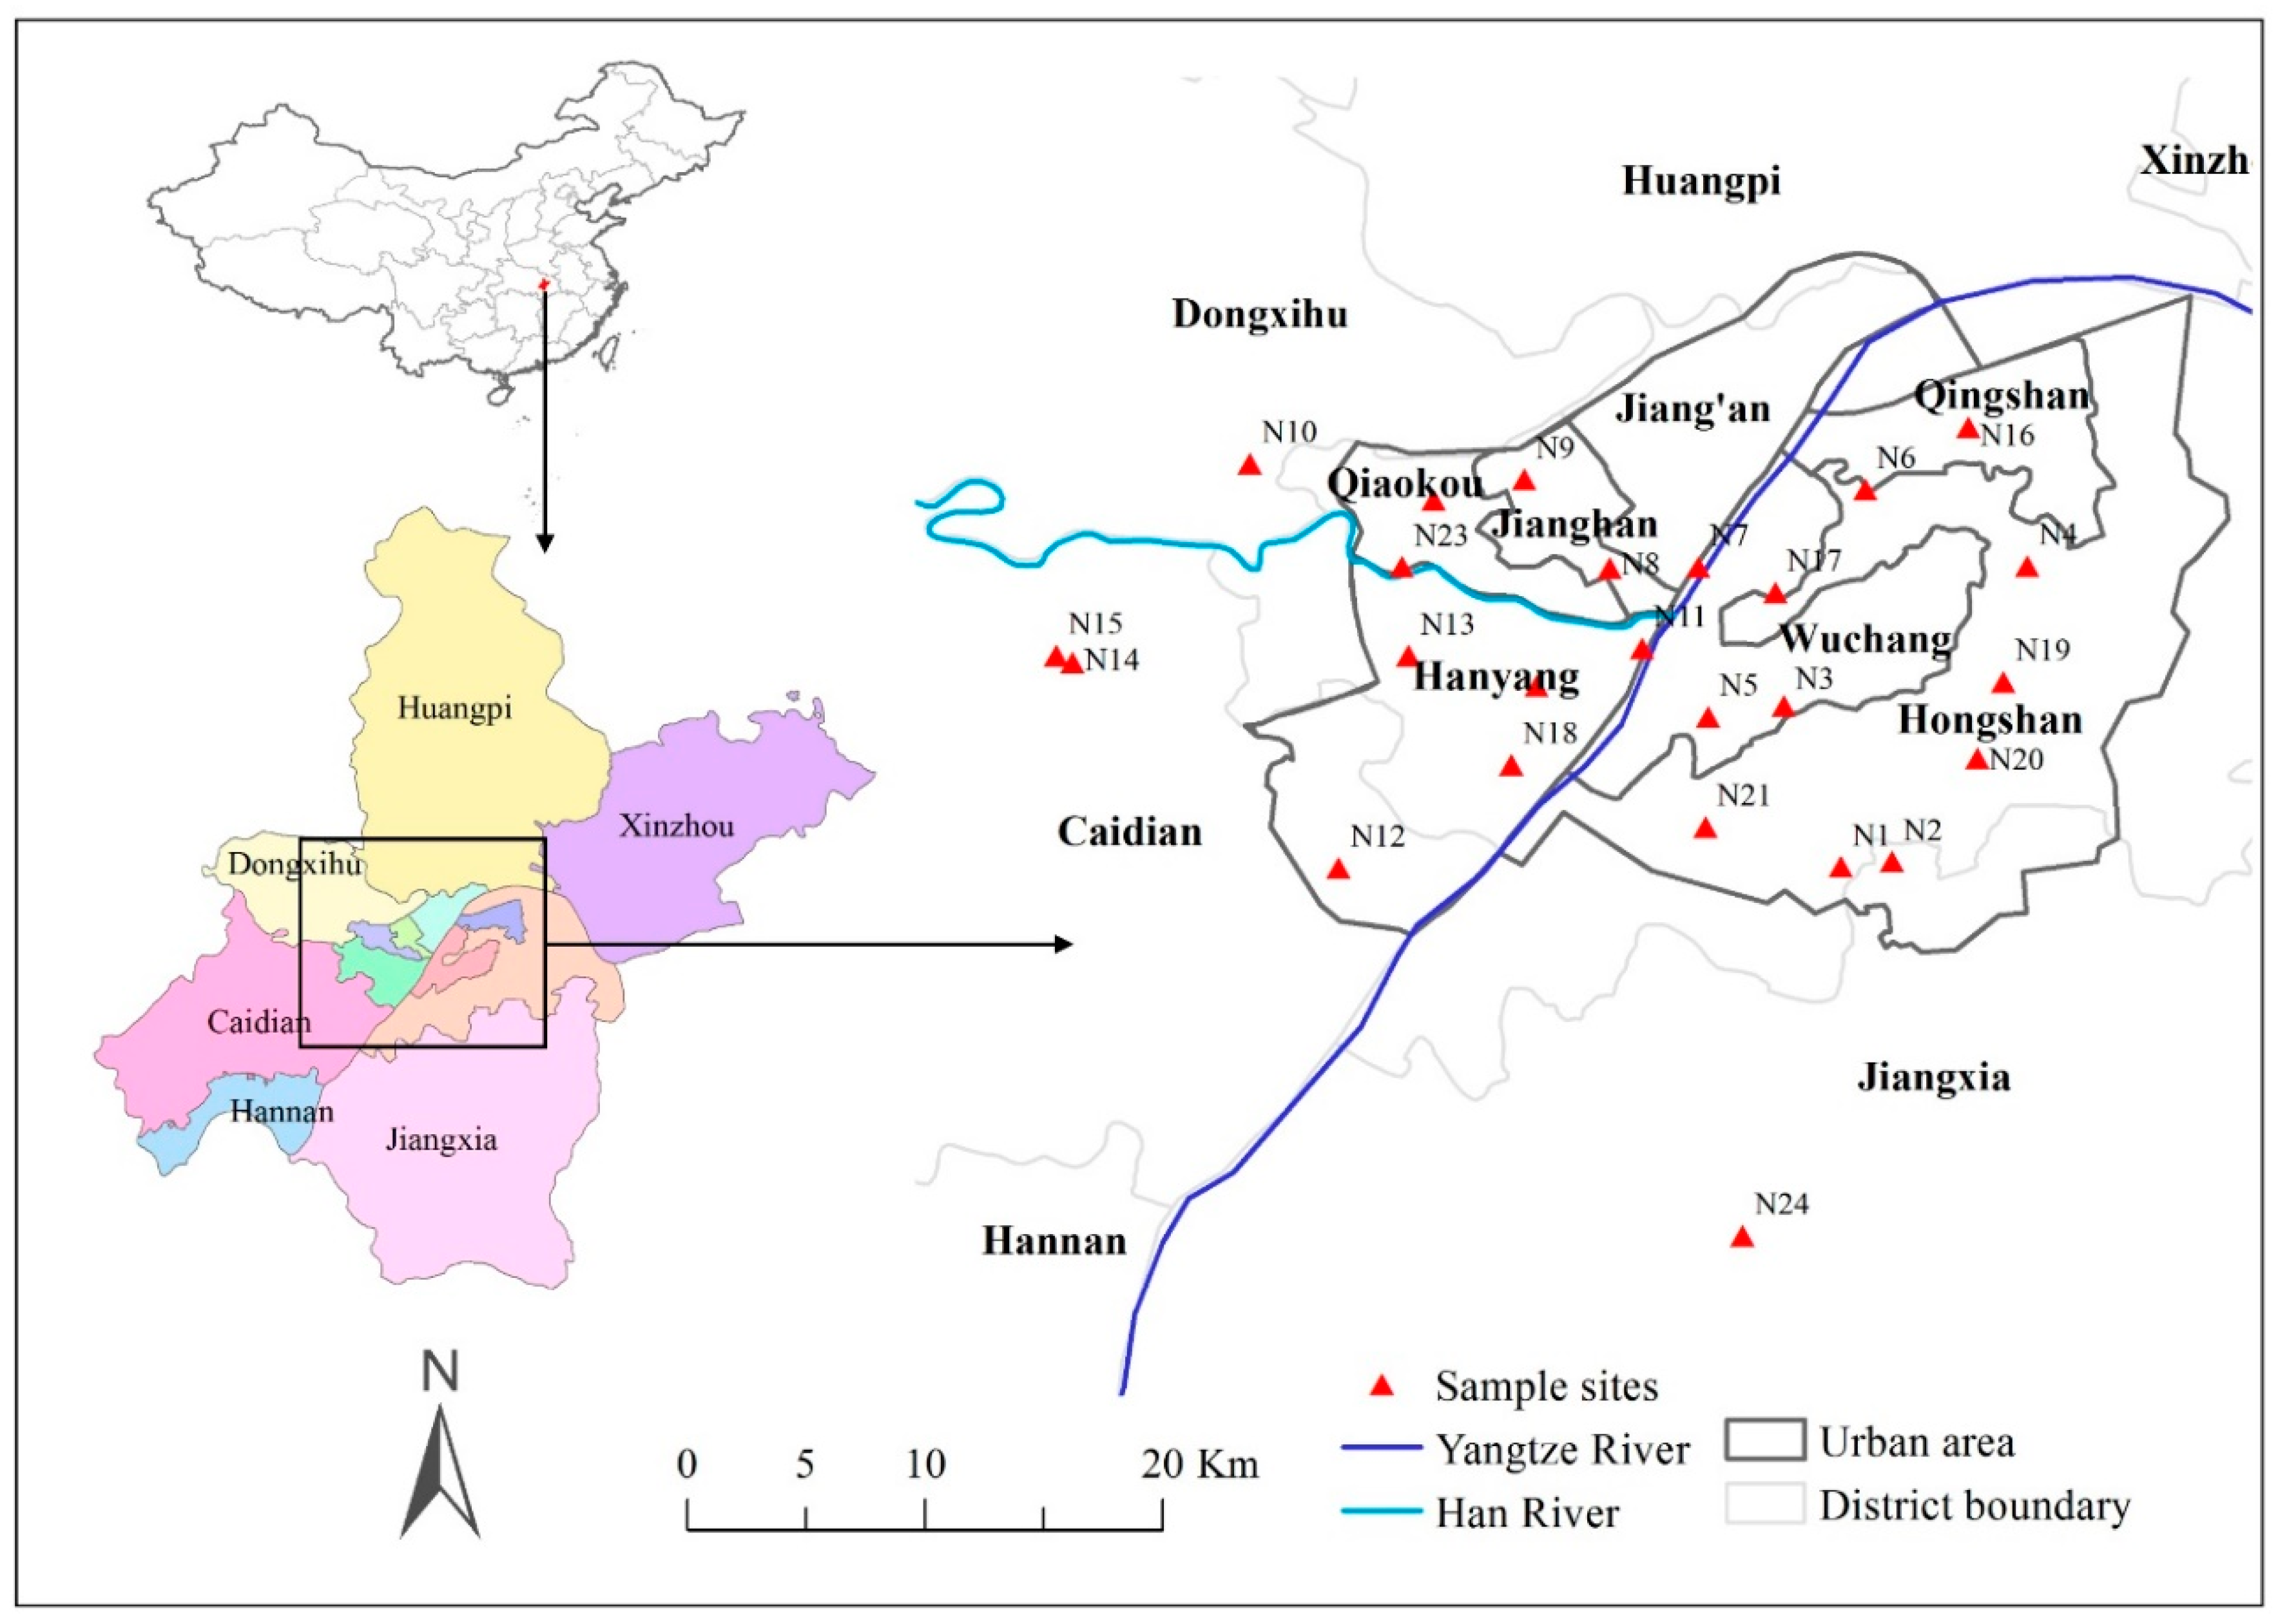
2.1. Study Area and Sampling

The study was conducted in the urban areas of Wuhan City, Hubei Province, China. Wuhan is a metropolis located at latitude 29° 58′–31° 22′ N and longitude 113° 41′–115° 05′ E. It is recognized as the main political, economic, financial, cultural, educational, and major transportation hub in central China, with a large population of 11.08 million. Abundant water bodies are distributed in the city and cover 26.1% of the city areas. Elevations of most city areas are below 50 m. The climate is characterized as subtropical, with distinct seasonal divisions, annual mean air temperature of 15.9 °C, and annual precipitation from 1100 mm to 1300 mm. As a major transportation hub, dozens of railways, roads, and expressways pass through Wuhan. Heavy industries, including steel works, chemical plants, and power plants, are also under development. Thus, the urban area of this city has mainly faced pollution from transportation and industry in recent decades.
Thirteen administrative divisions are included in Wuhan, of which seven divisions (i.e., Hanyang, Hongshan, Jiang’an, Jianghan, Qiaokou, Qingshan, and Wuchang) are considered urban areas (Figure 1). Twenty-five sites located within or nearby industry, transportation, university campus and residential areas were sampled on sunny days from September 2017 to November 2017. Detailed information of the 25 sampling sites, including locations and habitat environments, is displayed in Figure 1 and Table S1. At each sampling site, three 10 × 10 m sample plots were set, and then three to five 1 × 1 m were sampled in each sample plot where ground bryophytes occurred. These quadrats were at least 3 m away from the nearest tree in order to avoid the effects of the tree canopy. In each sample plot, trees with a diameter at breast height of more than 15 cm were investigated for epiphytic bryophytes, and three 10 × 10 cm quadrats at heights of 50, 80, and 130 cm for each tree were sampled from the single aspect with most bryophytes growing. The 1 × 1 m and 10 × 10 cm quadrats were divided into 100 equal squares to accurately measure the total coverage of the herb layer and the cover of individual bryophyte species. Coverage of tree canopy was calculated by visual estimation. The geographical location (longitude and latitude), altitude and the distance to the nearest roads of all sampling plots were also recorded. Bryophyte samples were collected by species for further classification and analyses, and underlying topsoil at a depth of 0–5 cm was also collected.
Bryophyte species were identified according to Flora Bryophytarum Sinicorum Vol.2–8 [27,28,29,30,31,32,33] and Flora Yunnanica Vol. 17 [34] in the laboratory. All specimens were stored at Huazhong Agricultural University. Soil samples for determining the soil water content were weighed before and after they were oven-dried at 105 °C to a constant weight. Samples for further chemical analyses were stored in plastic bags to avoid manual contamination.

2.2. Sample Preparation and Chemical Analysis

Moss samples (Haplocladium angustifolium, a dominant species with widespread distribution and high abundance) and soil samples were prepared for trace element analyses. Bryophyte samples (dominant species with widespread distribution and high abundance) were prepared by manually removing soil particles, dead materials, and litters. The green or greenish-brown parts of the bryophytes from dust particles were cleaned with deionized water. The bryophyte and soil samples were dried to a constant weight in a thermostatic drying machine for 48 h at 40 °C. The bryophytes were then ground to acquire fine powder in a mill, and the soil samples were homogenized with a mortar and pestle after coarse materials were removed using a 2 mm sieve. Three replicate measurements per bryophyte and soil sample were kept in clean, dry paper bags for further analyses.
Approximately 0.5 g of each bryophyte sample was transferred into a digestion tube and cold digested with 10 mL of mixed acid (HNO3:H2O2 = 4:1), and 0.25 g of each soil sample was digested with 10 mL of mixed acid (HNO3:HCl:HF = 3:1:1) for 30 min and then moved to a microwave oven (Mars 6, CEM, Matthews, NC, USA) for enhanced digestion until transparent solutions were obtained. After cooling, the digests were transferred to a 50 mL volumetric flask. The bryophyte was then filled with deionized water to 25 mL and soil to 50 mL. The presence and concentrations of trace elements were determined by inductively coupled plasma mass spectrometry (ICP-MS, Flexar LC-NexION 350X, PerkinElmer, Shelton CT, USA). The concentration of each element was corrected by subtracting blank values. A blank and a plant standard GBW07603 (GSW-2, IGGE, Langfang, China) or a soil standard GBW07403 (GSS-3, IGGE, Langfang, China) were analyzed to check the accuracy and precision of each element analysis. The recovery percentages of elements were >85% for quantitative analysis. All the detailed procedures of samples preparation and chemical analyses were referred to our previous study [35].

2.3. Data Analyses

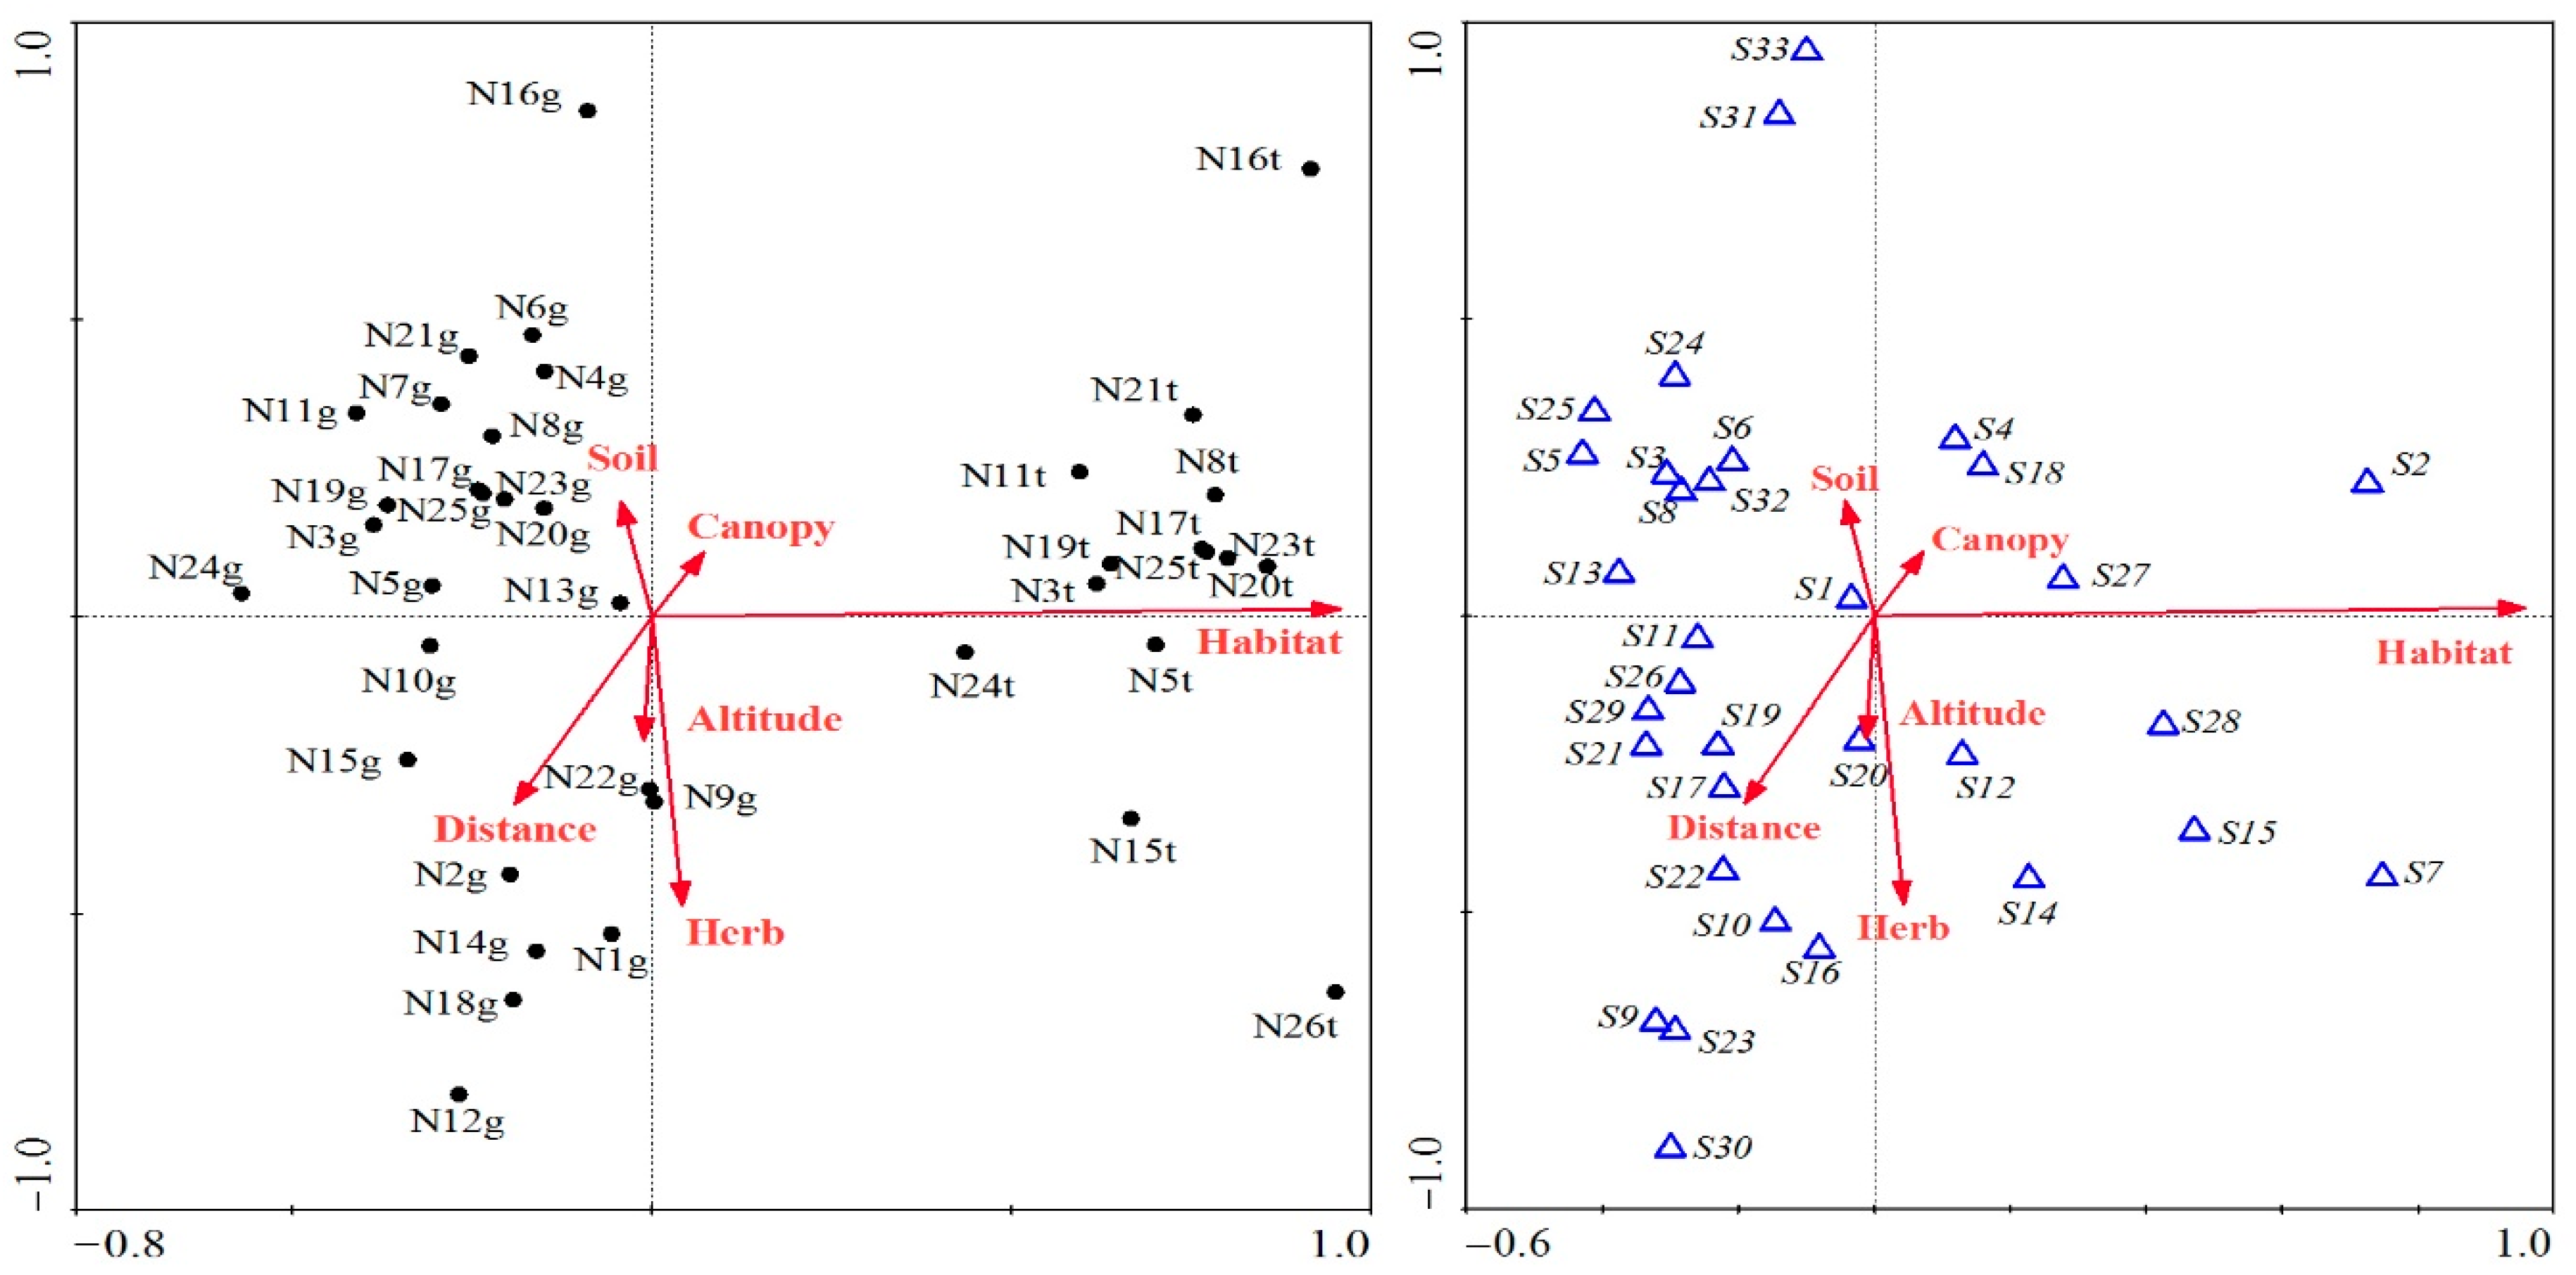
2.3.1. Diversity and Ordination Analyses for Bryophyte Species

The dominance of species in the study area was decided by the importance value, and a high importance value denotes the dominance of a species.
Importance value = (relative cover + relative frequency)/2,
where frequency is calculated according to (sites of with bryophytes / total investigated sites).
Bryophyte α-diversity, characterized by Shannon–Wiener index, was calculated by the following equations:
Shannon Wiener index :   H = i = 1 S ( P i lnP i ) ,
where S is the total number of species, that is, the species richness recorded at a specific sampling site. Pi = Ni/N, where Ni is the relative cover of species i, and N is the sum of the relative covers of S species.
Species distribution and environmental factors (soil water content, coverage of tree canopy and herb layer, habitat type, distance to the nearest roads, altitude) relationships were characterized by canonical correspondence analysis (CCA). Suitable biomonitoring species for tracing atmospheric trace elements were identified in this study on the basis of having high cover, frequency and importance value, and being widely distributed as recognized by CCA. CCA and the corresponding 2-dimensional ordination graphs were implemented in software CANOCO for Windows 4.5 (Microcomputer Power, Ithaca, NY, USA).

2.3.2. Atmospheric Environment Assessment

The IAP [36] based on bryophyte species richness, cover, and frequency is an important approach for assessing atmospheric environments and is measured using the following equation:
IAP = i = 1 s ( Q i × f i ) ,
where s is the species richness at each sampling site; Q is an ecological index, which refers to the mean species richness of all sampled sites; and f is a comprehensive value of the cover and frequency of each bryophyte species, which was determined according to Gao and Cao [37].
The potential ecological risk index (RI), which reflects the potential ecological harm from a single metal and considers the integrated ecological effect of multiple elements [23,38], is another proposal for air quality assessment. The RI of multiple elements in a bryophyte sample was determined by
RI =   E r i = i m ( T r i × C f i )   ,
where E r i presents the potential ecological risk coefficient of element i; m is the number of elements analyzed in the sample (m = 10 in the present study); T r i is the toxic coefficient of a certain element; and C f i is the contamination coefficient of element i, that is, C f i = C i / C n i , where C i   is the measured concentration of element i, and C n i is the background value of element i. The toxic coefficients of the 10 elements (i.e., As, Cd, Co, Cr, Cu, Mn, Ni, Pb, V, and Zn) were 10, 30, 5, 2, 5, 1, 5, 5, 2, and 1, respectively [38,39]. The concentration of the corresponding element in moss sample from a clean site remote from urban Wuhan was considered to be the background level ( C n i ) [40]. The classification criteria for potential ecological risk level are shown in Table S2 [38]. Five levels were established: (I) low risk, RI < 150; (II) moderate risk, 150 ≤ RI < 300; (III) considerable risk, 300 ≤ RI < 600; (IV) high risk, 600 ≤ RI < 1200; and (V) extreme risk, RI ≥ 1200.

2.3.3. Statistical Analyses

The concentration values of trace elements from bryophyte and soil samples were given as minimum, maximum, mean, standard deviation (SD), and coefficient of variation (CV) for the 25 sampling sites. The statistical differences of each element concentration between the bryophyte and soil samples were determined by a paired-samples t test. The intercorrelations among site-specific elements, IAP and RI, were characterized by Pearson’s correlation analysis. The Shapiro–Wilk test of normality was conducted before parametric statistical analyses; the non-normal distribution dataset was transformed by log transformation.

3. Results

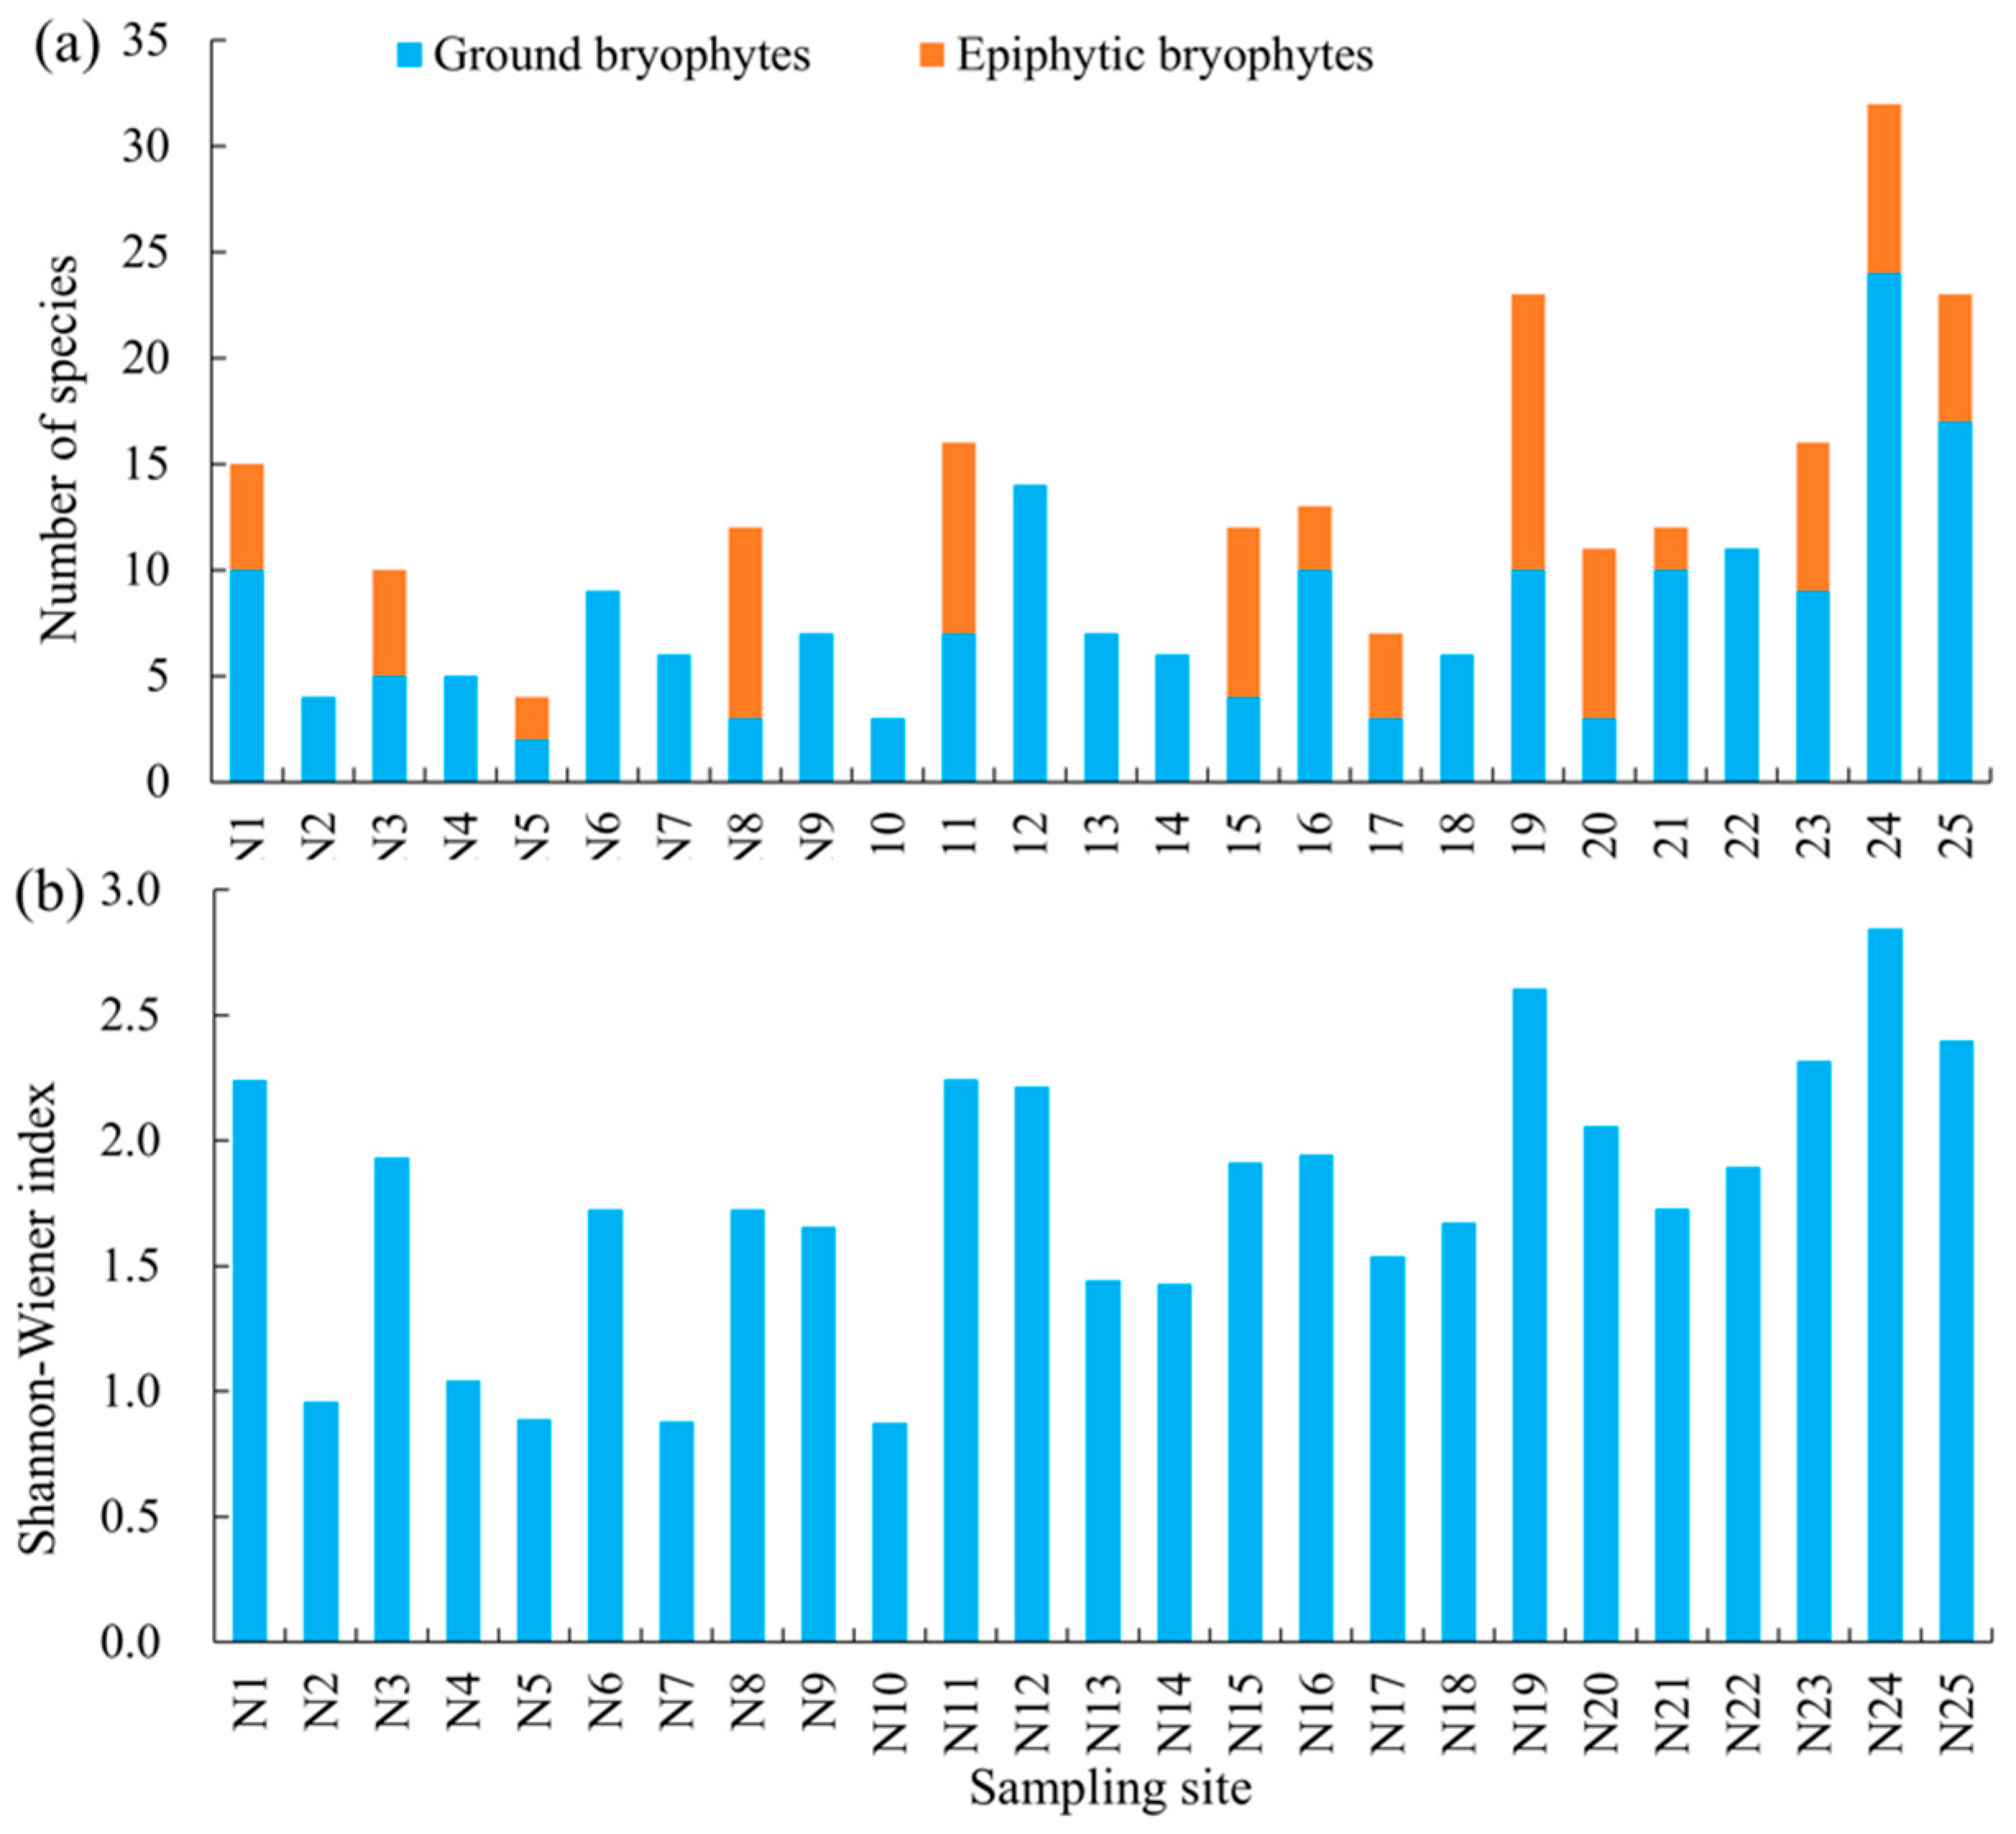
3.1. Diversity and Distribution of Bryophytes in the Urban Areas of Wuhan

At 25 sampling sites, 90 bryophyte species in 34 genera from 19 families were surveyed, with 67 species found on the ground and 44 species noted on the trunk of 61 trees. The families with the highest number of species present were Pottiaceae and Bryaceae, with almost one third of all surveyed species richness (Table S1). The species of the two families are small in size and have stems for erect growth forms, with a biomass relatively lower than that of creeping mosses.
Within the 25 sampling sites, no epiphytic bryophytes species were found in 11 sites, such as N2, N4, N9, and N10. By contrast, N19, N24, and N25 sites showed a larger number of ground and epiphytic bryophyte species than the other sites (Figure 2a). Eight sampling sites (N1, N11, N12, N19, N20, N23, N24, and N25) had a Shannon–Wiener index higher than 2 (Figure 2b).
The most dominant species with the highest importance value was H. angustifolium, which is a member of Thuidiaceae. This species has creeping main stems and pinnate branching systems, and the coverage and frequency were much higher than those of other species in the urban areas of Wuhan (Table 1). H. angustifolium (S1) seemed to have no preference and was distributed in all sampling sites, on the ground, and tree trunk (Figure 3). However, the epiphytic H. angustifolium was only found in six out of 14 sites. We selected H. angustifolium as a potential biomonitoring species in Wuhan and collected ground samples for elemental analyses.

3.2. Trace Elements Present in H. angustifolium and Underlying Soil

Trace elements in the samples of H. angustifolium and substrate soil were analyzed, as shown in Table 2. The element concentrations in H. angustifolium varied with the sampling sites, and the minimum and maximum values considerably differed (e.g., Co ranged from 1.27 mg kg−1 to 69.4 mg kg−1, and the coefficient of variation was even higher than 100%). The mean values of the trace element concentrations were in the following order: Mn > Zn > V > Cu > Cr > Pb > Ni > Co > As > Cd, with the Mn and Zn concentrations higher than 200 mg kg−1 and Cd levels lower than 1 mg kg−1. Although the concentrations of As and Cd were much lower than Mn and Zn, their contamination coefficients were much higher (10 and 30, respectively, versus 1); thus, they may be in a higher risk level. Comparatively, the concentrations of Cd and Zn in moss samples were significantly higher than those in soil samples (p < 0.01), whereas those of As, Cr, Mn, Pb, Ni, and V were significantly lower (p < 0.01). Among the 10 elements, the concentrations of As, Cd, Cu, Pb, and V in moss were significantly correlated with those in the substrate soil (r > 0.4, p < 0.05).
The intercorrelations of elements in H. angustifolium are presented in Table 3. As was highly significantly correlated with Co, Cr, and V; Co was highly significantly correlated with Cr, Mn, Ni, and V; Cr was highly significantly correlated with Mn and V; Mn was highly significantly correlated Ni; the correlation coefficients were higher than 0.7 (p < 0.01). Cd was significantly correlated with Pb and Zn; Cu was significantly correlated with Mn, Ni, Pb, V and Zn; Ni was significantly correlated with V; Pb was significantly correlated with Zn; the coefficient were higher than 0.44 (p < 0.05).

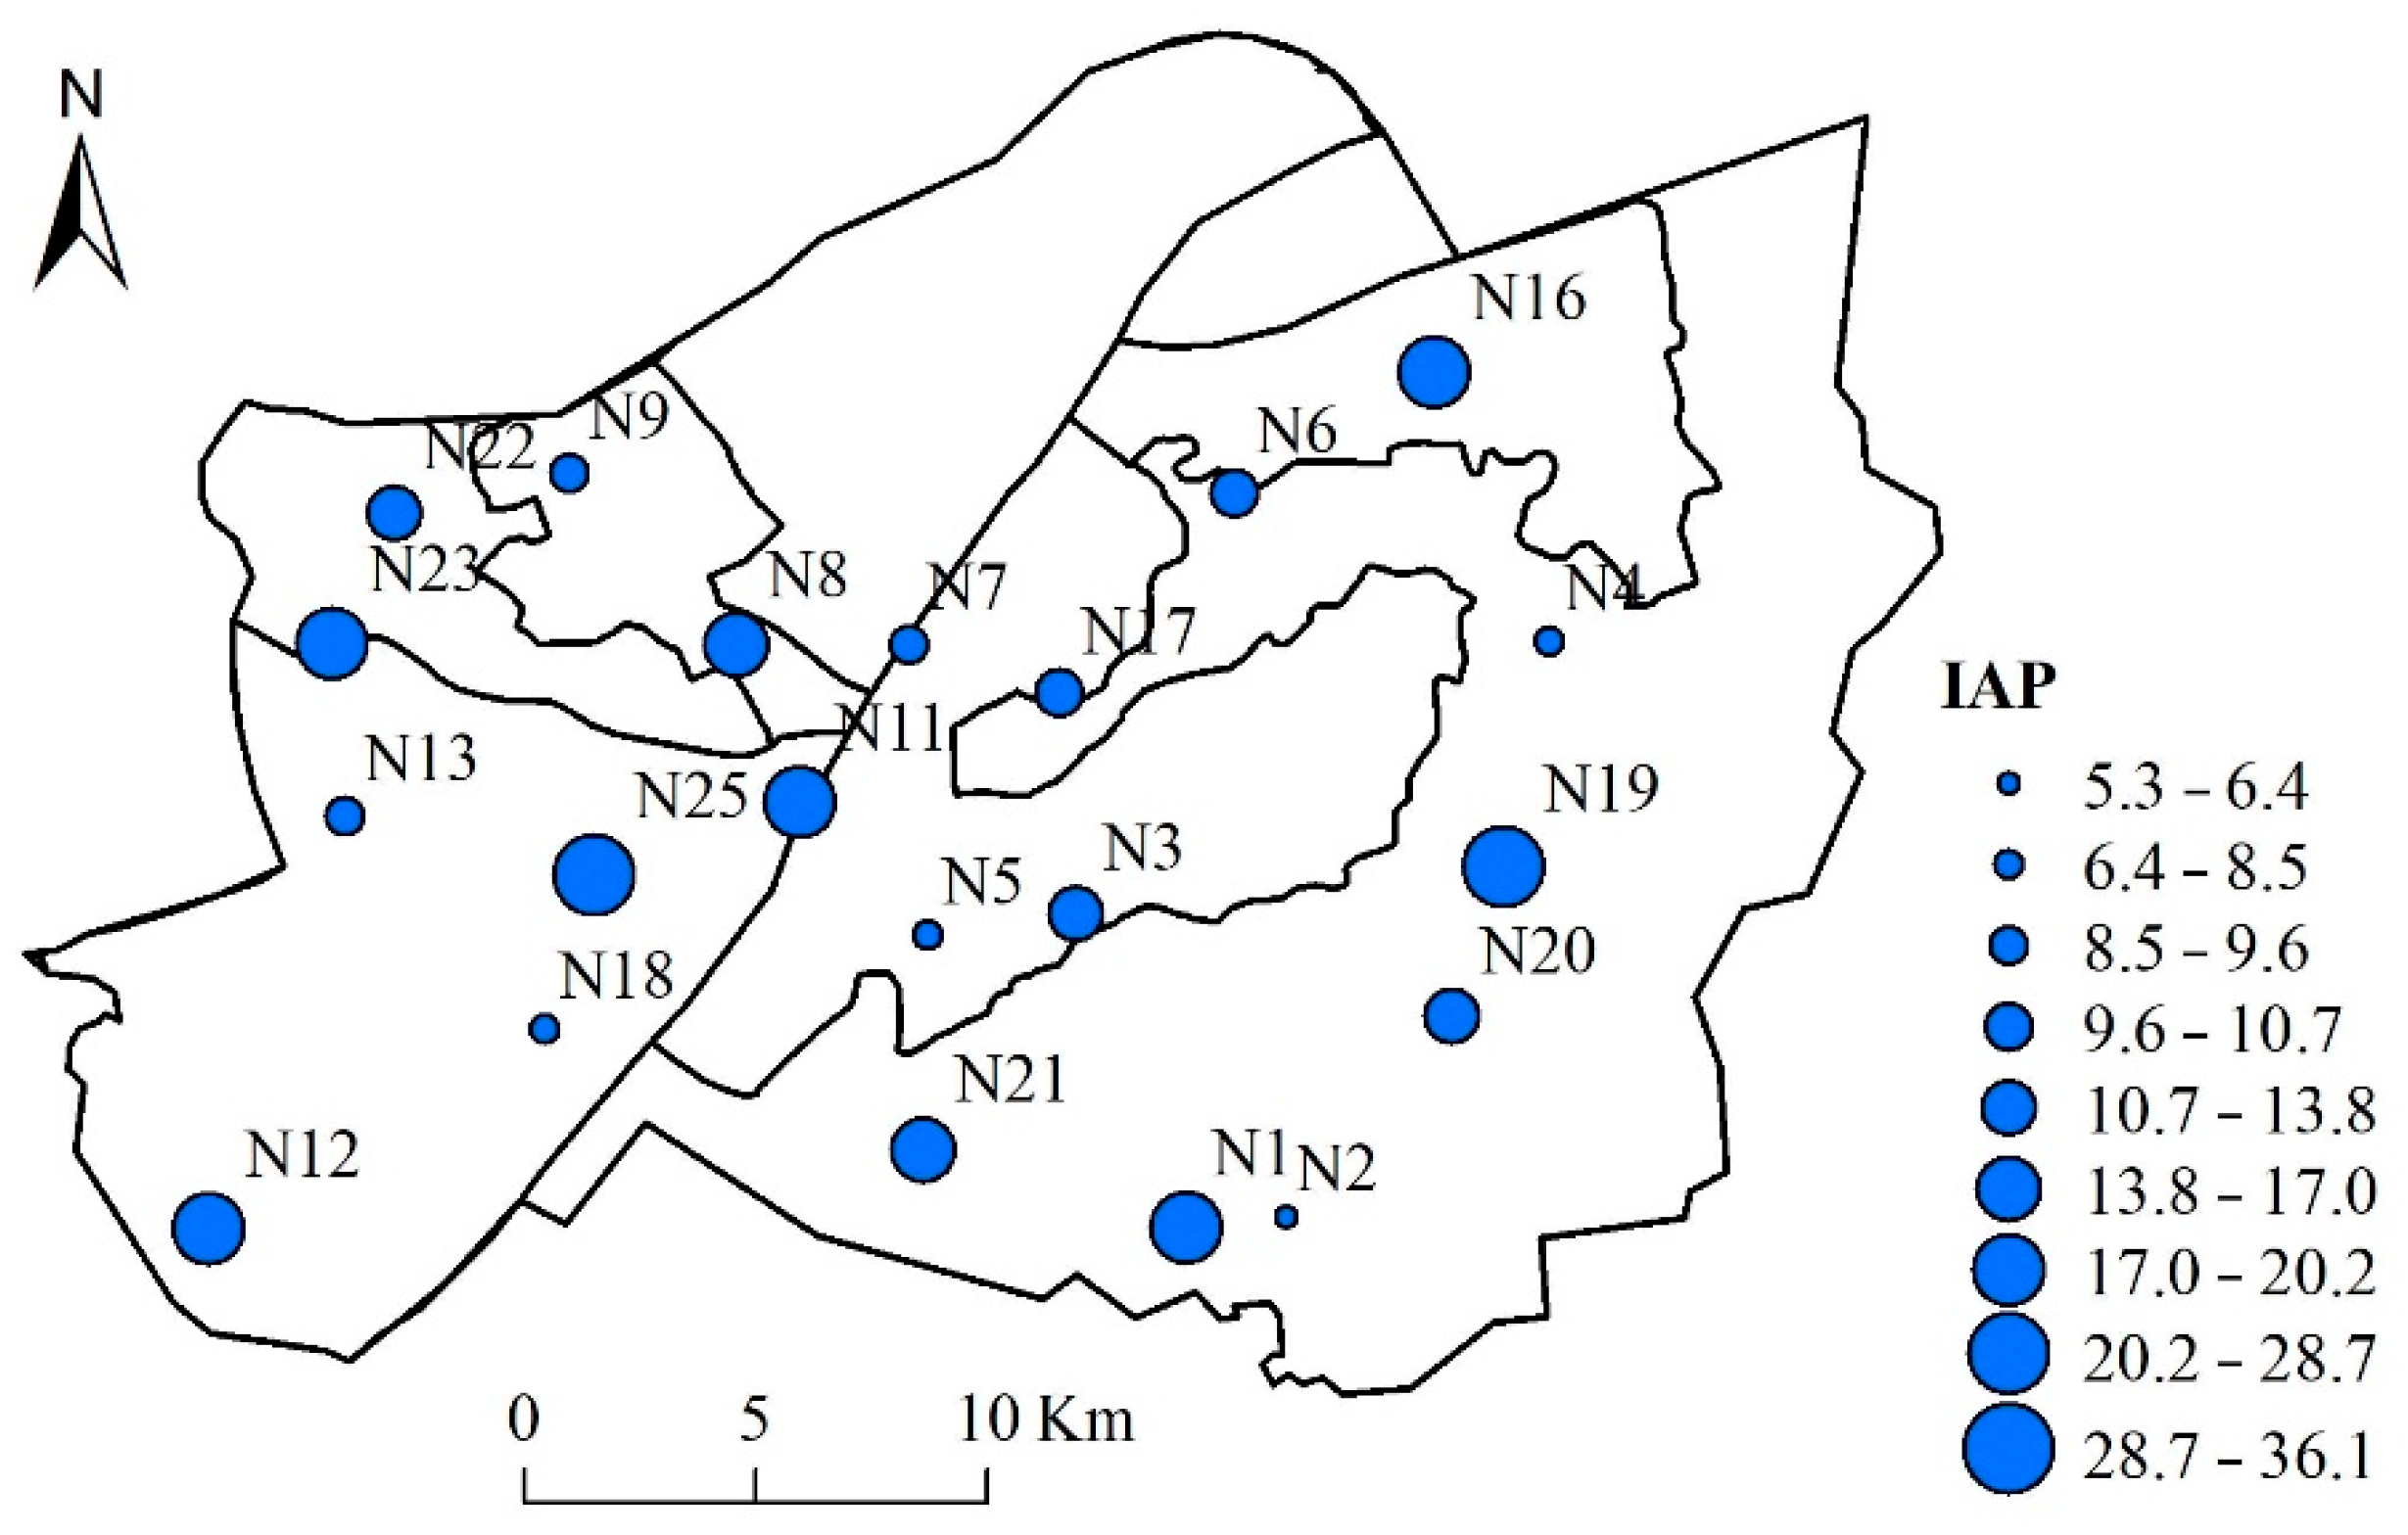
3.3. Assessment of Atmospheric Quality of the Urban Areas of Wuhan by IAP and RI through Bryophytes

Both IAP and RI were considered to assess the atmospheric environmental quality of urban Wuhan. As shown in Table 4, the mean values of E r i for the trace elements were ranked as follows: Cd > As > Co > Cu > Ni > Pb > Cr > V > Mn > Zn. Cd had the highest mean value of E r i (135.39), indicating considerable ecological risk, and contributed 34.5% to RI among all the elements. Additionally, As was also in considerable risk, while Co was in moderate ecological risk with an E r i higher than 40. The study region was generally under considerable ecological risk, with the RI range of 93.77~831.87, and an average RI value of 392.83, and 56.0% of the study sites belonging to the considerable ecological risk level (300 < RI ≤ 600). 28% of the study area belonged to the moderate ecological risk level (150 < RI ≤ 300), 12.0% of the study sites belonged to the high ecological risk level (600 < RI ≤ 1200), and only one site (N24) was under a low risk (RI ≤ 150).
The appearance of IAP was somewhat in accordance with the spatial variation of RI. Sampling sites N15, N16, N19, N24 and N25 were found to be under low or moderate ecological risk, but they showed high IAP values, higher than 19 (Figure 4), suggesting a significant negative relationship between RI and IAP, with a correlation coefficient of −0.43 (p < 0.05; Table 3). Negative correlations were also found between IAP and trace elements, such as As, Co, Cr, Mn, and V (r < −0.4, p < 0.05; Table 3).

4. Discussion

4.1. Suitable Bryophyte Species as Biomonitors in Central China

Terrestrial bryophytes have been widely used to monitor atmospheric depositions [12,41]. In this study, we suggested the combined usage of natural growing epigeic and epiphytic bryophytes to assess urban atmospheric environment. In addition to the bryophyte diversity in view of floristic composition and the presence and abundance of rare and significant taxa, the chemical analyses of certain bryophyte samples were also considered.
The major criteria for selecting a suitable species appear to be its widespread distribution and large abundance in the study region to ensure the availability of adequate material for capturing contaminants and chemical analyses for multiple sites [13,42]. However, a single unique species that is suitable for the biomonitoring of toxic element pollution worldwide has not been found yet [5]. Different moss species are used as biomonitors in different parts of the world. Hylocomium splendens, H. cupressiforme, and P. schreberi, particularly abundant in European countries, such as Italy, Kosovo, and Poland [10,17,43], have been most commonly used. H. angustifolium, a pleurocarpous feather moss, which demonstrates epigeic and epiphytic inhabitation in the study region, was used to evaluate the atmospheric environment in our study. This species is widely distributed in subtropical humid climate to warm temperate and semi-humid regions (from southern to central China) [44] and has been used for assessing atmospheric quality in several cities in China such as Guiyang, Shanghai, Wuhan, Wuxi, Xuzhou, and Taizhou [23,25,45].

4.2. Variations in Trace Element Accumulation in Moss Species

Mosses appear to be good biomonitors of atmospheric trace elements, such as Cd, Pb, Cu, V, and partially Zn [7]. In particular, the concentrations of Cd and Zn in moss species in our study region were significantly higher than those in soil, suggesting that H. angustifolium is a good biomonitor of certain elements. Mosses can be excellent biomonitors for certain elements, such as Cd or Pb, probably because these elements almost exclusively originate from the atmosphere [9]. The most important source of Cd and Pb in an urban environment is road transportation [46]. Pollution from industrial emissions is the main source of metal pollution in China [47]. In Wuhan, anthropogenic activities have an important impact on the accumulation of trace elements in soil; vehicular emissions, industrial activities, and household waste may be the three main sources of accumulated trace elements, and Cd may be the largest accumulated trace element in soil and soil pollution factor [48]. As also demonstrated by Gong et al. [47] in urban–rural topsoil in Wuhan, Cd, Cu, Hg, Pb, and Zn were mostly derived from anthropogenic inputs; Co, Cr, and Mn were controlled by natural sources; and Ni seemed to be affected by anthropogenic and natural sources.
Soil may be another source of trace elements accumulated in mosses. Although mosses do not take up substances directly from soil, local soil particles may strongly influence the chemical composition in mosses by blowing wind; the entrapped particles on the moss surfaces are then washed down and partly dissolved by precipitation, thereby enriching several elements in mosses [42,49]. Other factors, such as topography, rainfall, wind direction, and vegetation conditions, often influence the concentration of trace elements in mosses [50], thereby resulting in a spatial divergence in trace element distribution. For example, in two closed university sites, N1 and N2, in a South Lake neighborhood, differences were observed in bryophyte species richness and concentrations of most trace elements (e.g., Cd, Co, Cr, Mn, Ni, V, and Zn), probably in relation to the differences of microtopography, soil properties and vegetation conditions.
Several trace elements in moss samples showed significant correlations. For example, positive correlations between the concentrations of Cd and Pb in mosses were found in this study and in most European countries [10,51]; this finding was in agreement with the results of several investigations in other cities in China, such as Taizhou and Xuzhou [23,52]. These results suggested that these trace elements often appear simultaneously and may come from the same source of pollution.

4.3. Using IAP and RI to Assess Environmental Quality by Bryophytes

IAP, which was introduced by le Blanc and de Sloover [36], is one of the most popular indicators of atmospheric environments [14,53]. IAP was analyzed in terms of species richness, cover, and frequency, and it was highly consistent with the bryophyte α-diversity of the Shannon–Wiener index in the study. For instance, N1, N11, N12, N19, N23, N24, and N25 presented high values of IAP and Shannon–Wiener index. Bryophyte occurrence and coverage were significantly influenced by tree properties and vegetation type of the site [26]. Land use intensity, land cover types, and disturbance also affect bryophyte diversity through several different mechanisms, such as light levels and environmental heterogeneity [54]. The aforementioned sampling sites in the study area either possess a relatively high vegetation cover and/or with green hills and have a certain distance to the main road that reduces anthropogenic disturbances, thereby allowing the maintenance of abundant bryophytes and high IAP. Air pollution usually negatively influences the occurrence of sensitive bryophyte species and decreases IAP [26]. Not surprisingly, negative but not very strong correlations were found for IAP and several trace elements in this study.
Generally, RI was significantly negatively correlated with IAP for the study sites, the spatial variation in RI was somehow negatively in accordance with IAP. Unlike the diversity index IAP, RI evaluates the contamination levels of several trace elements’ composition in biomonitors. For the RI of soil trace elements, approximately 72.4% of the urban areas in Wuhan have reached the level of considerable potential ecological risk (300 ≤ RI < 600) [48]. Similarly, 56.0% of our study sites were assessed as being in the considerable potential ecological risk level. This ecological risk level was also comparable with that in Taizhou, a city in the east of China with heavy industrial activities [23]. As mentioned above, Cd was recognized as the largest soil pollution factor in Wuhan [48], and it was also strongly accumulated in moss and contributed highest to the integrated RI (29.4%). Therefore, Cd is a high-risk element that requires further attention. Apart from Cd, other trace elements, such as As and Co, also contributed a great deal to RI, thus requiring caution.

5. Conclusions

The use of the diversity of bryophytes and the accumulated trace elements in them in urban areas of Wuhan City exhibited a clear spatial pattern of bryophyte functional richness and the concentrations of 10 elements (As, Cd, Co, Cr, Cu, Mn, Ni, Pb, V, and Zn). Environmental heterogeneity greatly influenced the occurrence and abundance of bryophytes in terms of varied life forms, coverage, and IAP. Among all of the species in the urban areas, H. angustifolium, which is a pleurocarpous feather moss, appeared to be a good biomonitor of atmospheric quality in central China. The urban areas in Wuhan generally faced a considerable potential ecological risk level caused by atmospheric trace element pollution, and Cd exhibited the highest ecological risk level among the 10 elements. This study suggests that effective measures should be taken into consideration to alleviate certain trace element contamination in the atmosphere and reduce the ecological risk level of trace elements in this major metropolis.

Supplementary Materials

The following are available online at https://www.mdpi.com/1660-4601/17/12/4537/s1, Table S1: Description of sample sites in urban areas of Wuhan, China, Table S2: Classification standards of potential ecological risk indexes (RI), Table S3: Families with genus and species richness of bryophytes in urban areas of Wuhan.

Author Contributions

Conceptualization, Y.J. and Y.W.; Methodology and Project administration, X.Z. and M.F.; Investigation, Y.J. and J.Z.; Formal analysis, Y.J. and M.F.; Writing: Y.J., M.S. and R.H. All authors have read and agreed to the published version of the manuscript.

Funding

This work was supported by the National Key R&D Program of China (No. 2017YFD0202000), the Natural Science Foundation of Hubei Province (No. 2016CFB556), National Natural Science Foundation of China (No. 41701321).

Acknowledgments

We appreciate the helps of laboratory technicians in College of Resources and Environment, Huazhong Agricultural University. We also thank the two anonymous reviewers for their critical comments.

Conflicts of Interest

The authors declare that they have no known competing financial interests or personal relationships that could have appeared to influence the work reported in this paper.

References

  1. Klemm, R. Assessing the effects of air pollution on human health: Impacts of lagging pollutants. Epidemiology 2007, 18, S98. [Google Scholar] [CrossRef]
  2. Paoli, L.; Guttova, A.; Grassi, A.; Lackovicova, A.; Senko, D.; Loppi, S. Biological effects of airborne pollutants released during cement production assessed with lichens (SW Slovakia). Ecol. Indic. 2014, 40, 127–135. [Google Scholar] [CrossRef] [Green Version]
  3. Bokwa, A. Environmental impacts of long-term air pollution changes in Krakow, Poland. Pol. J. Environ. Stud. 2008, 17, 673–686. [Google Scholar]
  4. Cujic, M.; Dragovic, S.; Dordevic, M.; Dragovic, R.; Gajic, B. Environmental assessment of heavy metals around the largest coal fired power plant in Serbia. Catena 2016, 139, 44–52. [Google Scholar] [CrossRef]
  5. Stankovic, S.; Kalaba, P.; Stankovic, A.R. Biota as toxic metal indicators. Environ. Chem. Lett. 2014, 12, 63–84. [Google Scholar] [CrossRef]
  6. Pesch, R.; Schroeder, W. Mosses as bioindicators for metal accumulation: Statistical aggregation of measurement data to exposure indices. Ecol. Indic. 2006, 6, 137–152. [Google Scholar] [CrossRef]
  7. Szczepaniak, K.; Biziuk, M. Aspects of the biomonitoring studies using mosses and lichens as indicators of metal pollution. Environ. Res. 2003, 93, 221–230. [Google Scholar] [CrossRef]
  8. Xu, Y.; Xiao, H.Y.; Guan, H.; Long, C.J. Monitoring atmospheric nitrogen pollution in Guiyang (SW China) by contrasting use of Cinnamomum camphora leaves, branch bark and bark as biomonitors. Environ. Pollut. 2018, 233, 1037–1048. [Google Scholar] [CrossRef]
  9. Aboal, J.R.; Fernandez, J.A.; Boquete, T.; Carballeira, A. Is it possible to estimate atmospheric deposition of heavy metals by analysis of terrestrial mosses? Sci. Total Environ. 2010, 408, 6291–6297. [Google Scholar] [CrossRef]
  10. Maxhuni, A.; Lazo, P.; Kane, S.; Qarri, F.; Marku, E.; Harmens, H. First survey of atmospheric heavy metal deposition in Kosovo using moss biomonitoring. Environ. Sci. Pollut. R 2016, 23, 744–755. [Google Scholar] [CrossRef]
  11. Qarri, F.; Lazo, P.; Allajbeu, S.; Bekteshi, L.; Kane, S.; Stafilov, T. The evaluation of air quality in Albania by moss biomonitoring and metals atmospheric deposition. Arch. Environ. Con. Tox. 2019, 76, 554–571. [Google Scholar] [CrossRef] [PubMed]
  12. Wang, S.Q.; Zhang, Z.H.; Wang, Z.H. Bryophyte communities as biomonitors of environmental factors in the Goujiang karst bauxite, southwestern China. Sci. Total Environ. 2015, 538, 270–278. [Google Scholar] [CrossRef] [PubMed]
  13. Ares, A.; Aboal, J.R.; Carballeira, A.; Giordano, S.; Adamo, P.; Fernandez, J.A. Moss bag biomonitoring: A methodological review. Sci. Total Environ. 2014, 475, 153–154. [Google Scholar] [CrossRef] [Green Version]
  14. Oishi, Y.; Hiura, T. Bryophytes as bioindicators of the atmospheric environment in urban-forest landscapes. Landsc. Urban Plann. 2017, 167, 348–355. [Google Scholar] [CrossRef]
  15. González-Miqueo, L.; Elustondo, D.; Lasheras, E.; Santamaría, J. Use of native mosses as biomonitors of heavy metals and nitrogen deposition in the surroundings of two steel works. Chemosphere 2010, 78, 965–971. [Google Scholar] [CrossRef]
  16. Berisha, S.; Skudnik, M.; Vilhar, U.; Sabovljevic, M.; Zavadlav, S.; Jeran, Z. Trace elements and nitrogen content in naturally growing moss Hypnum cupressiforme in urban and peri-urban forests of the Municipality of Ljubljana (Slovenia). Environ. Sci. Pollut. R 2017, 24, 4517–4527. [Google Scholar] [CrossRef] [Green Version]
  17. Kosior, G.; Samecka-Cymerman, A.; Kolon, K.; Kempers, A.J. Bioindication capacity of metal pollution of native and transplanted Pleurozium schreberi under various levels of pollution. Chemosphere 2010, 81, 321–326. [Google Scholar] [CrossRef]
  18. Fernandez, J.A.; Aboal, J.R.; Carballeira, A. Use of native and transplanted mosses as complementary techniques for biomonitoring mercury around an industrial facility. Sci. Total Environ. 2000, 256, 151–161. [Google Scholar] [CrossRef]
  19. Stevenson, C.R.; Hill, M.O. Urban myths exploded: Results of a bryological survey of King’s Lynn (Norfolk, UK). J. Bryol. 2008, 30, 12–22. [Google Scholar] [CrossRef] [Green Version]
  20. Kürschner, H.; Frey, W. Life strategies in bryophytes—A prime example for the evolution of functional types. Nova Hedwig. 2013, 96, 83–116. [Google Scholar] [CrossRef]
  21. Torseth, K.; Aas, W.; Breivik, K.; Fjaeraa, A.M.; Fiebig, M.; Hjellbrekke, A.G.; Myhre, C.L.; Solberg, S.; Yttri, K.E. Introduction to the European Monitoring and Evaluation Programme (EMEP) and observed atmospheric composition change during 1972–2009. Atmos. Chem. Phys. 2012, 12, 5447–5481. [Google Scholar] [CrossRef] [Green Version]
  22. Harmens, H.; Norris, D.A.; Koerber, G.R.; Buse, A.; Steinnes, E.; Ruhling, A. Temporal trends (1990–2000) in the concentration of cadmium, lead and mercury in mosses across Europe. Environ. Pollut. 2008, 151, 368–376. [Google Scholar] [CrossRef] [PubMed] [Green Version]
  23. Zhou, X.L.; Chen, Q.; Liu, C.; Fang, Y.M. Using moss to assess airborne heavy metal pollution in Taizhou, China. Int. J. Environ. Res. Pub. Health 2017, 14, 430. [Google Scholar] [CrossRef] [PubMed]
  24. Sun, S.Q.; Wang, D.Y.; He, M.; Zhang, C. Monitoring of atmospheric heavy metal deposition in Chongqing, China-based on moss bag technique. Environ. Monit. Assess. 2009, 148, 1–9. [Google Scholar] [CrossRef]
  25. Cao, T.; Wang, M.; An, L.; Yu, Y.H.; Lou, Y.X.; Guo, S.L.; Zuo, B.R.; Liu, Y.; Wu, J.M.; Cao, Y.; et al. Air quality for metals and sulfur in Shanghai, China, determined with moss bags. Environ. Pollut. 2009, 157, 1270–1278. [Google Scholar] [CrossRef]
  26. Krommer, V.; Zechmeister, H.G.; Roder, I.; Scharf, S.; Hanus-Illnar, A. Monitoring atmospheric pollutants in the biosphere reserve Wienerwald by a combined approach of biomonitoring methods and technical measurements. Chemosphere 2007, 67, 1956–1966. [Google Scholar] [CrossRef]
  27. Gao, Q. Flora Bryophytarum Sinicorum; Science Press: Beijing, China, 1996; Volume 2. [Google Scholar]
  28. Li, X. Flora Bryophytarum Sinicorum; Science Press: Beijing, China, 2000; Volume 3. [Google Scholar]
  29. Li, X. Flora Bryophytarum Sinicorum; Science Press: Beijing, China, 2006; Volume 4. [Google Scholar]
  30. Wu, P.; Jia, Y. Flora Bryophytarum Sinicorum; Science Press: Beijing, China, 2011; Volume 5. [Google Scholar]
  31. Wu, P. Flora Bryophytarum Sinicorum; Science Press: Beijing, China, 2002; Volume 6. [Google Scholar]
  32. Hu, R.; Wang, Y. Flora Bryophytarum Sinicorum; Science Press: Beijing, China, 2005; Volume 7. [Google Scholar]
  33. Wu, P.; Jia, Y. Flora Bryophytarum Sinicorum; Science Press: Beijing, China, 2004; Volume 8. [Google Scholar]
  34. Institutum Botanicum Kunmingense Academiae Sinicae Edita. Flora Yunnanica; Science Press: Beijing, China, 2000; Volume 17. [Google Scholar]
  35. Jiang, Y.; Fan, M.; Hu, R.; Zhao, J.; Wu, Y. Mosses are better than leaves of vascular plants in monitoring atmospheric heavy metal pollution in urban areas. Int. J. Environ. Res. Public Health 2018, 15, 1105. [Google Scholar] [CrossRef] [Green Version]
  36. le Blancs, F.; de Sloover, J. Relation between industrialization and the distribution and growth of epiphytic lichens and mosses in Montreal. Can. J. Bot. 1970, 48, 1485–1496. [Google Scholar] [CrossRef]
  37. Gao, C.; Cao, T. A preliminary study on indication of bryophytes to air pollution (including acid rain) in southest Chian. Chin. J. Appl. Ecol. 1992, 3, 81–90. [Google Scholar]
  38. Hakanson, L. An ecological risk index for aquatic pollution-control—A sedimentological approach. Water Res. 1980, 14, 975–1001. [Google Scholar] [CrossRef]
  39. Xu, Z.; Ni, S.; Tuo, X.; Zhang, C. Calculation of heavy metals toxicity coefficient in the evaluation of potential ecological risk index. Environ. Sci. Technol. 2008, 28, 112–115. [Google Scholar]
  40. Carballeira, A.; Couto, J.A.; Fernandez, J.A. Estimation of background levels of various elements in terrestrial mosses from Galicia (NW Spain). Water Air Soil Pollut. 2002, 133, 235–252. [Google Scholar] [CrossRef]
  41. Fernández, J.A.; Carballeira, A. A comparison of indigenous mosses and topsoils for use in monitoring atmospheric heavy metal deposition in Galicia (northwest Spain). Environ. Pollut. 2001, 114, 431–441. [Google Scholar] [CrossRef]
  42. Steinnes, E. A critical-evaluation of the use of naturally growing moss to monitor the deposition of atmospheric metals. Sci. Total Environ. 1995, 160/161, 243–249. [Google Scholar] [CrossRef]
  43. Bargagli, R.; Monaci, F.; Borghini, F.; Bravi, F.; Agnorelli, C. Mosses and lichens as biomonitors of trace metals. A comparison study on Hypnum cupressiforme and Parmelia caperata in a former mining district in Italy. Environ. Pollut. 2002, 116, 279–287. [Google Scholar] [CrossRef]
  44. Mao, L.; Li, Y.; Liu, C.; Fang, Y. Predication of potential distribution of Haplocladium microphyllum in China based on MaxEnt model. Chin. J. Ecol. 2017, 36, 54–60. [Google Scholar]
  45. Yan, Y.; Zhang, Q.; Wang, G.G.; Fang, Y.M. Atmospheric deposition of heavy metals in Wuxi, China: Estimation based on native moss analysis. Environ. Monit. Assess. 2016, 188, 360. [Google Scholar] [CrossRef]
  46. Melaku, S.; Morris, V.; Raghavan, D.; Hosten, C. Seasonal variation of heavy metals in ambient air and precipitation at a single site in Washington, DC. Environ. Pollut. 2008, 155, 88–98. [Google Scholar] [CrossRef]
  47. Gong, M.; Wu, L.; Bi, X.Y.; Ren, L.M.; Wang, L.; Ma, Z.D.; Bao, Z.Y.; Li, Z.G. Assessing heavy-metal contamination and sources by GIS-based approach and multivariate analysis of urban-rural topsoils in Wuhan, central China. Environ. Geochem. Health 2010, 32, 59–72. [Google Scholar] [CrossRef]
  48. Zhang, C.T.; Yang, Y.; Li, W.D.; Zhang, C.R.; Zhang, R.X.; Mei, Y.; Liao, X.S.; Liu, Y.Y. Spatial distribution and ecological risk assessment of trace metals in urban soils in Wuhan, central China. Environ. Monit. Assess. 2015, 187, 556. [Google Scholar] [CrossRef]
  49. Galuszka, A. The chemistry of soils, rocks and plant bioindicators in three ecosystems of the Holy Cross Mountains, Poland. Environ. Monit. Assess. 2005, 110, 55–70. [Google Scholar] [CrossRef] [PubMed]
  50. Blagnytė, R.; Paliulis, D. Research into heavy metals pollution of atmosphere applying moss as bioindicator: A literature review. Environ. Res. Eng. Manag. 2010, 4, 26–33. [Google Scholar]
  51. Harmens, H.; Ilyin, I.; Mills, G.; Aboal, J.R.; Alber, R.; Blum, O.; Coskun, M.; De Temmerman, L.; Fernandez, J.A.; Figueira, R.; et al. Country-specific correlations across Europe between modelled atmospheric cadmium and lead deposition and concentrations in mosses. Environ. Pollut. 2012, 166, 1–9. [Google Scholar] [CrossRef] [Green Version]
  52. Liu, C.; Zhou, P.; Fang, Y.M. Monitoring airborne heavy metal using mosses in the city of Xuzhou, China. B Environ. Contam. Tox. 2016, 96, 638–644. [Google Scholar] [CrossRef] [PubMed]
  53. Zechmeister, H.G.; Hohenwallner, D. A comparison of biomonitoring methods for the estimation of atmospheric pollutants in an industrial town in Austria. Environ. Monit. Assess. 2006, 117, 245–259. [Google Scholar] [CrossRef] [PubMed]
  54. Boch, S.; Allan, E.; Humbert, J.Y.; Kurtogullari, Y.; Lessard-Therrien, M.; Muller, J.; Prati, D.; Rieder, N.S.; Arlettaz, R.; Fischer, M. Direct and indirect effects of land use on bryophytes in grasslands. Sci. Total Environ. 2018, 644, 60–67. [Google Scholar] [CrossRef]
Figure 1. Map of the study area with sampling sites in the urban areas of Wuhan. N1–N25 are the sample sites, and detailed information is presented in Table S1.
Ijerph 17 04537 g001
Figure 2. Bryophyte diversity of 25 sampling sites in urban areas of Wuhan: (a) number of species surveyed that grow on the ground or tree trunks and (b) α diversity index.
Ijerph 17 04537 g002
Figure 3. Canonical correspondence analysis of the relationships between bryophytes and environmental factors in Wuhan. The black points represent all sample sites with ground and epiphytic bryophytes, g means sample sites that showed ground bryophyte presence, and t indicates sample sites comprising epiphytic bryophytes. The blue triangles are the surveyed dominant bryophyte species, and the corresponding names are indicated in Table 2. Arrows are the environmental factors, where Habitat: habitat type of ground versus tree trunk; Canopy: coverage of tree canopy; Herb: coverage of herb layer; Distance: the distance to the nearest roads; Soil: soil water content; and Altitude: altitude of the sample sites.
Ijerph 17 04537 g003
Figure 4. Spatial distribution of the index of atmospheric purity (IAP).
Ijerph 17 04537 g004
Table 1. Dominant bryophyte species and their important values.
No.SpeciesGenusFamilyCoverage
(%)
Frequency (%)Important Value
S1Haplocladium angustifoliumHaplocladiumThuidiaceae15.56770.140
S2Entodon obtusatusEntodonEntodontaceae7.75410.071
S3Fabronia curvirostrisFabroniaFabroniaceae4.45150.035
S4Claopodium aciculumsClaopodiumThuidiaceae3.52210.034
S5Plagiomnium cuspidatumPlagiomniumMniaceae4.31130.033
S6Weissia exsertaWeissiaPottiaceae1.25260.025
S7Schwetschkeopsis fabroniaSchwetschkeopsisFabroniaceae3.10100.024
S8Sematophyllum phoeniceumSematophyllumSematophyllaceae2.11150.022
S9Fissidens adelphinusFissidensFissidentaceae1.82150.021
S10Bryum coronatumBryumBryaceae1.44180.020
S11Bryum dichotomumBryumBryaceae1.59150.019
S12Physcomitrium sphaericumPhyscomitriumFunariaceae1.58150.019
S13Taxiphyllum taxirameumTaxiphyllumHypnaceae0.86210.019
S14Bryum argenteumBryumBryaceae0.75210.018
S15Hyophila stenophyllaHyophilaPottiaceae1.69130.018
S16Barbula subcontortaBarbulaPottiaceae0.87180.017
S17Weissia microstomaWeissiaPottiaceae0.85180.017
S18Claopodium rugulosifoliumClaopodiumThuidiaceae1.15150.017
S19Taxiphyllum subarcuatumTaxiphyllumHypnaceae1.09150.017
S20Taxiphyllum cusoidifoliumTaxiphyllumHypnaceae1.68100.016
S21Brachythecium amnicolumBrachytheciumBrachytheciaceae1.62100.016
S22Fissidens bryoidesFissidensFissidentaceae0.83150.015
S23Brachythecium plumosumBrachytheciumBrachytheciaceae1.9450.014
S24Venturiella sinensisVenturiellaErpodiaceae1.4680.013
S25Brotherella nictansBrotherellaSematophyllaceae1.2980.012
S26Weissia controversaWeissiaPottiaceae0.62130.012
S27Entodon plicatusEntodonEntodontaceae1.1380.012
S28Entodon scariosusEntodonEntodontaceae1.0680.011
S29Brotherella faurieiBrotherellaSematophyllaceae1.0580.011
S30Oxystegus cuspidatusOxystegusPottiaceae1.6230.011
S31Eurhynchium laxireteEurhynchiumBrachytheciaceae0.9980.011
S32Fabronia matsumuraeFabroniaFabroniaceae1.0850.010
S33Frullania parvistipulaFrullaniaFrullaniaceae1.3930.010
Table 2. Trace element concentrations (mg kg-1) in moss Haplocladium angustifolium and the substrate soil.
MaterialMetalAsCdCoCrCuMnNiPbVZn
MossMaximum19.51.6869.372.577.770450.847.096.3458.0
Minimum1.330.2761.275.399.3171.55.008.0310.048.7
Mean8.210.77614.433.836.734819.025.1138.9214
SD4.780.3216.616.817.117812.011.621.7105
CV (%)58.341.311549.846.451.063.546.155.848.9
SoilMaximum34.30.73722.714480.595251.867.5219170.5
Minimum13.30.116.4755.524.916315.413.841.341.6
Mean21.10.35315.283.638.869331.838.112782.5
SD5.240.1853.6920.612.71908.6416.245.734.9
CV (%)24.852.224.324.632.827.527.242.635.842.3
Difference (P)0.0000.0000.0160.0000.2930.0000.0000.0030.0000.000
Pearson’s correlation0.458 *0.416 *0.3030.3870.479 *0.2680.1760.414 *0.512 **0.272
Note: SD: standard deviation; CV: coefficient of variation; Difference (P) shows the results of paired- samples t test between the concentrations of elements in soil and moss samples, where p < 0.05 means a significant difference, and P < 0.01 means a highly significant difference; * Correlation is significant at the 0.05 level. ** Correlation is significant at the 0.01 level.
Table 3. Correlations of trace elements in Haplocladium angustifolium, the index of atmospheric purity (IAP), and potential ecological risk index (RI).
AsCdCoCrCuMnNiPbVZnIAP
Cd0.29
Co0.76 **0.12
Cr0.72 **−0.010.77 **
Cu0.60 **0.330.61 **0.62 **
Mn0.48 *−0.040.86 **0.70 **0.49 *
Ni0.350.070.79 **0.60 **0.44 *0.90 **
Pb0.48 *0.54 *0.43 *0.270.52 *0.340.34
V0.75 **−0.080.75 **0.89 **0.44 *0.68 **0.54 *0.24
Zn0.060.44 *0.090.080.44 *0.100.150.47 *−0.15
IAP−0.54 *0.03−0.5 *−0.58 **−0.39−0.47 *−0.28−0.27−0.59 **−0.01
RI0.86 **0.490.87 **0.71 **0.64 **0.69 **0.65 **0.60 **0.67 **0.25−0.43 *
* Correlation is significant at the 0.05 level. ** Correlation is significant at the 0.01 level.
Table 4. Potential ecological risk assessment of atmospherically deposited trace elements by mosses in Wuhan. E r i : the potential ecological risk coefficient of element i; RI: potential ecological risk index of multiple elements.
Sample Site Potential   Ecological   Risk   of   Element   i   ( E r i ) RICategory
AsCdCoCrCuMnNiPbVZn
N195.71 164.65 8.66 4.46 13.02 1.35 11.21 12.11 3.94 8.88 324.00 III
N2116.06 94.71 26.87 11.14 12.91 3.14 21.48 12.37 10.35 3.49 312.52 III
N3105.52 145.64 22.80 13.77 22.62 2.88 21.58 11.39 10.85 4.31 361.34 III
N472.43 140.58 39.26 9.16 15.92 2.75 19.68 9.88 8.55 3.74 321.94 III
N597.34 122.97 44.68 15.97 40.85 4.62 25.57 27.64 10.75 7.49 397.88 III
N697.52 138.31 55.02 14.08 19.53 3.35 22.31 14.72 9.08 6.95 380.87 III
N7181.39 192.91 99.72 20.38 31.98 5.00 37.64 23.65 15.26 6.39 614.31 IV
N8136.44 144.77 90.12 16.76 34.55 4.11 33.41 14.28 14.24 7.53 496.22 III
N9130.95 130.99 183.10 18.43 16.70 7.13 41.19 12.12 16.93 4.02 561.54 III
N10197.26 147.21 312.77 27.11 22.80 8.43 64.44 24.58 23.39 3.89 831.87 IV
N11138.23 212.27 191.49 10.90 24.54 5.32 76.41 25.33 6.40 6.68 697.55 IV
N1258.58 75.17 111.48 11.76 23.28 7.29 85.29 12.03 7.88 6.79 399.55 III
N1397.43 94.36 146.25 26.06 30.83 8.74 102.34 10.90 16.61 11.81 545.33 III
N1495.98 87.38 90.07 17.50 23.96 8.20 73.60 9.69 13.35 3.87 423.59 III
N1562.47 91.22 17.70 18.01 9.81 2.66 34.92 9.77 14.62 2.80 263.98 II
N1639.44 118.60 24.08 8.07 12.11 4.53 36.88 12.44 11.46 2.95 270.56 II
N1726.83 143.90 13.91 4.84 12.52 3.01 25.60 21.28 3.66 12.63 268.17 II
N1839.50 88.43 23.05 9.18 11.73 4.09 31.63 9.44 7.28 3.23 227.57 II
N1939.76 118.95 17.16 7.57 9.86 2.59 26.42 14.37 4.78 5.94 247.41 II
N2037.69 156.63 29.95 7.66 15.74 6.00 55.90 20.94 5.94 4.32 340.77 III
N2176.28 292.33 23.07 13.01 30.07 3.71 31.56 27.88 5.46 11.04 514.39 III
N2228.86 57.21 12.57 12.28 15.60 2.02 17.33 5.67 3.31 4.42 159.26 II
N2343.40 242.09 17.55 7.14 15.30 2.64 28.30 6.55 4.48 6.09 373.54 III
N2413.48 48.14 5.73 2.01 4.89 0.89 10.09 4.76 2.43 1.34 93.77 I
N2547.14 132.91 19.93 9.07 11.99 3.56 21.18 18.54 5.43 7.18 276.93 II
Average84.52 135.39 66.96 12.80 19.63 4.35 38.95 14.74 9.62 5.86 392.83 III

