Weight Status Is Related to Health-Related Physical Fitness and Physical Activity but Not to Sedentary Behaviour in Children

 ,
,  ,
,
Abstract
1. Introduction
2. Materials and Methods
2.1. Study Design and Participants
2.2. Procedures
2.2.1. Anthropometric Measurements
2.2.2. Physical Fitness
2.2.3. Physical Activity and Sedentary Behaviour
2.2.4. Statistical Analysis
3. Results
4. Discussion
5. Conclusions
Author Contributions
Funding
Acknowledgments
Conflicts of Interest
References
- Abarca-Gómez, L.; Abdeen, Z.A.; Hamid, Z.A.; Abu-Rmeileh, N.M.; Acosta-Cazares, B.; Acuin, C.; Adams, R.J.; Aekplakorn, W.; Afsana, K.; Aguilar-Salinas, C.A.; et al. Worldwide trends in body-mass index, underweight, overweight, and obesity from 1975 to 2016: A pooled analysis of 2416 population-based measurement studies in 128·9 million children, adolescents, and adults. Lancet 2017, 390, 2627–2642. [Google Scholar] [CrossRef]
- Estudio Aladino 2015. Estudio de Vigilancia del Crecimiento, Alimentación, Actividad Física, Desarrollo Infantil y Obesidad en España 2015; Ministerio de Sanidad, Servicios Sociales e Igualdad: Madrid, Spain, 2016.
- Kumar, S.; Kelly, A.S. Review of Childhood Obesity. Mayo Clin. Proc. 2017, 92, 251–265. [Google Scholar] [CrossRef]
- Bridger, T. Childhood obesity and cardiovascular disease. Paediatr. Child Health 2009, 14, 177–182. [Google Scholar] [CrossRef]
- Friedemann, C.; Heneghan, C.; Mahtani, K.; Thompson, M.; Perera, R.; Ward, A.M. Cardiovascular disease risk in healthy children and its association with body mass index: Systematic review and meta-analysis. BMJ 2012, 345, e4759. [Google Scholar] [CrossRef]
- Kodama, S. Cardiorespiratory Fitness as a Quantitative Predictor of All-Cause Mortality and Cardiovascular Events in Healthy Men and Women: A Meta-analysis. JAMA 2009, 301, 2024. [Google Scholar] [CrossRef] [PubMed]
- García-Hermoso, A.; Cavero-Redondo, I.; Ramírez-Vélez, R.; Ruiz, J.R.; Ortega, F.B.; Lee, D.-C.; Martínez-Vizcaíno, V. Muscular Strength as a Predictor of All-Cause Mortality in an Apparently Healthy Population: A Systematic Review and Meta-Analysis of Data From Approximately 2 Million Men and Women. Arch. Phys. Med. Rehabil. 2018, 99, 2100–2113. [Google Scholar] [CrossRef] [PubMed]
- Ruiz, J.R.; Ortega, F.B.; Meusel, D.; Harro, M.; Oja, P.; Sjöström, M. Cardiorespiratory fitness is associated with features of metabolic risk factors in children. Should cardiorespiratory fitness be assessed in a European health monitoring system? The European Youth Heart Study. J. Public Health 2006, 14, 94–102. [Google Scholar] [CrossRef]
- Eisenmann, J.C. Aerobic fitness, fatness and the metabolic syndrome in children and adolescents. Acta Paediatr. 2007, 96, 1723–1729. [Google Scholar] [CrossRef] [PubMed]
- Lahoz-García, N.; García-Hermoso, A.; Milla-Tobarra, M.; Díez-Fernández, A.; Soriano-Cano, A.; Martínez-Vizcaíno, V. Cardiorespiratory Fitness as a Mediator of the Influence of Diet on Obesity in Children. Nutrients 2018, 10, 358. [Google Scholar] [CrossRef]
- García-Hermoso, A.; Ramírez-Campillo, R.; Izquierdo, M. Is Muscular Fitness Associated with Future Health Benefits in Children and Adolescents? A Systematic Review and Meta-Analysis of Longitudinal Studies. Sports Med. 2019, 49, 1079–1094. [Google Scholar] [CrossRef]
- Thivel, D.; Ring-Dimitriou, S.; Weghuber, D.; Frelut, M.-L.; O’Malley, G. Muscle Strength and Fitness in Pediatric Obesity: A Systematic Review from the European Childhood Obesity Group. Obes. Facts 2016, 9, 52–63. [Google Scholar] [CrossRef] [PubMed]
- Jiménez-Pavón, D.; Kelly, J.; Reilly, J.J. Associations between objectively measured habitual physical activity and adiposity in children and adolescents: Systematic review. Int. J. Pediatr. Obes. 2010, 5, 3–18. [Google Scholar] [CrossRef] [PubMed]
- Robinson, T.N.; Banda, J.A.; Hale, L.; Lu, A.S.; Fleming-Milici, F.; Calvert, S.L.; Wartella, E. Screen Media Exposure and Obesity in Children and Adolescents. Pediatrics 2017, 140, S97–S101. [Google Scholar] [CrossRef] [PubMed]
- Ekelund, U.; Tomkinson, G.; Armstrong, N. What proportion of youth are physically active? Measurement issues, levels and recent time trends. Br. J. Sports Med. 2011, 45, 859–865. [Google Scholar] [CrossRef] [PubMed]
- Hallal, P.C.; Andersen, L.B.; Bull, F.C.; Guthold, R.; Haskell, W.; Ekelund, U. Global physical activity levels: Surveillance progress, pitfalls, and prospects. Lancet 2012, 380, 247–257. [Google Scholar] [CrossRef]
- Roman-Viñas, B.; Zazo, F.; Martínez-Martínez, J.; Aznar-Laín, S.; Serra-Majem, L. Results from Spain’s 2018 Report Card on Physical Activity for Children and Youth. J. Phys. Act. Health 2018, 15, S411–S412. [Google Scholar] [CrossRef]
- Guthold, R.; Stevens, G.A.; Riley, L.M.; Bull, F.C. Worldwide trends in insufficient physical activity from 2001 to 2016: A pooled analysis of 358 population-based surveys with 1·9 million participants. Lancet Glob. Health 2018, 6, e1077–e1086. [Google Scholar] [CrossRef]
- Tremblay, M.S.; Carson, V.; Chaput, J.-P.; Connor Gorber, S.; Dinh, T.; Duggan, M.; Faulkner, G.; Gray, C.E.; Gruber, R.; Janson, K.; et al. Canadian 24-Hour Movement Guidelines for Children and Youth: An Integration of Physical Activity, Sedentary Behaviour, and Sleep. Appl. Physiol. Nutr. Metab. 2016, 41, S311–S327. [Google Scholar] [CrossRef]
- Serra Majem, L.; Aranceta Bartrina, J.; Rodríguez-Santos, F. Crecimiento y Desarrollo. Estudio Enkid. Krece Plus; Masson: Barcelona, Spain, 2003; Volume 4. [Google Scholar]
- Arriscado, D.; Muros, J.J.; Zabala, M.; Dalmau, J.M. Hábitos de práctica física en escolares: Factores influyentes y relaciones con la condición física. Nutr. Hosp. 2015, 31, 1232–1239. [Google Scholar] [CrossRef]
- Fernández-García, J.C.; Castillo-Rodríguez, A.; Onetti, W. Influence of overweight and obesity on the strength of childhood. Nutr. Hosp. 2019, 36, 1055–1060. [Google Scholar] [CrossRef]
- Arriscado, D.; Muros, J.J.; Zabala, M.; Dalmau, J.M. Relación entre condición física y composición corporal en escolares de primaria del norte de España (Logroño). Nutr. Hosp. 2014, 30, 385–394. [Google Scholar] [CrossRef] [PubMed]
- Edo Martínez, Á.; Montaner Gomis, I.; Bosch Moraga, A.; Casademont Ferrer, M.R.; Fábrega Bautista, M.T.; Fernández Bueno, Á.; Gamero García, M.; Ollero Torres, M.A. Estilos de vida, hábitos dietéticos y prevalencia del sobrepeso y la obesidad en una población infantil. Rev. Pediatr. Aten. Primaria 2010, 12, 53–65. [Google Scholar] [CrossRef][Green Version]
- Gálvez Casas, A.; Rodríguez García, P.L.; Rosa Guillamón, A.; García-Cantó, E.; Pérez Soto, J.J.; Tárraga Marcos, M.L.; Tárraga López, P.J. Nivel de condición física y su relación con el estatus de peso corporal en escolares. Nutr. Hosp. 2015, 31, 393–400. [Google Scholar] [CrossRef]
- Martínez-Rodríguez, A.; Aix-Sánchez, J.; Martínez-Sanz, J.M.; Leyva-Vela, B. Evaluación de la condición física, práctica deportiva y estado nutricional de niños y niñas de 6 a 12 años: Estudio piloto. Rev. Esp. Nutr. Humana Dietética 2017, 21, 3. [Google Scholar] [CrossRef]
- López-Gil, J.F.; Brazo-Sayavera, J.; García-Hermoso, A.; Yuste-Lucas, J.L. Adherence to Mediterranean Diet Related with Physical Fitness and Physical Activity in Schoolchildren Aged 6–13. Nutrients 2020, 12, 567. [Google Scholar] [CrossRef]
- Weber, D.R.; Leonard, M.B.; Zemel, B.S. Body composition analysis in the pediatric population. Pediatr. Endocrinol. Rev. PER 2012, 10, 130–139. [Google Scholar]
- Tremblay, M.S. Challenges in global surveillance of physical activity. Lancet Child Adolesc. Health 2020, 4, 2–3. [Google Scholar] [CrossRef]
- Ruiz, J.R.; Castro-Pinero, J.; Artero, E.G.; Ortega, F.B.; Sjostrom, M.; Suni, J.; Castillo, M.J. Predictive validity of health-related fitness in youth: A systematic review. Br. J. Sports Med. 2009, 43, 909–923. [Google Scholar] [CrossRef]
- Simmonds, M.; Llewellyn, A.; Owen, C.G.; Woolacott, N. Predicting adult obesity from childhood obesity: A systematic review and meta-analysis: Adult obesity from childhood obesity. Obes. Rev. 2016, 17, 95–107. [Google Scholar] [CrossRef]
- Gasol Foundation. Resultados Principales del Estudio PASOS 2019 Sobre la Actividad Física, los Estilos de Vida y la Obesidad de la Población Española de 8 a 16 Años; Gasol Foundation: Barcelona, Spain, 2019. [Google Scholar]
- De Onis, M.; Onyango, A.W.; Borghi, E.; Siyam, A.; Nishida, C.; Siekmann, J. Development of a WHO growth reference for school-aged children and adolescents. Bull. World Health Organ. 2007, 85, 660–667. [Google Scholar] [CrossRef]
- Brook, C.G. Determination of body composition of children from skinfold measurements. Arch. Dis. Child. 1971, 46, 182–184. [Google Scholar] [CrossRef] [PubMed]
- Siri, W.E. Body composition from fluid spaces and density: Analysis of methods. In Techniques for Measuring Body Composition; National Academy of Sciences: Washington, DC, USA, 1961; pp. 223–244. [Google Scholar]
- Ruiz, J.R.; Castro-Pinero, J.; Espana-Romero, V.; Artero, E.G.; Ortega, F.B.; Cuenca, M.M.; Jimenez-Pavon, D.; Chillon, P.; Girela-Rejon, M.J.; Mora, J.; et al. Field-based fitness assessment in young people: The ALPHA health-related fitness test battery for children and adolescents. Br. J. Sports Med. 2011, 45, 518–524. [Google Scholar] [CrossRef] [PubMed]
- Léger, L.A.; Mercier, D.; Gadoury, C.; Lambert, J. The multistage 20 metre shuttle run test for aerobic fitness. J. Sports Sci. 1988, 6, 93–101. [Google Scholar] [CrossRef] [PubMed]
- Vicente-Rodríguez, G.; Rey-López, J.P.; Ruíz, J.R.; Jiménez-Pavón, D.; Bergman, P.; Ciarapica, D.; Heredia, J.M.; Molnar, D.; Gutierrez, A.; Moreno, L.A.; et al. Interrater Reliability and Time Measurement Validity of Speed–Agility Field Tests in Adolescents. J. Strength Cond. Res. 2011, 25, 2059–2063. [Google Scholar] [CrossRef] [PubMed]
- Delgado Floody, P.A.; Caamaño Navarrete, F.; Palomino-Devia, C.; Jerez-Mayorga, D.; Martínez-Salazar, C. Relationship in obese Chilean schoolchildren between physical fi tness, physical activity levels and cardiovascular risk factors. Nutr. Hosp. 2019. [Google Scholar] [CrossRef]
- Caamaño Navarrete, F.; Delgado Floopy, P.; Jerez Mayorga, D.; Osorio Poblete, A. Bajos niveles de rendimiento físico, VO2MAX y elevada prevalencia de obesidad en escolares de 9 a 14 años de edad. Nutr. Hosp. 2016, 33. [Google Scholar] [CrossRef]
- Coelho-e-Silva, M.J.; Vaz Ronque, E.R.; Cyrino, E.S.; Fernandes, R.A.; Valente-dos-Santos, J.; Machado-Rodrigues, A.; Martins, R.; Figueiredo, A.J.; Santos, R.; Malina, R.M. Nutritional status, biological maturation and cardiorespiratory fitness in Azorean youth aged 11–15 years. BMC Public Health 2013, 13, 495. [Google Scholar] [CrossRef]
- Zurita-Ortega, F.; Castro-Sánchez, M.; Rodríguez-Fernández, S.; Cofré-Boladós, C.; Chacón-Cuberos, R.; Martínez-Martínez, A.; Muros-Molina, J.J. Actividad física, obesidad y autoestima en escolares chilenos: Análisis mediante ecuaciones estructurales. Rev. Médica Chile 2017, 145, 299–308. [Google Scholar] [CrossRef]
- Castro-Piñero, J.; González-Montesinos, J.L.; Mora, J.; Keating, X.D.; Sjöström, M.; Ruiz, J.R. Percentile Values for Running Sprint Field Tests in Children Ages 6–17 Years: Influence of Weight Status. Res. Q. Exerc. Sport 2010, 81, 143–151. [Google Scholar] [CrossRef]
- Kongkiattikul, L.; Sritippayawan, S.; Chomtho, S.; Deerojanawong, J.; Prapphal, N. Relationship between Obesity Indices and Pulmonary Function Parameters in Obese Thai Children and Adolescents. Indian J. Pediatr. 2015, 82, 1112–1116. [Google Scholar] [CrossRef]
- Ruiz, J.R.; Ortega, F.B.; Wärnberg, J.; Moreno, L.A.; Carrero, J.J.; Gonzalez-Gross, M.; Marcos, A.; Gutierrez, A.; Sjöström, M. Inflammatory Proteins and Muscle Strength in Adolescents: The AVENA Study. Arch. Pediatr. Adolesc. Med. 2008, 162, 462. [Google Scholar] [CrossRef] [PubMed]
- Delextrat, A.; Hayes, L.D.; Al Ghannami, S.S.; Min, Y.; Hussein, I.; Al Oufi, H.; Cohen, D.D.; Ghebremeskel, K. Physical fitness characteristics of Omani primary school children according to body mass index. J. Sports Med. Phys. Fitness 2019, 59. [Google Scholar] [CrossRef]
- Castro-Piñero, J.; González-Montesinos, J.L.; Mora, J.; Keating, X.D.; Girela-Rejón, M.J.; Sjöström, M.; Ruiz, J.R. Percentile Values for Muscular Strength Field Tests in Children Aged 6 to 17 Years: Influence of Weight Status. J. Strength Cond. Res. 2009, 23, 2295–2310. [Google Scholar] [CrossRef] [PubMed]
- Hägg, U.; Taranger, J. Maturation indicators and the pubertal growth spurt. Am. J. Orthod. 1982, 82, 299–309. [Google Scholar] [CrossRef]
- Roth, A.; Schmidt, S.C.E.; Seidel, I.; Woll, A.; Bös, K. Tracking of Physical Fitness of Primary School Children in Trier: A 4-Year Longitudinal Study. BioMed Res. Int. 2018, 2018, 1–10. [Google Scholar] [CrossRef] [PubMed]
- D’Hondt, E.; Deforche, B.; Gentier, I.; De Bourdeaudhuij, I.; Vaeyens, R.; Philippaerts, R.; Lenoir, M. A longitudinal analysis of gross motor coordination in overweight and obese children versus normal-weight peers. Int. J. Obes. 2013, 37, 61–67. [Google Scholar] [CrossRef] [PubMed]
- Latorre-Román, P.Á.; Mora-López, D.; García-Pinillos, F. Intellectual maturity and physical fitness in preschool children: Intellectual maturity and fitness. Pediatr. Int. 2016, 58, 450–455. [Google Scholar] [CrossRef]
- Mistry, S.K.; Puthussery, S. Risk factors of overweight and obesity in childhood and adolescence in South Asian countries: A systematic review of the evidence. Public Health 2015, 129, 200–209. [Google Scholar] [CrossRef]
- Katzmarzyk, P.T.; Barreira, T.V.; Broyles, S.T.; Champagne, C.M.; Chaput, J.-P.; Fogelholm, M.; Hu, G.; Johnson, W.D.; Kuriyan, R.; Kurpad, A.; et al. Relationship between lifestyle behaviors and obesity in children ages 9-11: Results from a 12-country study: Lifestyle and Pediatric Obesity. Obesity 2015, 23, 1696–1702. [Google Scholar] [CrossRef]
- Delgado Floody, P.A.; Jerez Mayorga, D.; Caamaño-Navarrete, F.; Cofré-Lizama, A.; Álvarez, C. Psychological well-being related to screen time, physical activity after school, and weight status in Chilean schoolchildren. Nutr. Hosp. 2019. [Google Scholar] [CrossRef]
- Mandsager, K.; Harb, S.; Cremer, P.; Phelan, D.; Nissen, S.E.; Jaber, W. Association of Cardiorespiratory Fitness with Long-term Mortality Among Adults Undergoing Exercise Treadmill Testing. JAMA Netw. Open 2018, 1, e183605. [Google Scholar] [CrossRef] [PubMed]
- García-Hermoso, A.; Alonso-Martinez, A.M.; Ramírez-Vélez, R.; Izquierdo, M. Effects of Exercise Intervention on Health-Related Physical Fitness and Blood Pressure in Preschool Children: A Systematic Review and Meta-Analysis of Randomized Controlled Trials. Sports Med. 2020, 50, 187–203. [Google Scholar] [CrossRef] [PubMed]
- Shaibi, G.Q.; Ball, G.D.C.; Goran, M.I. Aerobic fitness among Caucasian, African-American, and Latino youth. Ethn. Dis. 2006, 16, 120–125. [Google Scholar]
- González-Muniesa, P.; Mártinez-González, M.-A.; Hu, F.B.; Després, J.-P.; Matsuzawa, Y.; Loos, R.J.F.; Moreno, L.A.; Bray, G.A.; Martinez, J.A. Obesity. Nat. Rev. Dis. Primer 2017, 3, 17034. [Google Scholar] [CrossRef] [PubMed]
- Timón, R.; Marcos-Serrano, M.; Camacho-Cardenosa, M.; Camacho-Cardenosa, A.; Brazo-Sayavera, J.; Olcina Camacho, G. Relación entre parámetros antropométricos y metabólicos en estudiantes de colegios públicos extremeños. Arch. Med. Deporte 2018, 35, 93–98. [Google Scholar]


| Variables | Boys | Girls | ||||||||
|---|---|---|---|---|---|---|---|---|---|---|
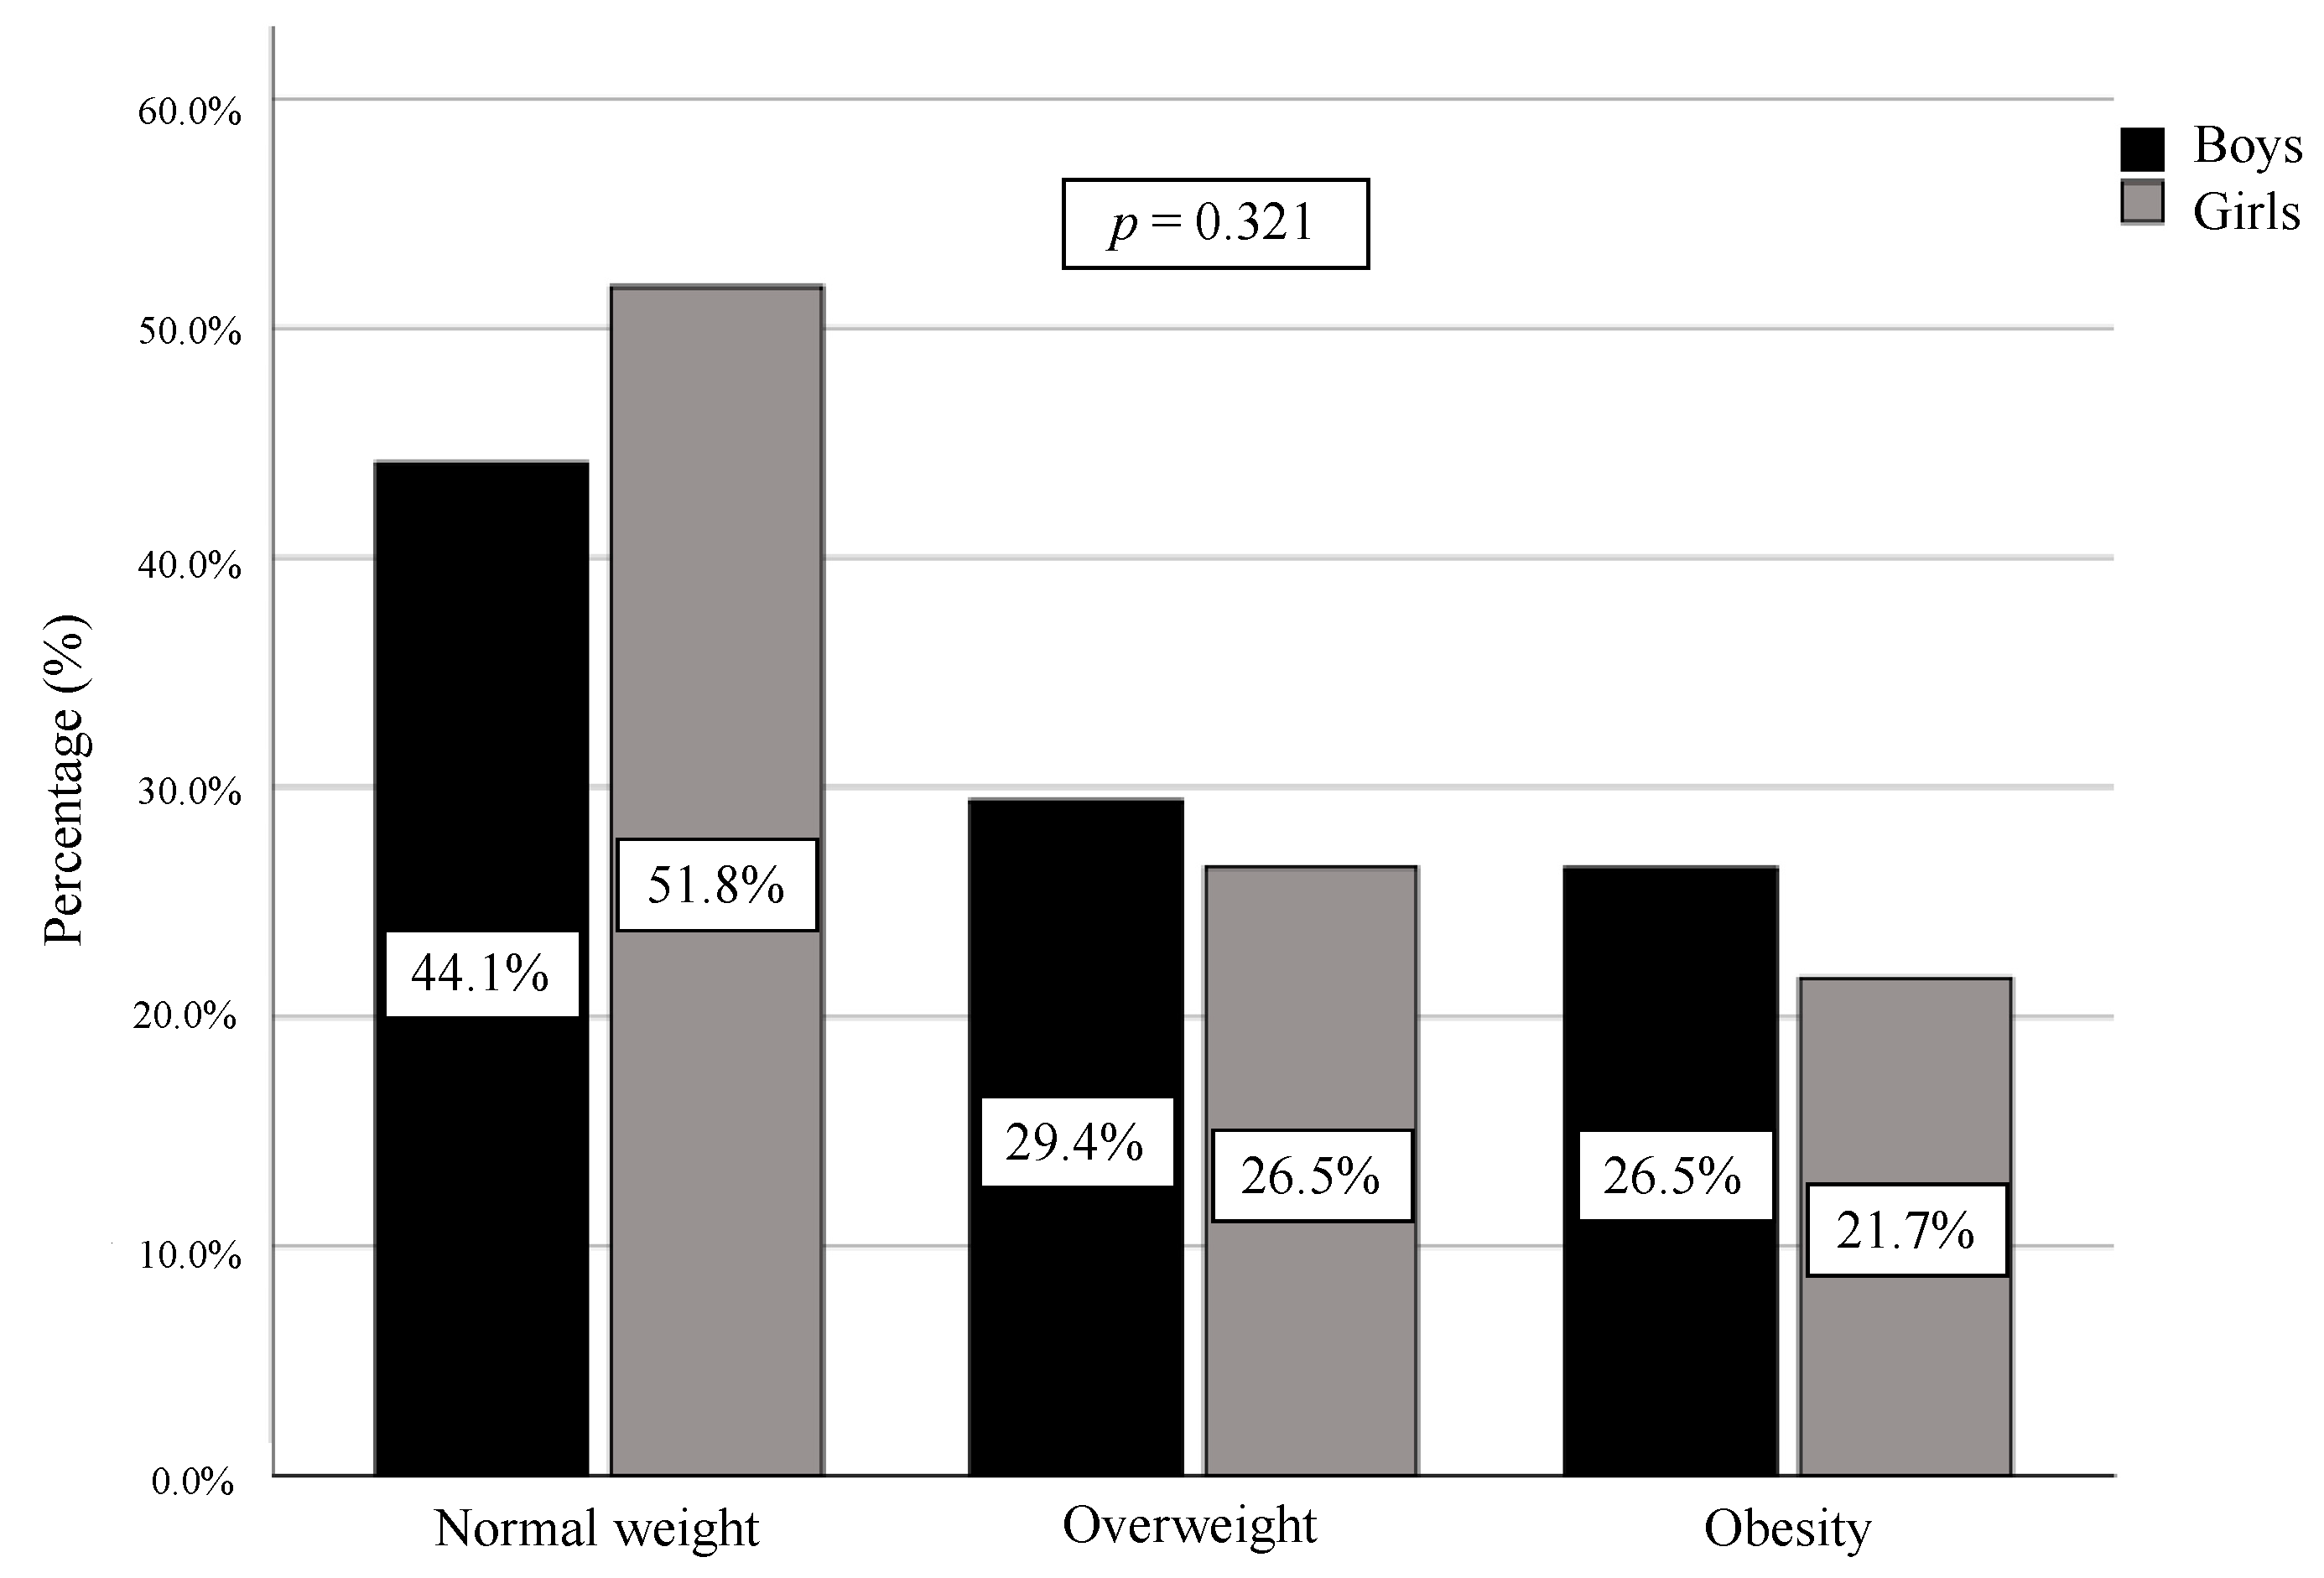
| Normal Weight n = 90 (44.1%) | Overweight n = 60 (29.4%) | Obesity n = 54 (26.5%) | p | d | Normal Weight n = 86 (51.8%) | Overweight n = 44 (26.5%) | Obesity n = 36 (21.7%) | p | d | |
| Age (years) | 8.8 ± 1.7 | 8.9 ± 1.8 | 8.7 ± 1.8 | 0.788 | 0.18 | 8.5 ± 1.8 | 8.6 ± 1.9 | 8.4 ± 1.7 | 0.909 | 0.21 |
| Weight (kg) | 30.6 ± 6.5 | 36.5 ± 7.7 a | 46.1 ± 12.3 a,b | <0.001 ** | 1.44 | 28.8 ± 7.0 | 37.1 ± 9.7 a | 46.5 ± 10.6 a,b | <0.001 ** | 1.55 |
| Height (m) | 1.36 ± 0.12 | 1.37 ± 0.10 | 1.38 ± 0.11 | 0.110 | 0.23 | 1.32 ± 0.12 | 1.36 ± 0.14 | 1.36 ± 0.10 | 0.081 | 0.28 |
| BMI (kg/m2) | 16.34 ± 1.12 | 19.23 ± 1.47 a | 23.47 ± 3.34 a,b | <0.001 ** | 3.58 | 16.30 ± 1.36 | 19.67 ± 1.55 a | 24.73 ± 3.62 a,b | <0.001 ** | 3.47 |
| BMI (z-score) | 0.10 ± 0.57 | 1.50 ± 0.28 a | 2.81 ± 0.62 a,b | <0.001 ** | 4.38 | 0.88 ± 0.62 | 1.49 ± 0.29 a | 2.77 ± 0.64 a,b | <0.001 ** | 3.94 |
| WC (cm) | 58.7 ± 4.1 | 62.6 ± 5.1 a | 70.9 ± 8.6 a,b | <0.001 ** | 1.65 | 56.01 ± 6.33 | 61.72 ± 4.87 a | 71.26 ± 7.39 a,b | <0.001 ** | 1.92 |
| WHtR (WC (cm)/Height (cm)) | 0.43 ± 0.02 | 0.46 ± 0.02 a | 0.51 ± 0.04 a,b | <0.001 ** | 2.20 | 0.43 ± 0.04 | 0.46 ± 0.03 a | 0.52 ± 0.05 a,b | <0.001 ** | 2.10 |
| BF (kg) | 6.2 ± 2.6 | 10.0 ± 4.1 a | 17.2 ± 8.0 a,b | <0.001 ** | 1.89 | 6.7 ± 2.5 | 10.8 ± 4.1 a | 18.1 ± 5.8 a,b | <0.001 ** | 2.06 |
| BF (%) | 19.6 ± 5.5 | 26.7 ± 6.8 a | 35.7 ± 7.7 a,b | <0.001 ** | 2.18 | 22.8 ± 4.3 | 28.6 ± 5.4 a | 38.1 ± 5.2 a,b | <0.001 ** | 2.62 |
| FFM (kg) | 24.4 ± 4.7 | 26.4 ± 4.7 | 28.9 ± 5.3 a,b | <0.001 ** | 0.98 | 22.1 ± 4.8 | 26.3 ± 6.4 | 28.5 ± 5.3 a,b | <0.001 ** | 0.99 |
| FFM (%) | 80.4 ± 5.5 | 73.3 ± 6.8 a | 64.3 ± 7.7 a,b | <0.001 ** | 2.18 | 77.2 ± 4.3 | 71.4 ± 5.4 a | 61.9 ± 5.2 a,b | <0.001 ** | 2.62 |
| Handgrip strength (kg) | 12.98 ± 3.58 | 13.95 ± 4.18 | 14.25 ± 4.16 | 0.124 | 0.28 | 11.25 ± 3.40 | 13.01 ± 4.18 | 13.60 ± 3.64 a | 0.002 * | 0.55 |
| Handgrip strength/BW | 0.42 ± 0.07 | 0.38 ± 0.08 a | 0.31 ± 0.07 a,b | <0.001 ** | 0.63 | 0.39 ± 0.07 | 0.35 ± 0.06 a | 0.29 ± 0.05 a,b | <0.001 ** | 1.19 |
| Standing broad jump (cm) | 124.5 ± 26.6 | 118.9 ± 23.3 | 104.9 ± 21.7 a,b | <0.001 ** | 1.19 | 112.5 ± 23.4 | 107.2 ± 21.9 | 98.3 ± 19.6 a | <0.001 ** | 0.50 |
| 4 × 10 m Shuttle Run Test (s) | 13.15 ± 1.38 | 13.51 ± 1.42 | 14.19 ± 1.65 a | <0.001 ** | 0.55 | 13.95 ± 1.21 | 13.97 ± 1.33 | 14.48 ± 1.37 | 0.151 | 0.21 |
| 20 m Shuttle Run Test (laps) | 25.7 ± 15.0 | 22.7 ± 13.3 | 11.9 ± 7.0 a,b | <0.001 ** | 0.93 | 19.3 ± 10.5 | 16.2 ± 8.3 | 10.7 ± 3.4 a,b | <0.001 ** | 0.81 |
| CRF (mL/kg/min) | 46.47 ± 4.31 | 45.52 ± 4.42 | 43.25 ± 3.76 a,b | <0.001 ** | 0.61 | 45.50 ± 3.38 | 44.29 ± 4.23 | 42.91 ± 3.24 a | 0.004 * | 0.49 |
| Daily screen time (hours) | 3.3 ± 1.0 | 3.2 ± 1.2 | 3.5 ± 0.9 | 0.658 | 0.15 | 3.3 ± 1.0 | 3.5 ± 0.7 | 3.4 ± 0.9 | 0.584 | 0.15 |
| Weekly sport activities (hours) | 3.2 ± 1.6 | 2.8 ± 1.8 | 2.4 ± 1.7 a | 0.030 * | 0.32 | 2.8 ± 1.5 | 2.6 ± 1.6 | 1.8 ± 1.3 a | 0.005 * | 0.48 |
| Krece Plus Short Test (score) | 6.5 ± 1.9 | 6.1 ± 2.1 | 5.8 ± 2.0 | 0.107 | 0.22 | 6.1 ± 1.8 | 6.1 ± 1.8 | 5.2 ± 1.6 a | 0.017 * | 0.40 |
| Variables | BMI | WC | %BF | |||
|---|---|---|---|---|---|---|
| Crude | Adjusted # | Crude | Adjusted # | Crude | Adjusted # | |
| Handgrip strength (kg) | 0.427 ** | 0.348 ** | 0.632 ** | 0.416 ** | 0.350 ** | 0.228 ** |
| Handgrip strength/BW | −0.482 * | −0.547 ** | −0.291 ** | −0.432 ** | −0.462 ** | −0.535 ** |
| Standing broad jump (cm) | −0.127 * | −0.340 ** | 0.060 | −0.298 ** | −0.232 ** | −0.572 ** |
| 4 × 10 m Shuttle Run Test (s) | 0.038 | 0.263 ** | −0.153 * | 0.214 ** | 0.166 ** | 0.401 ** |
| 20 m Shuttle Run Test (laps) | −0.295 ** | −0.394 ** | −0.165 ** | −0.338 ** | −0.363 ** | −0.469 ** |
| CRF (mL/kg/min) | −0.462 ** | −0.389 ** | −0.536 ** | −0.336 ** | −0.537 ** | −0.455 ** |
| Daily screen time (hours) | 0.037 | 0.025 | 0.030 | 0.008 | 0.026 | 0.017 |
| Weekly sport activities (hours) | −0.154 * | −0.178 * | −0.082 | −0.149 * | −0.157 * | −0.182 ** |
| Krece Plus Short Test (score) | −0.118 * | −0.141 * | −0.059 | −0.126 * | −0.134 ** | −0.149 ** |
| Predictors | Normal Weight | Overweight | Obesity |
|---|---|---|---|
| Model 1 | |||
| Handgrip strength (per 1 kg) | 0.88 ** (0.83–0.94) | 0.97 (0.91–1.04) | 1 |
| Handgrip strength/BW (per 0.01 unit) | 1.23 ** (1.17–1.28) | 1.14 ** (1.09–1.19) | 1 |
| Standing broad jump (per 1 cm) | 1.03 ** (1.02–1.04) | 1.01 ** (1.01–1.03) | 1 |
| 4 × 10m Shuttle Run Test (per 1 s) | 0.70 ** (0.58–0.84) | 0.76 * (0.63–0.93) | 1 |
| 20m Shuttle Run Test (per 1 lap) | 1.14 ** (1.10–1.19) | 1.13 ** (1.08–1.18) | 1 |
| CRF (ml/kg/min) (per 1 unit) | 1.19 ** (1.12–1.28) | 1.13 ** (1.05–1.21) | 1 |
| Daily screen time (per 1 h) | 1.15 (0.88–1.50) | 1.10 (0.82–1.47) | 1 |
| Weekly sport activities (per 1 h) | 1.37 ** (1.17–1.62) | 1.23 * (1.03–1.47) | 1 |
| Krece Plus Short Test (per 1 unit) | 1.22 * (1.06–1.40) | 1.13 (0.98–1.32) | 1 |
| Model 2 | |||
| Handgrip strength (per 1 kg) | 0.73 ** (0.65–0.82) | 0.90 (0.81–1.01) | 1 |
| Handgrip strength/BW (per 0.01 unit) | 1.25 ** (1.19–1.31) | 1.15 ** (1.09–1.20) | 1 |
| Standing broad jump (per 1 cm) | 1.04 ** (1.03–1.06) | 1.03 ** (1.01–1.04) | 1 |
| 4x10m Shuttle Run Test (per 1 s) | 0.57 ** (0.45–0.72) | 0.72 * (0.56–0.91) | 1 |
| 20m Shuttle Run Test (per 1 lap) | 1.15 ** (1.11–1.20) | 1.13 ** (1.08–1.18) | 1 |
| CRF (ml/kg/min) (per 1 unit) | 1.58 ** (1.38–1.82) | 1.44 ** (1.25–1.66) | 1 |
| Daily screen time (per 1 h) | 0.86 (0.66–1.13) | 0.91 (0.68–1.21) | 1 |
| Weekly sport activities (per 1 h) | 1.40 ** (1.19–1.66) | 1.23 * (1.04–1.47) | 1 |
| Krece Plus Short Test (per 1 unit) | 1.23 * (1.07–1.42) | 1.13 (0.97–1.32) | 1 |
© 2020 by the authors. Licensee MDPI, Basel, Switzerland. This article is an open access article distributed under the terms and conditions of the Creative Commons Attribution (CC BY) license (http://creativecommons.org/licenses/by/4.0/).
Share and Cite
López-Gil, J.F.; Brazo-Sayavera, J.; Yuste Lucas, J.L.; Renato Cavichiolli, F. Weight Status Is Related to Health-Related Physical Fitness and Physical Activity but Not to Sedentary Behaviour in Children. Int. J. Environ. Res. Public Health 2020, 17, 4518. https://doi.org/10.3390/ijerph17124518
López-Gil JF, Brazo-Sayavera J, Yuste Lucas JL, Renato Cavichiolli F. Weight Status Is Related to Health-Related Physical Fitness and Physical Activity but Not to Sedentary Behaviour in Children. International Journal of Environmental Research and Public Health. 2020; 17(12):4518. https://doi.org/10.3390/ijerph17124518
Chicago/Turabian StyleLópez-Gil, José Francisco, Javier Brazo-Sayavera, Juan Luis Yuste Lucas, and Fernando Renato Cavichiolli. 2020. "Weight Status Is Related to Health-Related Physical Fitness and Physical Activity but Not to Sedentary Behaviour in Children" International Journal of Environmental Research and Public Health 17, no. 12: 4518. https://doi.org/10.3390/ijerph17124518
APA StyleLópez-Gil, J. F., Brazo-Sayavera, J., Yuste Lucas, J. L., & Renato Cavichiolli, F. (2020). Weight Status Is Related to Health-Related Physical Fitness and Physical Activity but Not to Sedentary Behaviour in Children. International Journal of Environmental Research and Public Health, 17(12), 4518. https://doi.org/10.3390/ijerph17124518