Educational Inequalities in Self-Rated Health in Europe and South Korea
Abstract
1. Introduction
2. Materials and Methods
2.1. Ethical Approval
2.2. Data
2.3. Variables
2.4. Statistical Analysis
3. Results
4. Discussion
Author Contributions
Funding
Acknowledgments
Conflicts of Interest
References
- Mackenbach, J.P.; Stirbu, I.; Roskam, A.-J.; Schaap, M.M.; Menvielle, G.; Leinsalu, M.; Kunst, A.E. Socioeconomic inequalities in health in 22 European countries. N. Engl. J. Med. 2008, 358, 2468–2481. [Google Scholar] [CrossRef] [PubMed]
- Mackenbach, J.P.; Valverde, J.R.; Artnik, B.; Bopp, M.; Brønnum-Hansen, H.; Deboosere, P.; Kalediene, R.; Kovács, K.; Leinsalu, M.; Martikainen, P.; et al. Trends in health inequalities in 27 European countries. Proc. Natl. Acad. Sci. USA 2018, 115, 6440–6445. [Google Scholar] [CrossRef] [PubMed]
- Kunst, A.E.; Bos, V.; Lahelma, E.; Bartley, M.; Lissau, I.; Regidor, E.; Mielck, A.; Cardano, M.; Dalstra, J.A.; Geurts, J.J. Trends in socioeconomic inequalities in self-assessed health in 10 European countries. Int. J. Epidemiol. 2004, 34, 295–305. [Google Scholar] [CrossRef]
- Khang, Y.-H.; Lynch, J.W.; Yun, S.; Lee, S.I. Trends in socioeconomic health inequalities in Korea: Use of mortality and morbidity measures. J. Epidemiol. Commun. Health 2004, 58, 308–314. [Google Scholar] [CrossRef] [PubMed]
- Bahk, J.; Lynch, J.W.; Khang, Y.-H. Forty years of economic growth and plummeting mortality: The mortality experience of the poorly educated in South Korea. J. Epidemiol. Commun. Health 2017, 71, 282–288. [Google Scholar] [CrossRef] [PubMed]
- Lee, W.Y.; Khang, Y.-H.; Noh, M.; Ryu, J.-I.; Son, M.; Hong, Y.-P. Trends in educational differentials in suicide mortality between 1993–2006 in Korea. Yonsei Med. J. 2009, 50, 482–492. [Google Scholar] [CrossRef]
- Kim, M.-H.; Jung-Choi, K.; Jun, H.-J.; Kawachi, I. Socioeconomic inequalities in suicidal ideation, parasuicides, and completed suicides in South Korea. Soc. Sci. Med. 2010, 70, 1254–1261. [Google Scholar] [CrossRef] [PubMed]
- Kim, K.; Hong, S.A.; Kim, M.K. Trends in nutritional inequality by educational level: A case of South Korea. Nutrition 2010, 26, 791–798. [Google Scholar] [CrossRef] [PubMed]
- Kawachi, I.; Adler, N.E.; Dow, W.H. Money, schooling, and health: Mechanisms and causal evidence. Ann. N. Y. Acad. Sci. 2010. [Google Scholar] [CrossRef] [PubMed]
- Mackenbach, J. Explanatory perspectives. In Health Inequalities: Persistence and Change in European Welfare States; Mackenbach, J., Ed.; Oxford University Press: Oxford, UK, 2019; pp. 48–96. [Google Scholar]
- Glymour, M.M.; Avendano, M.; Kawachi, I. Socioeconomic status and health. In Social Epidemiology, 2nd ed.; Berkman, L.F., Kawachi, I., Glymour, M.M., Eds.; Oxford University Press: Oxford, UK, 2014; pp. 17–62. [Google Scholar]
- Galobardes, B.; Lynch, J.; Smith, G.D. Measuring socioeconomic position in health research. Br. Med. Bull. 2007, 81, 21–37. [Google Scholar] [CrossRef] [PubMed]
- Lynch, J.; Kaplan, G. Socioeconomic position. In Social Epidemiology; Berkman, L., Kawachi, I., Eds.; Oxford University Press: Oxford, UK, 2000; pp. 13–35. [Google Scholar]
- Galama, T.J.; Lleras-Muney, A.; van Kippersluis, H. The Effect of Education on Health and Mortality: A Review of Experimental and Quasi-Experimental Evidence; National Bureau of Economic Research: Cambridge, MA, USA, 2018. [Google Scholar]
- Davies, N.M.; Dickson, M.; Smith, G.D.; Van Den Berg, G.J.; Windmeijer, F. The causal effects of education on health outcomes in the UK Biobank. Nat. Hum. Behav. 2018, 2, 117–125. [Google Scholar] [CrossRef] [PubMed]
- Gill, D.; Efstathiadou, A.; Cawood, K.; Tzoulaki, I.; Dehghan, A. Education protects against coronary heart disease and stroke independently of cognitive function: Evidence from Mendelian randomization. Int. J. Epidemiol. 2019, 48, 1468–1477. [Google Scholar] [CrossRef] [PubMed]
- Tillmann, T.; Vaucher, J.; Okbay, A.; Pikhart, H.; Peasey, A.; Kubinova, R.; Pajak, A.; Tamosiunas, A.; Malyutina, S.; Hartwig, F.P. Education and coronary heart disease: Mendelian randomisation study. BMJ 2017, 358, j3542. [Google Scholar] [CrossRef]
- Davies, N.M.; Hill, W.D.; Anderson, E.L.; Sanderson, E.; Deary, I.J.; Smith, G.D. Multivariable two-sample Mendelian randomization estimates of the effects of intelligence and education on health. Elife 2019, 8, e43990. [Google Scholar] [CrossRef] [PubMed]
- Mackenbach, J.P.; Kunst, A.E.; Cavelaars, A.E.J.M.; Groenhof, F.; Geurts, J.J.M. Socioeconomic inequalities in morbidity and mortality in western Europe. Lancet 1997, 349, 1655–1659. [Google Scholar] [CrossRef]
- Mackenbach, J. Patterns of health inequalities. In Health Inequalities: Persistence and Change in European Welfare States; Mackenbach, J., Ed.; Oxford University Press: Oxford, UK, 2019. [Google Scholar]
- Hu, Y.; van Lenthe, F.J.; Borsboom, G.J.; Looman, C.W.; Bopp, M.; Burström, B.; Dzúrová, D.; Ekholm, O.; Klumbiene, J.; Lahelma, E. Trends in socioeconomic inequalities in self-assessed health in 17 European countries between 1990 and 2010. J. Epidemiol. Commun. Health 2016, 70, 644–652. [Google Scholar] [CrossRef]
- Leão, T.; Campos-Matos, I.; Bambra, C.; Russo, G.; Perelman, J. Welfare states, the Great Recession and health: Trends in educational inequalities in self-reported health in 26 European countries. PLoS ONE 2018, 13, e0193165. [Google Scholar] [CrossRef]
- Aspalter, C. The East Asian welfare model. Int. J. Soc. Welfare 2006, 15, 290–301. [Google Scholar] [CrossRef]
- Bambra, C. Going beyond the three worlds of welfare capitalism: Regime theory and public health research. J. Epidemiol. Commun. Health 2007, 61, 1098. [Google Scholar] [CrossRef]
- Hanibuchi, T.; Nakaya, T.; Murata, C. Socio-economic status and self-rated health in East Asia: A comparison of China, Japan, South Korea and Taiwan. Eur. J. Public Health 2010, 22, 47–52. [Google Scholar] [CrossRef]
- Tanaka, H.; Nusselder, W.J.; Bopp, M.; Brønnum-Hansen, H.; Kalediene, R.; Lee, J.S.; Leinsalu, M.; Martikainen, P.; Menvielle, G.; Kobayashi, Y. Mortality inequalities by occupational class among men in Japan, South Korea and eight European countries: A national register-based study, 1990–2015. J. Epidemiol. Commun. Health 2019, 73, 750–758. [Google Scholar] [CrossRef] [PubMed]
- Di Cesare, M.; Khang, Y.-H.; Asaria, P.; Blakely, T.; Cowan, M.J.; Farzadfar, F.; Guerrero, R.; Ikeda, N.; Kyobutungi, C.; Msyamboza, K.P.; et al. Inequalities in non-communicable diseases and effective responses. Lancet 2013, 381, 585–597. [Google Scholar] [CrossRef]
- OECD Health at a Glance 2015: OECD Indicators. Available online: http://dx.doi.org/10.1787/health_glance-2015-en (accessed on 13 August 2019).
- Cambois, E.; Solé-Auró, A.; Brønnum-Hansen, H.; Egidi, V.; Jagger, C.; Jeune, B.; Nusselder, W.J.; Van Oyen, H.; White, C.; Robine, J.-M. Educational differentials in disability vary across and within welfare regimes: A comparison of 26 European countries in 2009. J. Epidemiol. Commun. Health 2016, 70, 331–338. [Google Scholar] [CrossRef] [PubMed]
- Eurostat. Reference Metadata in ESS Standard for Quality Reports Structure: Annex 5—Sampling Size and Non Reponse Rate 2017. Available online: https://circabc.europa.eu/w/browse/47dfd41d-52ab-4ec6-89b2-951e2a542a57 (accessed on 15 March 2020).
- Korea Centers for Disease Control & Prevention. KNHANES Release Guide: 2016–2017. Available online: https://knhanes.cdc.go.kr/knhanes/eng/index.do (accessed on 12 September 2019).
- UNESCO Institute for Statistics International Standard Classification of Education ISCED 2011. Available online: http://uis.unesco.org/sites/default/files/documents/international-standard-classification-of-education-isced-2011-en.pdf (accessed on 3 September 2019).
- Eurostat. EU Statistics on Income and Living Conditions (EU-SILC) Methodology-Concepts and Contents. Available online: https://ec.europa.eu/eurostat/statistics-explained/index.php?title=EU_statistics_on_income_and_living_conditions__(EU-SILC)_methodology_%E2%80%93_concepts_and_contents#Age (accessed on 16 April 2019).
- Ernstsen, L.; Strand, B.H.; Nilsen, S.M.; Espnes, G.A.; Krokstad, S. Trends in absolute and relative educational inequalities in four modifiable ischaemic heart disease risk factors: Repeated cross-sectional surveys from the Nord-Trøndelag Health Study (HUNT) 1984–2008. BMC Public Health 2012, 12, 266. [Google Scholar] [CrossRef]
- McCartney, G.; Popham, F.; Katikireddi, S.V.; Walsh, D.; Schofield, L. How do trends in mortality inequalities by deprivation and education in Scotland and England & Wales compare? A repeat cross-sectional study. BMJ Open 2017, 7, e017590. [Google Scholar] [PubMed]
- Khang, Y.-H.; Lynch, J.W.; Yang, S.; Harper, S.; Yun, S.-C.; Jung-Choi, K.; Kim, H.R. The contribution of material, psychosocial, and behavioral factors in explaining educational and occupational mortality inequalities in a nationally representative sample of South Koreans: Relative and absolute perspectives. Soc. Sci. Med. 2009, 68, 858–866. [Google Scholar] [CrossRef] [PubMed]
- Ahmad, O.B.; Boschi-Pinto, C.; Lopez, A.D.; Murray, C.J.; Lozano, R.; Inoue, M. Age Standardization of Rates: A New WHO Standard [Internet]; World Health Organization: Geneva, Switzerland, 2001. [Google Scholar]
- Mackenbach, J.P.; Kunst, A.E. Measuring the magnitude of socio-economic inequalities in health: An overview of available measures illustrated with two examples from Europe. Soc. Sci. Med. 1997, 44, 757–771. [Google Scholar] [CrossRef]
- Harper, S.; Lynch, J. Measuring health inequalities. In Methods in Social Epidemiology; Oakes, J.M., Kaufman, J.S., Eds.; Jossey-Bass: San Francisco, CA, USA, 2006; pp. 134–168. [Google Scholar]
- Spiegelman, D.; Hertzmark, E. Easy SAS calculations for risk or prevalence ratios and differences. Am. J. Epidemiol. 2005, 162, 199–200. [Google Scholar] [CrossRef]
- Richardson, D.B.; Kinlaw, A.C.; MacLehose, R.F.; Cole, S.R. Standardized binomial models for risk or prevalence ratios and differences. Int. J. Epidemiol. 2015, 44, 1660–1672. [Google Scholar] [CrossRef]
- Kim, M.; Khang, Y.-H. Why do Japan and South Korea record very low levels of perceived health despite having very high life expectancies? Yonsei Med. J. 2019, 60, 998–1003. [Google Scholar] [CrossRef]
- O’Doherty, M.; French, D.; Steptoe, A.; Kee, F. Social capital, deprivation and self-rated health: Does reporting heterogeneity play a role? Results from the English Longitudinal Study of Ageing. Soc. Sci. Med. 2017, 179, 191–200. [Google Scholar] [CrossRef] [PubMed]
- Rossouw, L.; d’Uva, T.B.; van Doorslaer, E. Poor health reporting? Using anchoring vignettes to uncover health disparities by wealth and race. Demography 2018, 55, 1935–1956. [Google Scholar] [CrossRef]
- Bago d’Uva, T.; O’Donnell, O.; Van Doorslaer, E. Differential health reporting by education level and its impact on the measurement of health inequalities among older Europeans. Int. J. Epidemiol. 2008, 37, 1375–1383. [Google Scholar] [CrossRef] [PubMed]
- Hanandita, W.; Tampubolon, G. Does reporting behaviour bias the measurement of social inequalities in self-rated health in Indonesia? An anchoring vignette analysis. Qual. Life Res. 2016, 25, 1137–1149. [Google Scholar] [CrossRef] [PubMed]
- Lahelma, E.; Pietiläinen, O.; Rahkonen, O.; Kivimäki, M.; Martikainen, P.; Ferrie, J.; Marmot, M.; Shipley, M.; Sekine, M.; Tatsuse, T.; et al. Social class inequalities in health among occupational cohorts from Finland, Britain and Japan: A follow up study. Health Place 2015, 31, 173–179. [Google Scholar] [CrossRef]
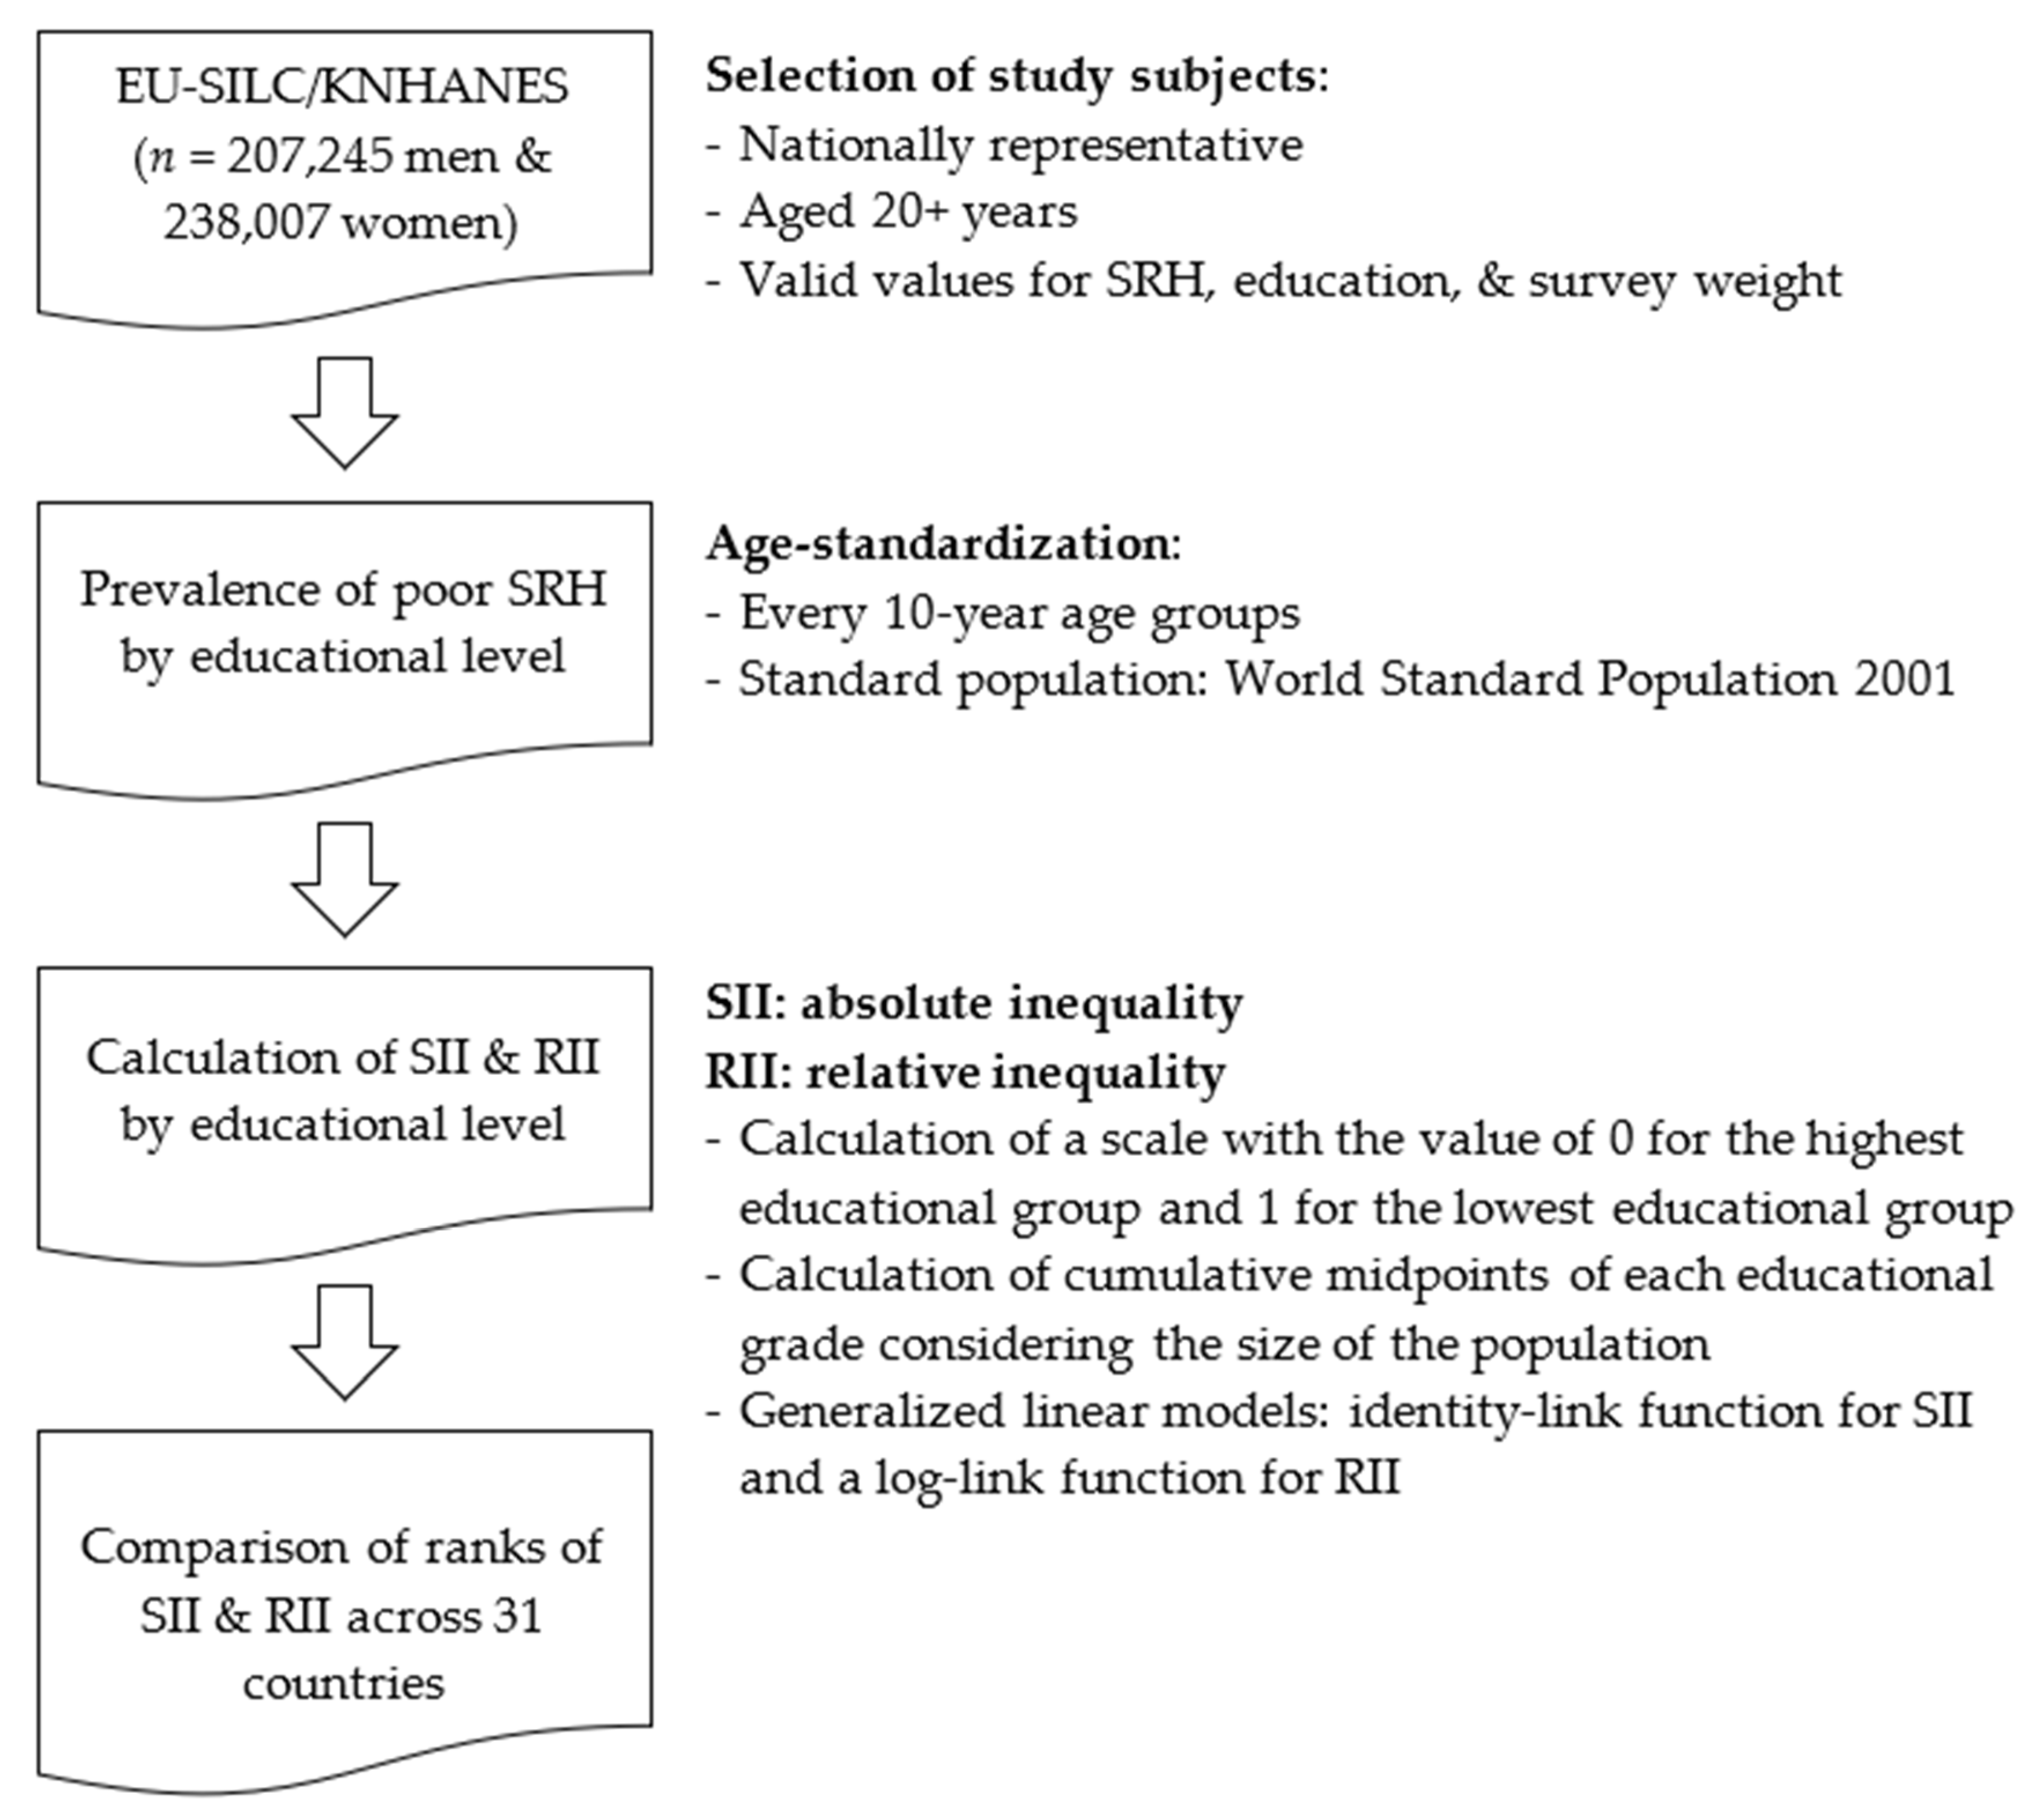
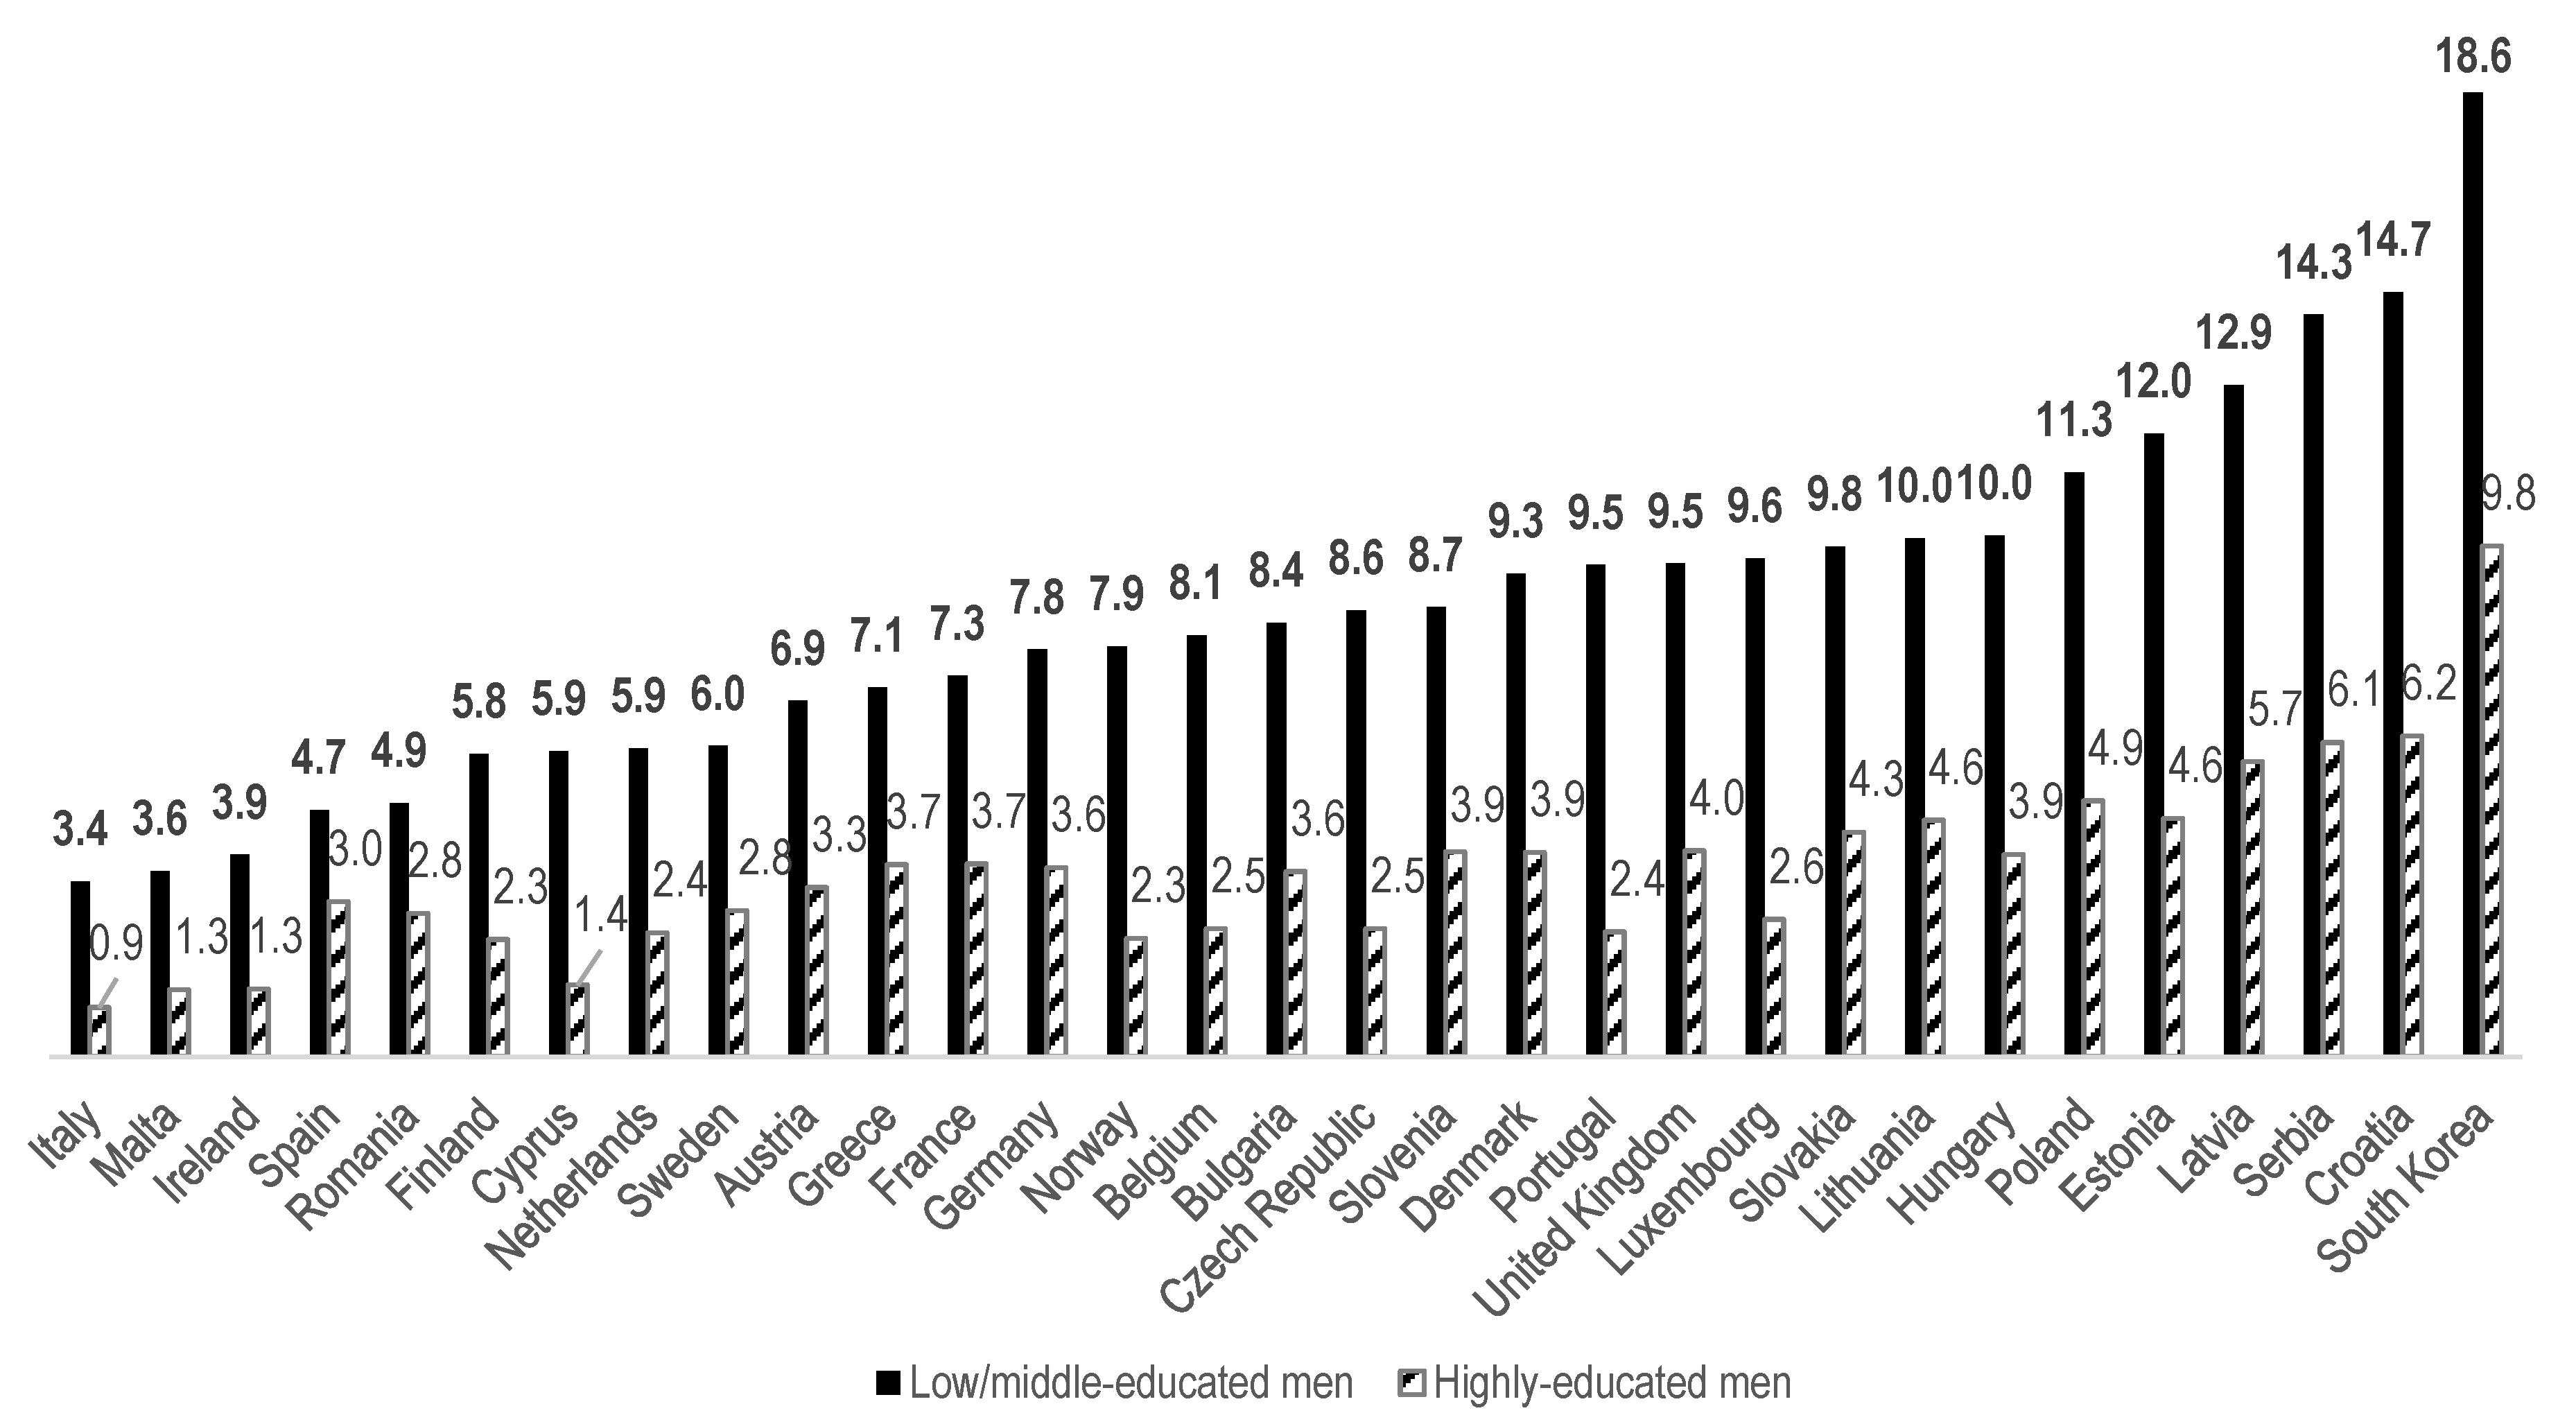
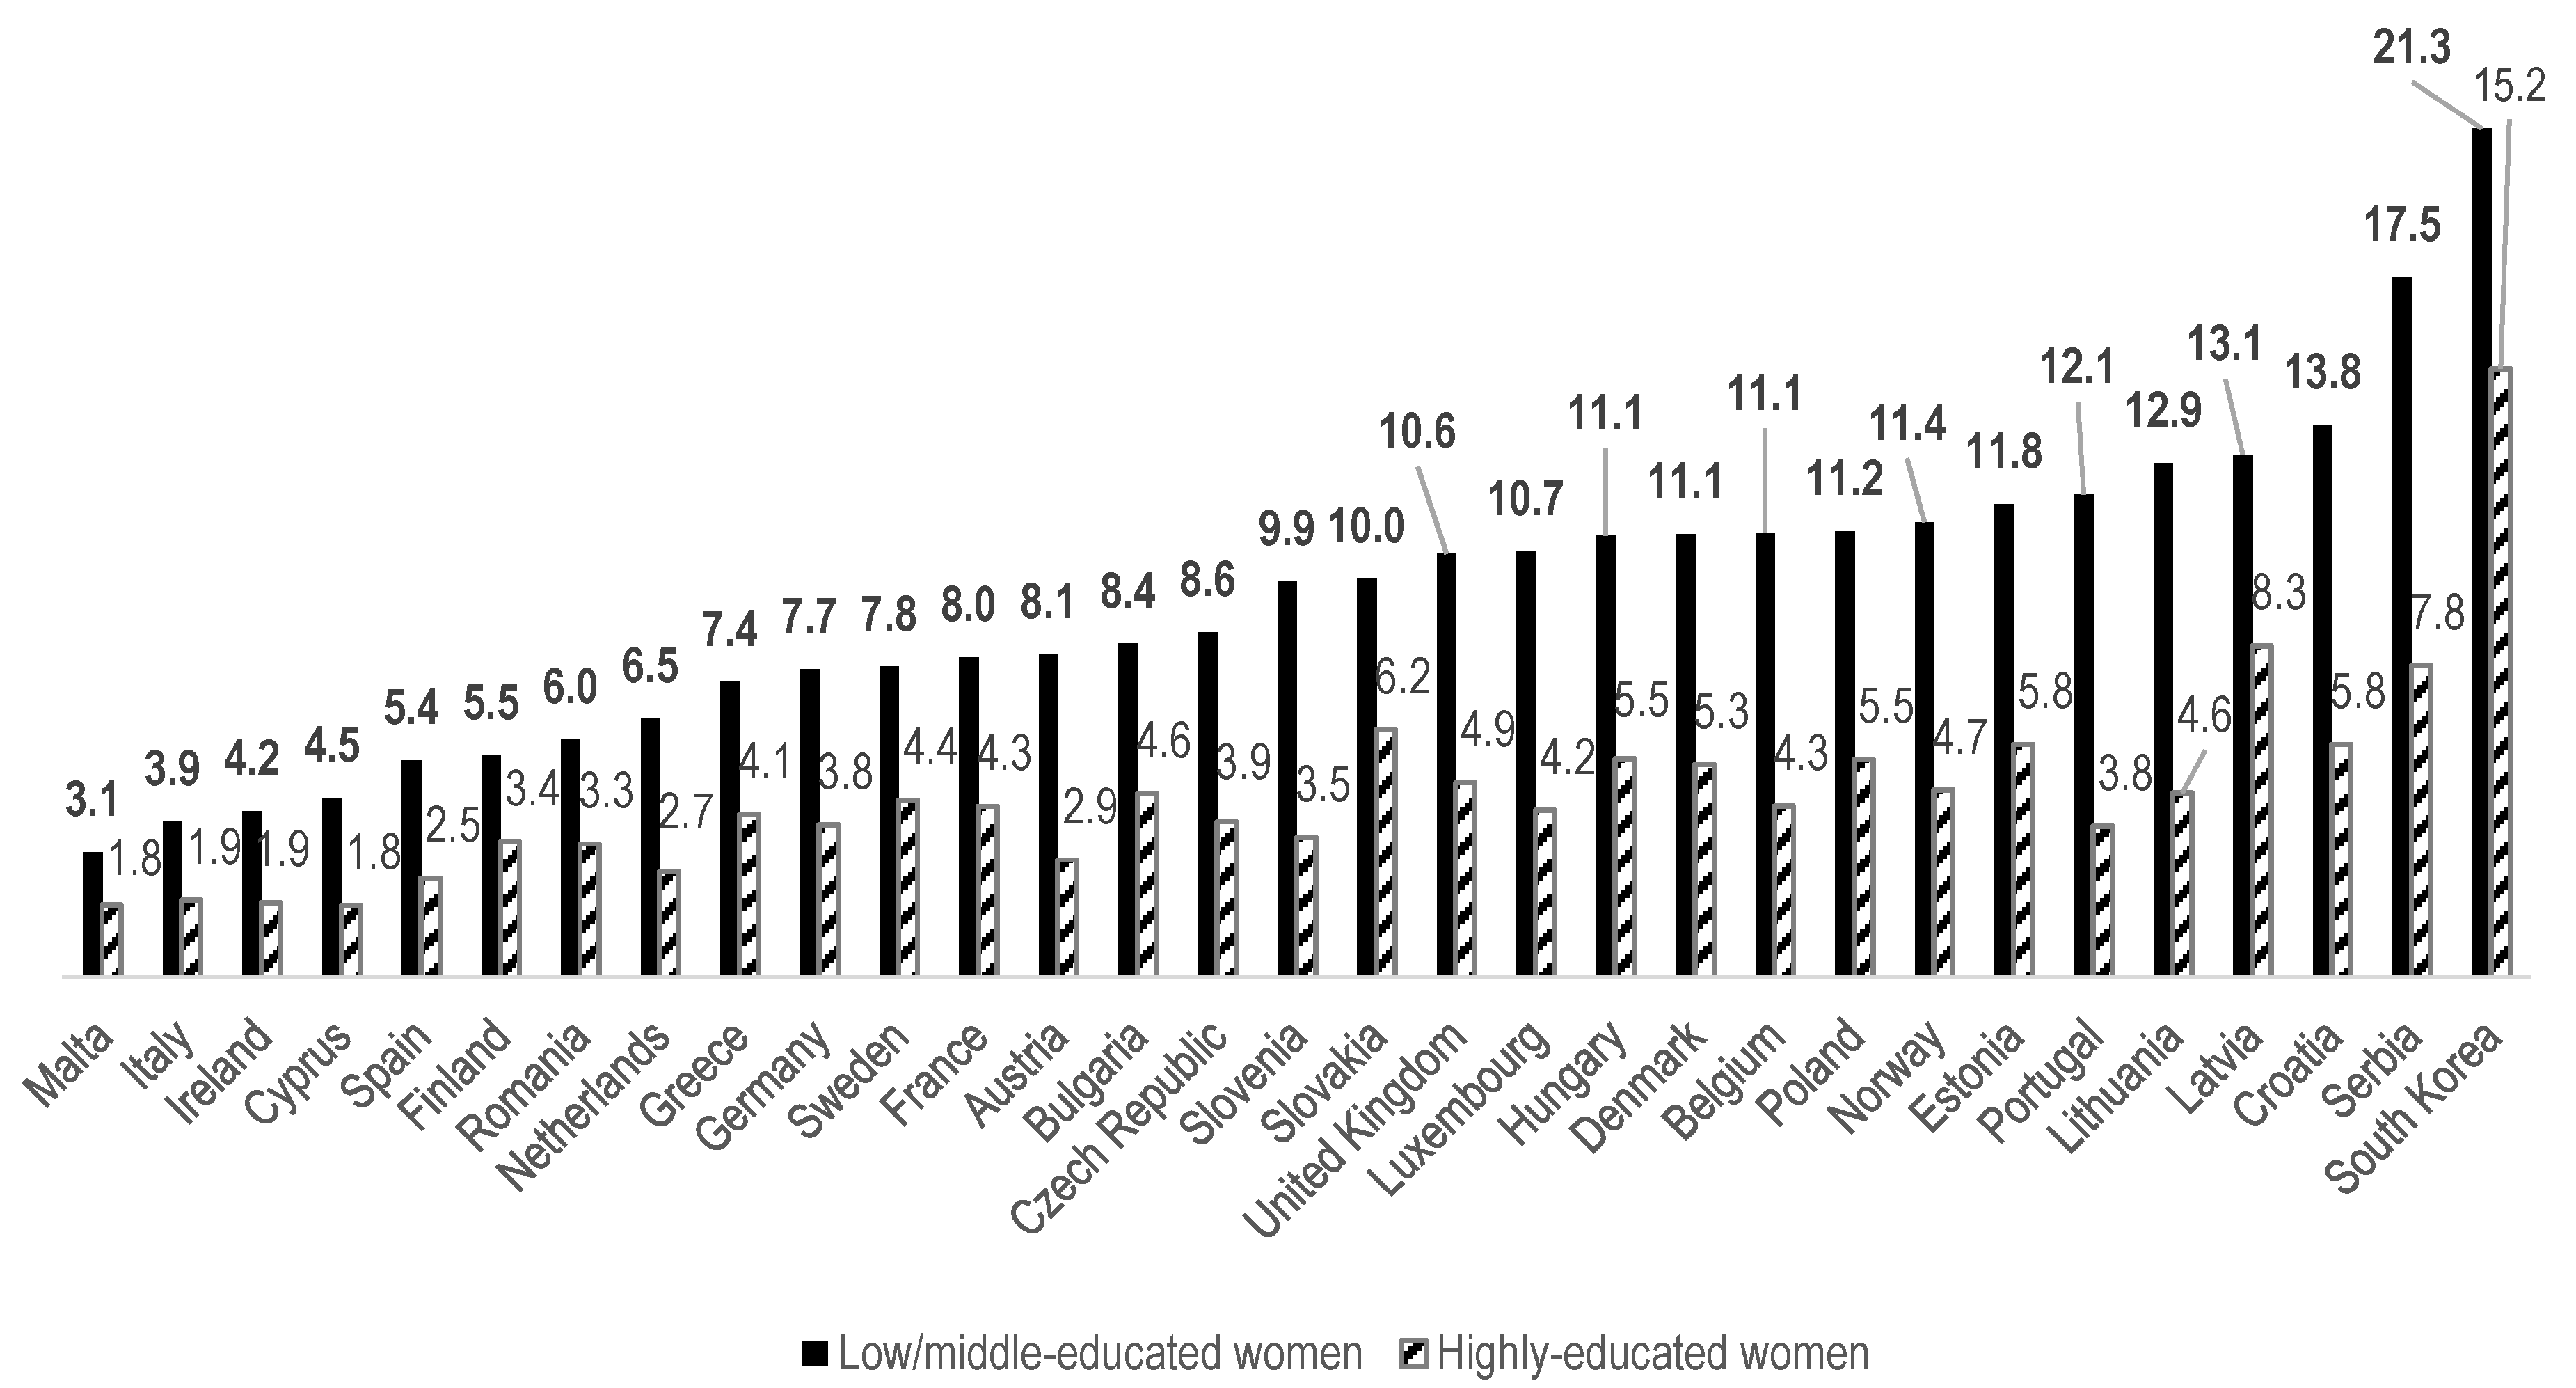
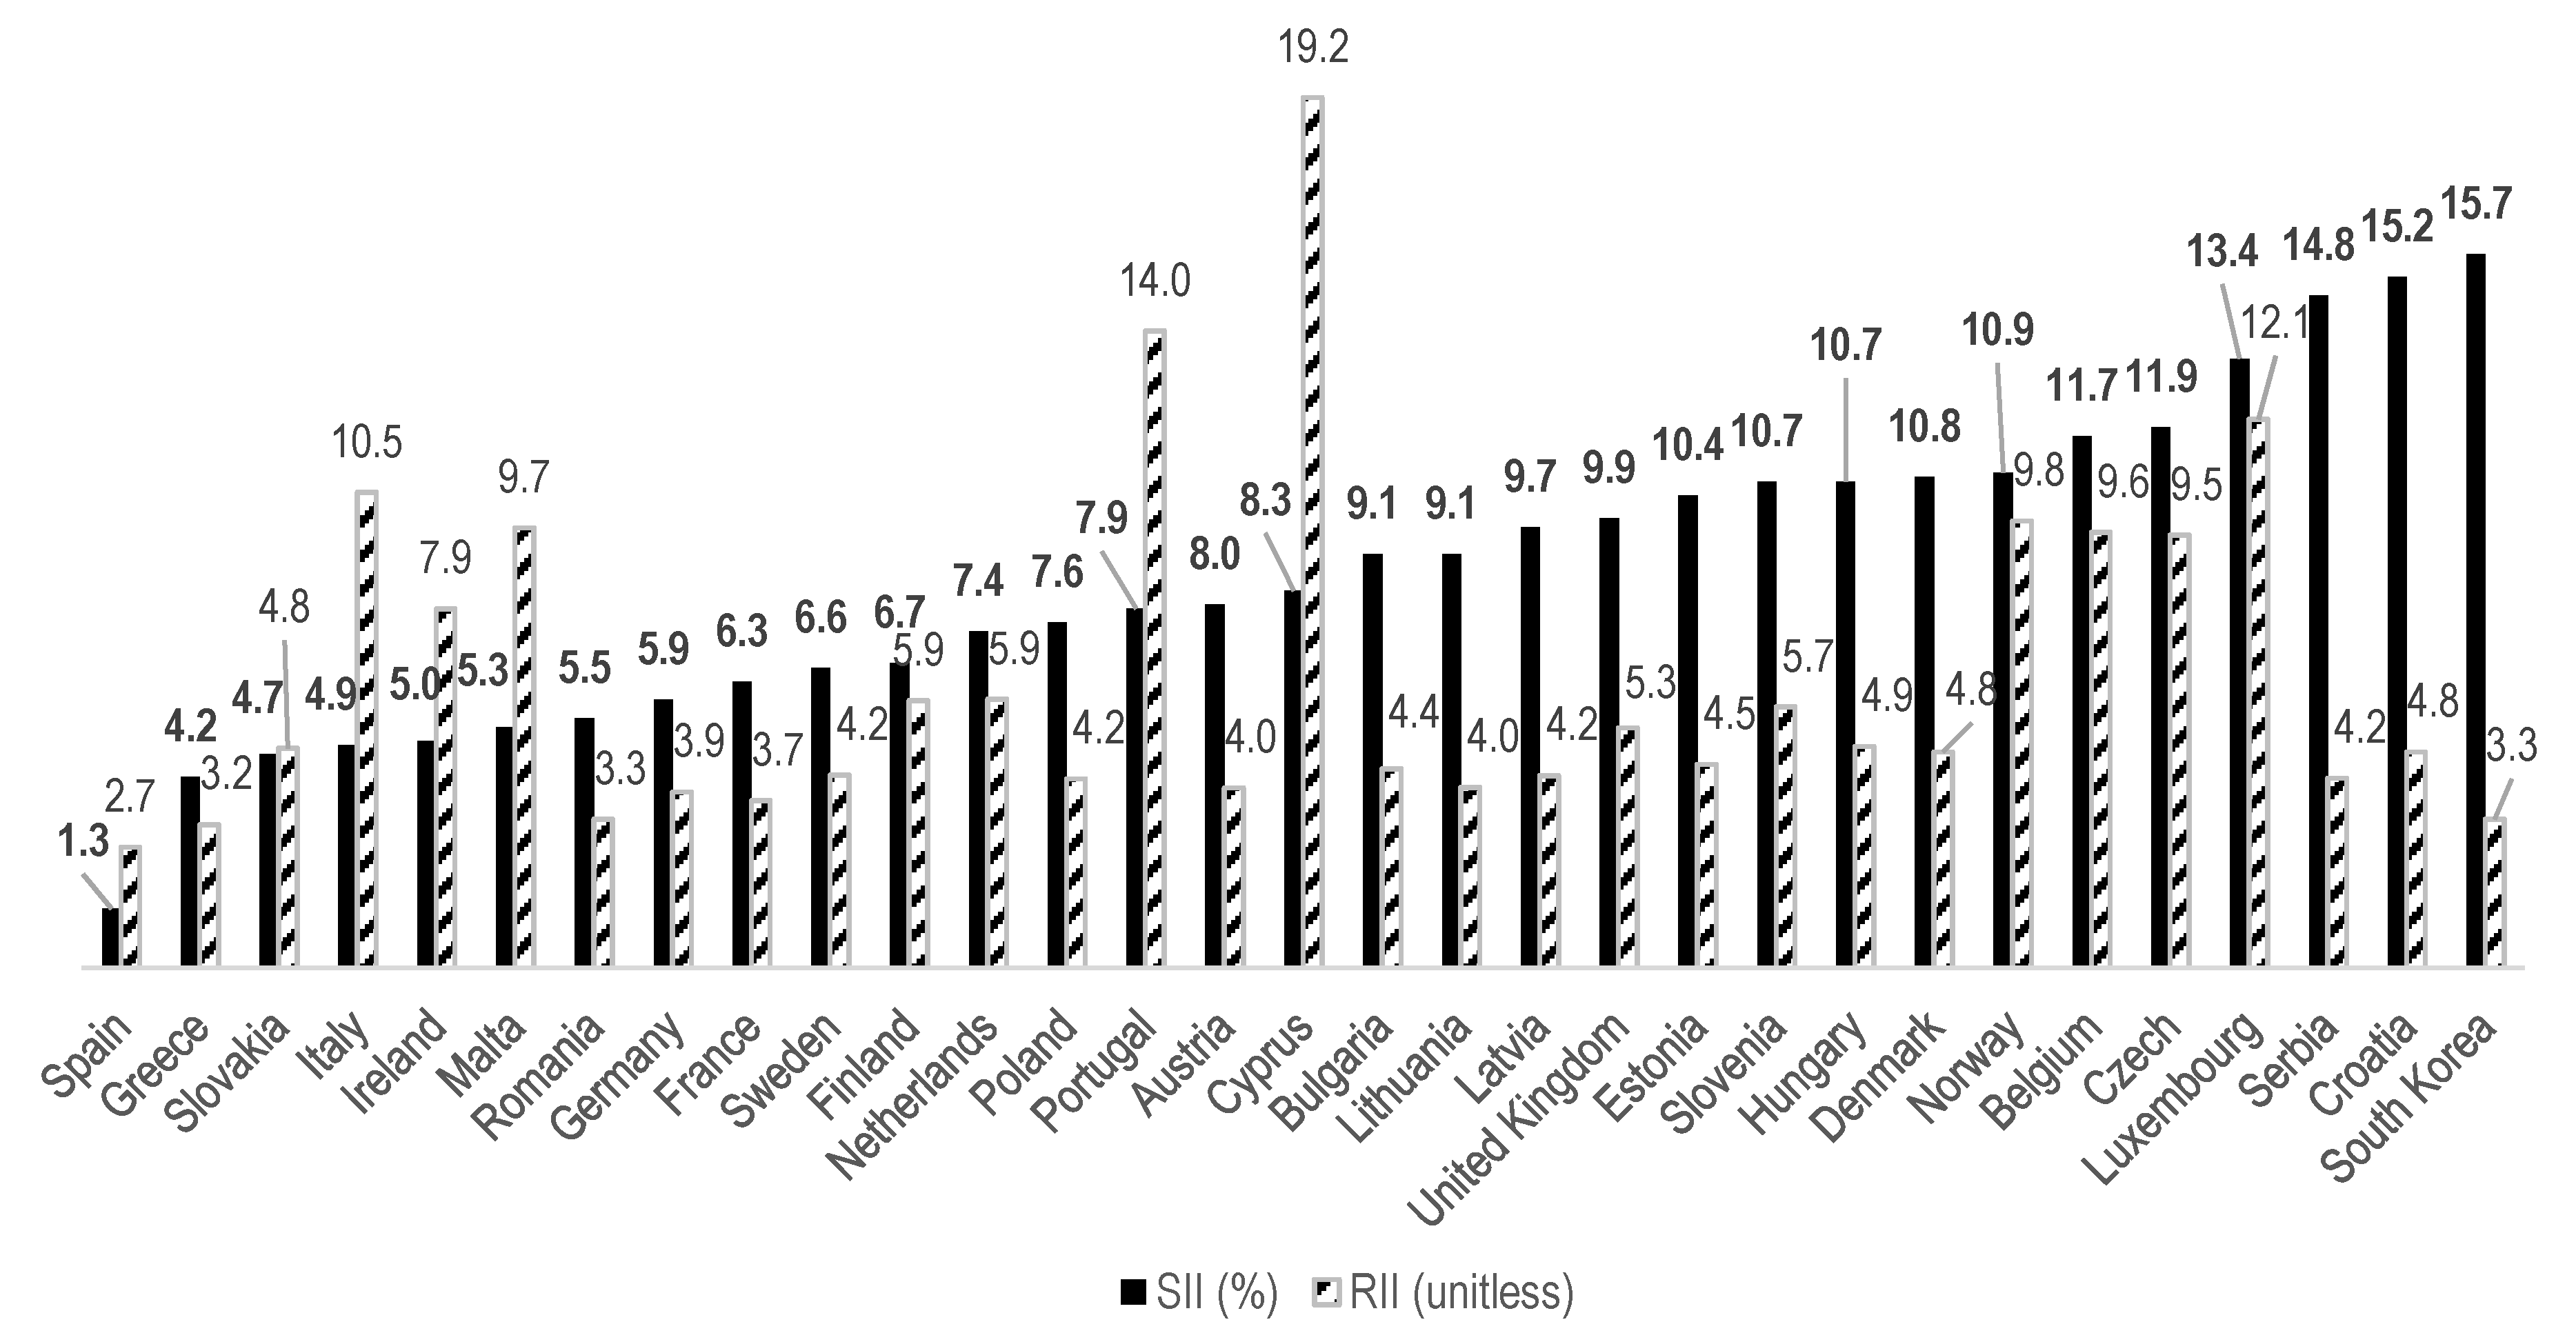
| Country | Response Rate 1 (%) | Men | Women | ||||||
|---|---|---|---|---|---|---|---|---|---|
| Number of Respondents | Mean Age | Low/ Middle- Educated (%) | Highly Educated (%) | Number of Respondents | Mean Age | Low/ Middle- Educated (%) | Highly Educated (%) | ||
| Austria | 72.2 | 4825 | 50.9 | 63.2 | 36.8 | 5422 | 51.6 | 71.5 | 28.5 |
| Belgium | 59.2 | 4883 | 49.9 | 62.8 | 37.2 | 5286 | 50.5 | 61.1 | 38.9 |
| Bulgaria | 85.0 | 6879 | 52.4 | 82.8 | 17.2 | 7909 | 55.9 | 76.6 | 23.4 |
| Croatia | 63.7 | 7761 | 52.0 | 84.0 | 16.0 | 8637 | 54.4 | 83.1 | 16.9 |
| Cyprus | 84.8 | 4219 | 50.0 | 70.7 | 29.3 | 4830 | 50.6 | 69.1 | 30.9 |
| Czech Republic | 75.4 | 4479 | 54.5 | 80.8 | 19.2 | 6847 | 55.5 | 81.9 | 18.1 |
| Denmark | 63.9 | 2701 | 55.4 | 66.0 | 34.0 | 2914 | 55.8 | 59.4 | 40.6 |
| Estonia | 78.2 | 3568 | 52.2 | 72.8 | 27.2 | 5179 | 54.3 | 60.3 | 39.7 |
| Finland | 76.2 | 4527 | 51.3 | 64.2 | 35.8 | 4447 | 52.1 | 54.6 | 45.4 |
| France | 74.6 | 8840 | 51.6 | 71.5 | 28.5 | 9870 | 52.7 | 69.6 | 30.5 |
| Germany | 77.3 | 10,413 | 52.9 | 58.3 | 41.8 | 11,642 | 52.7 | 72.1 | 27.9 |
| Greece | 87.7 | 21,451 | 53.4 | 77.3 | 22.7 | 23,025 | 54.7 | 78.9 | 21.1 |
| Hungary | 82.4 | 6600 | 51.5 | 83.8 | 16.2 | 8319 | 55.2 | 82.9 | 17.1 |
| Ireland | 57.0 | 4263 | 52.0 | 59.8 | 40.3 | 4640 | 52.1 | 59.1 | 40.9 |
| Italy | 74.1 | 18,598 | 52.4 | 84.6 | 15.5 | 20,653 | 54.4 | 84.5 | 15.5 |
| Latvia | 74.4 | 4319 | 50.7 | 79.4 | 20.7 | 6090 | 56.1 | 68.3 | 31.7 |
| Lithuania | 71.9 | 2509 | 54.0 | 74.2 | 25.8 | 4373 | 56.6 | 69.3 | 30.7 |
| Luxembourg | 48.5 | 3916 | 46.8 | 71.0 | 29.0 | 4101 | 46.9 | 71.3 | 28.7 |
| Malta | 84.1 | 4065 | 48.5 | 83.2 | 16.8 | 4233 | 50.3 | 82.9 | 17.1 |
| Netherlands | 51.9 | 5674 | 53.5 | 61.7 | 38.3 | 7104 | 54.1 | 66.3 | 33.7 |
| Norway | 53.5 | 2950 | 49.6 | 59.5 | 40.5 | 2834 | 50.4 | 53.2 | 46.8 |
| Poland | N.A. | 10,939 | 50.7 | 82.1 | 17.9 | 13,552 | 53.0 | 77.0 | 23.0 |
| Portugal | 86.0 | 11,204 | 51.7 | 87.5 | 12.5 | 13,125 | 53.4 | 81.7 | 18.3 |
| Romania | 92.6 | 7106 | 51.8 | 87.9 | 12.1 | 7829 | 54.1 | 88.0 | 12.0 |
| Serbia | N.A. | 6494 | 49.4 | 84.3 | 15.7 | 6966 | 51.7 | 83.8 | 16.3 |
| Slovakia | 84.1 | 6048 | 48.1 | 81.5 | 18.5 | 6948 | 51.1 | 78.5 | 21.5 |
| Slovenia | 68.1 | 3939 | 50.4 | 76.6 | 23.4 | 4441 | 52.7 | 70.9 | 29.1 |
| South Korea | 77.9 | 2543 | 51.5 | 57.9 | 42.2 | 3224 | 52.3 | 64.6 | 35.4 |
| Spain | 71.9 | 13,136 | 51.2 | 71.4 | 28.6 | 14,465 | 53.0 | 70.8 | 29.2 |
| Sweden | 50.8 | 2718 | 52.2 | 67.2 | 32.8 | 2790 | 52.8 | 55.3 | 44.7 |
| United Kingdom | 48.3 | 5678 | 55.8 | 59.6 | 40.4 | 6312 | 54.6 | 59.9 | 40.1 |
| Country | Low/ Middle- Educated * | Highly Educated | SII (%) | (95% CI) | Rank of SII | RII | (95% CI) | Rank of RII |
|---|---|---|---|---|---|---|---|---|
| Italy | 3.4 | 0.9 | 4.9% | (3.5–6.3%) | 4 | 10.46 | (5.35–20.47) | 28 |
| Malta | 3.6 | 1.3 | 5.3% | (−1.7–12.3%) | 6 | 9.68 | (2.25–41.53) | 26 |
| Ireland | 3.9 | 1.3 | 5.0% | (3.1–7.0%) | 5 | 7.90 | (3.36–18.58) | 23 |
| Spain | 4.7 | 3.0 | 1.3% | (0.2–2.3%) | 1 | 2.66 | (1.81–3.91) | 1 |
| Romania | 4.9 | 2.8 | 5.5% | (0.8–10.2%) | 7 | 3.27 | (1.46–7.29) | 3 |
| Finland | 5.8 | 2.3 | 6.7% | (3.7–9.8%) | 11 | 5.88 | (3.05–11.32) | 21 |
| Cyprus | 5.9 | 1.4 | 8.3% | (3.7–12.8%) | 16 | 19.15 | (7.11–51.56) | 31 |
| Netherlands | 5.9 | 2.4 | 7.4% | (4.6–10.1%) | 12 | 5.91 | (3.35–10.44) | 22 |
| Sweden | 6.0 | 2.8 | 6.6% | (3.5–9.7%) | 10 | 4.24 | (1.72–10.47) | 12 |
| Austria | 6.9 | 3.3 | 8.0% | (4.7–11.4%) | 15 | 3.96 | (2.38–6.59) | 7 |
| Greece | 7.1 | 3.7 | 4.2% | (3.4–5.0%) | 2 | 3.15 | (2.44–4.06) | 2 |
| France | 7.3 | 3.7 | 6.3% | (4.6–8.0%) | 9 | 3.68 | (2.41–5.64) | 5 |
| Germany | 7.8 | 3.6 | 5.9% | (4.2–7.7%) | 8 | 3.87 | (2.82–5.29) | 6 |
| Norway | 7.9 | 2.3 | 10.9% | (6.2–15.5%) | 25 | 9.83 | (4.34–22.25) | 27 |
| Belgium | 8.1 | 2.5 | 11.7% | (8.1%15.3%) | 26 | 9.58 | (5.45–16.85) | 25 |
| Bulgaria | 8.4 | 3.6 | 9.1% | (5.6–12.7%) | 17 | 4.38 | (2.71–7.08) | 13 |
| Czech Republic | 8.6 | 2.5 | 11.9% | (5.6–18.1%) | 27 | 9.52 | (4.67–19.38) | 24 |
| Slovenia | 8.7 | 3.9 | 10.7% | (5.3–16.1%) | 22 | 5.74 | (3.19–10.31) | 20 |
| Denmark | 9.3 | 3.9 | 10.8% | (7.0–14.6%) | 24 | 4.75 | (2.46–9.15) | 15 |
| Portugal | 9.5 | 2.4 | 7.9% | (6.4–9.4%) | 14 | 14.01 | (7.86–24.97) | 30 |
| United Kingdom | 9.5 | 4.0 | 9.9% | (7.1–12.6%) | 20 | 5.28 | (3.49–7.98) | 19 |
| Luxembourg | 9.6 | 2.6 | 13.4% | (6.8–20.0%) | 28 | 12.07 | (6.05–24.07) | 29 |
| Slovakia | 9.8 | 4.3 | 4.7% | (3.1–6.3%) | 3 | 4.83 | (2.77–8.44) | 17 |
| Hungary | 10.0 | 3.9 | 10.7% | (7.5–13.9%) | 22 | 4.87 | (3.12–7.62) | 18 |
| Lithuania | 10.0 | 4.6 | 9.1% | (2.4–15.8%) | 17 | 3.97 | (2.17–7.27) | 8 |
| Poland | 11.3 | 4.9 | 7.6% | (6.0–9.2%) | 13 | 4.16 | (2.96–5.87) | 9 |
| Estonia | 12.0 | 4.6 | 10.4% | (7.6–13.3%) | 21 | 4.48 | (2.90–6.93) | 14 |
| Latvia | 12.9 | 5.7 | 9.7% | (6.3–13.2%) | 19 | 4.23 | (2.71–6.59) | 11 |
| Serbia | 14.3 | 6.1 | 14.8% | (8.7–20.8%) | 29 | 4.17 | (2.93–5.92) | 10 |
| Croatia | 14.7 | 6.2 | 15.2% | (11.3–19.0%) | 30 | 4.75 | (3.38–6.69) | 15 |
| South Korea | 18.6 | 9.8 | 15.7% | (9.9–21.5%) | 31 | 3.27 | (2.15–4.99) | 3 |
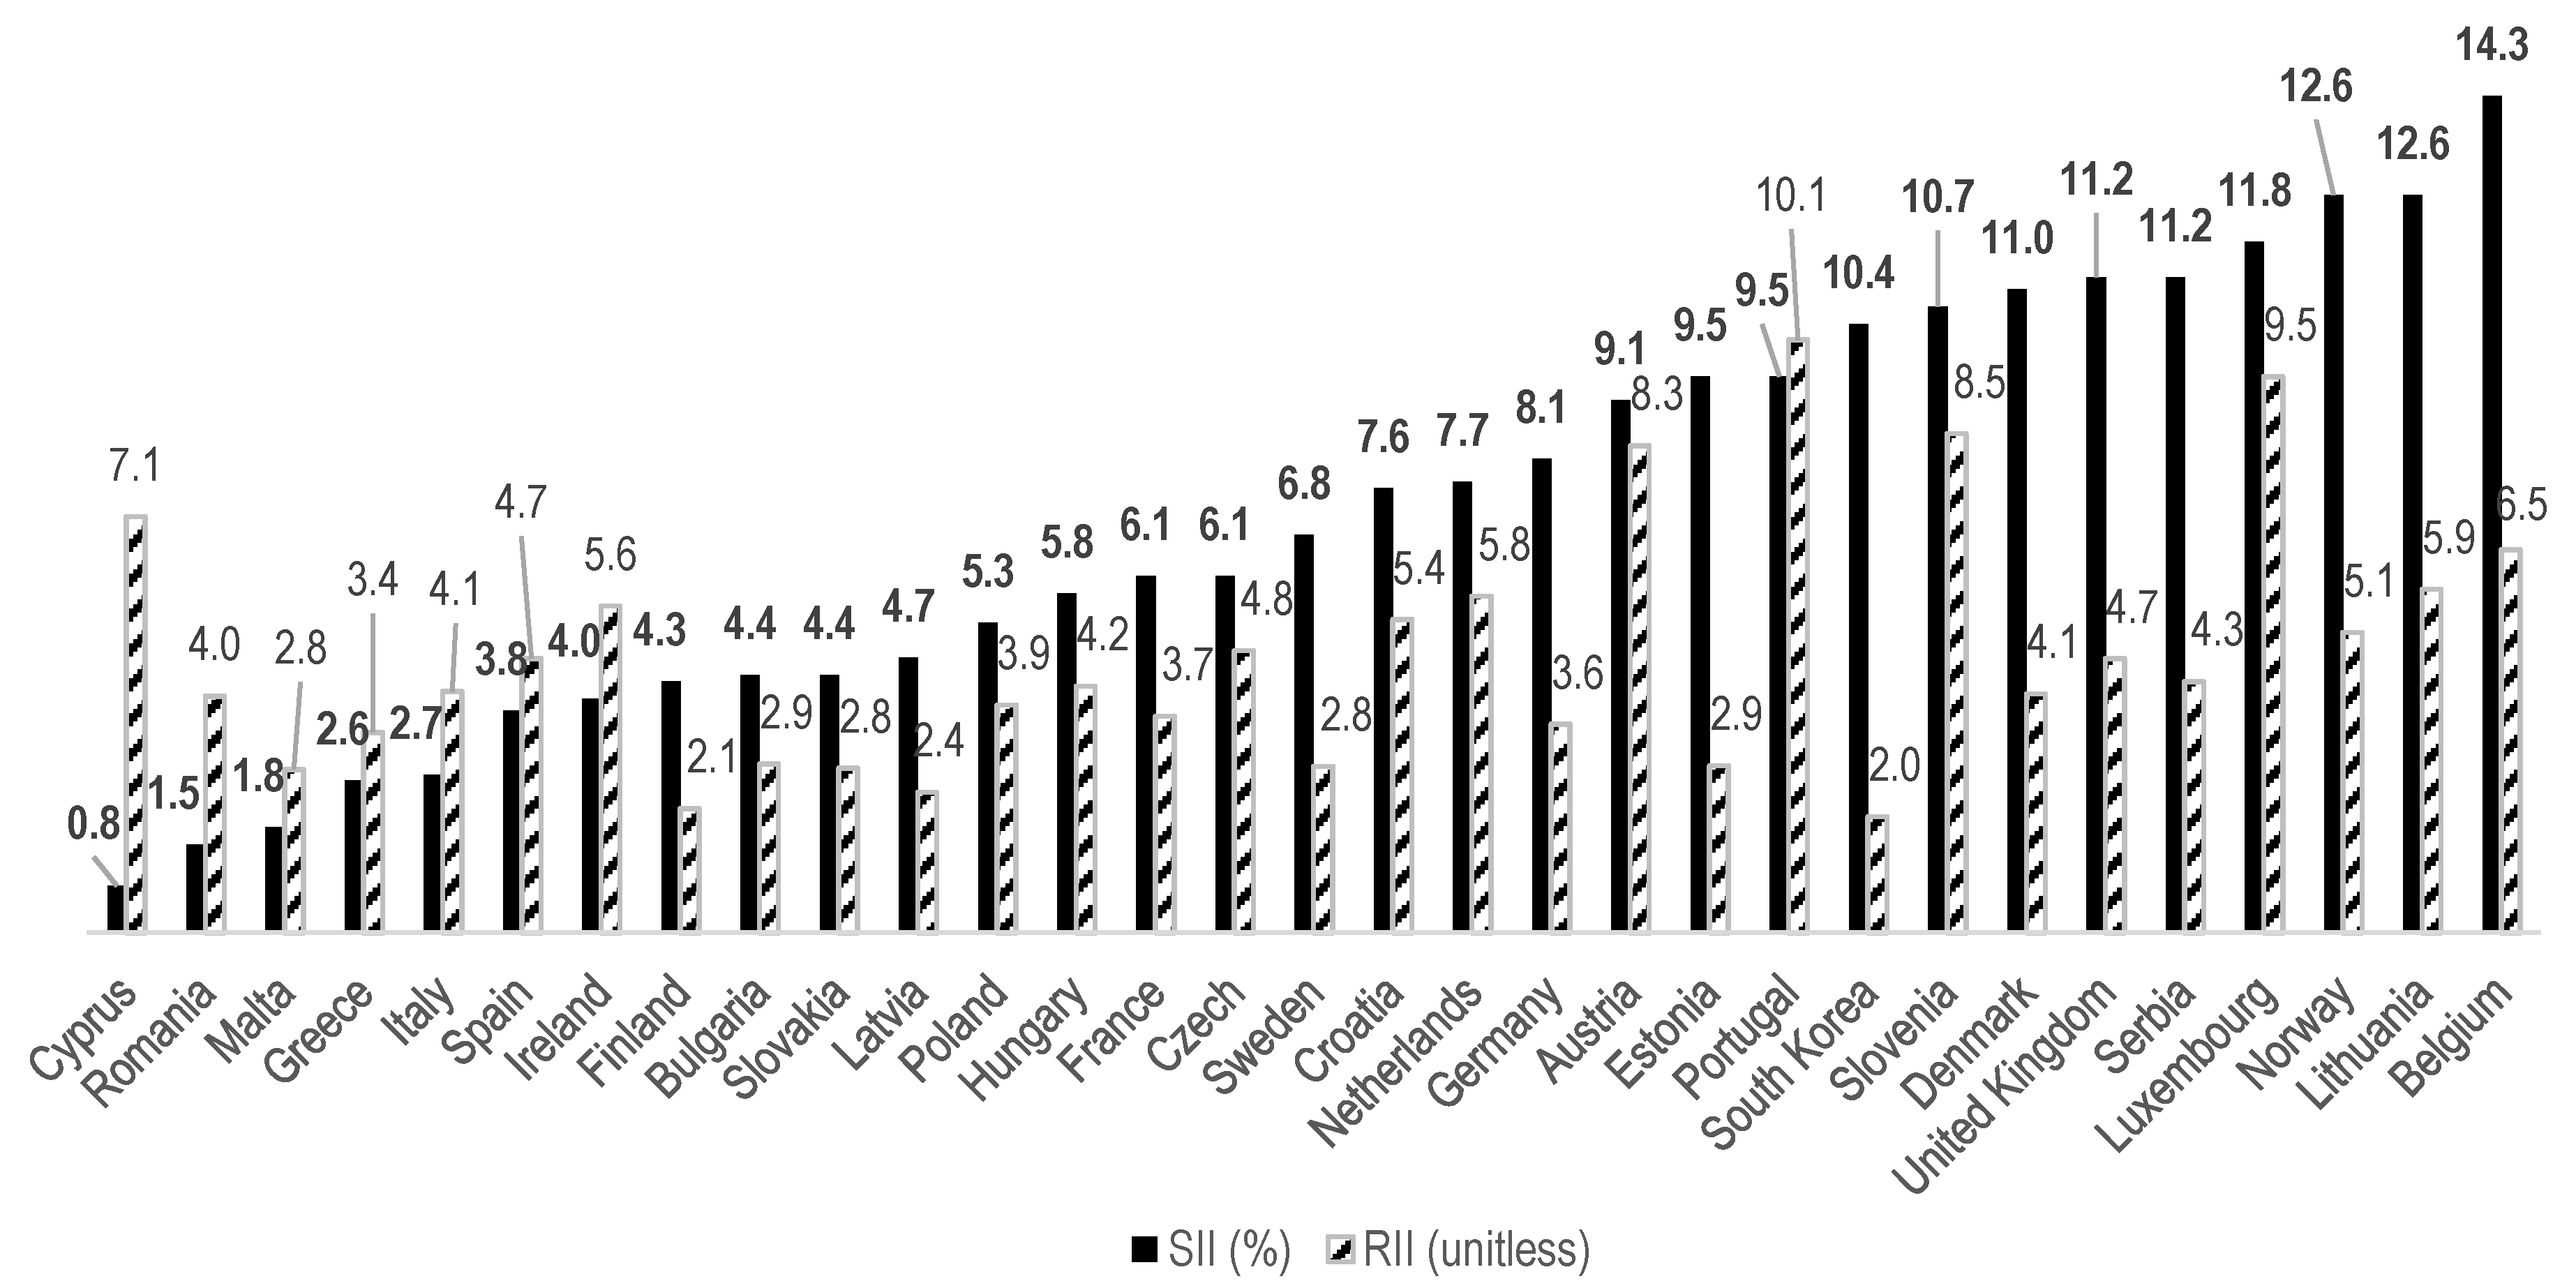
| Country | Low/ Middle- Educated * | Highly Educated | SII (%) | (95% CI) | Rank of SII | RII | (95% CI) | Rank of RII |
|---|---|---|---|---|---|---|---|---|
| Malta | 3.1 | 1.8 | 1.8% | (−1.6–5.2%) | 3 | 2.79 | (0.73–10.63) | 4 |
| Italy | 3.9 | 1.9 | 2.7% | (1.9–3.5%) | 5 | 4.12 | (2.47–6.87) | 15 |
| Ireland | 4.2 | 1.9 | 4.0% | (1.9–6.1%) | 7 | 5.58 | (2.64–11.81) | 23 |
| Cyprus | 4.5 | 1.8 | 0.8% | (−0.7–2.3%) | 1 | 7.11 | (2.63–19.21) | 27 |
| Spain | 5.4 | 2.5 | 3.8% | (2.5–5.2%) | 6 | 4.68 | (3.06–7.16) | 18 |
| Finland | 5.5 | 3.4 | 4.3% | (1.8–6.7%) | 8 | 2.12 | (1.22–3.71) | 2 |
| Romania | 6 | 3.3 | 1.5% | (0.6–2.4%) | 2 | 4.04 | (1.78–9.17) | 13 |
| Netherlands | 6.5 | 2.7 | 7.7% | (4.8–10.5%) | 18 | 5.75 | (3.37–9.80) | 24 |
| Greece | 7.4 | 4.1 | 2.6% | (1.8–3.4%) | 4 | 3.42 | (2.54–4.60) | 9 |
| Germany | 7.7 | 3.8 | 8.1% | (5.8–10.3%) | 19 | 3.56 | (2.41–5.25) | 10 |
| Sweden | 7.8 | 4.4 | 6.8% | (3.0–10.6%) | 16 | 2.84 | (1.51–5.34) | 6 |
| France | 8 | 4.3 | 6.1% | (4.1–8.1%) | 14 | 3.7 | (2.56–5.34) | 11 |
| Austria | 8.1 | 2.9 | 9.1% | (6.8–11.4%) | 20 | 8.32 | (4.38–15.79) | 28 |
| Bulgaria | 8.4 | 4.6 | 4.4% | (2.8–6.0%) | 9 | 2.88 | (2.04–4.08) | 8 |
| Czech Republic | 8.6 | 3.9 | 6.1% | (3.9–8.3%) | 14 | 4.82 | (2.80–8.31) | 20 |
| Slovenia | 9.9 | 3.5 | 10.7% | (7.7–13.8%) | 24 | 8.53 | (4.86–14.98) | 29 |
| Slovakia | 10 | 6.2 | 4.4% | (2.8–6.1%) | 9 | 2.81 | (1.78–4.45) | 5 |
| United Kingdom | 10.6 | 4.9 | 11.2% | (8.4–14.0%) | 26 | 4.68 | (3.23–6.78) | 18 |
| Luxembourg | 10.7 | 4.2 | 11.8% | (8.3–15.4%) | 28 | 9.5 | (4.98–18.09) | 30 |
| Belgium | 11.1 | 4.3 | 14.3% | (10.4–18.1%) | 31 | 6.54 | (4.22–10.14) | 26 |
| Denmark | 11.1 | 5.3 | 11.0% | (7.0–15.0%) | 25 | 4.08 | (2.40–6.95) | 14 |
| Hungary | 11.1 | 5.5 | 5.8% | (3.7–7.9%) | 13 | 4.21 | (2.93–6.07) | 16 |
| Poland | 11.2 | 5.5 | 5.3% | (3.7–6.9%) | 12 | 3.89 | (2.90–5.22) | 12 |
| Norway | 11.4 | 4.7 | 12.6% | (8.5–16.8%) | 29 | 5.13 | (2.80–9.39) | 21 |
| Estonia | 11.8 | 5.8 | 9.5% | (6.6–12.4%) | 21 | 2.85 | (2.15–3.78) | 7 |
| Portugal | 12.1 | 3.8 | 9.5% | (7.5–11.6%) | 21 | 10.13 | (6.93–14.81) | 31 |
| Lithuania | 12.9 | 4.6 | 12.6% | (8.0–17.2%) | 29 | 5.87 | (3.90–8.83) | 25 |
| Latvia | 13.1 | 8.3 | 4.7% | (1.8–7.5%) | 11 | 2.4 | (1.86–3.10) | 3 |
| Croatia | 13.8 | 5.8 | 7.6% | (5.3–9.9%) | 17 | 5.35 | (3.70–7.74) | 22 |
| Serbia | 17.5 | 7.8 | 11.2% | (8.0–14.3%) | 26 | 4.29 | (3.05–6.03) | 17 |
| South Korea | 21.3 | 15.2 | 10.4% | (4.4–16.4%) | 23 | 1.98 | (1.38–2.85) | 1 |
© 2020 by the authors. Licensee MDPI, Basel, Switzerland. This article is an open access article distributed under the terms and conditions of the Creative Commons Attribution (CC BY) license (http://creativecommons.org/licenses/by/4.0/).
Share and Cite
Kim, M.; Khang, Y.-H.; Kang, H.-Y.; Lim, H.-K. Educational Inequalities in Self-Rated Health in Europe and South Korea. Int. J. Environ. Res. Public Health 2020, 17, 4504. https://doi.org/10.3390/ijerph17124504
Kim M, Khang Y-H, Kang H-Y, Lim H-K. Educational Inequalities in Self-Rated Health in Europe and South Korea. International Journal of Environmental Research and Public Health. 2020; 17(12):4504. https://doi.org/10.3390/ijerph17124504
Chicago/Turabian StyleKim, Minhye, Young-Ho Khang, Hee-Yeon Kang, and Hwa-Kyung Lim. 2020. "Educational Inequalities in Self-Rated Health in Europe and South Korea" International Journal of Environmental Research and Public Health 17, no. 12: 4504. https://doi.org/10.3390/ijerph17124504
APA StyleKim, M., Khang, Y.-H., Kang, H.-Y., & Lim, H.-K. (2020). Educational Inequalities in Self-Rated Health in Europe and South Korea. International Journal of Environmental Research and Public Health, 17(12), 4504. https://doi.org/10.3390/ijerph17124504


