Temporomandibular Joints’ Morphology and Osteoarthritic Changes in Cone-Beam Computed Tomography Images in Patients with and without Reciprocal Clicking—A Case Control Study


Abstract
1. Introduction
2. Materials and Methods
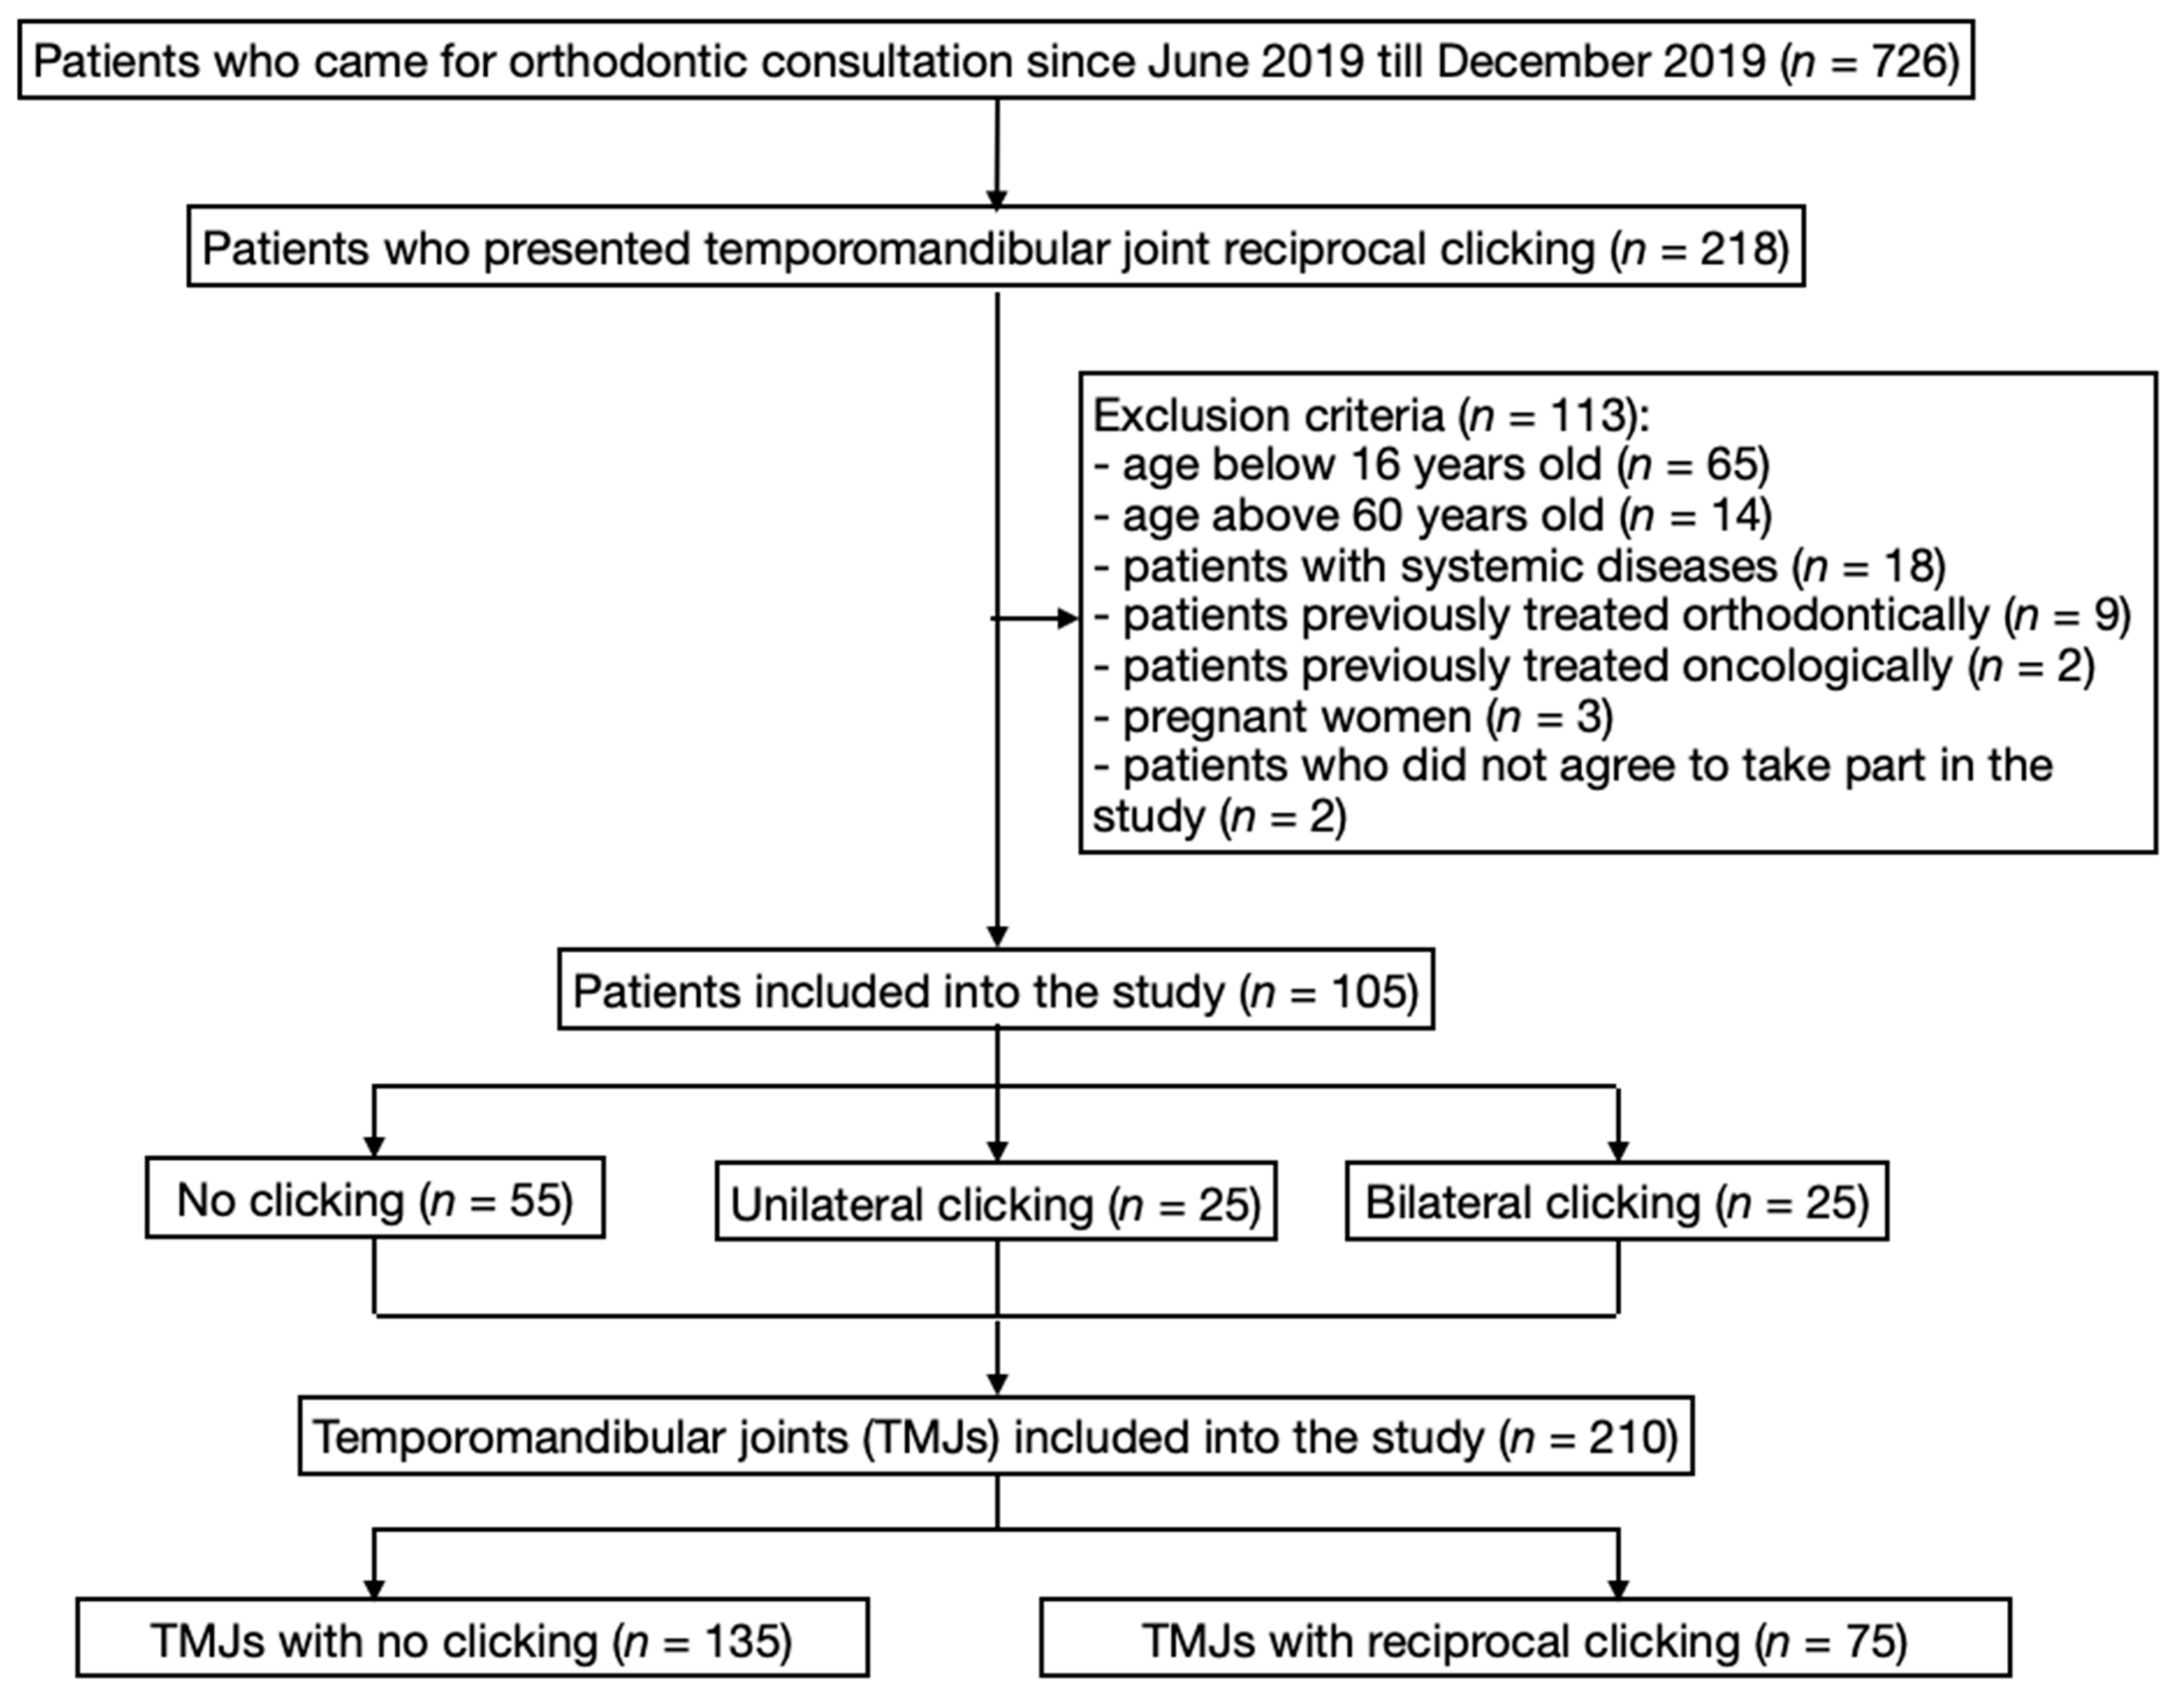
2.1. Participants
2.2. Protocol
2.3. Imaging Procedures
2.4. Measurements
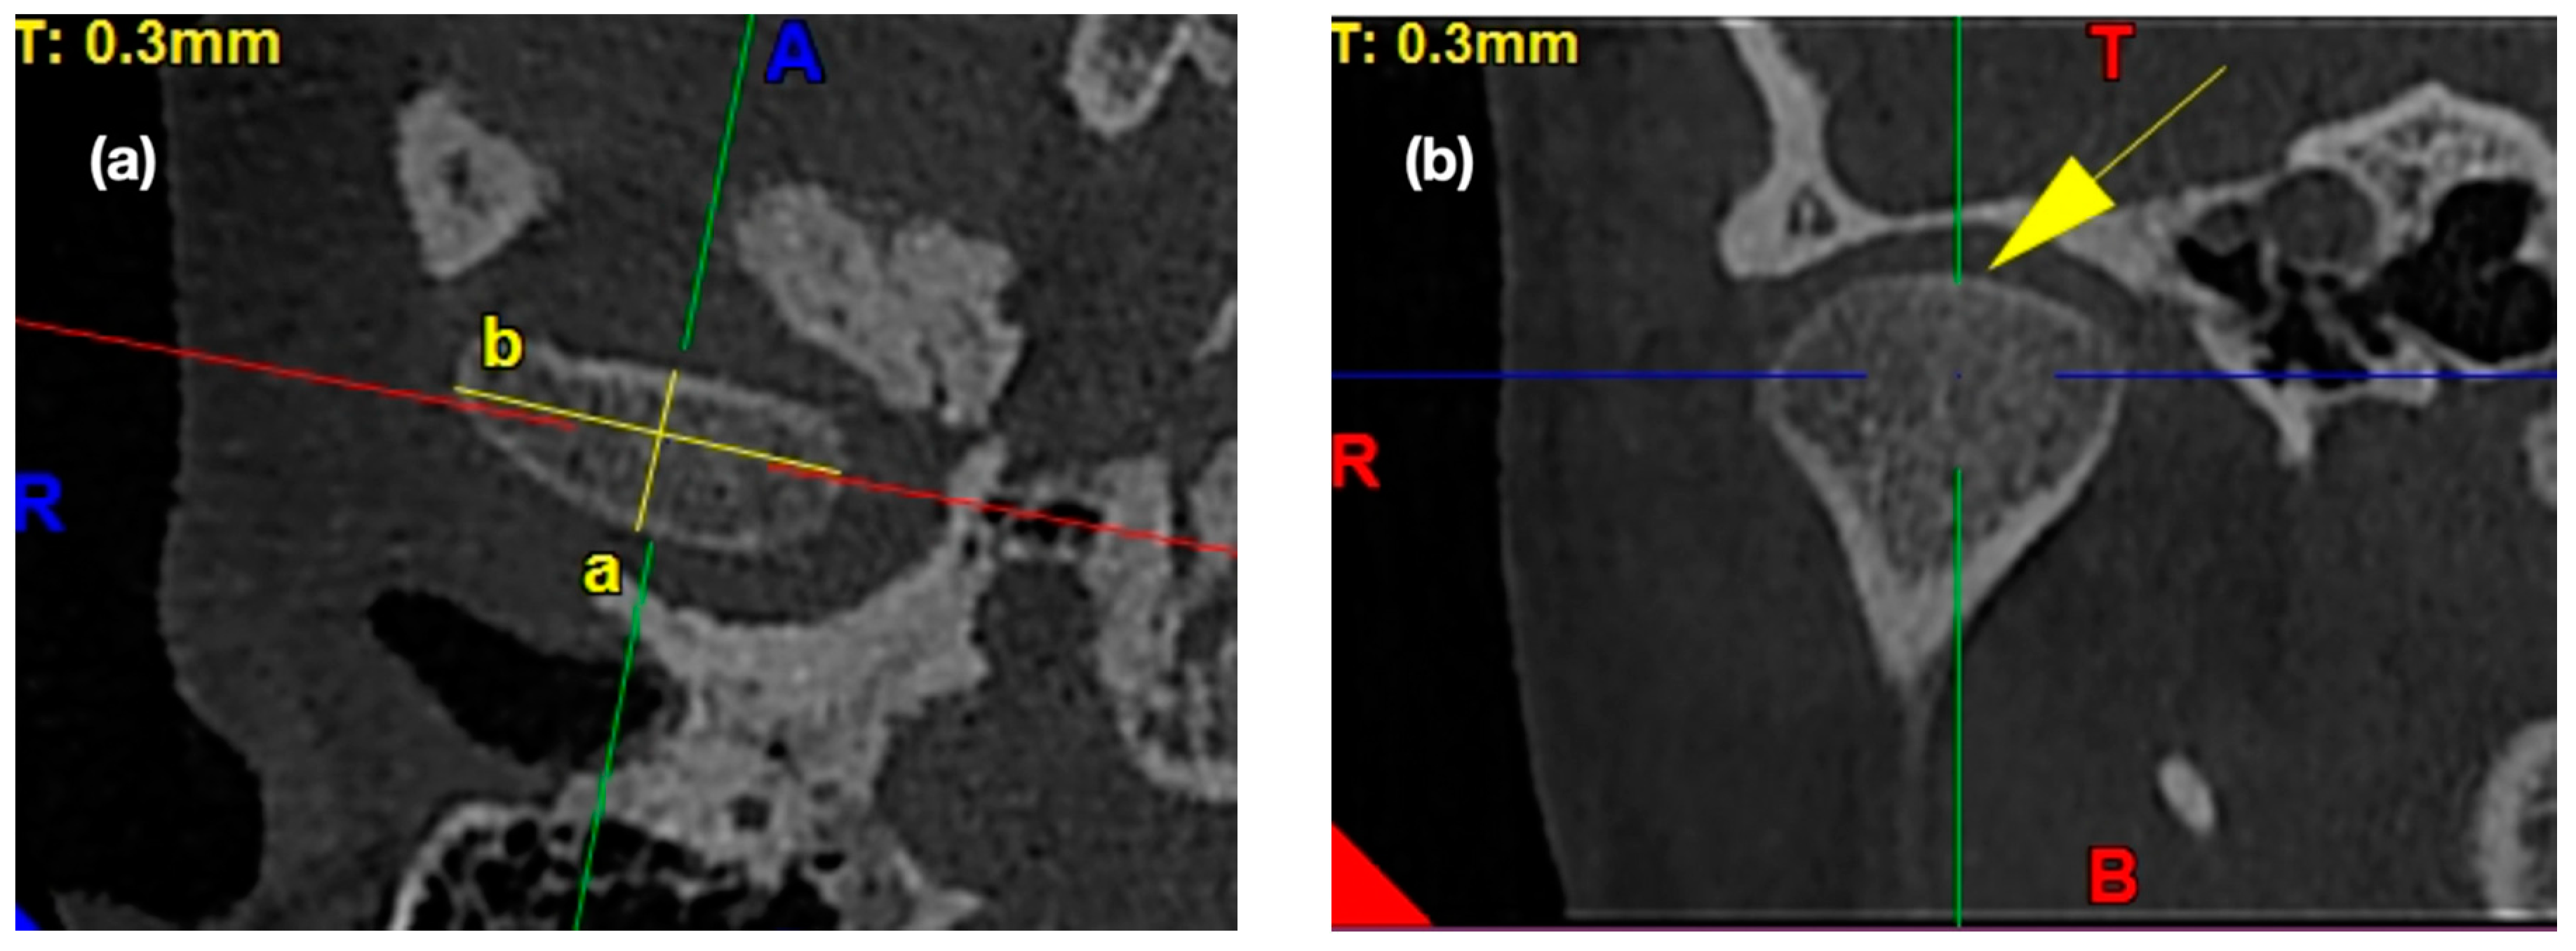
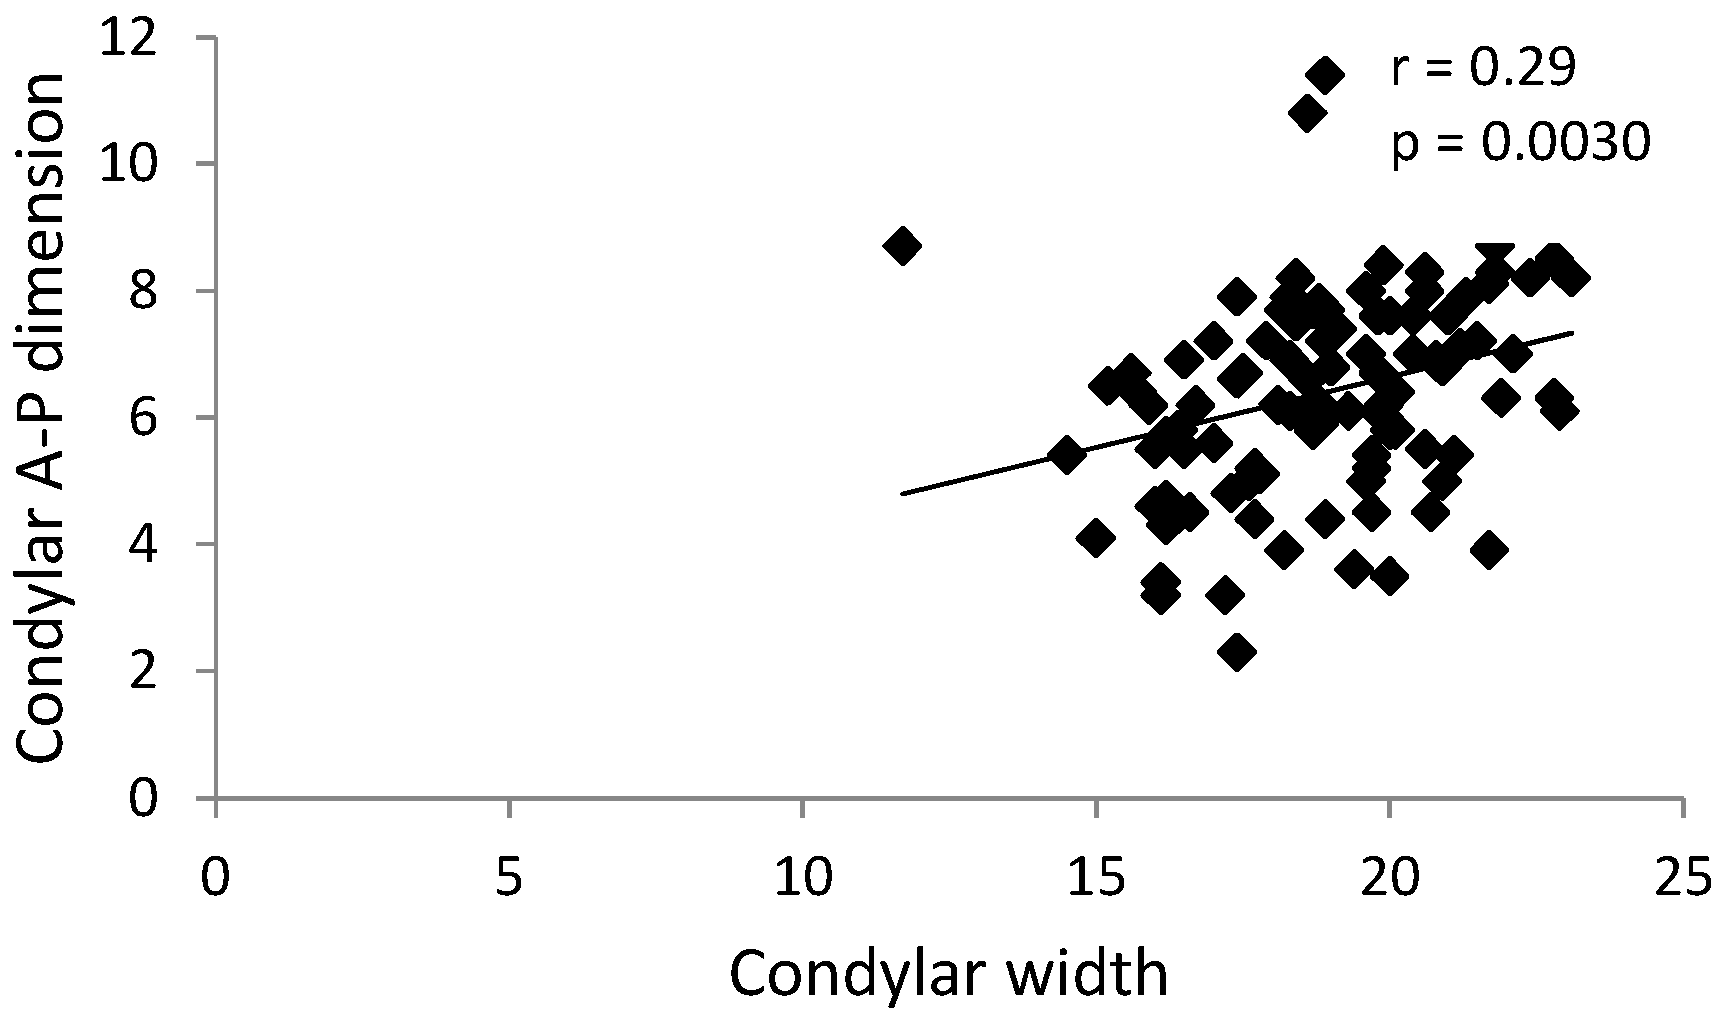
2.4.1. Morphology of the Mandibular Condyle
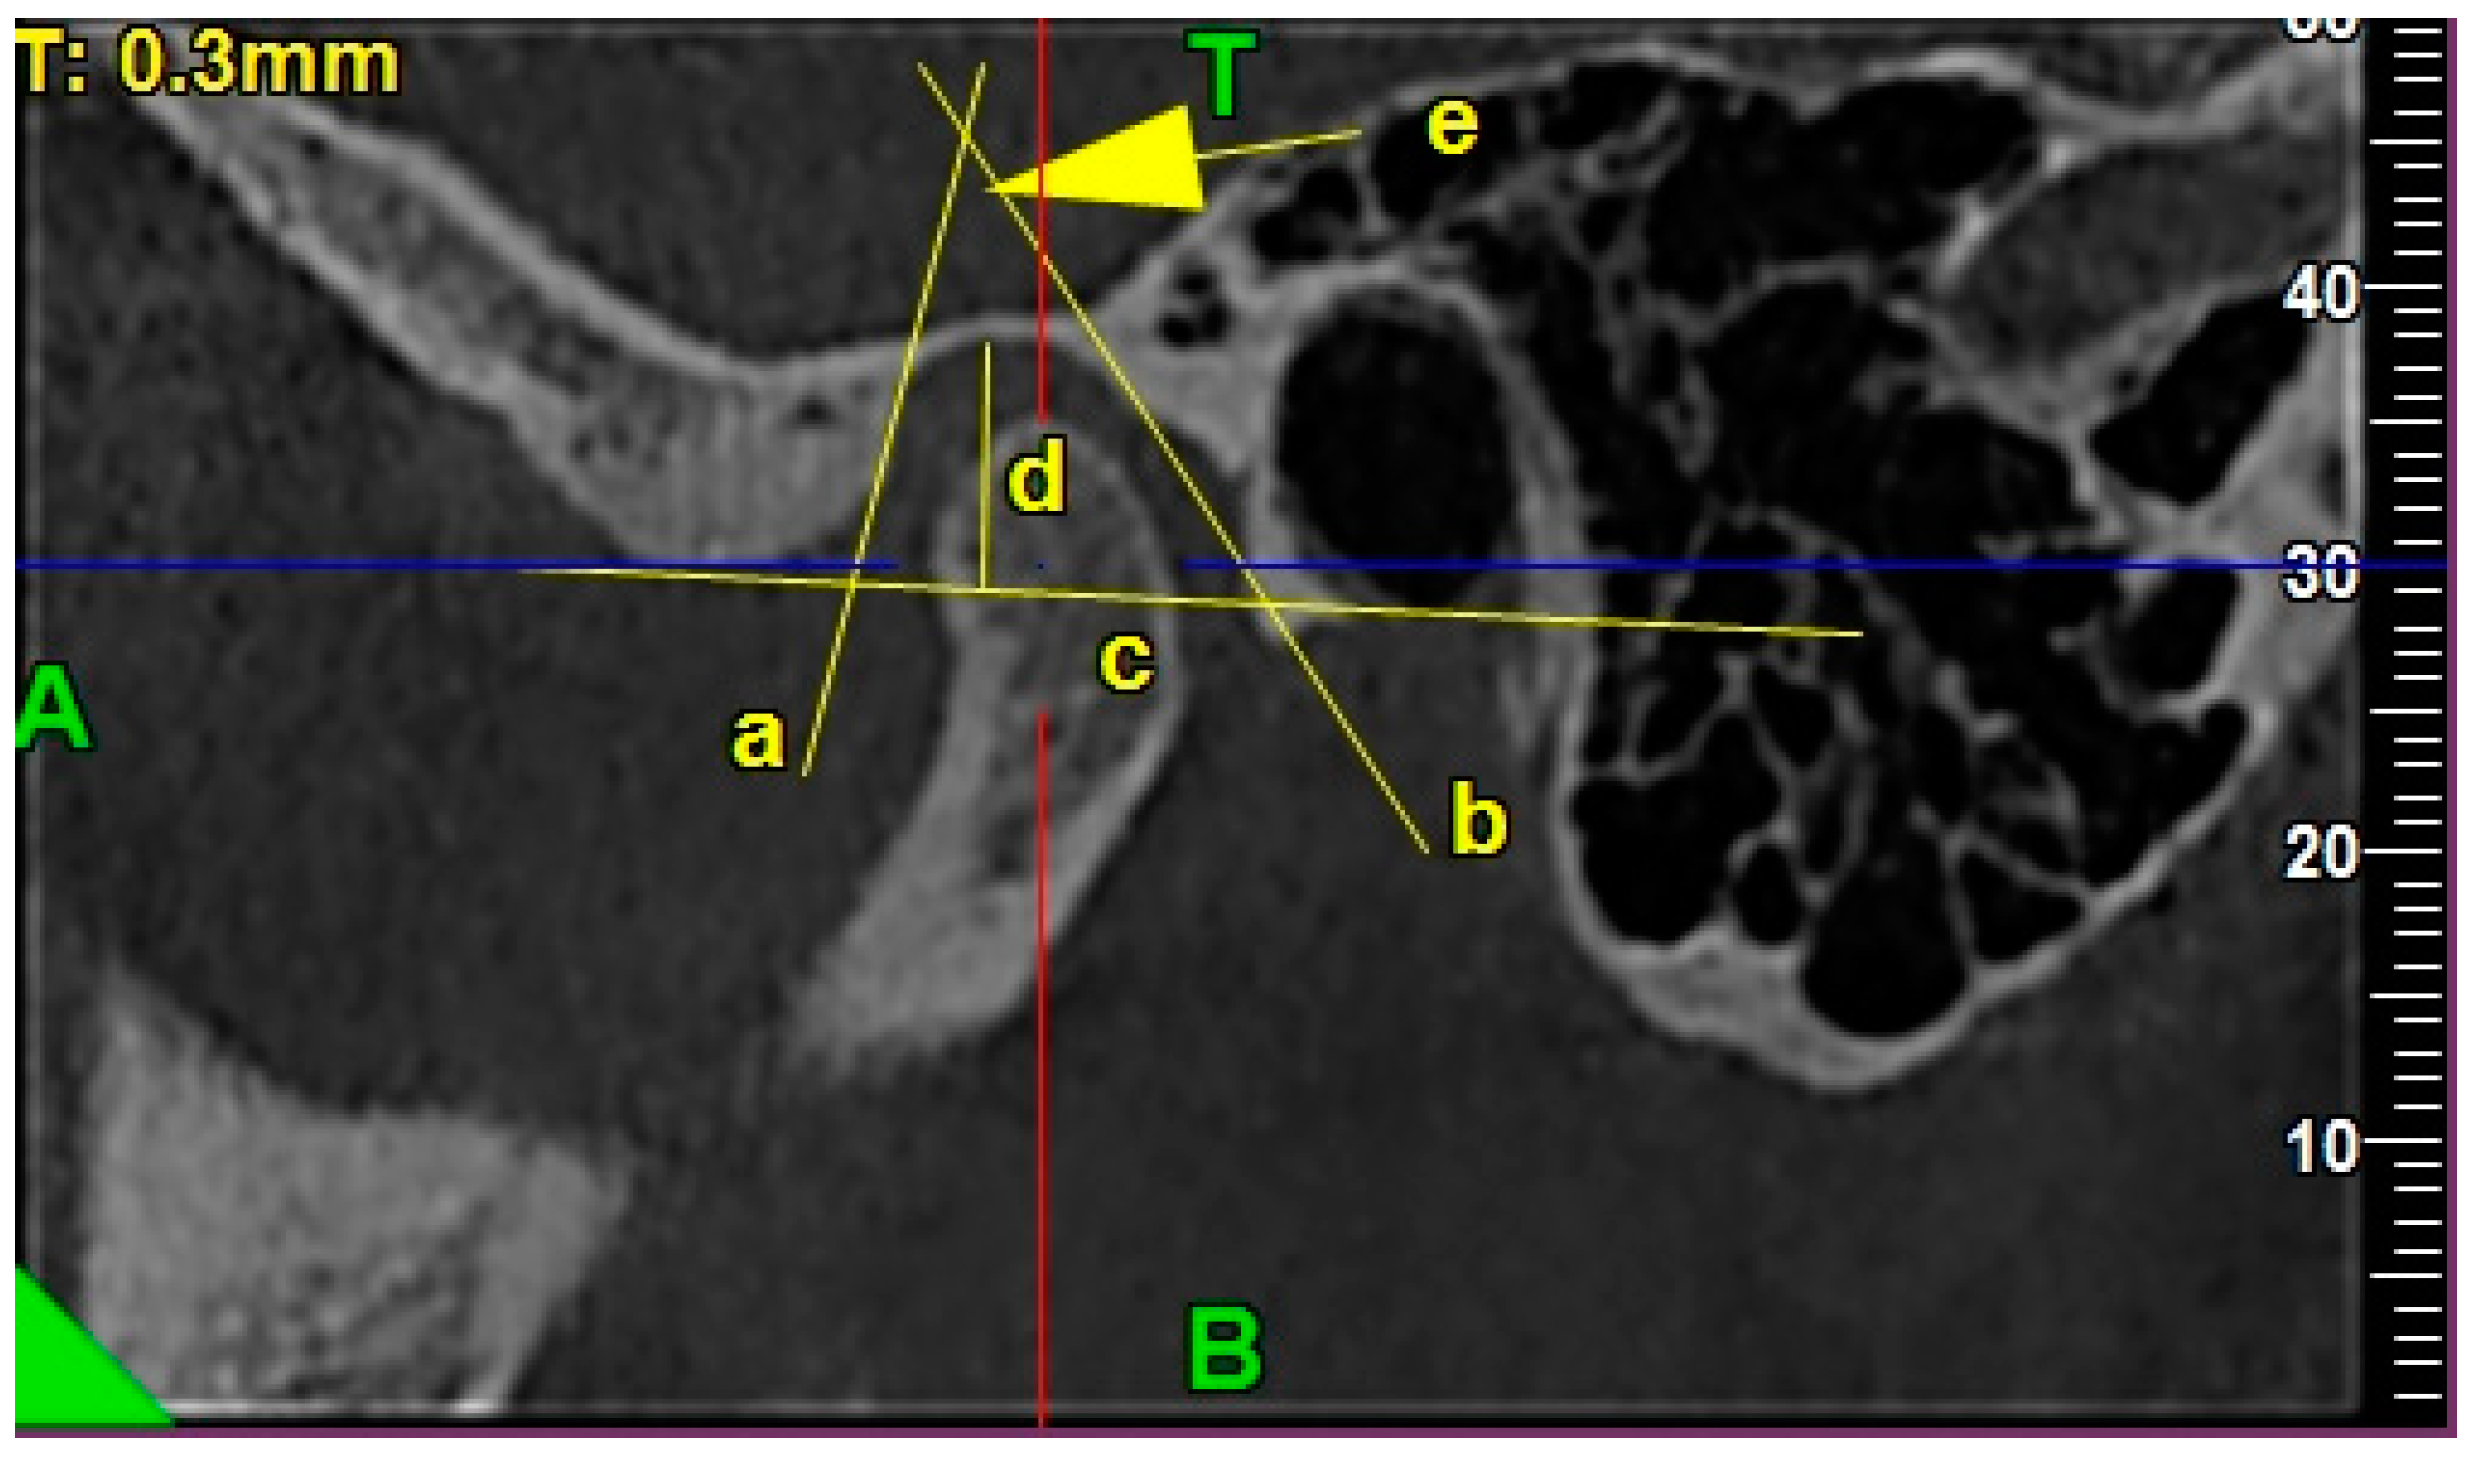
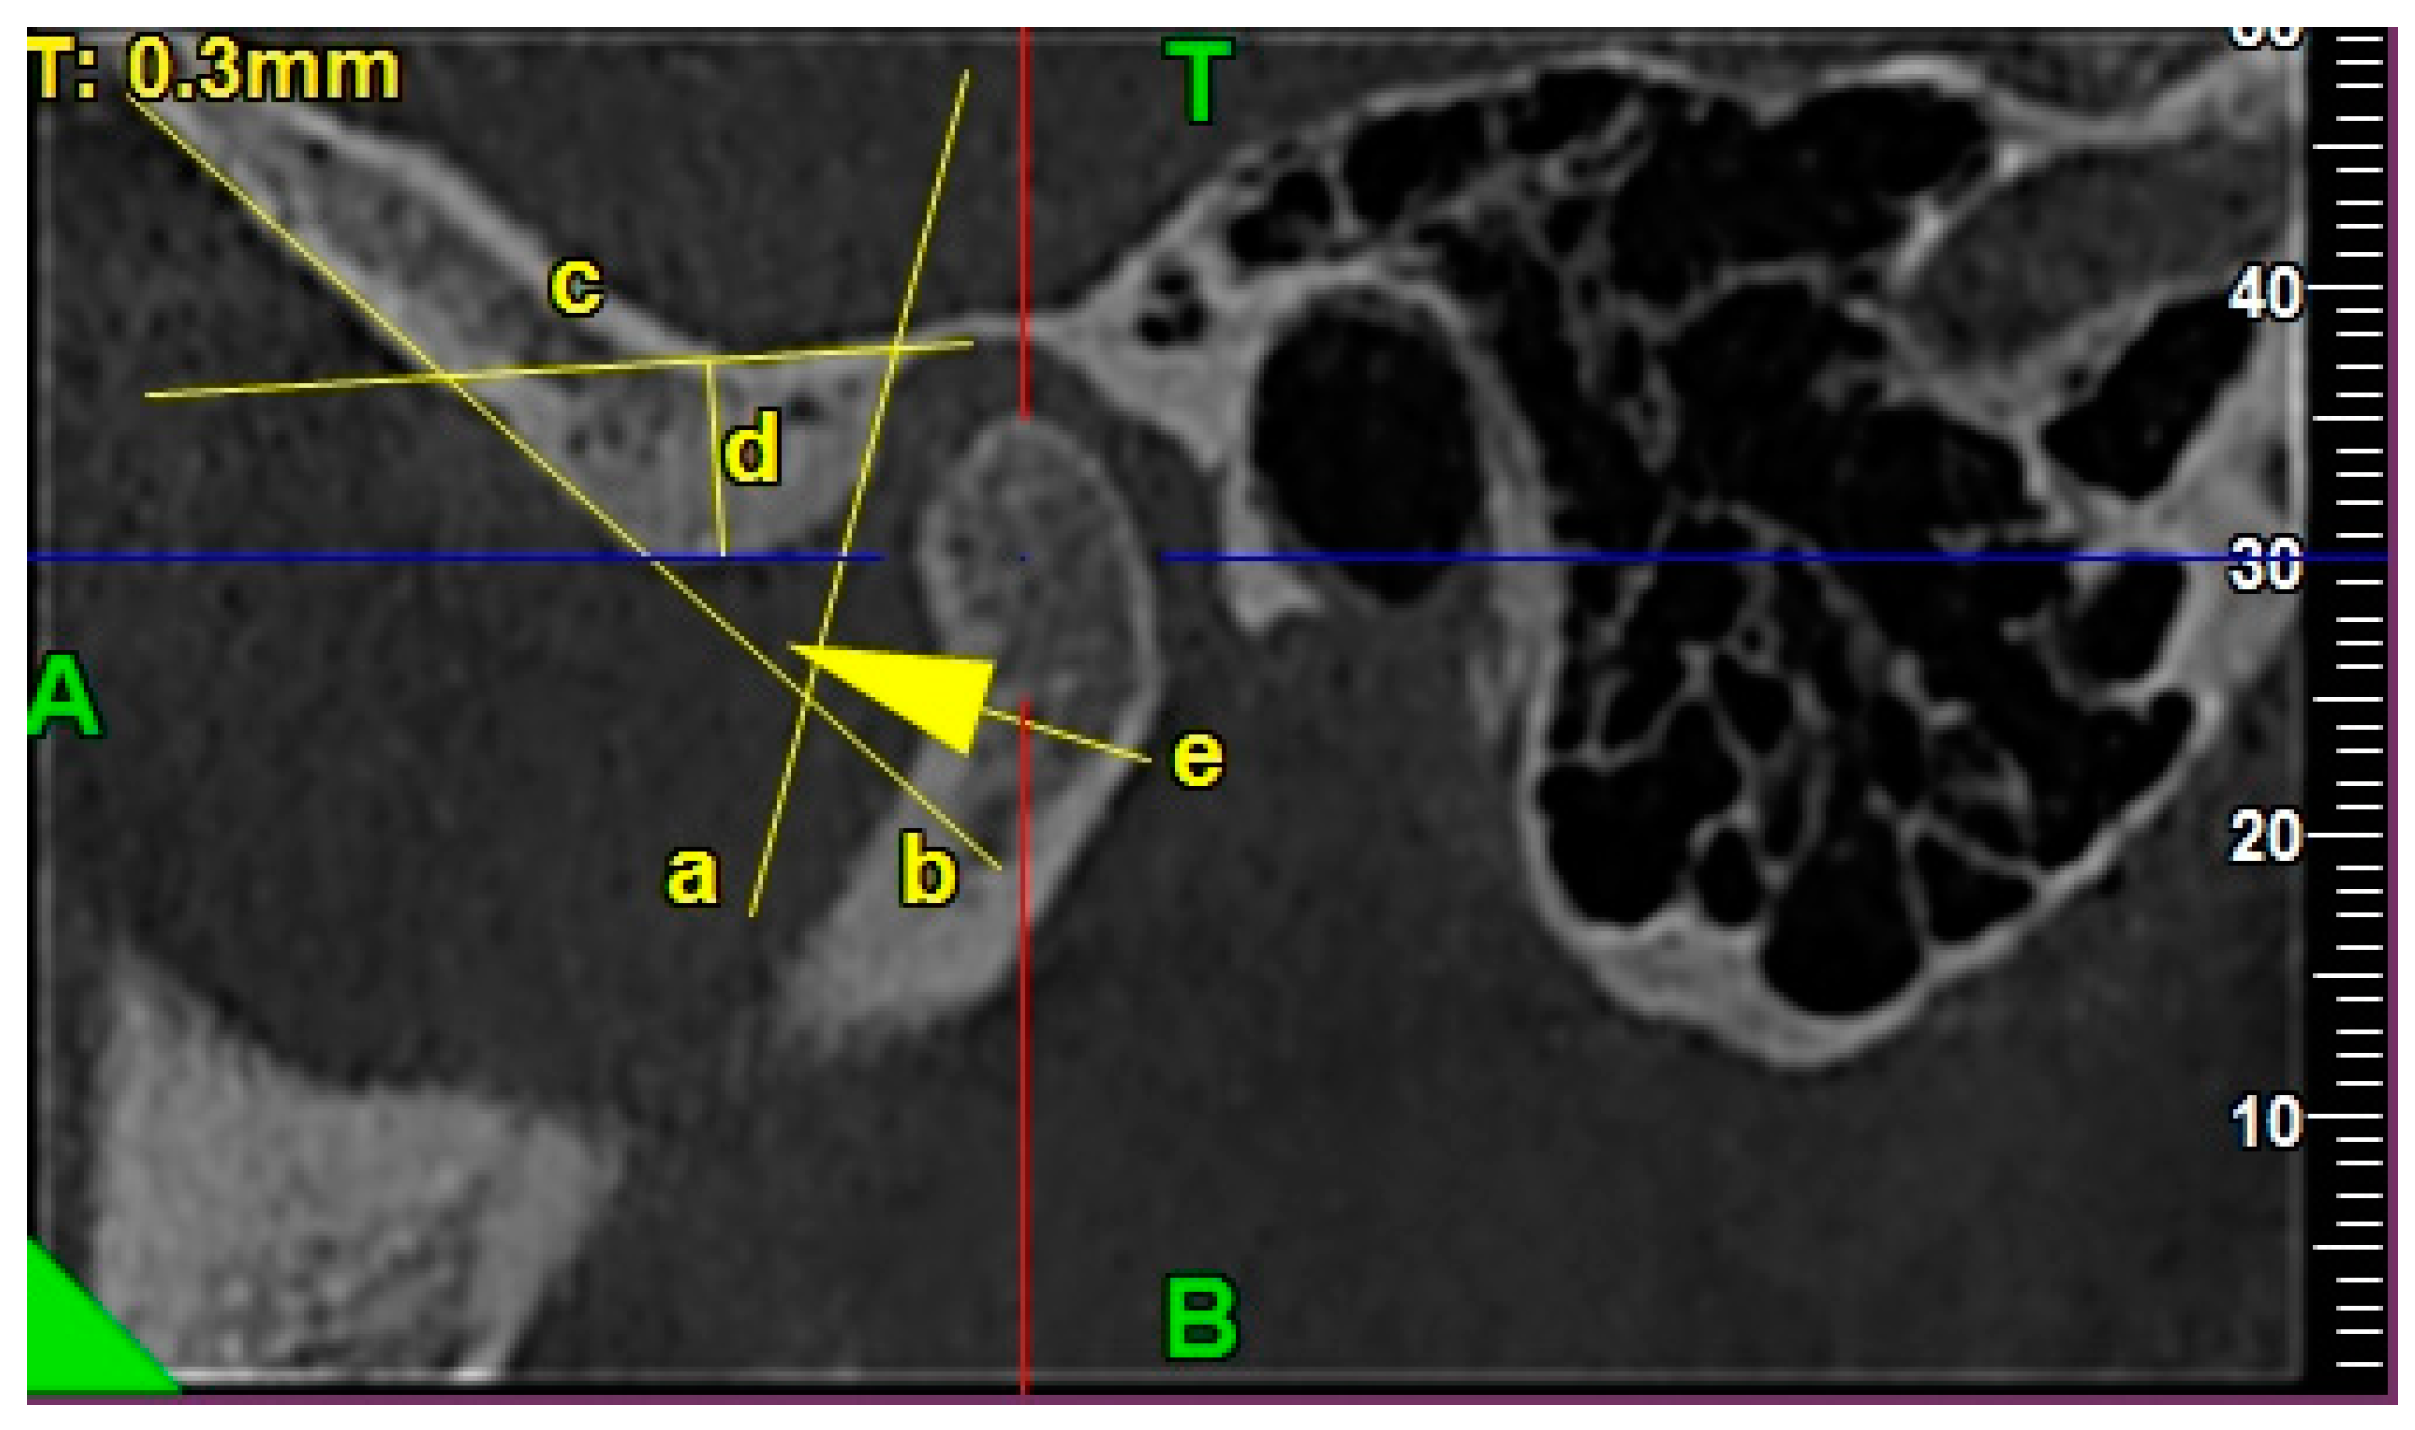
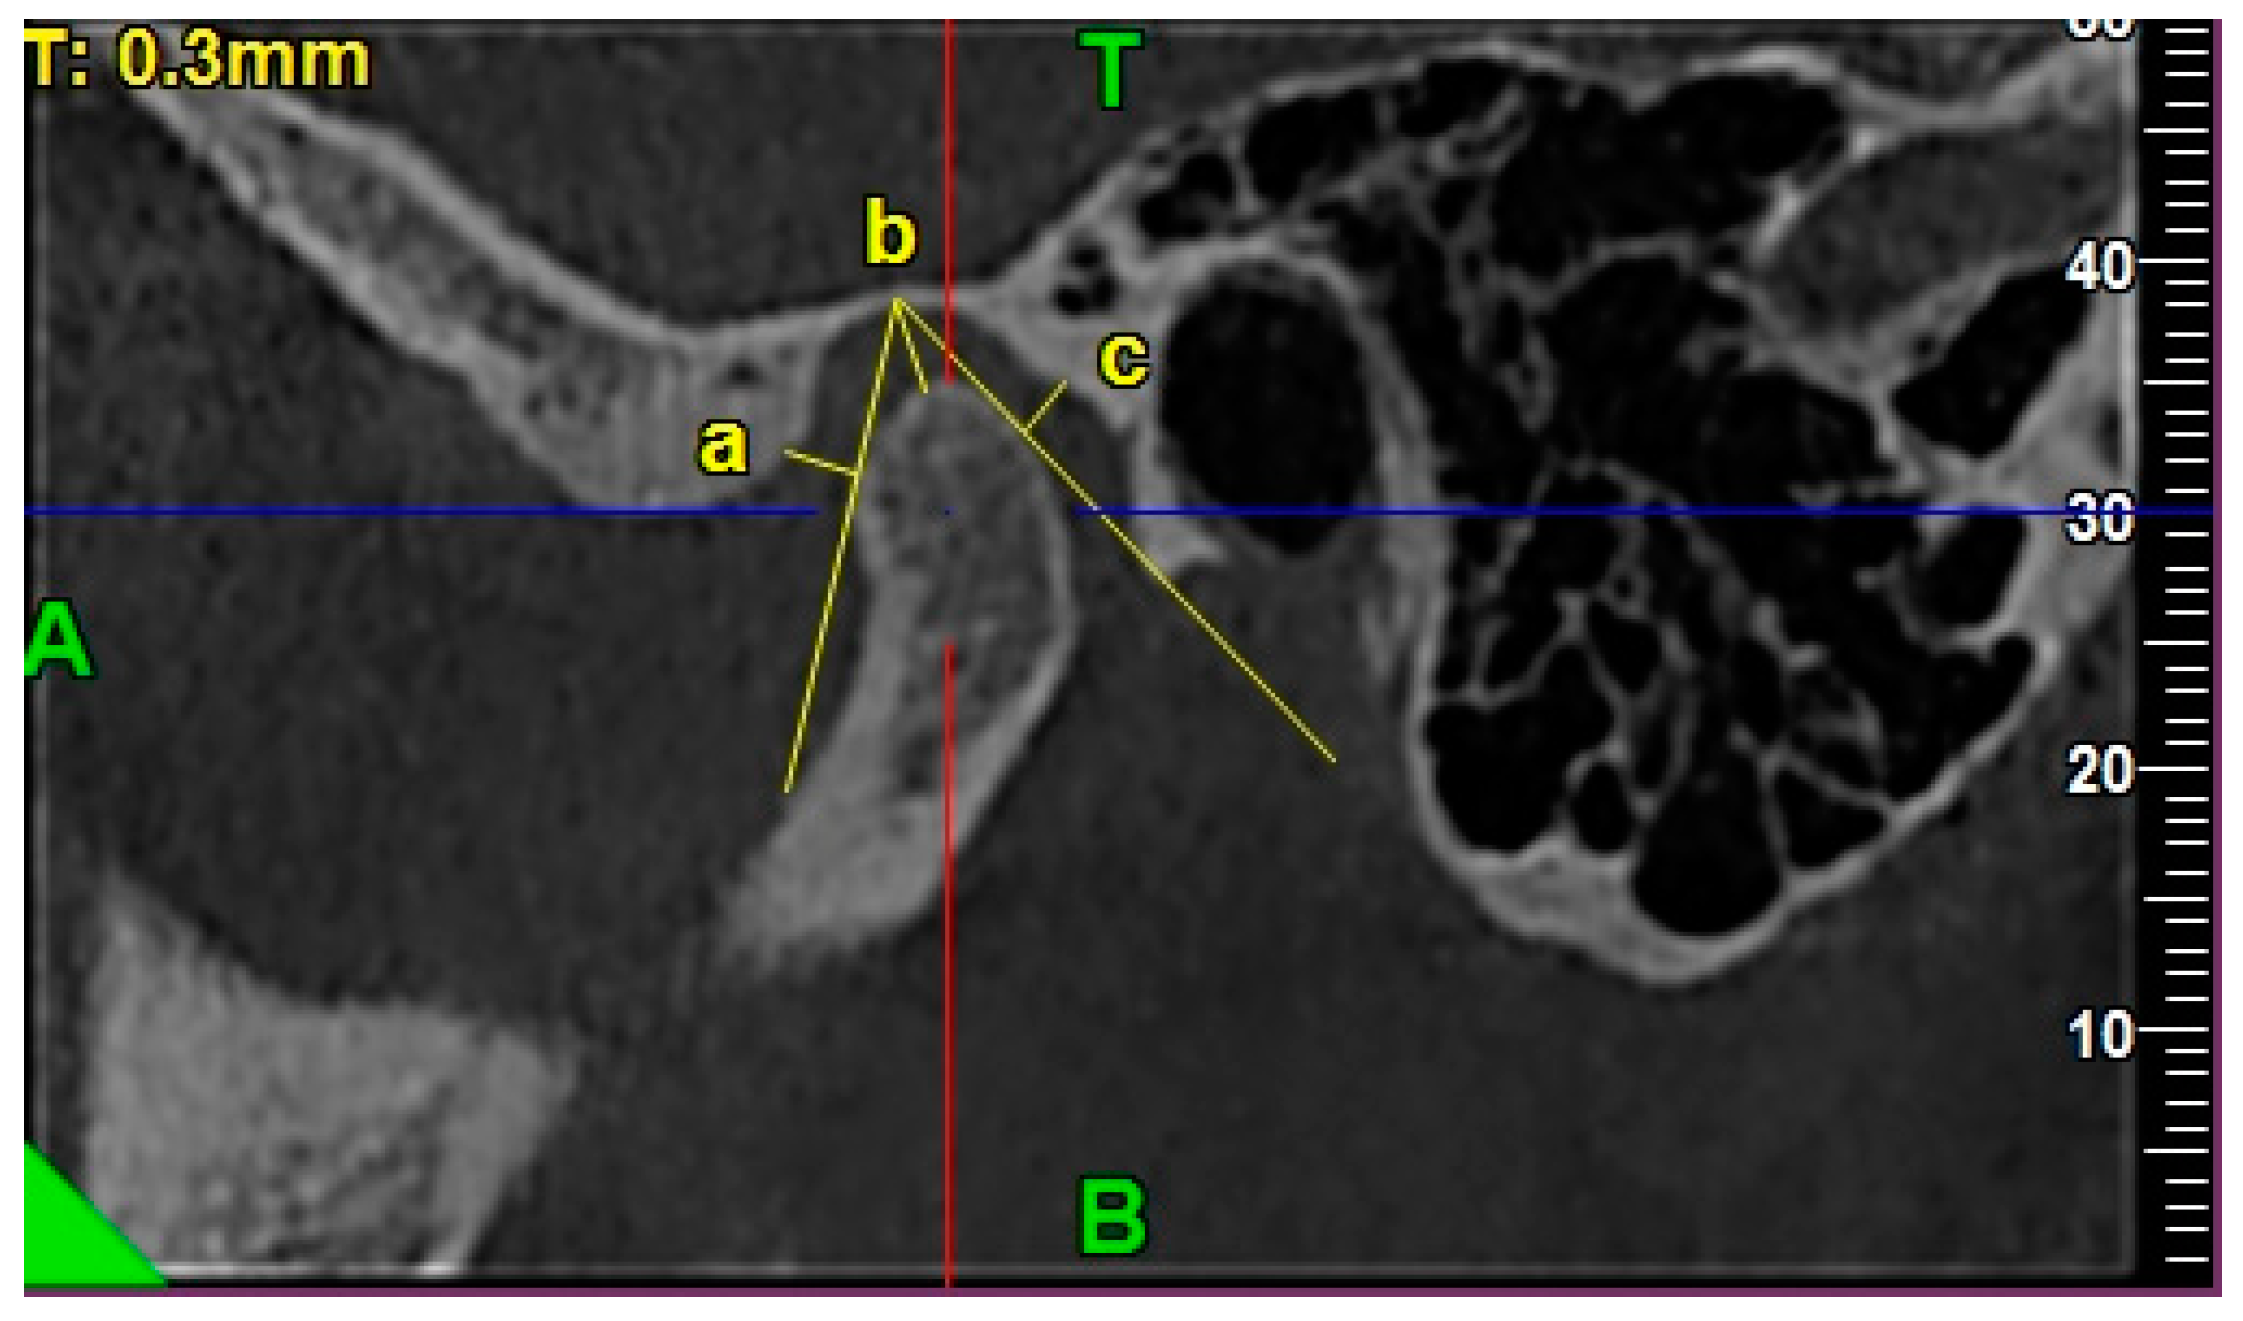
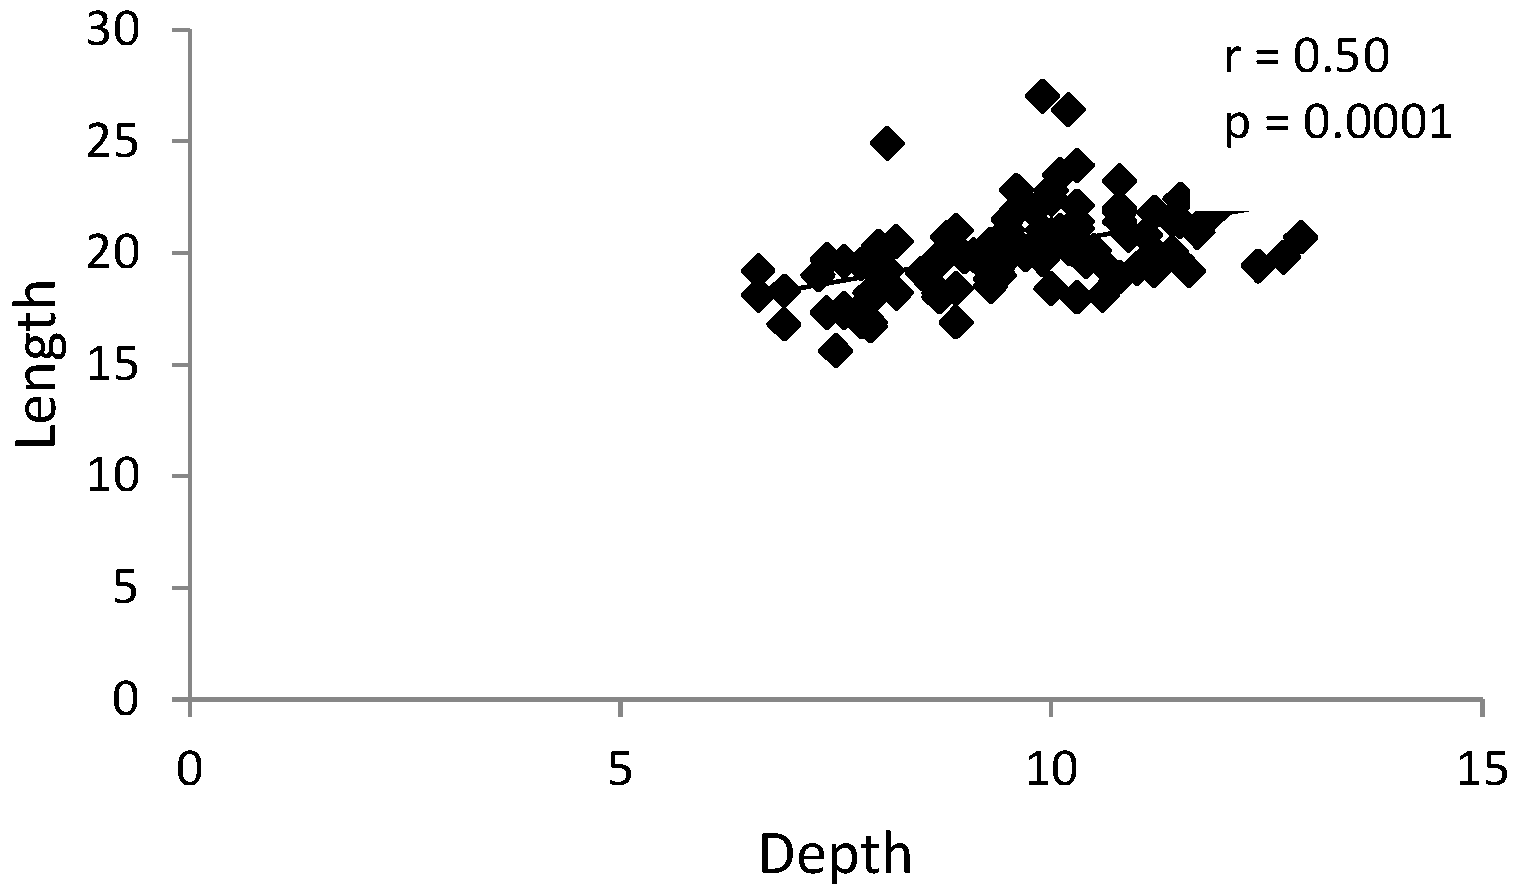
2.4.2. Morphology of the Glenoid Fossa (Mandibular Fossa, Articular Fossa)
2.4.3. Morphology of the Articular Eminence
2.4.4. Assessment of the Anterior, Posterior, and Superior Joint Spaces
2.4.5. Assessment of the Sagittal Position of the Condyle
- P—posterior joint space,
- A—anterior joint space.
- The concentric position of the condyle was diagnosed if the condylar ratio was ±12%.
- The posterior position of the condyle was diagnosed if the condylar ratio was <−12%.
- The anterior position of the condyle was diagnosed if the condylar ratio was >12%.
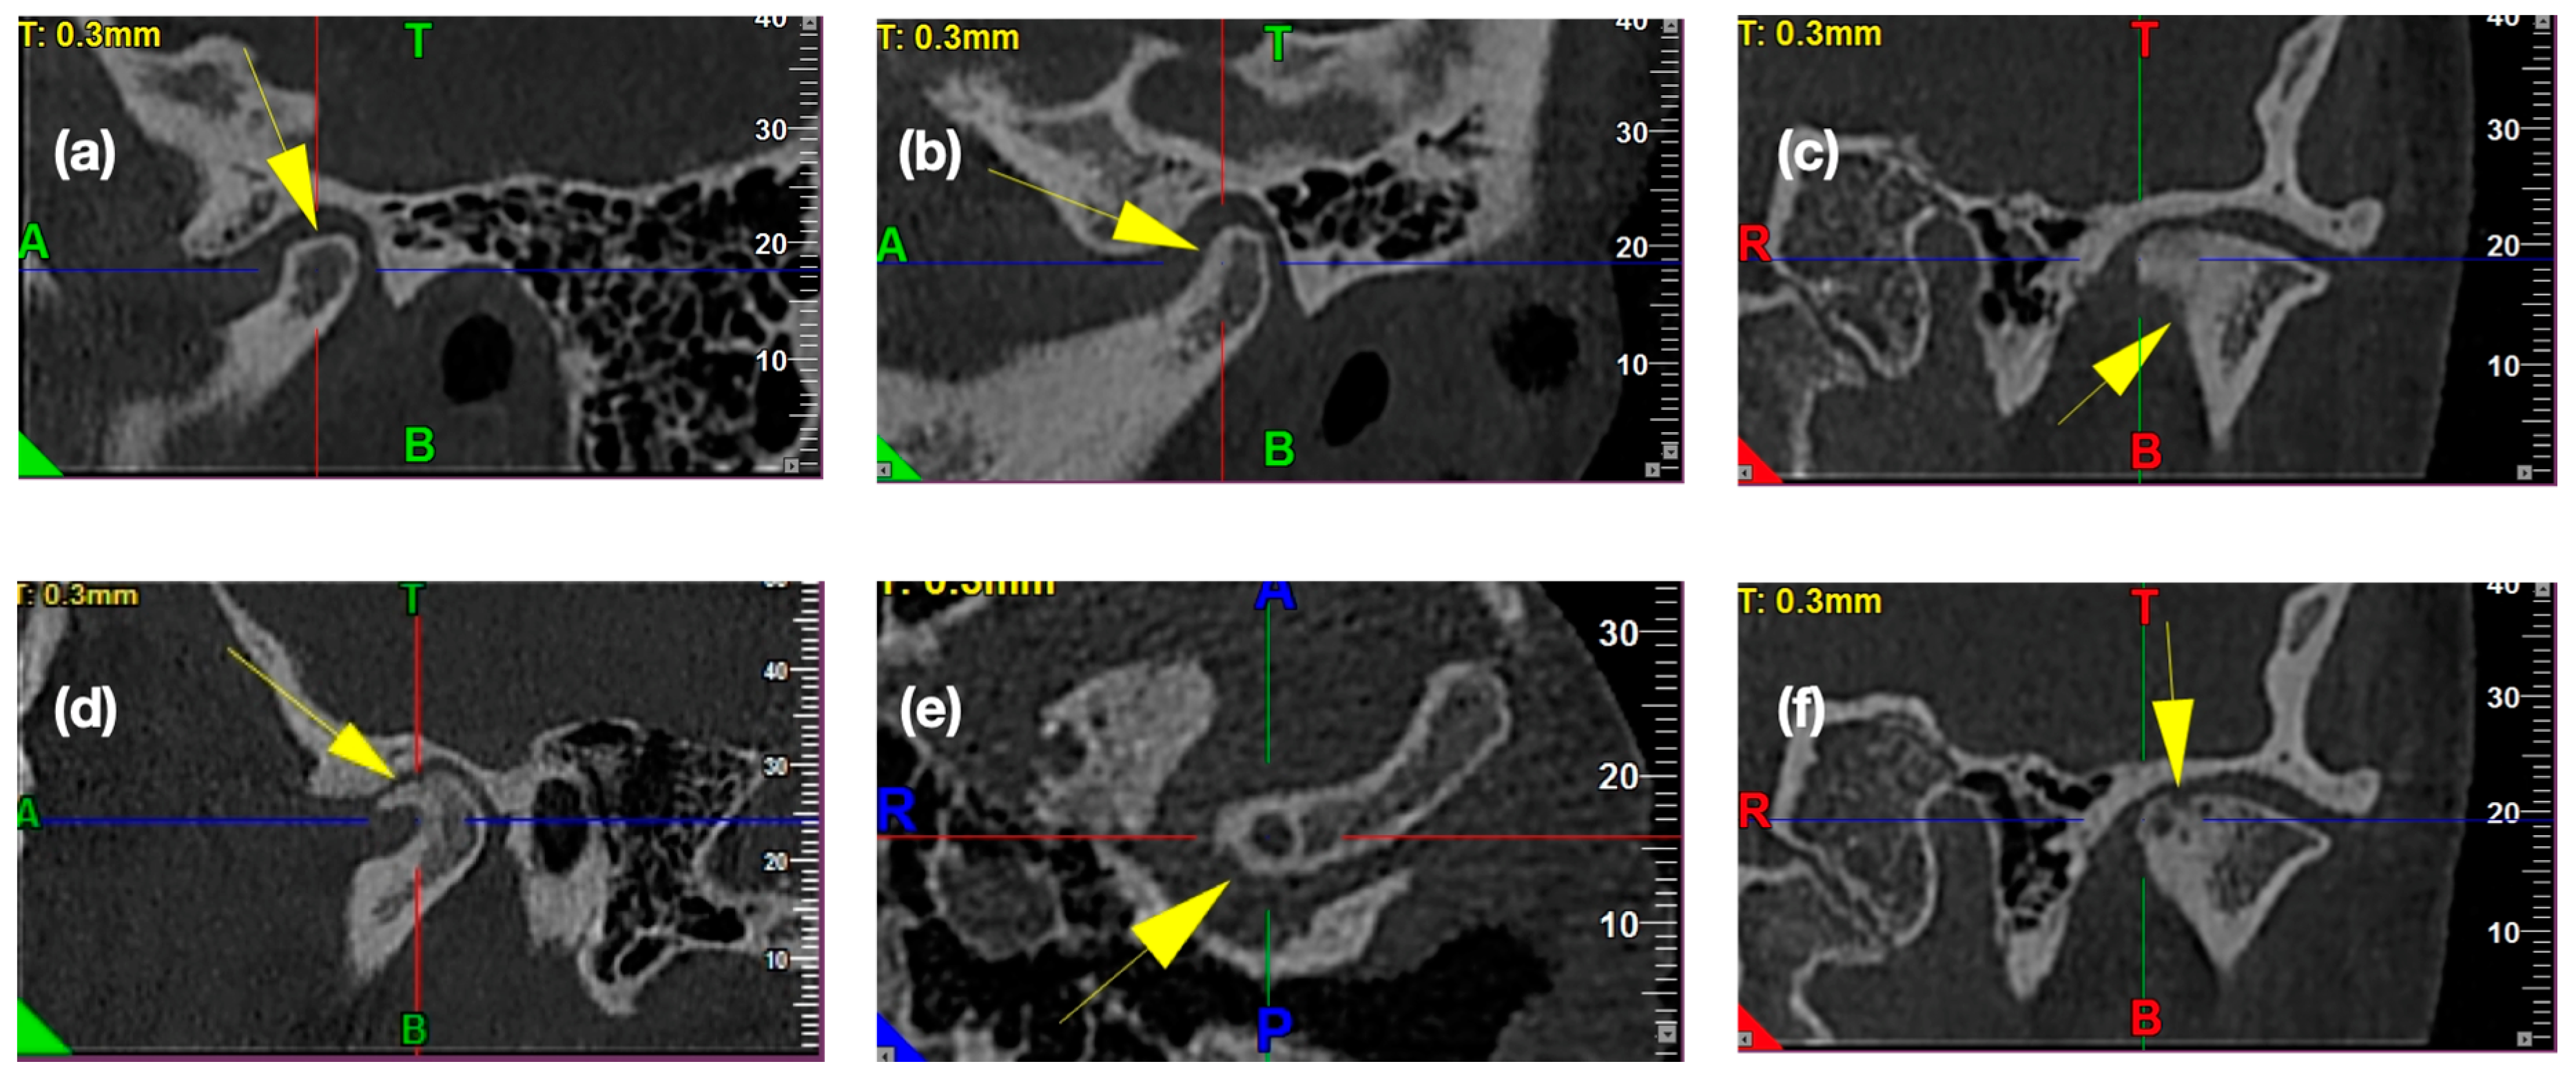
2.4.6. Frequency of the Osteoarthritic Osseous Changes
2.4.7. Statistical Analysis
3. Results
4. Discussion
5. Conclusions
Author Contributions
Funding
Conflicts of Interest
References
- Okeson, J.P. Management of Temporomandibular Disorders and Occlusion, 8th ed.; Elsevier Health Sciences: St. Louis, MO, USA, 2020; pp. 140–148. [Google Scholar]
- Ottria, L.; Candotto, V.; Guzzo, F.; Gargari, M.; Barlattani, A. Temporomandibular joint and related structures: Anatomical and Histological aspects. J. Biol. Regul. Homeost. Agents 2018, 32, 203–207. [Google Scholar]
- Stocum, D.L.; Roberts, W.E. Part I: Development and physiology of the temporomandibular joint. Curr. Osteoporos Rep. 2018, 16, 360–368. [Google Scholar] [CrossRef]
- Yale, S.H.; Allison, B.D.; Hauptfuehrer, J.D. An epidemiological assessment of mandibular condyle morphology. Oral Surg. Oral Med. Oral Pathol. 1966, 21, 169–177. [Google Scholar] [CrossRef]
- Ahmad, M.; Schiffman, E.L. Temporomandibular joint disorders and orofacial pain. Dent. Clin. North. Am. 2016, 60, 105–124. [Google Scholar] [CrossRef]
- Huddleston Slater, J.J.R.; Onland-Moret, N.C.; Lobbezoo, F.; Naeije, M. Anterior disc displacement with reduction and symptomatic hypermobility in the human temporomandibular joint: Prevalence rates and risk factors in children and teenagers. J. Orofac. Pain 2007, 21, 55–62. [Google Scholar]
- Naeije, M.; Te Veldhuis, A.H.; Te Veldhuis, E.C.; Visscher, C.M.; Lobbezoo, F. Disc displacement within the human temporomandibular joint: A systematic review of a ‘noisy annoyance’. J. Oral Rehabil. 2013, 40, 139–158. [Google Scholar] [CrossRef] [PubMed]
- Derwich, M.; Mitus-Kenig, M.; Pawlowska, E. Morphology of the temporomandibular joints regarding the presence of osteoarthritic changes. Int. J. Environ. Res. Public Health 2020, 17. [Google Scholar]
- Ikeda, K. TMJ 1st Orthodontics Concepts, Mechanics, and Stability, 1st ed.; Topnotch Kikaku Ltd.: Tokyo, Japan, 2014; pp. 51–94. [Google Scholar]
- Nguyen, T.; Proffit, W. The decision-making process in orthodontics. In Orthodontics Current Principles and Techniques, 6th ed.; Graber, L.W., Vanarsdall, R.L., Vig, K.W.L., Huang, G.J., Eds.; Elsevier: St. Louis, MO, USA, 2017; pp. 208–244. [Google Scholar]
- Yasa, Y.; Akgul, H.M. Comparative cone-beam computed tomography evaluation of the osseous morphology of the temporomandibular joint in temporomandibular dysfunction patients and asymptomatic individuals. Oral Radiol. 2018, 34, 31–39. [Google Scholar] [CrossRef] [PubMed]
- Pullinger, A.G.; Hollender, L.; Solberg, W.K.; Petersson, A. A tomographic study of mandibular condyle position in an asymptomatic population. J. Prosthet. Dent. 1985, 53, 706–713. [Google Scholar] [CrossRef]
- Ahmad, M.; Hollender, L.; Anderon, Q.; Kartha, K.; Ohrbach, R.; Truelove, E.L.; John, M.T.; Schiffman, E.L. Research diagnostic criteria for temporomandibular disorders (RDC/TMD): Development of image analysis criteria and examiner reliability for image analysis. Oral Surg. Oral Med. Oral Pathol. Oral Radiol. Endod. 2009, 107, 844–860. [Google Scholar] [CrossRef] [PubMed]
- Marpaung, C.; van Selms, M.K.A.; Lobbezoo, F. Temporomandibular joint anterior disc displacement with reduction in a young population: Prevalence and risk indicators. Int. J. Paediatr. Dent. 2019, 29, 66–73. [Google Scholar] [CrossRef]
- Marpaung, C.M.; Kalaykova, S.I.; Lobbezoo, F.; Naeije, M. Validity of functional diagnostic examination for temporomandibular joint disc displacement with reduction. J. Oral Rehabil. 2014, 41, 243–249. [Google Scholar] [CrossRef] [PubMed]
- Yatani, H.; Sonoyama, W.; Kuboki, T.; Matsuka, Y.; Orsini, M.G.; Yamashita, A. The validity of clinical examination for diagnosing anterior disk displacement with reduction. Oral Surg. Oral Med. Oral Pathol. Oral Radiol. Endod. 1998, 85, 647–653. [Google Scholar] [CrossRef]
- de Farias, J.F.; Melo, S.L.S.; Bento, P.M.; Oliveira, L.S.A.F.; Campos, P.S.F.; de Melo, D.P. Correlation between temporomandibular joint morphology and disc displacement by MRI. Dentomaxillofac. Radiol. 2015, 44, 20150023. [Google Scholar] [CrossRef] [PubMed]
- Ejima, K.; Schulze, D.; Stippig, A.; Matsumoto, K.; Rottke, D.; Honda, K. Relationship between the thickness of the roof of glenoid fossa, condyle morphology and remaining teeth in asymptomatic European patients based on cone beam CT data sets. Dentomaxillofac. Radiol. 2013, 42, 90929410. [Google Scholar] [CrossRef] [PubMed]
- Kijima, N.; Honda, K.; Kuroki, Y.; Sakabe, J.; Ejmia, K.; Nakajima, I. Relationship between patient characteristics, mandibular head morphology and thickness of the roof of the glenoid fossa in symptomatic temporomandibular joints. Dentomaxillofac. Radiol. 2007, 36, 277–281. [Google Scholar] [CrossRef]
- Santos, K.C.; Dutra, M.E.; Warmling, L.V.; Oliveira, J.X. Correlation among the changes observed in temporomandibular joint internal derangements assessed by magnetic resonance in symptomatic patients. J. Oral. Maxillofac. Surg. 2013, 71, 1504–1512. [Google Scholar] [CrossRef]
- Poluha, R.L.; Cunha, C.O.; Bonjardim, L.R.; Conti, P.C.R. Temporomandibular joint morphology does not influence the presence of arthralgia in patients with disk displacement with reduction: A magnetic resonance imaging-based study. Oral Surg. Oral Med. Oral Pathol. Oral Radiol. 2020, 129, 149–157. [Google Scholar] [CrossRef]
- Seo, B.Y.; An, J.S.; Chang, M.S.; Huh, K.H.; Ahn, S.J. Changes in condylar dimensions in temporomandibular joints with disk displacement. Oral Surg. Oral Med. Oral Pathol. Oral Radiol. 2020, 129, 72–79. [Google Scholar] [CrossRef]
- Sato, S.; Kawamura, H.; Motegi, K.; Takahashi, K. Morphology of the mandibular fossa and the articular eminence in temporomandibular joints with anterior disk displacement. Int. J. Oral Maxillofac. Surg. 1996, 25, 236–238. [Google Scholar] [CrossRef]
- Almasan, O.C.; Hedesiu, M.; Baciut, G.; Leucuta, D.C.; Baciut, M. Disk and joint morphology variations on coronal and sagittal MRI in temporomandibular joint disorders. Clin. Oral Investig. 2013, 17, 1243–1250. [Google Scholar] [CrossRef]
- Hirata, F.H.; Guimaraes, A.S.; de Oliveira, J.X.; Moreira, C.R.; Ferreira, E.T.T.; Cavalcanti, M.G.P. Evaluation of TMJ articular eminence morphology and disc patterns in patients with disc displacement in MRI. Braz. Oral Res. 2007, 21, 265–271. [Google Scholar] [CrossRef] [PubMed]
- Galante, G.; Paesani, D.; Tallents, R.H.; Hatala, M.A.; Katzberg, R.W.; Murphy, W. Angle of the articular eminence in patients with temporomandibular joint dysfunction and asymptomatic volunteers. Oral Surg. Oral Med. Oral Pathol. Oral Radiol. Endod. 1995, 80, 242–249. [Google Scholar] [CrossRef]
- Bedran, L.M.; Santos, A.A.S.M.D. Changes in temporomandibular joint anatomy, changes in condylar translation, and their relationship with disc displacement: Magnetic resonance imaging study. Radiol. Bras. 2019, 52, 85–91. [Google Scholar] [CrossRef] [PubMed]
- Lin, W.C.; Lo, C.P.; Chiang, I.C.; Hsu, C.C.; Hsu, W.L.; Liu, D.W.; Juan, Y.H.; Liu, G.C. The use of pseudo-dynamic magnetic resonance imaging for evaluating the relationship between temporomandibular joint anterior disc displacement and joint pain. Int. J. Oral Maxillofac. Surg. 2012, 41, 1501–1504. [Google Scholar] [CrossRef]
- Ikeda, K.; Kawamura, A. Disc displacement and changes in condylar position. Dentomaxillofac. Radiol. 2013, 42, 84227642. [Google Scholar] [CrossRef]
- Rabelo, K.A.; Sousa Melo, S.L.; Torres, M.G.G.; Peixoto, L.R.; Campos, P.S.F.; Rebello, I.M.C.R.; de Melo, D.P. Assessment of condyle position, fossa morphology, and disk displacement in symptomatic patients. Oral Surg. Oral Med. Oral Pathol. Oral Radiol. 2017, 124, 199–207. [Google Scholar] [CrossRef]
- Glyn-Jones, S.; Palmer, A.J.R.; Agricola, R.; Price, A.J.; Vincent, T.L.; Weinans, H.; Carr, A.J. Osteoarthritis. Lancet 2015, 386, 376–387. [Google Scholar] [CrossRef]
- Dias, I.M.; Coelho, P.R.; Picorelli Assis, N.M.S.; Pereira Leite, F.P.; Devito, K.L. Evaluation of the correlation between disc displacements and degenerative bone changes of the temporomandibular joint by means of magnetic resonance images. Int. J. Oral Maxillofac. Surg. 2012, 41, 1051–1057. [Google Scholar] [CrossRef]
- de Melo, D.P.; Sousa Melo, S.L.; de Andrade Freitas Oliveira, L.S.; Ramos-Perez, F.M.; Campos, P.S. Evaluation of temporomandibular joint disk displacement and its correlation with pain and osseous abnormalities in symptomatic young patients with magnetic resonance imaging. Oral Surg. Oral Med. Oral Pathol. Oral Radiol. 2015, 119, 107–112. [Google Scholar] [CrossRef]
- Roh, H.S.; Kim, W.; Kim, Y.K.; Lee, J.Y. Relationships between disk displacement, joint effusion, and degenerative changes of the TMJ in TMD patients based on MRI findings. J. Craniomaxillofac. Surg. 2012, 40, 283–286. [Google Scholar] [CrossRef]
- Dias, I.M.; Cordeiro, P.C.; Devito, K.L.; Tavares, M.L.F.; Leite, I.C.G.; Tesch, R. Evaluation of temporomandibular joint disc displacement as a risk factor for osteoarthrosis. Int. J. Oral Maxillofac. Surg. 2016, 45, 313–317. [Google Scholar] [CrossRef] [PubMed]


| Comparable Characteristics | Unilateral Clicks (N = 25) | Bilateral Clicks (N = 25) | Control (No Clicks) (N = 55) | p-Value |
|---|---|---|---|---|
| Age | 0.1545 1 | |||
| av. (SD) | 26.9 (9.0) | 23.0 (7.4) | 24.9 (7.3) | |
| range | 16–47 | 16–42 | 16–44 | |
| median | 24.8 | 19.2 | 22.7 | |
| 95% CI | [23.2; 30.6] | [20.0; 26.1] | [22.9;26.8] | |
| Sex | 0.4174 2 | |||
| female | 17 (68.0%) | 21 (84.0%) | 41 (74.5%) | |
| male | 8 (32.0%) | 4 (16.0%) | 14 (25.5%) |
| Comparable Characteristics | Control Group (TMJs with no Clicks) | TMJ’s with Reciprocal Clicking | p-Value |
|---|---|---|---|
| (N = 135) | (N = 75) | ||
| CONDYLE | |||
| Shape of condyle head | 0.2839 1 | ||
| flattened | 30 (22.2%) | 19 (25.3%) | |
| convex | 57 (42.2%) | 23 (30.7%) | |
| angled | 18 (13.4%) | 16 (21.3%) | |
| round | 30 (22.2%) | 17 (22.7%) | |
| Condylar width [mm] | 0.4883 2 | ||
| av. (SD) | 19.0 (2.1) | 18.7 (2.3) | |
| range | 13.4–23.9 | 11.7–23.1 | |
| median | 19.2 | 18.8 | |
| 25–74% percentile | 17.4–20.4 | 17.2–20.4 | |
| 95% CI | [18.6;19.3] | [18.2;19.3] | |
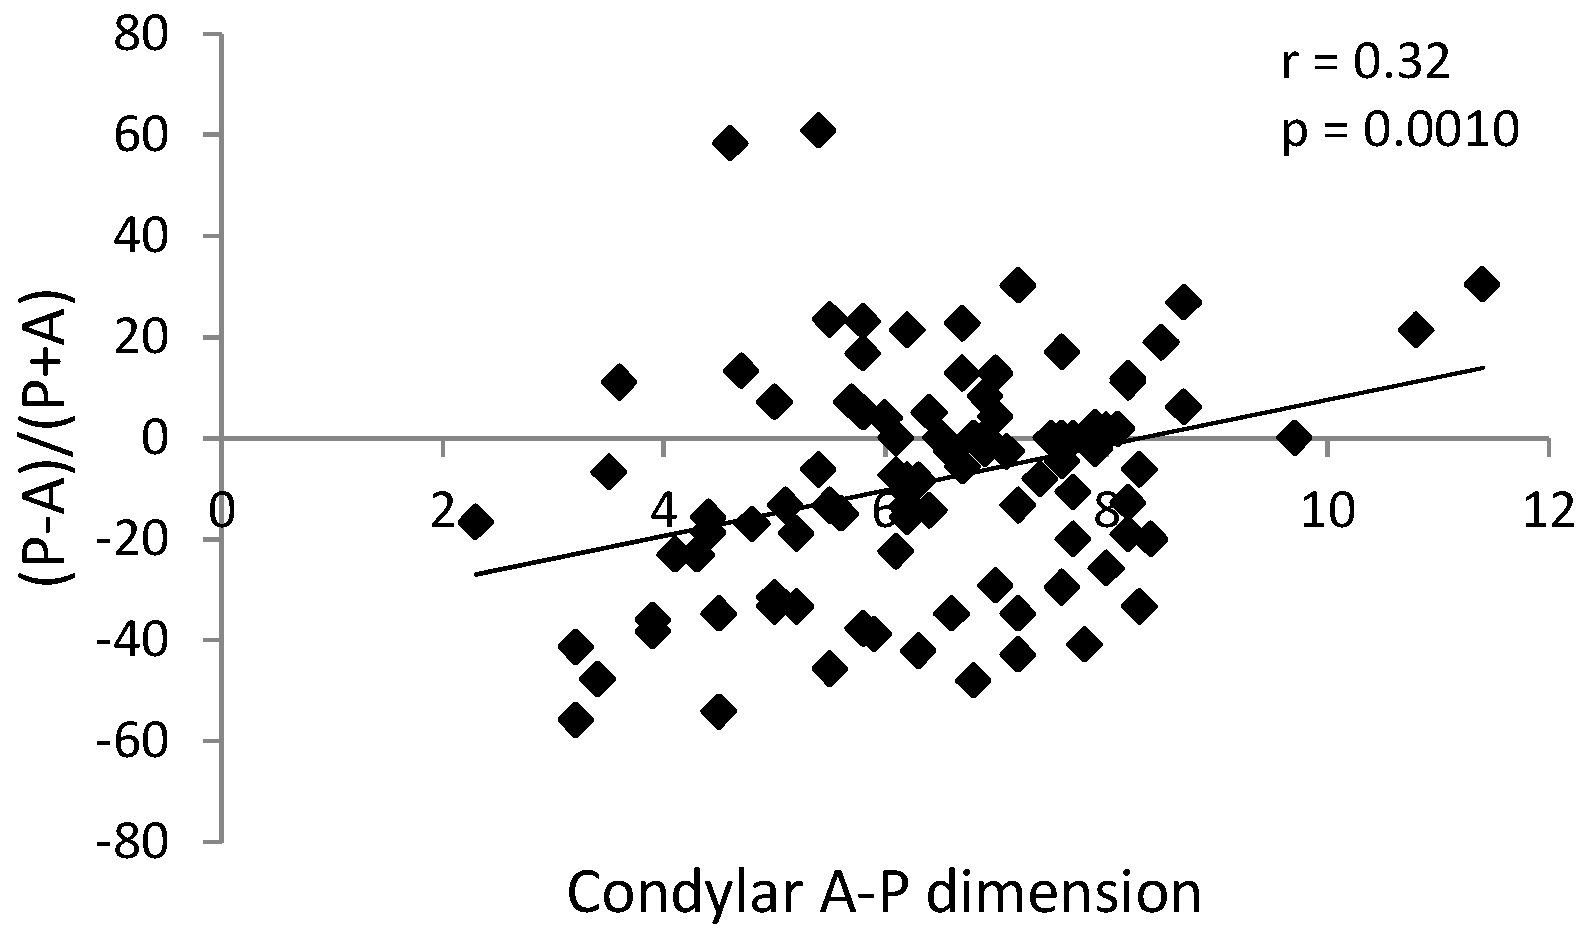
| Condylar A-P dimension [mm] | 0.0399 3 | ||
| av. (SD) | 6.8 (1.2) | 6.3 (1.6) | |
| range | 3.5–11.7 | 2.3–11.4 | |
| median | 6.7 | 6.3 | |
| 25–74% percentile | 6.0–7.5 | 5.4–7.4 | |
| 95% CI | [6.6;7.0] | [5.9;6.6] | |
| GLENOID FOSSA | |||
| Shape | 0.1261 1 | ||
| oval | 77 (57.0%) | 53 (70.7%) | |
| trapezoidal | 31 (23.0%) | 15 (20.0%) | |
| triangular | 18 (13.3%) | 6 (8.0%) | |
| angled | 9 (6.7%) | 1 (1.3%) | |
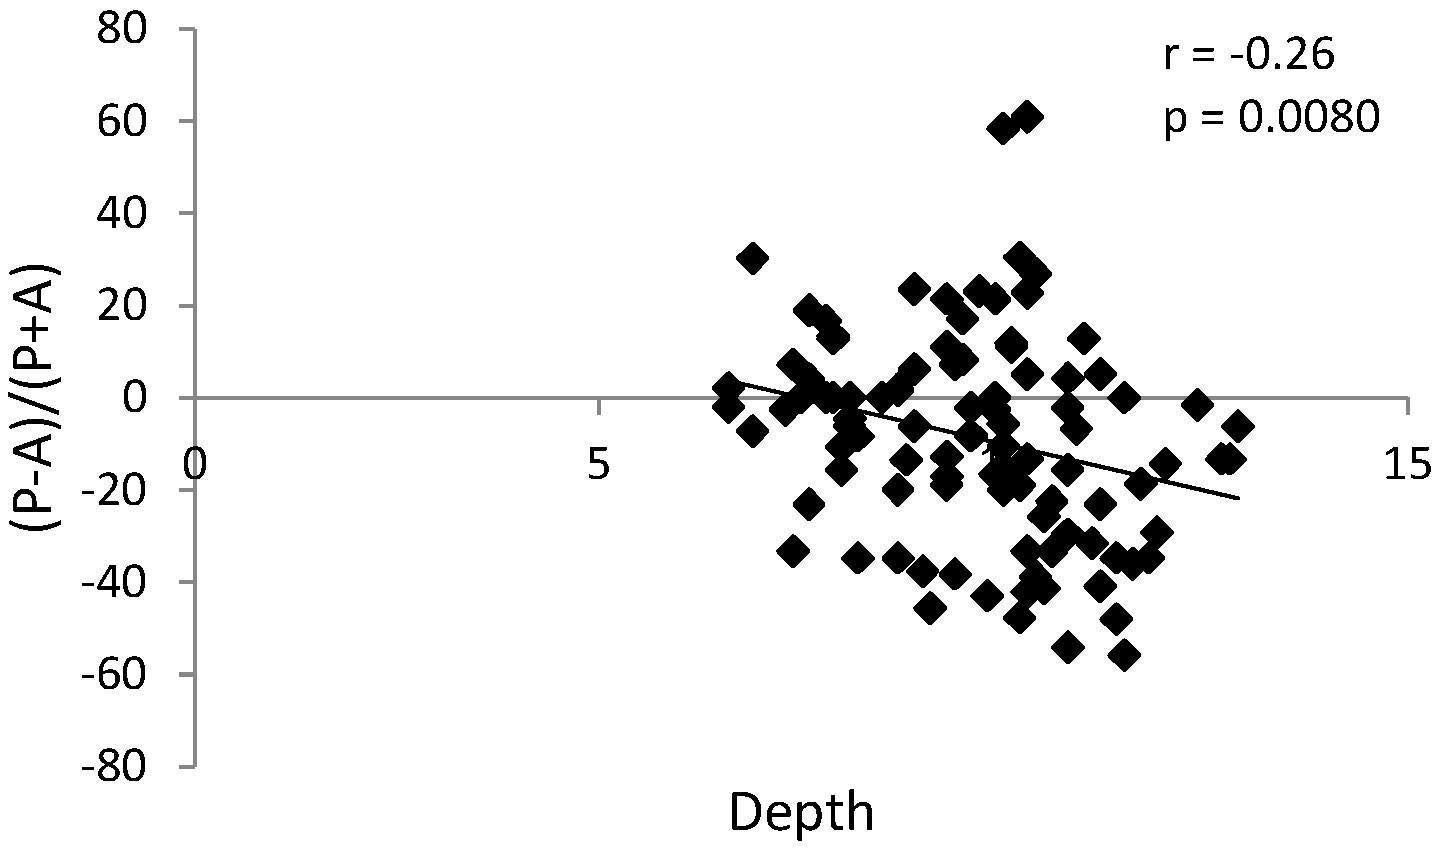
| Depth [mm] | 0.5284 3 | ||
| av. (SD) | 9.8 (1.3) | 9.7 (1.5) | |
| range | 6.3–12.4 | 6.6–12.9 | |
| median | 9.9 | 9.9 | |
| 25–74% percentile | 8.7–10.9 | 8.7–10.5 | |
| 95% CI | [9.5; 10.0] | [9.3; 10.0] | |
| Length [mm] | 0.3283 3 | ||
| av. (SD) | 20.5 (2.3) | 20.1 (1.9) | |
| range | 16.1–28.3 | 15.6–26.4 | |
| median | 20.2 | 20.1 | |
| 25–74% percentile | 19.1–21.7 | 19.1–21.4 | |
| 95% CI | [20.1; 20.9] | [19.7; 20.6] | |
| Divergence angle [°] | 0.7879 3 | ||
| av. (SD) | 56.7 (14.8) | 55.3 (13.2) | |
| range | 26.0–100.5 | 29.2–94.2 | |
| median | 55.0 | 56.4 | |
| 25–74% percentile | 44.8–64.7 | 44.5–64.6 | |
| 95% CI | [54.2; 59.3] | [52.3; 58.4] | |
| ARTICULAR EMINENCE | |||
| Height [mm] | 0.7227 2 | ||
| av. (SD) | 8.1 (2.1) | 8.0 (2.0) | |
| range | 3.6–13.4 | 3.0–13.7 | |
| median | 8.2 | 8.1 | |
| 25–74% percentile | 6.6–9.6 | 6.6–9.3 | |
| 95% CI | [7.8; 8.5] | [7.5; 8.5] | |
| Divergence angle [°] | 0.6435 2 | ||
| av. (SD) | 82.9 (14.7) | 81.9 (15.6) | |
| range | 49.7–127.6 | 43.7–115.1 | |
| median | 81.0 | 83.2 | |
| 25–74% percentile | 73.0–90.8 | 69.8–91.4 | |
| 95% CI | [80.4; 85.4] | [78.3; 85.5] | |
| CONDYLAR HEAD POSITION | |||
| (P-A)/(P+A) [%] | 0.0149 2 | ||
| av. (SD) | −2.9 (22.2) | −10.9 (23.2) | |
| range | −69.4–56.0 | −55.8–60.9 | |
| median | 0.0 | −10.5 | |
| 25–74% percentile | −15.8–11.6 | −31.6–2.0 | |
| 95% CI | [−6.7;0.9] | [−16.2; −5.6] | |
| Superior | 0.8566 2 | ||
| av. (SD) | 3.2 (0.9) | 3.2 (1.0) | |
| range | 1.2–6.1 | 1.2–6.5 | |
| median | 3.3 | 3.1 | |
| 25–74% percentile | 2.7–3.8 | 2.5–3.6 | |
| 95% CI | [3.1;3.4] | [3.0;3.4] | |
| Position | 0.0425 1 | ||
| anterior | 32 (23.7%) | 10 (13.3%) | |
| posterior | 43 (31.9%) | 36 (48.0%) | |
| concentric | 60 (44.4%) | 29 (38.7%) | |
| OSTEOARTHRITIC CHANGES | |||
| Number of osteoarthritic changes | 0.0152 3 | ||
| av. (SD) | 2.3 (1.2) | 1.8 (1.1) | |
| range | 0.0–5.0 | 0.0–5.0 | |
| median | 2 | 2 | |
| 25–74% percentile | 1.0–3.0 | 1.0–2.0 | |
| 95% CI | [2.0; 2.5] | [1.6; 2.1] | |
| Subcortical sclerosis | 39 (28.9%) | 31 (41.3%) | 0.0668 1 |
| Osteophyte | 32 (23.7%) | 25 (33.3%) | 0.1327 1 |
| Subcortical cyst | 7 (5.2%) | 16 (21.3%) | 0.0003 1 |
| Surface erosion | 55 (40.7%) | 33 (44.0%) | 0.6465 1 |
| Articular surface flattening | 121 (89.6%) | 68 (90.7%) | 0.8103 1 |
| Generalized sclerosis | 0 (0.0%) | 2 (2.7%) | 0.0566 1 |
© 2020 by the authors. Licensee MDPI, Basel, Switzerland. This article is an open access article distributed under the terms and conditions of the Creative Commons Attribution (CC BY) license (http://creativecommons.org/licenses/by/4.0/).
Share and Cite
Derwich, M.; Mitus-Kenig, M.; Pawlowska, E. Temporomandibular Joints’ Morphology and Osteoarthritic Changes in Cone-Beam Computed Tomography Images in Patients with and without Reciprocal Clicking—A Case Control Study. Int. J. Environ. Res. Public Health 2020, 17, 3428. https://doi.org/10.3390/ijerph17103428
Derwich M, Mitus-Kenig M, Pawlowska E. Temporomandibular Joints’ Morphology and Osteoarthritic Changes in Cone-Beam Computed Tomography Images in Patients with and without Reciprocal Clicking—A Case Control Study. International Journal of Environmental Research and Public Health. 2020; 17(10):3428. https://doi.org/10.3390/ijerph17103428
Chicago/Turabian StyleDerwich, Marcin, Maria Mitus-Kenig, and Elzbieta Pawlowska. 2020. "Temporomandibular Joints’ Morphology and Osteoarthritic Changes in Cone-Beam Computed Tomography Images in Patients with and without Reciprocal Clicking—A Case Control Study" International Journal of Environmental Research and Public Health 17, no. 10: 3428. https://doi.org/10.3390/ijerph17103428
APA StyleDerwich, M., Mitus-Kenig, M., & Pawlowska, E. (2020). Temporomandibular Joints’ Morphology and Osteoarthritic Changes in Cone-Beam Computed Tomography Images in Patients with and without Reciprocal Clicking—A Case Control Study. International Journal of Environmental Research and Public Health, 17(10), 3428. https://doi.org/10.3390/ijerph17103428