Development of a Method to Locate Deserts and Food Swamps Following the Experience of a Region in Quebec, Canada


Abstract
1. Introduction
1.1. Local Food Environment and Health
1.2. Study Objectives
2. Materials and Methods
2.1. Data Sources
2.2. Categorization of Stores Where Food Is Sold
2.2.1. Food Stores
2.2.2. Fast Food
2.2.3. Convenience Stores
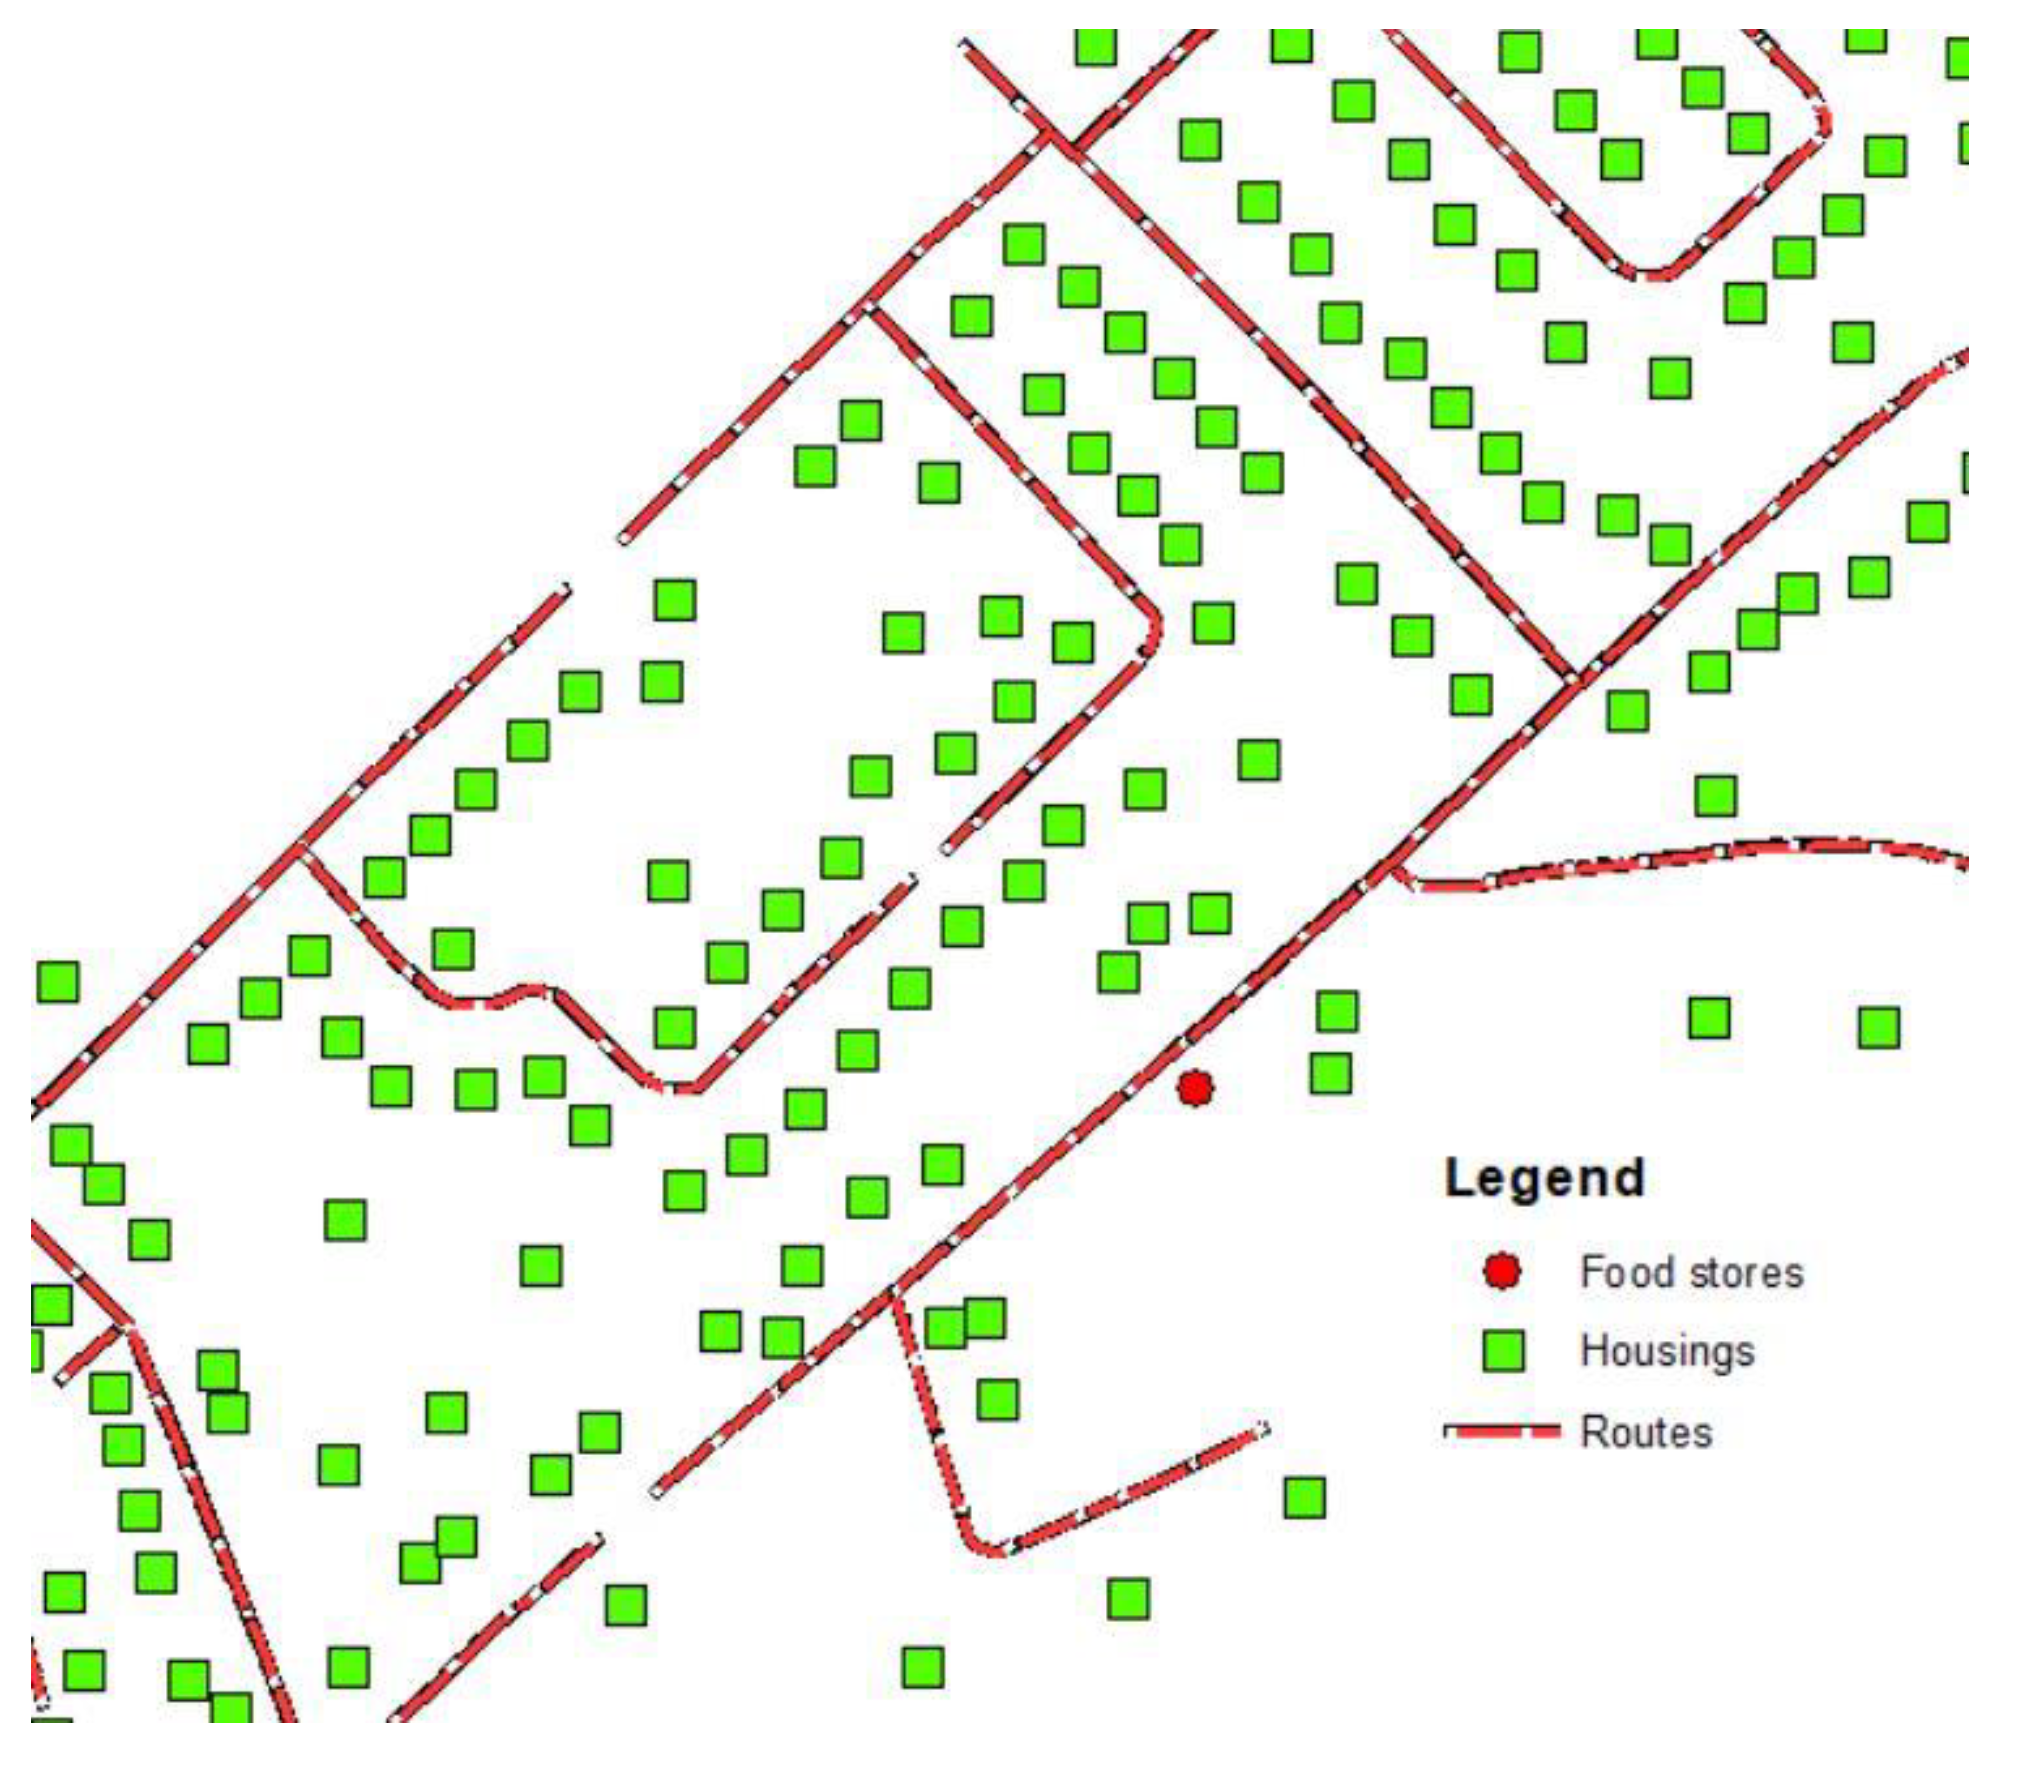
2.3. Geolocation of Shops and Field Validation
2.4. Operationalization of the Food Desert Indicator
- = distance between residential units i and food store j.
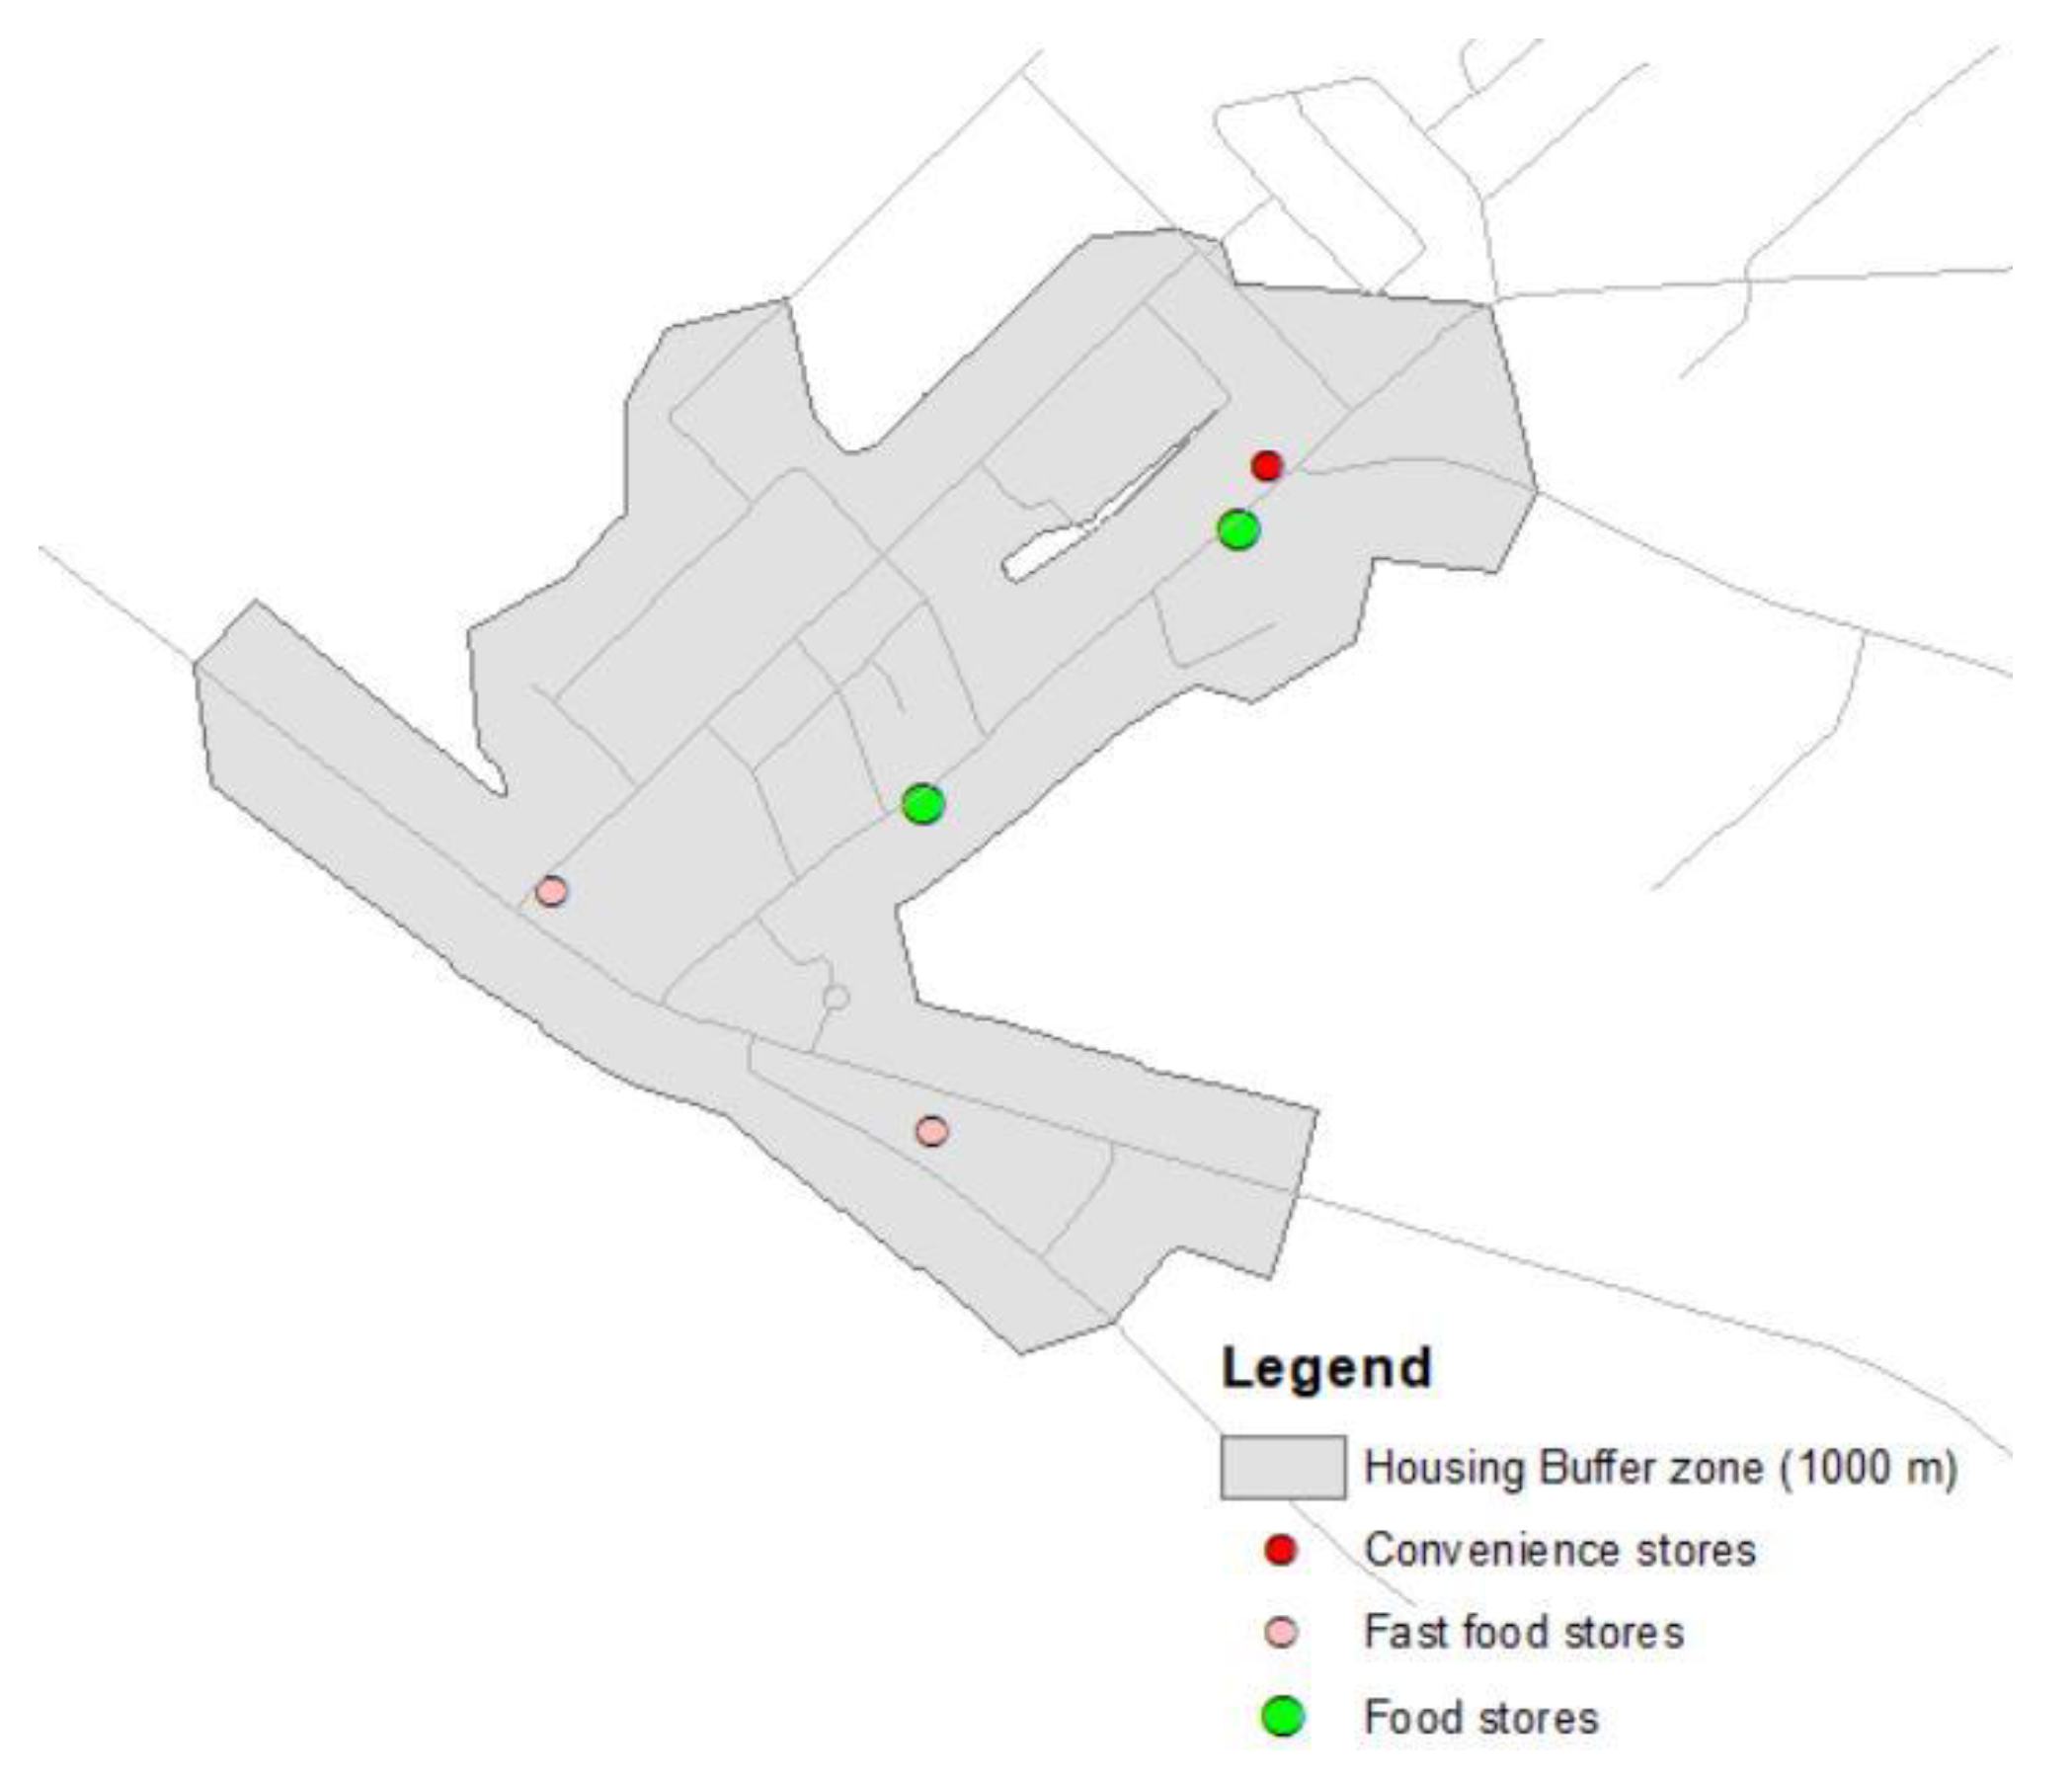
2.5. Operationalization of Areas Qualified as Food Swamps
3. Results
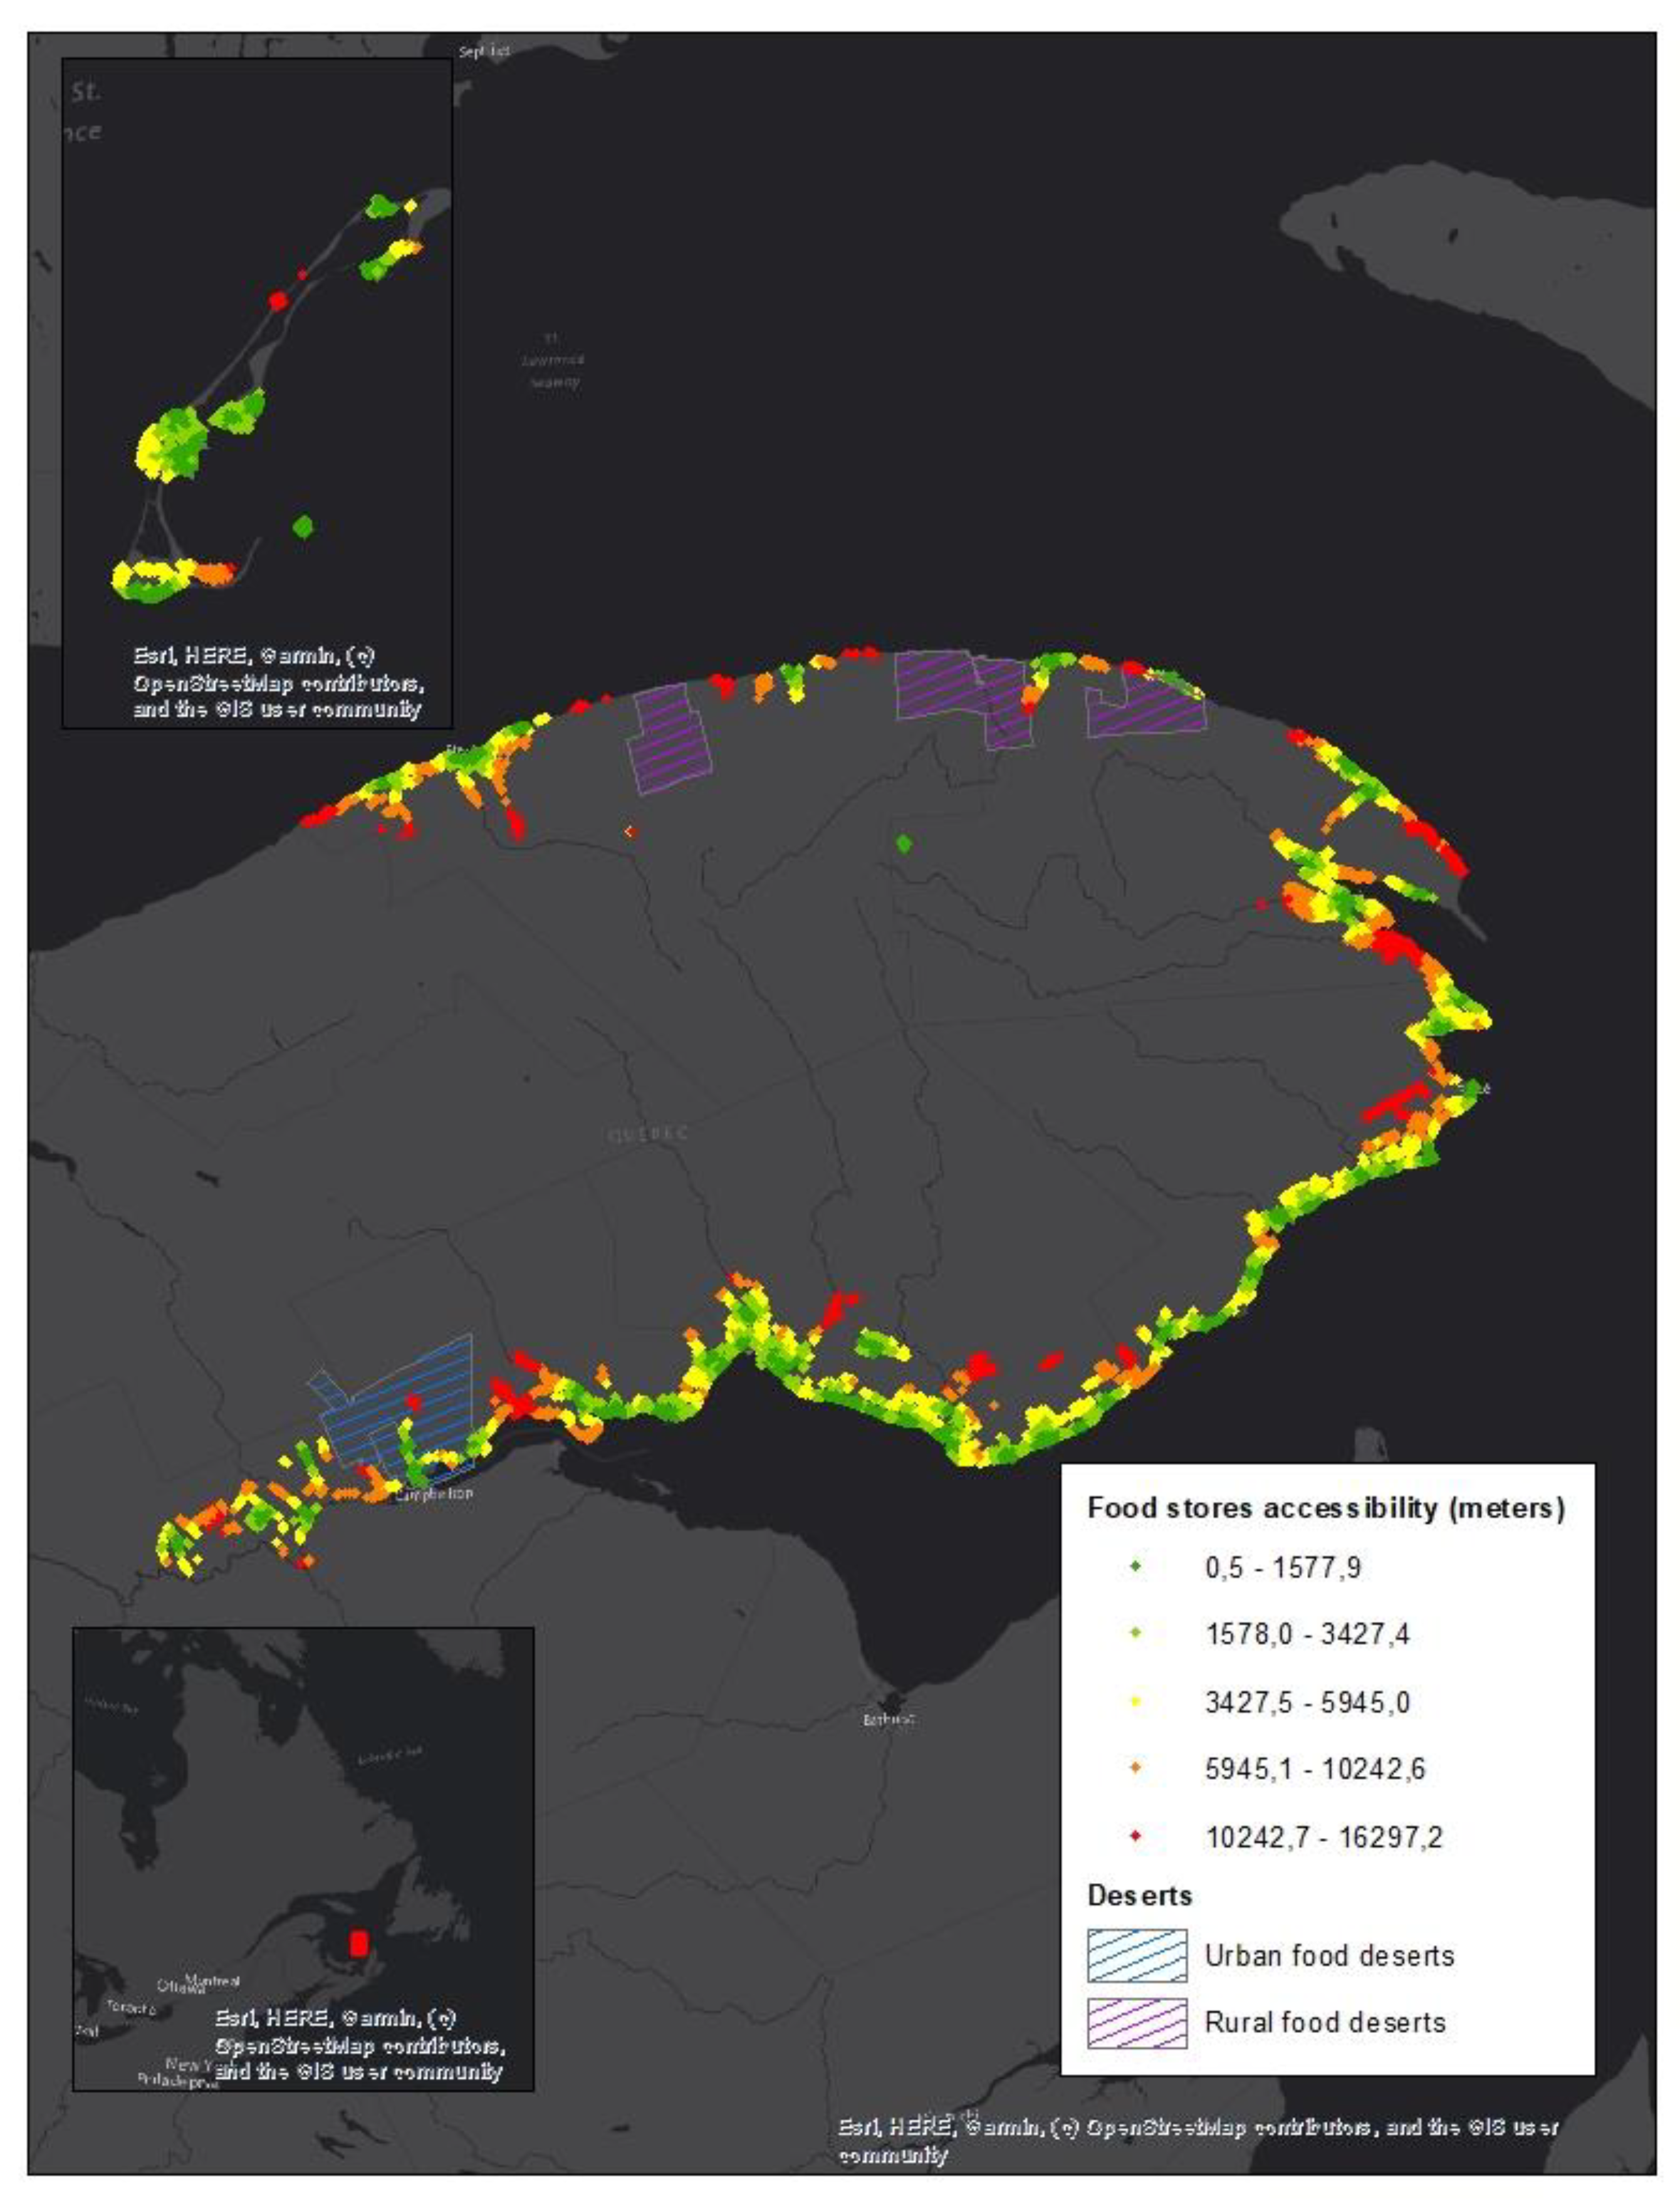
3.1. Food Deserts
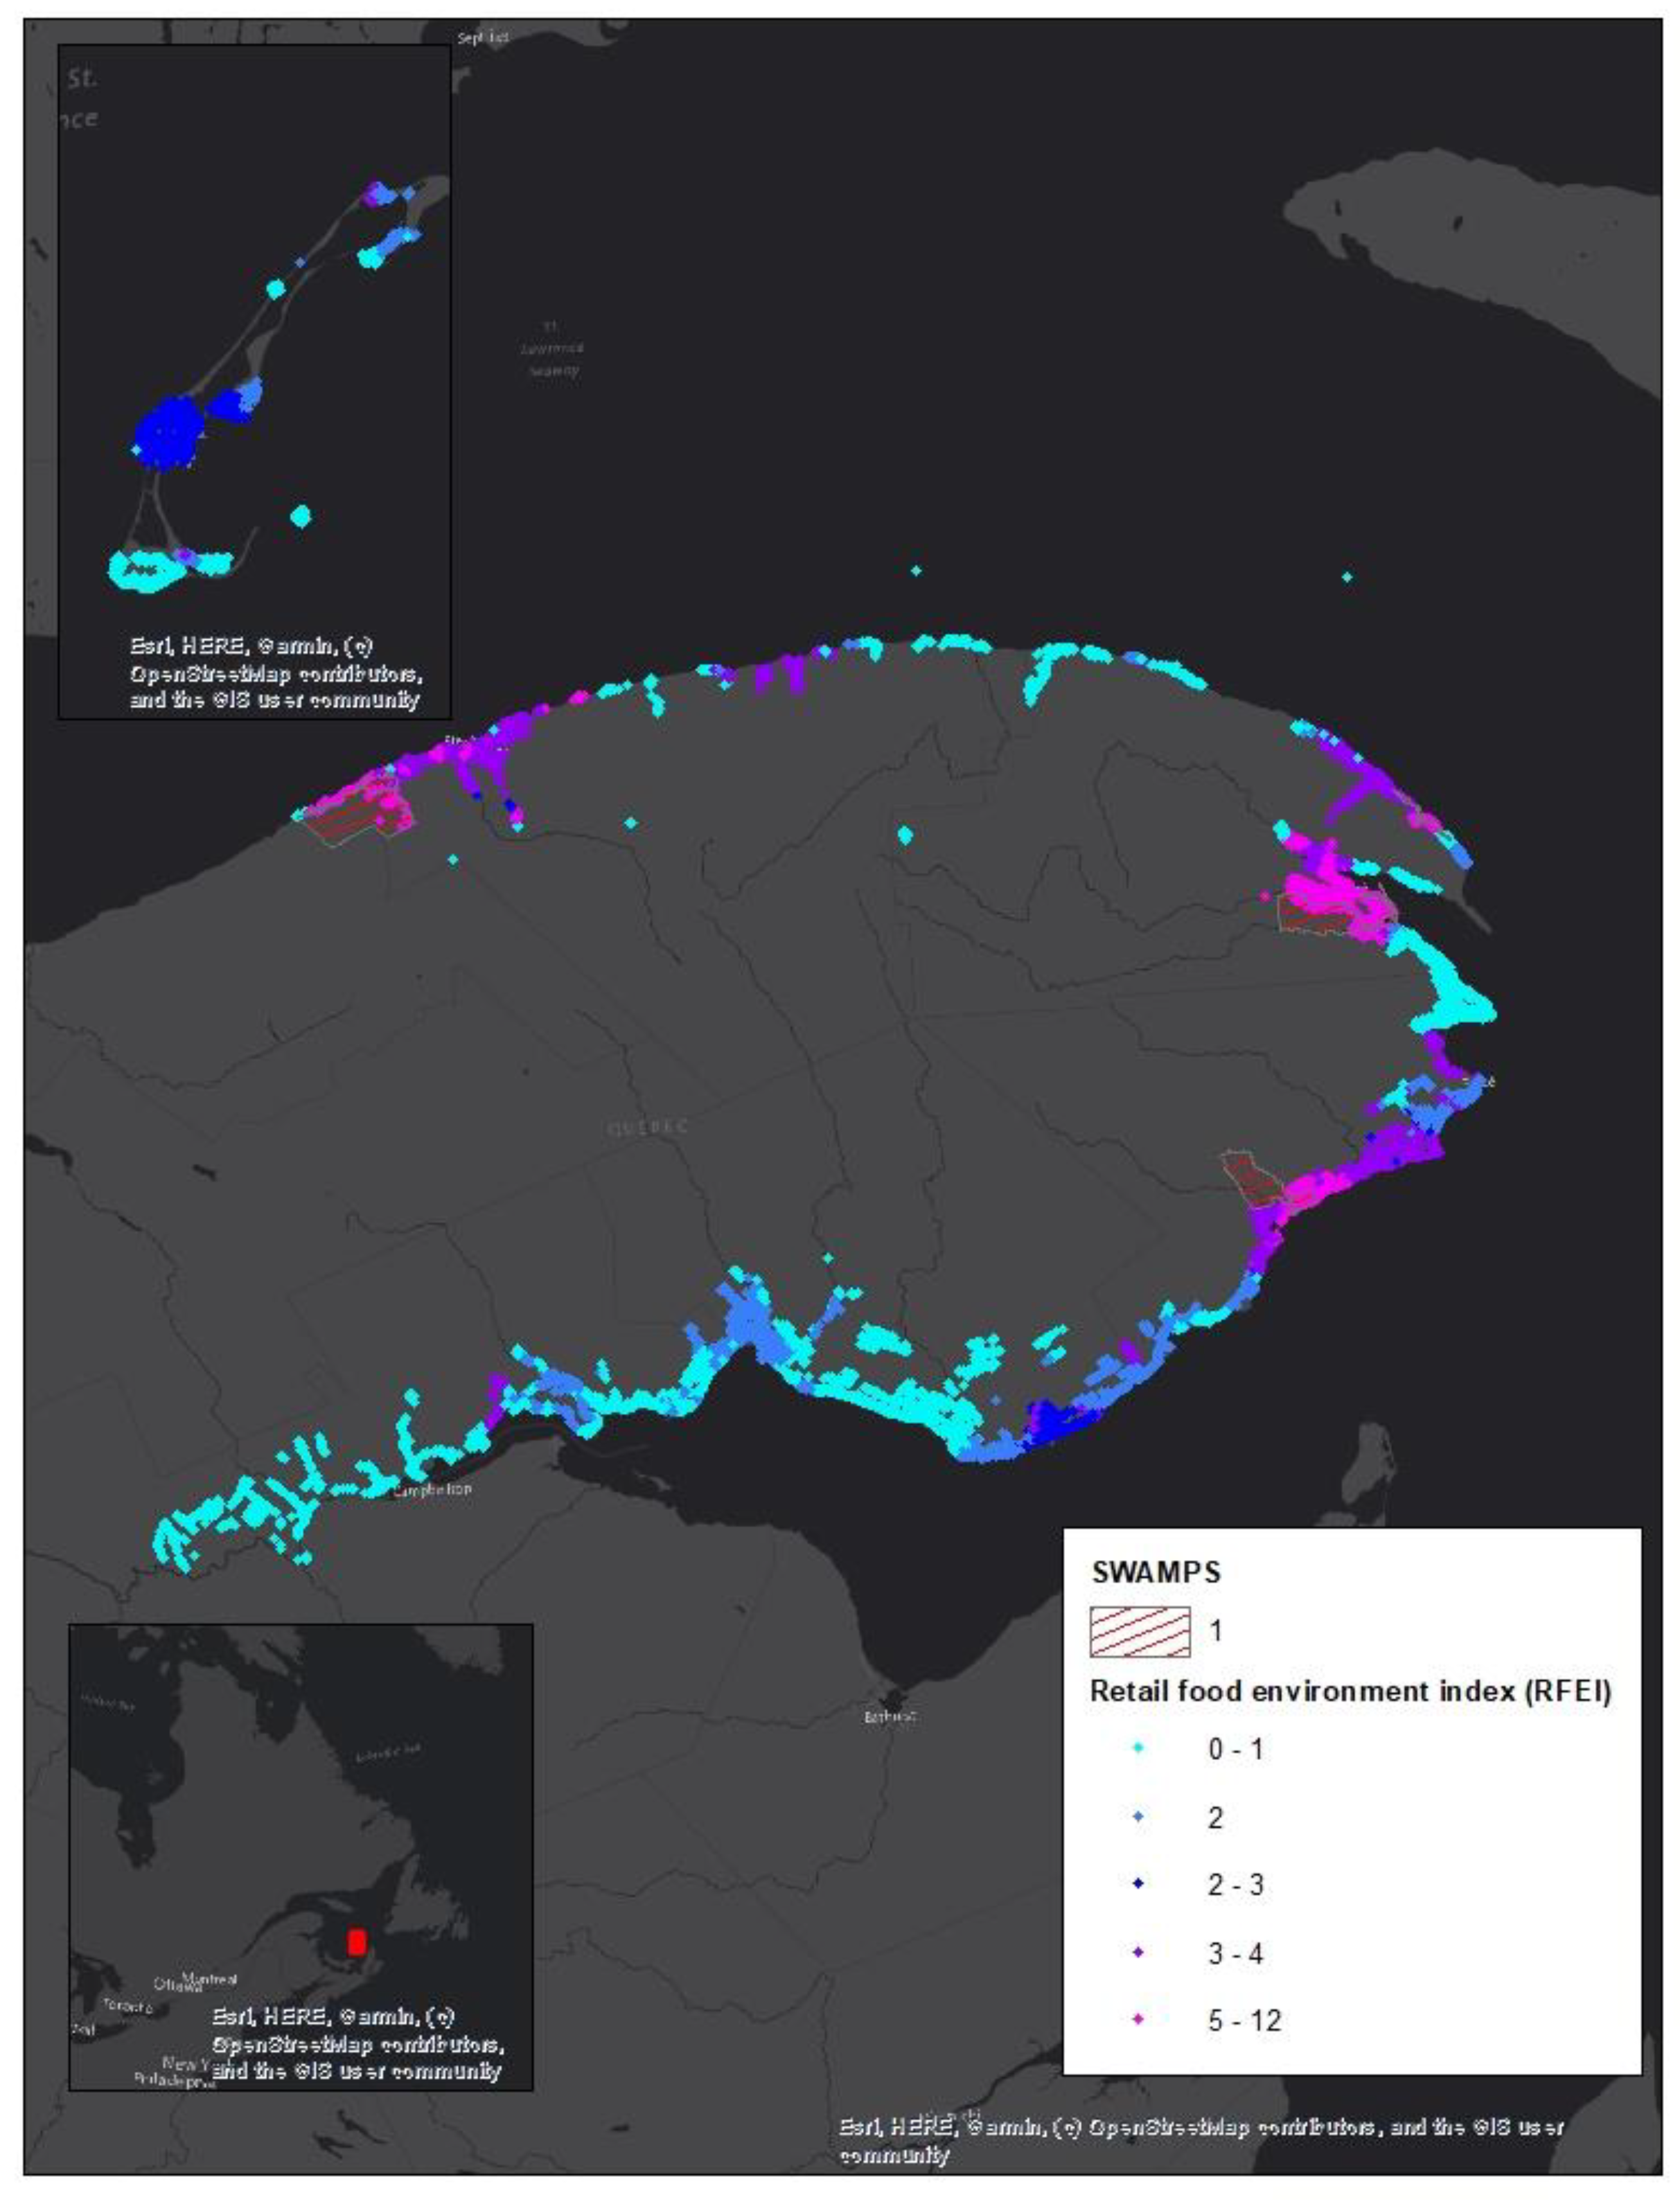
3.2. RFEI and Food Swamps
3.3. Examples of Regional Actions and Policy Implications Following Local Food Environment Mapping
4. Discussion
5. Conclusions
Author Contributions
Funding
Acknowledgments
Conflicts of Interest
References
- Institute for Health and Evaluation Global Burden of Disease (GBD). Available online: http://www.healthdata.org/gbd (accessed on 8 May 2018).
- Garriguet, D. Canadians’ eating. Health Rep. 2007, 18, 17. [Google Scholar] [PubMed]
- Garriguet, D. Diet quality in Canada. Health Rep. 2009, 20, 41. [Google Scholar] [PubMed]
- WHO. Diet, Nutrition and the Prevention of Chronic Diseases. Available online: https://www.who.int/dietphysicalactivity/publications/trs916/en/ (accessed on 29 April 2020).
- Martel, S.; Lo, E.; Jen, Y.; Hamel, D.; Lamontagne, P.; Blouin, C. Poids Corporel et Santé Chez Les Adultes Québécois; Fardeau du poids corporel; Institut national de santé publique du Québec: Montreal, QC, Canada, 2014; ISBN 978-2-550-69662-9. [Google Scholar]
- Lieffers, J.R.L.; Ekwaru, J.P.; Ohinmaa, A.; Veugelers, P.J. The economic burden of not meeting food recommendations in Canada: The cost of doing nothing. PLoS ONE 2018, 13, e0196333. [Google Scholar] [CrossRef] [PubMed]
- Blouin, C.; Vandal, N.; Barry, A.D.; Jen, Y.; Hamel, D.; Lo, E.; Martel, S. Les Conséquences Économiques Associées à L’obésité et à L’embonpoint au Québec: Les Coûts Liés à L’hospitalisation et aux Consultations Médicales; Fardeau du poids corporel; Institut national de santé publique du Québec: Montreal, QC, Canada, 2015; ISBN 978-2-550-72043-0. [Google Scholar]
- Blouin, C.; Vandal, N.; Hamel, D.; Jen, Y.; Lo, E.; Martel, S. Les Conséquences Économiques Associées à L’obésité et L’embonpoint au Québec: Les Coûts Liés à la Consommation de Médicaments et à L’invalidité; Fardeau du poids corporel; Institut national de santé publique du Québec: Montreal, QC, Canada, 2015; ISBN 978-2-550-73814-5. [Google Scholar]
- Committee on Accelerating Progress in Obesity Prevention; Food and Nutrition Board; Institute of Medicine. Accelerating Progress in Obesity Prevention: Solving the Weight of the Nation; Glickman, D., Parker, L., Sim, L.J., Del Valle Cook, H., Miller, E.A., Eds.; National Academies Press (US): Washington, DC, USA, 2012. [Google Scholar]
- Raine, K.D. Determinants of healthy eating in Canada: An overview and synthesis. Can. J. Public Health Rev. Can. Sante Publique 2005, 96 (Suppl. 3), S8-14–S8-15. [Google Scholar]
- Story, M.; Kaphingst, K.M.; Robinson-O’Brien, R.; Glanz, K. Creating healthy food and eating environments: Policy and environmental approaches. Annu. Rev. Public Health 2008, 29, 253–272. [Google Scholar] [CrossRef]
- Giskes, K.; van Lenthe, F.; Avendano-Pabon, M.; Brug, J. A systematic review of environmental factors and obesogenic dietary intakes among adults: Are we getting closer to understanding obesogenic environments? Obes. Rev. Off. J. Int. Assoc. Study Obes. 2011, 12, e95–e106. [Google Scholar] [CrossRef]
- WCRF. Our Policy Framework to Promote Healthy Diets & Reduce Obesity. Available online: https://www.wcrf.org/int/policy/nourishing/our-policy-framework-promote-healthy-diets-reduce-obesity (accessed on 29 April 2020).
- Lachance, B.; Pageau, M.; Roy, S. Investir Pour L’avenir Plan D’action Gouvernemental de Promotion des Saines Habitudes de vie et de Prévention des Problèmes Reliés au Poids 2006-2012; Santé et services sociaux Québec: Quebec, QC, Canada, 2006; ISBN 2-550-47403-1. [Google Scholar]
- Glanz, K.; Sallis, J.F.; Saelens, B.E.; Frank, L.D. Healthy nutrition environments: Concepts and measures. Sect. Sci. Health Promot. 2005, 19, 330–333. [Google Scholar] [CrossRef]
- Cummins, S.; Macintyre, S. Food environments and obesity—Neighbourhood or nation? Int. J. Epidemiol. 2006, 35, 100–104. [Google Scholar] [CrossRef]
- Wrigley, N. “Food deserts” in British cities: Policy context and research priorities. Urban Stud. 2002, 39, 2029–2040. [Google Scholar] [CrossRef]
- Penchansky, R.; Thomas, J.W. The concept of access: Definition and relationship to consumer satisfaction. Med. Care 1981, 127–140. [Google Scholar] [CrossRef]
- Beaulac, J.; Kristjansson, E.; Cummins, S. A systematic review of food deserts, 1966–2007. Prev. Chronic Dis. 2009, 6, 1–10. [Google Scholar]
- Black, C.; Moon, G.; Baird, J. Dietary inequalities: What is the evidence for the effect of the neighbourhood food environment? Health Place 2014, 27, 229–242. [Google Scholar] [CrossRef] [PubMed]
- Zenk, S.N.; Schulz, A.J.; Israel, B.A.; James, S.A.; Bao, S.; Wilson, M.L. Neighborhood racial composition, neighborhood poverty, and the spatial accessibility of supermarkets in metropolitan Detroit. Am. J. Public Health 2005, 95, 660–667. [Google Scholar] [CrossRef] [PubMed]
- Blanchard, T.C.; Matthews, T.L. Retail Concentration, Food Deserts, and Food-Disadvantaged Communities in Rural America. In Remaking the North American Food System; Hinrichs, C., Lyson, T., Eds.; University of Nebraska Press: Lincoln, NE, USA, 2007. [Google Scholar]
- Morton, L.W.; Blanchard, T.C. Starved for access: Life in rural America’s food deserts. Rural Realities 2007, 1, 1–10. [Google Scholar]
- Hemphill, E.; Raine, K.; Spence, J.C.; Smoyer-Tomic, K.E. Exploring obesogenic food environments in Edmonton, Canada: The association between socioeconomic factors and fast-food outlet access. Am. J. Health Promot. AJHP 2008, 22, 426–432. [Google Scholar] [CrossRef]
- Smoyer-Tomic, K.E.; Spence, J.C.; Raine, K.D.; Amrhein, C.; Cameron, N.; Yasenovskiy, V.; Cutumisu, N.; Hemphill, E.; Healy, J. The association between neighborhood socioeconomic status and exposure to supermarkets and fast food outlets. Health Place 2008, 14, 740–754. [Google Scholar] [CrossRef]
- Minaker, L.M. Retail food environments in Canada: Maximizing the impact of research, policy and practice. Can. J. Public Health Rev. Can. Sante Publique 2016, 107, eS1–eS3. [Google Scholar] [CrossRef]
- Hager, E.R.; Cockerham, A.; O’Reilly, N.; Harrington, D.; Harding, J.; Hurley, K.M.; Black, M.M. Food swamps and food deserts in Baltimore City, MD, USA: Associations with dietary behaviours among urban adolescent girls. Public Health Nutr. 2017, 20, 2598–2607. [Google Scholar] [CrossRef]
- Rose, D.; Bodor, J.N.; Hutchinson, P.L.; Swalm, C.M. The importance of a multi-dimensional approach for studying the links between food access and consumption. J. Nutr. 2010, 140, 1170–1174. [Google Scholar] [CrossRef]
- Sushil, Z.; Vandevijvere, S.; Exeter, D.J.; Swinburn, B. Food swamps by area socioeconomic deprivation in New Zealand: A national study. Int. J. Public Health 2017, 62, 869–877. [Google Scholar] [CrossRef]
- Health Canada. Measuring the Food Environment in Canada. Available online: https://www.canada.ca/en/health-canada/services/food-nutrition/healthy-eating/nutrition-policy-reports/measuring-food-environment-canada.html (accessed on 3 March 2020).
- Santé Canada. Mesure de L’environnement Alimentaire au Canada; Gouvernement du Canada: Ottawa, ON, Canada, 2013; p. 98. [Google Scholar]
- Andrews, M.R.; Ayers, C.; Ceasar, J.; Claudel, S.; Das, S.; Neeland, I.; Tamura, K.; Powell-Wiley, T. Abstract P322: The Relationship Between Neighborhood Food Environment and Adiposity Measures: Data From the Dallas Heart Study. Circulation 2018, 137, AP322. [Google Scholar]
- Cooksey-Stowers, K.; Schwartz, M.B.; Brownell, K.D. Food Swamps Predict Obesity Rates Better Than Food Deserts in the United States. Int. J. Environ. Res. Public. Health 2017, 14, 1366. [Google Scholar] [CrossRef] [PubMed]
- MAPAQ. Permis de Vente D’aliments; MAPAQ: Quebec, QC, Canada, 2018. [Google Scholar]
- Gamache, P.; Hamel, D. Guide Méthodologique: L’indice de Défavorisation Matérielle et Sociale en Bref; INSPQ: Québec, QC, Canada, 2015. [Google Scholar]
- Statistique Canada. Statistique Canada: Enquête nationale Auprès des Ménages (ENM) de 2011. Available online: http://www12.statcan.gc.ca/nhs-enm/index-fra.cfm (accessed on 15 September 2015).
- MAMH. Rôle D’évaluation Foncière. Available online: https://www.mamh.gouv.qc.ca/evaluation-fonciere/evaluation-fonciere-municipale-au-quebec/role-devaluation-fonciere/ (accessed on 11 April 2020).
- Statistique Canada. Dictionnaire du Recensement de 2011; Statistique Canada: Ottawa, ON, Canada, 2011. [Google Scholar]
- Mahendra, A.; Polsky, J.Y.; Robitaille, É.; Lefebvre, M.; McBrien, T.; Minaker, L.M. Status report—Geographic retail food environment measures for use in public health. Health Promot. Chronic Dis. Prev. Can. Res. Policy Pract. 2017, 37, 357–362. [Google Scholar] [CrossRef] [PubMed]
- Adresses Québec. Available online: http://adressesquebec.gouv.qc.ca/index.asp (accessed on 11 April 2020).
- ESRI. Arcgis 10.5.1; ESRI: Redland, CA, USA, 2017. [Google Scholar]
- Apparicio, P.; Gelb, J.; Dubé, A.-S.; Kingham, S.; Gauvin, L.; Robitaille, É. The approaches to measuring the potential spatial access to urban health services revisited: Distance types and aggregation-error issues. Int. J. Health Geogr. 2017, 16, 32. [Google Scholar] [CrossRef] [PubMed]
- Algert, S.J.; Agrawal, A.; Lewis, D.S. Disparities in access to fresh produce in low-income neighborhoods in Los Angeles. Am. J. Prev. Med. 2006, 30, 365–370. [Google Scholar] [CrossRef] [PubMed]
- Apparicio, P.; Cloutier, M.-S.; Shearmur, R. The case of Montréal’s missing food deserts: Evaluation of accessibility to food supermarkets. Int. J. Health Geogr. 2007, 6, 4. [Google Scholar] [CrossRef]
- USDA. USDA ERS—Food Access Research Atlas. Available online: https://www.ers.usda.gov/data-products/food-access-research-atlas/ (accessed on 26 March 2018).
- Spence, J.C.; Cutumisu, N.; Edwards, J.; Raine, K.D.; Smoyer-Tomic, K. Relation between local food environments and obesity among adults. BMC Public Health 2009, 9, 192. [Google Scholar] [CrossRef]
- CCPHA. Designed for Disease: The Link between Local Food Environments and Obesity and Diabetes; CCPHA: Davis, CA, USA, 2008; p. 16. [Google Scholar]
- Statistics Canada. 2016 Census of Population. Available online: https://www12.statcan.gc.ca/census-recensement/2016/dp-pd/index-eng.cfm (accessed on 29 April 2020).
- Cent Degrés Nourrir Notre Monde: Les Gaspésiens se Réapproprient Leur Système Alimentaire. Available online: https://centdegres.ca/magazine/alimentation/nourrir-notre-monde-les-gaspesiens-se-reapproprient-leur-systeme-alimentaire/ (accessed on 31 March 2020).
- Yang, H.; Carmon, Z.; Kahn, B.; Malani, A.; Schwartz, J.; Volpp, K.; Wansink, B. The Hot–Cold Decision Triangle: A framework for healthier choices. Mark. Lett. 2012, 23, 457–472. [Google Scholar] [CrossRef]
- Bridle-Fitzpatrick, S. Food deserts or food swamps?: A mixed-methods study of local food environments in a Mexican city. Soc. Sci. Med. 1982 2015, 142, 202–213. [Google Scholar] [CrossRef]
- Keener, D.; Goodman, K.; Lowry, A.; Zaro, S.; Kettel Khan, L. Recommended Community Strategies and Measurements to Prevent Obesity in the United States; Department of Health and Human Services, Centers for Disease Control and Prevention: Atlanta, GA, USA, 2009. [Google Scholar]
- Pérez, E.; Roncarolo, F.; Potvin, L. Associations between the local food environment and the severity of food insecurity among new families using community food security interventions in Montreal. Can. J. Public Health Rev. Can. Sante Publique 2017, 108, e49–e55. [Google Scholar] [CrossRef]
- Organisation Mondiale De La Santé. WHO European Action Plan for Food and Nutrition Policy 2077–2012; WHO: Copenhagen, Denmark, 2008. [Google Scholar]
- CDC. CDC—Zoning to Encourage Healthy Eating—Winnable Battles—Public Health Law. Available online: http://www.cdc.gov/phlp/winnable/zoning_obesity.html (accessed on 7 February 2014).
- Sadler, R.C. Strengthening the core, improving access: Bringing healthy food downtown via a farmers’ market move. Appl. Geogr. 2016, 67, 119–128. [Google Scholar] [CrossRef]
- Rogus, S.; Athens, J.; Cantor, J.; Elbel, B. Measuring Micro-Level Effects of a New Supermarket: Do Residents Within 0.5 Mile Have Improved Dietary Behaviors? J. Acad. Nutr. Diet. 2018, 118, 1037–1046. [Google Scholar] [CrossRef] [PubMed]
- Richardson, A.S.; Ghosh-Dastidar, M.; Beckman, R.; Flórez, K.R.; DeSantis, A.; Collins, R.L.; Dubowitz, T. Can the introduction of a full-service supermarket in a food desert improve residents’ economic status and health? Ann. Epidemiol. 2017, 27, 771–776. [Google Scholar] [CrossRef] [PubMed]
- AbuSabha, R.; Namjoshi, D.; Klein, A. Increasing Access and Affordability of Produce Improves Perceived Consumption of Vegetables in Low-Income Seniors. J. Am. Diet. Assoc. 2011, 111, 1549–1555. [Google Scholar] [CrossRef] [PubMed]
- Evans, A.; Banks, K.; Jennings, R.; Nehme, E.; Nemec, C.; Sharma, S.; Hussaini, A.; Yaroch, A. Increasing access to healthful foods: A qualitative study with residents of low-income communities. Int. J. Behav. Nutr. Phys. Act. 2015, 12 (Suppl. 1), S5. [Google Scholar] [CrossRef]
- Gorham, G. Effectiveness of Fresh to You, a Discount Fresh Fruit and Vegetable Market in Low-Income Neighborhoods, on Children’s Fruit and Vegetable Consumption, Rhode Island, 2010–2011. Prev. Chronic Dis. 2015, 12, E176. [Google Scholar] [CrossRef] [PubMed]
- Hartmann-Boyce, J.; Bianchi, F.; Piernas, C.; Riches, S.P.; Frie, K.; Nourse, R.; Jebb, S.A. Grocery store interventions to change food purchasing behaviors: A systematic review of randomized controlled trials. Am. J. Clin. Nutr. 2018, 107, 1004–1016. [Google Scholar] [CrossRef]
- Mah, C.L.; Cook, B.; Rideout, K.; Minaker, L.M. Policy options for healthier retail food environments in city-regions. Can. J. Public Health 2016, 107, 5343. [Google Scholar] [CrossRef]
- Table intersectorielle régionale en Saines habitudes de vie COSMOSS du Bas-Saint-Laurent (TIR-SHV). In Favoriser la Saine Alimentation Grâce aux Outils D’aménagement du Territoire; COSMOSS: Rimouski, QC, Canada, 2018; p. 11.
- Centers for Disease Control and Prevention. Healthier Food Retail: An Action Guide for Public Health Practitioners; Department of Health and Human Services: Atlanta, GA, USA, 2014. [Google Scholar]
- Robitaille, É.; Chaput, S.; Paquette, M.-C. Interventions Visant à Modifier L’accessibilité Géographique à des Commerces D’alimentation et Impacts sur L’alimentation et le Poids Corporel: Synthèse des Connaissances; Institut national de santé publique du Québec: Montreal, QC, Canada, 2019; ISBN 978-2-550-85103-5. [Google Scholar]
- TRF. Pennsylvania Fresh Food Financing Initiative. Available online: http://www.trfund.com/pennsylvania-fresh-food-financing-initiative/ (accessed on 28 April 2015).
- Paddeu, F. L’agriculture urbaine à Detroit: Un enjeu de production alimentaire en temps de crise? Pour 2014, 224, 89. [Google Scholar] [CrossRef]
- Paddeu, F. L’agriculture urbaine dans les quartiers défavorisés de la métropole New-Yorkaise: La justice alimentaire à l’épreuve de la justice sociale. VertigO Rev. Électron. Sci. Environ. 2012, 12. [Google Scholar] [CrossRef]
- Fleischhacker, S.E.; Evenson, K.R.; Sharkey, J.; Pitts, S.B.J.; Rodriguez, D.A. Validity of secondary retail food outlet data: A systematic review. Am. J. Prev. Med. 2013, 45, 462–473. [Google Scholar] [CrossRef] [PubMed]
- Lebel, A.; Noreau, D.; Tremblay, L.; Oberlé, C.; Girard-Gadreau, M.; Duguay, M.; Block, J.P. Identifying rural food deserts: Methodological considerations for food environment interventions. Can. J. Public Health Rev. Can. Sante Publique 2016, 107, eS21–eS26. [Google Scholar] [CrossRef] [PubMed]
- Jalbert-Arsenault, É.; Robitaille, É.; Paquette, M.-C. Development, reliability and use of a food environment assessment tool in supermarkets of four neighbourhoods in Montréal, Canada. Health Promot. Chronic Dis. Prev. Can. Res. Policy Pract. 2017, 37, 293–302. [Google Scholar] [CrossRef] [PubMed][Green Version]
- Widener, M.J. Spatial access to food: Retiring the food desert metaphor. Physiol. Behav. 2018, 193, 257–260. [Google Scholar] [CrossRef] [PubMed]
- Fortier, D. La Haute-Gaspésie part en Guerre Contre les Déserts Alimentaires. Available online: http://www.lavantagegaspesien.com/actualites/societe/2017/2/1/la-haute-gaspesie-part-en-guerre-contre-les-deserts-alimentaires.html (accessed on 31 May 2018).
- MRC de la Haute-Gaspésie. Plan de Développement de la Zone Agricole; MRC de la Haute-Gaspésie: Sainte-Anne-des-Monts, QC, Canada, 2018. [Google Scholar]


| Before Field Validation | After Field Validation and Use in Analysis | ||||
|---|---|---|---|---|---|
| # Geolocated Food Stores | # Geolocated of Convenience Store | # Geolocated of Fast Foods | # Geolocated Food Stores | # Geolocated of Convenience Store | # Geolocated of Fast Foods |
| 64 | 76 | 108 | 105 | 66 | 108 |
| Quintiles of Disadvantage Average Level | Mean Level of RFEI | # of Sectors in Rural Areas | # of Sectors in Urban Areas | Total |
|---|---|---|---|---|
| No data | 1.04 | 0 | 0 | 0 |
| 1 (less deprived) | 1.14 | 0 | 0 | 0 |
| 2 | 2.52 | 0 | 0 | 0 |
| 3 | 2.11 | 1 | 0 | 1 |
| 4 | 2.36 | 4 | 0 | 4 |
| 5 (more deprived) | 2.22 | 3 | 0 | 3 |
| Total | 1.76 | 8 | 0 | 8 |
© 2020 by the authors. Licensee MDPI, Basel, Switzerland. This article is an open access article distributed under the terms and conditions of the Creative Commons Attribution (CC BY) license (http://creativecommons.org/licenses/by/4.0/).
Share and Cite
Robitaille, É.; Paquette, M.-C. Development of a Method to Locate Deserts and Food Swamps Following the Experience of a Region in Quebec, Canada. Int. J. Environ. Res. Public Health 2020, 17, 3359. https://doi.org/10.3390/ijerph17103359
Robitaille É, Paquette M-C. Development of a Method to Locate Deserts and Food Swamps Following the Experience of a Region in Quebec, Canada. International Journal of Environmental Research and Public Health. 2020; 17(10):3359. https://doi.org/10.3390/ijerph17103359
Chicago/Turabian StyleRobitaille, Éric, and Marie-Claude Paquette. 2020. "Development of a Method to Locate Deserts and Food Swamps Following the Experience of a Region in Quebec, Canada" International Journal of Environmental Research and Public Health 17, no. 10: 3359. https://doi.org/10.3390/ijerph17103359
APA StyleRobitaille, É., & Paquette, M.-C. (2020). Development of a Method to Locate Deserts and Food Swamps Following the Experience of a Region in Quebec, Canada. International Journal of Environmental Research and Public Health, 17(10), 3359. https://doi.org/10.3390/ijerph17103359