1. Introduction
Vitreous fibers produced for commercial purposes include fibrous glass and mineral wool fiber. Fibrous glass fibers and ceramic fibers have been classified by the International Agency for Research on Cancer (IARC) as “possibly carcinogenic to humans” (Class 2B), while mineral wool fibers have been grouped “unclassifiable as to carcinogenicity to humans”, causing mainly reversible irritation and inflammation of skin, eyes, and upper airways [
1,
2,
3,
4]. Mineral wool fiber is also known as man-made vitreous fibers (MMVFs). Other synonyms include synthetic vitreous fibers (SVFs), man-made mineral fibers (MMMFs), and synthetic mineral fibers (SMFs).
Both the diameter and the length of MMVFs affect responses upon exposure of skin or airways. MMVFs are usually 2–9 µm wide with a length of 1.5–100 µm [
2]. Fibers less than 3 µm in length are respirable by nose breathing, while fibers with a length of less than 5 µm can be breathed through the mouth [
2]. The smaller the fiber diameter, the more likely it is to reach the lungs. A width of less than 3 µm enables the fiber to reach the alveolar region of the lungs [
5]. However, MMVFs less than 5 µm are effectively dissolved or removed by alveolar macrophages. This prevents permanent damage of lung tissues that follows from, for instance, asbestos exposure [
5,
6]. Contrary to airway exposure, fibers more than 4 µm in length have been reported to be more harmful upon skin exposure than smaller ones [
2]. Non-respirable fibers (i.e., fibers more than 5 µm in length) can collect on horizontal surfaces and may, upon redispersion or transfer by fingers to eyes, cause exposure of airways, skin, and eyes. It has been shown that the deposition velocity to the eyes increases with increasing fiber diameter. According to a convention confirmed by the World Health Organization (WHO) and the European Union Scientific Committee on Occupational Exposure Limits (EU/SCOEL), only fibers with a length above 5 µm, a width of less than 3 µm, and a length-to-width ratio of greater than 3:1 should be counted to assess occupational safety. In addition to the health consequence of exposure, this definition stems from established practices and analytical restrictions. Nevertheless, it covers the majority of MMVFs present in indoor environments or production facilities and correspond to the portion of the respirable fraction of fibrous dust able to penetrate to the alveolar region of the lungs. However, since only fibers more than 3 µm in diameter are known to cause transient irritation and inflammation of the skin, eyes, and upper airways, it is important not to exclude thick, non-respirable fibers when assessing surface contamination of fibers. In indoor air, MMVFs settled on surfaces have been reported to have diameters of 3.7 ± 2 µm and a median length of 76–86 µm [
7], while, on average, longer and thicker fibers may be present in production facilities [
8]. However, in practice, smaller fibers with diameters from less than 0.01 to ca. 2.5 µm can be found in mechanically ventilated offices upon electron microscopic analysis. These correspond to the fiber size distribution present in ventilation filters for incoming air and acoustic ceiling and wall panels. Such fibers are relatively harmless upon exposure of skin, eyes, or airways due to their size and elemental composition [
9,
10,
11].
Apart from production facilities, exposure to MMVFs may be of concern in the transportation, distribution, and installation of fiber-rich products. Such commodities include acoustic ceiling and wall panels, wall insulation boards, or insulating materials of pipes and ventilation equipment. The exposure of occupants in premises where MMVF-rich materials are used is often negligible to low, but may in some instances rise to less acceptable levels. For instance, if old or broken ceiling panels or acoustic insulation materials are used, increased levels of MMVFs are present in indoor air and deposited on surfaces [
7]. In addition, filters for incoming air emit fibers to indoor air, almost all of which are less than 3 µm in width and more than 50 µm in length. To the authors’ knowledge, such fibers have not specifically been reported to cause an increase in, for instance, unspecific irritation symptoms, even though mechanical ventilation may not always be unproblematic from this point of view. MMVF levels in the general air of mineral wool plants may be, according to our own measurements, 10–2000 fibers/m
3 and, according to published data, up to 1500 fibers/m
3 [
12,
13]. Construction workers working with MMVF-rich products may inhale, on average, up to 700 fibers/m
3 during a working day and up to 1,000,000 fibers/m
3 during tasks requiring protective masks [
14,
15]. The concentrations in residences and public buildings are mostly below 10 fibers/m
3 but may in extreme cases reach concentrations up to 200 fibers/m
3 [
7,
16,
17].
Exposure to—or the prevalence of—fibers indoors has been estimated using diverse methods depending on prevailing concentrations as well as the presumed source of the fibers. Sampling from air, surfaces, exhaust vents, and fresh air intake vents has been used [
17]. Sometimes samples are also, or exclusively, withdrawn from surfaces of ducts for incoming or outgoing air. As exposure limits or guide values have been given only for the MMVF content in air and less frequently for the surface concentration, other sampling procedures mentioned require benchmark samples of some kind. In production facilities or other occupational settings where exposure to MMVFs can be classified as acceptable to high or unacceptable, fiber concentrations are estimated from air samples using methods published by, for instance, the Health and Safety Executive (HSE), WHO, or the International Standard Organization (ISO) [
18,
19,
20]. Samples are usually withdrawn with the help of a sampling pump on membrane filters using disposable, three-piece, conductive plastic filter holders [
19].
In Finland, a threshold limit value of 0.2 fibers/cm
2 has been set by the Ministry of Social Affairs and Health for the MMMF count on surfaces in indoor environments [
21]. Hence, samples of dust collected for two weeks are frequently withdrawn from Finnish dwellings and offices by using sticky, gelatinous sampling tape as described by Schneider (1986). From exhaust of fresh air ducts, fiber counts in air (fibers/m
3) have been estimated with the help of filter cloths, taking into account the duration of sampling and the laminar flow and filter dimensions [
17]. Lastly, the presence or surface counts of fibers in ventilation ducts have been estimated by, for instance, wiping surfaces with sampling bags or using gelatinous tape [
17].
Surface sampling with gelatinous graduated tape analyzed by phase contrast microscopy (PM) is an affordable method easy to apply in environments with relatively low surface contamination. However, it does have some limitations. The method can only be applied to smooth, clean surfaces. It has a relatively high limit of detection, stemming from the use of PM. Further, the concentration interval (fibers/cm
2) is narrow. In practice, fiber counts of 0.1–100 fibers/cm
2 can be analyzed. Below 0.2 fibers/cm
2, there are less than 3 fibers per tape, rendering sampling poorly reproducible. Above 100 fibers, there are 1400 fibers per tape and 140 per band and, as a result, counting is tedious and may be unreliable. In addition, identification and counting of fibers with a length of 5 µm or less is unreliable using PM [
22]. It follows that fibers between 5 and 20 µm in length are often not counted from gelatinous tapes even though they may contribute to the exposure burden and may add to the health consequence following exposure [
5]. A ca. 1 cm
2 section of the gelatinous tape may also be collapsed with a plasma asher and the residue analyzed after gilding using scanning electron microscopy (SEM) as described in ISO standard 16000-27 [
23]. This enables more precise analysis covering smaller fibers, but due to the small sampling area covered, premises with low or high surface concentrations cannot be analyzed using this methodology, which all but excludes sampling from offices and production facilities.
To overcome some of the shortcomings mentioned above, the present study aimed at producing a new method for the sampling of surface contamination of MMMFs. We attempted to develop a method by which sampling is achieved using suction to a cellulose filter. After the filter is collapsed, the residue is filtered to polycarbonate membrane filters, which are gilded and analyzed with the use of SEM. The purpose was to achieve a method facilitating surface sampling on all kinds of surfaces and applicable to all working environments, with a larger sampling surface and wider concentration range, as well as a larger fiber size interval.
2. Methods
2.1. Sampling Sites
Samples were withdrawn from a plant producing acoustic ceiling and wall panels and wall insulation boards from mainly recycled glass. The portion of recycled glass was ca. 85%, constituting up to 150 million kilograms annually. The production utilized a rotary spray process, where molten glass was poured through a spinner that fiberized the glass into discontinuous fibers. Samples were taken beside the wall of a passageway adjacent to the production line, separating the manufacturing premises from a stairway leading to office areas. The sampling sites were next to the packing unit and the curing oven at a height of approx. 1½ m. In addition, samples were collected from the locker room of the male employees, from the top of the lockers at a height of approx. 2 m. The sampling sites were selected with the aim to cover the whole range of concentrations potentially present in the production facility. The concentrations were assumed to be lowest in the locker room. In the production line, concentrations were expected to decrease from the curing oven to the packing unit.
Surface samples were also taken from three mechanically ventilated office buildings, where acoustic ceiling and wall panels were used and where the sound insulation of incoming air fans may have contributed to the burden of MMVFs on horizontal surfaces.
2.2. Sampling
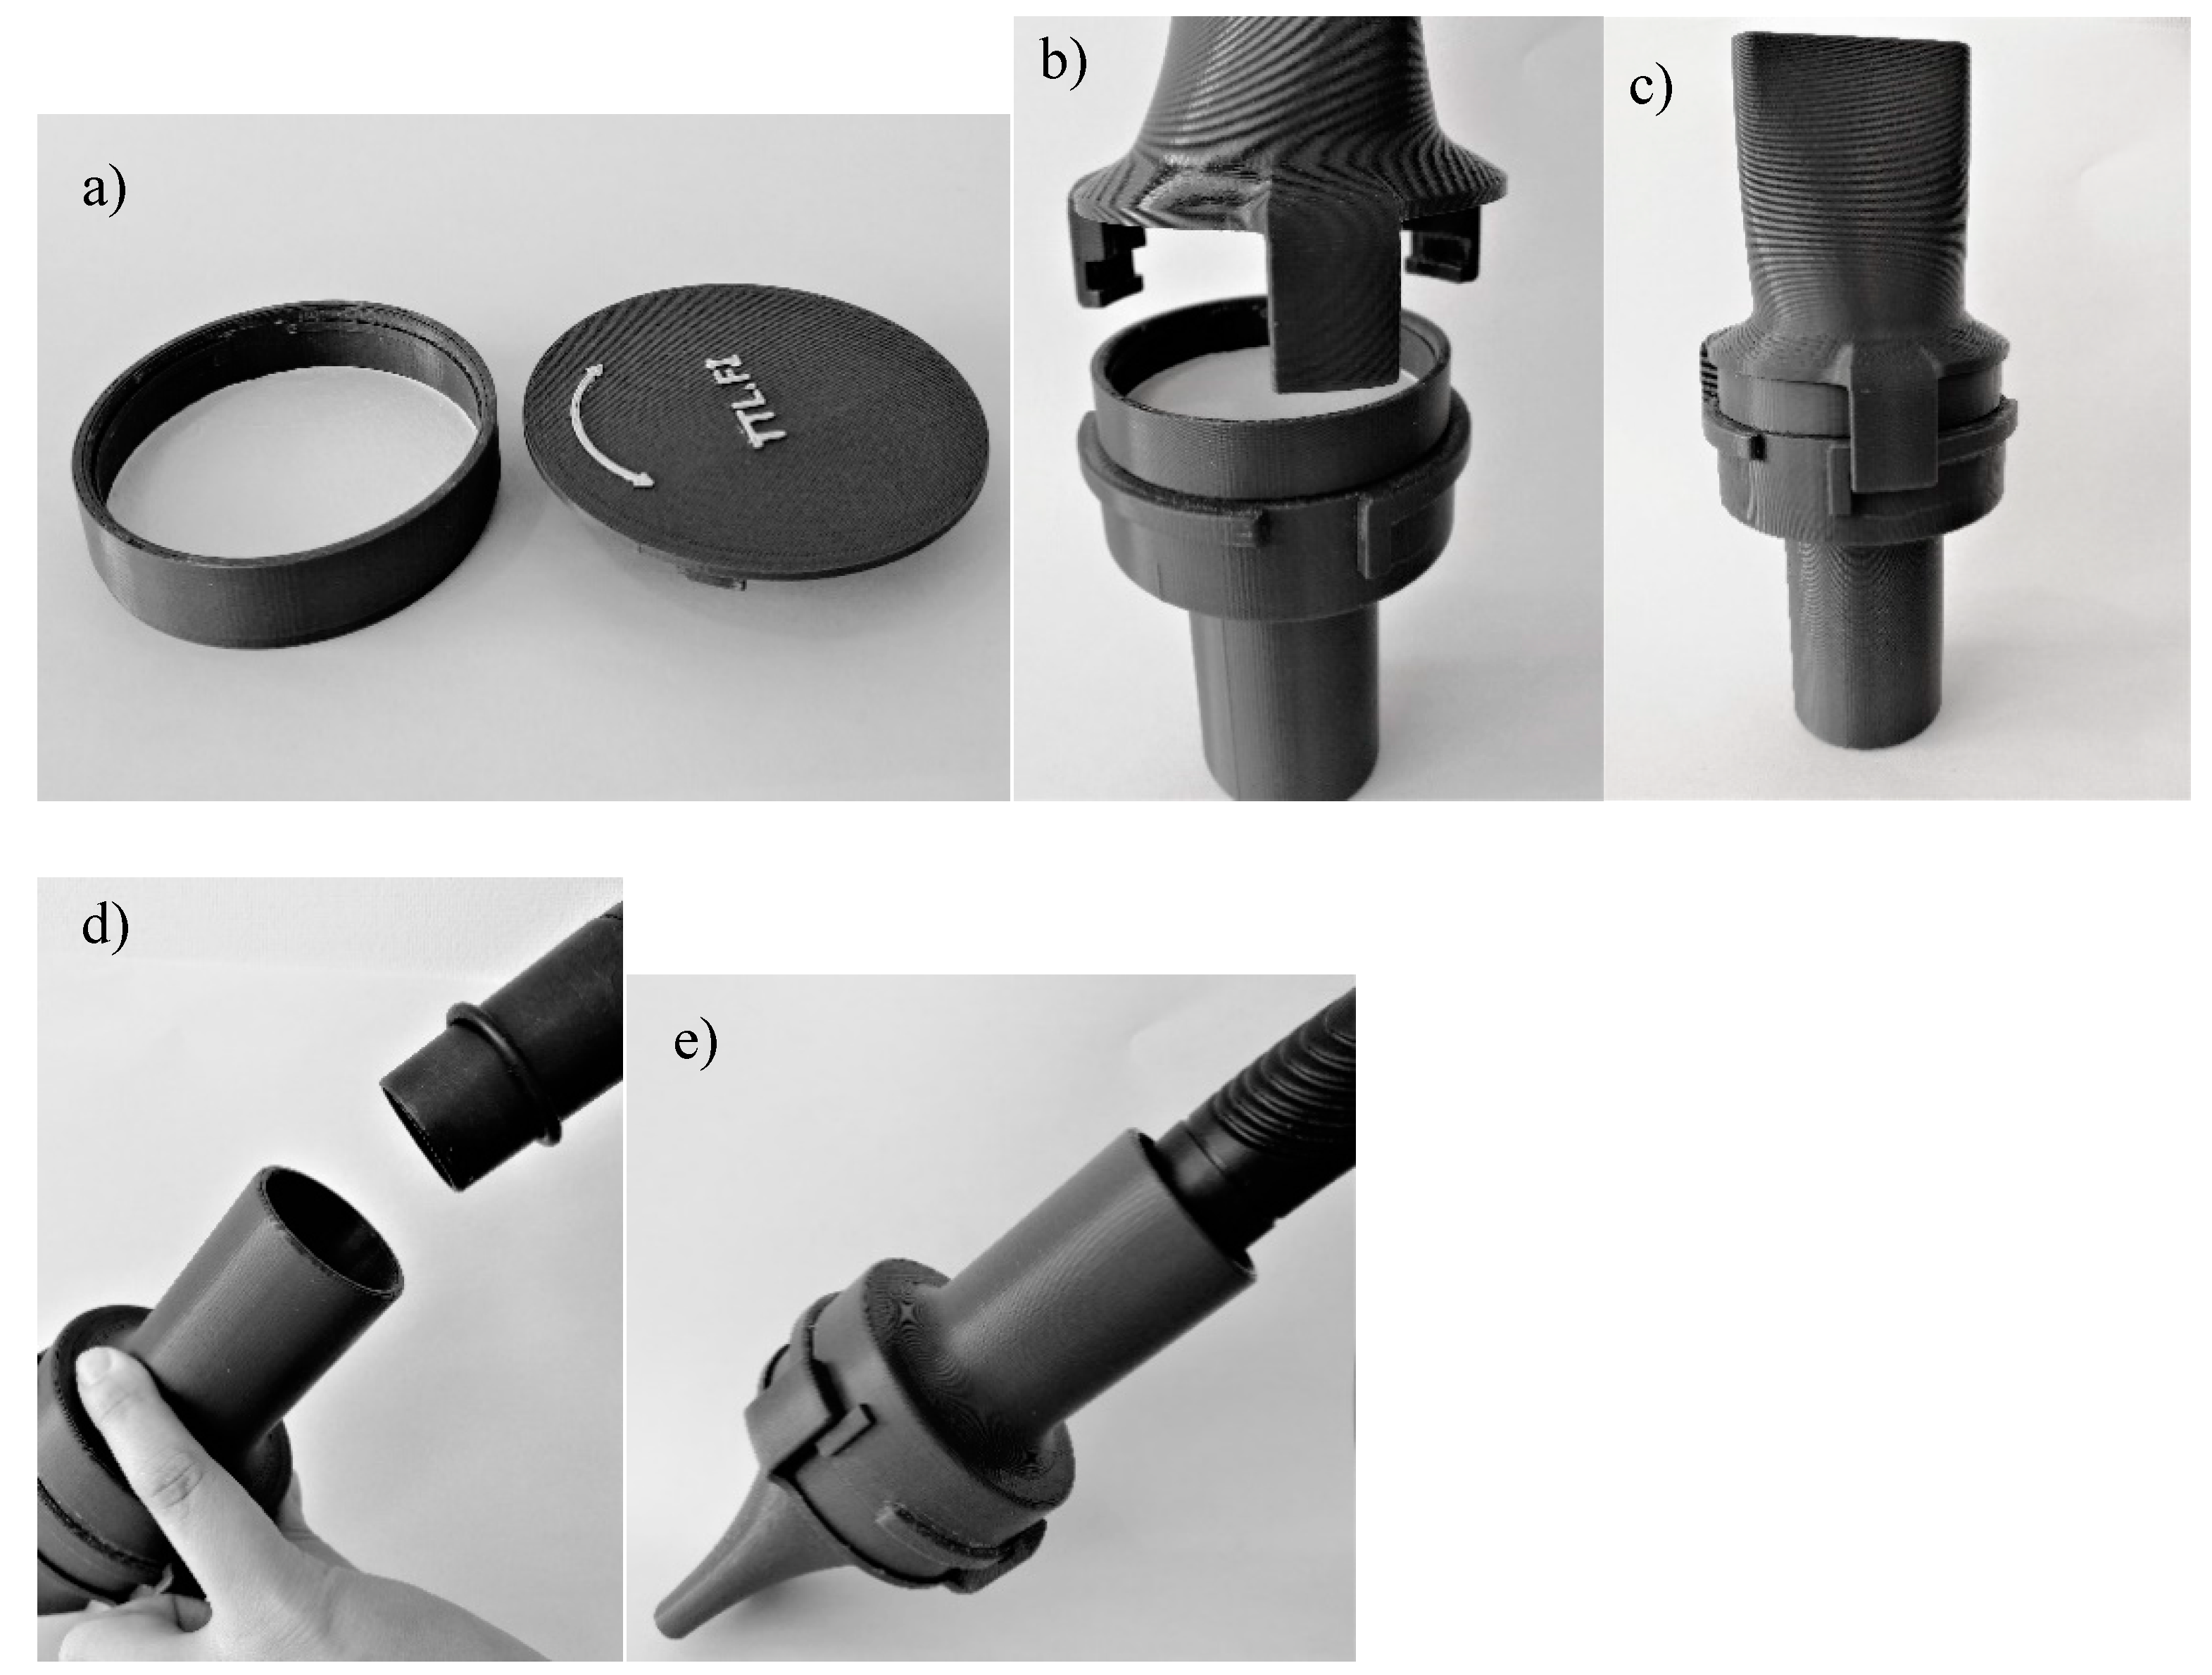
Sampling was performed by means of two methods. The first method was the one developed during the present study. The samples were taken with the help of a standard vacuum cleaner (800 w), from which the dustbag and filters for outgoing air had been removed. The vacuum cleaner was attached to a 3D-printed filter cassette holder containing a Whatman 3 (1003-070) cellulose filter, 70 mm in diameter with a pore size of 6 µm (Merck KGaA, Darmstadt, Germany). See
Figure 1a–e for a detailed description of the filter cassette holder with accompanying parts and its attachment to the vacuum cleaner. Samples were taken from smooth surfaces cleaned by wet wiping 14 days prior to sampling. Rectangular templates with a minimum size of 20 × 20 and maximum size of 120 × 120 cm were used to ensure that predefined sampling areas were met. The templates had a collar with a minimum width of 5 cm to inhibit drawing of fibers from outside the sampling range. In industrial premises, four parallel samples were taken from each sampling site, while only one sample was withdrawn from each sampling location in most of the offices studied.
For reference, sampling was performed also as described in ISO standard 16000-27 [
22] using adhesive tapes with a surface area of 14 cm
2 (BM-Dustlifters, BM Environmental Engineering, BVDA International BV, Haarlem, The Netherlands). Four parallel samples were taken from each sampling sites, both in office-type environments and the production plant.
2.3. Preparation of Filter Samples
Filter cassettes were opened and the filters transferred to clean polytetrafluoroethylene (PTFE) digestion vessels. The cassette internal surfaces were rinsed with 5 ml of deionized water and the water collected in the digestion vessels before adding (slowly) 5 mL of concentrated nitric acid. The vessels were capped using a torque wrench and the samples digested: 1200 W power, temperature gradient from 22 °C to 215 °C during 12 min, the temperature held for 10 min at 215 °C, and the samples cooled for at least 5 min before transferring to a fume hood. Samples were opened at the earliest 30 min before continuing. The samples were rinsed from the PTFE tubes using deionized water and the volume adjusted to 200 ml before filtering the samples through a polycarbonate filter (0.8 µm pore size, 37 mm diameter, Isopore track-etched membrane filters or 0.8 µm pore size, 25 mm diameter, Nuclepore track-etched membrane filters, Merck KGaA, Darmstadt, Germany) using suction. When necessary, a 1:10 and/or 1:100 dilution was prepared using deionized water prior to filtering. Filtered samples were gilded prior to analysis using a Bal-Tec SCD 050 device (BalTec Maschinenbau AG, Pfäffikon, Switzerland).
2.4. Analysis of Filter Samples
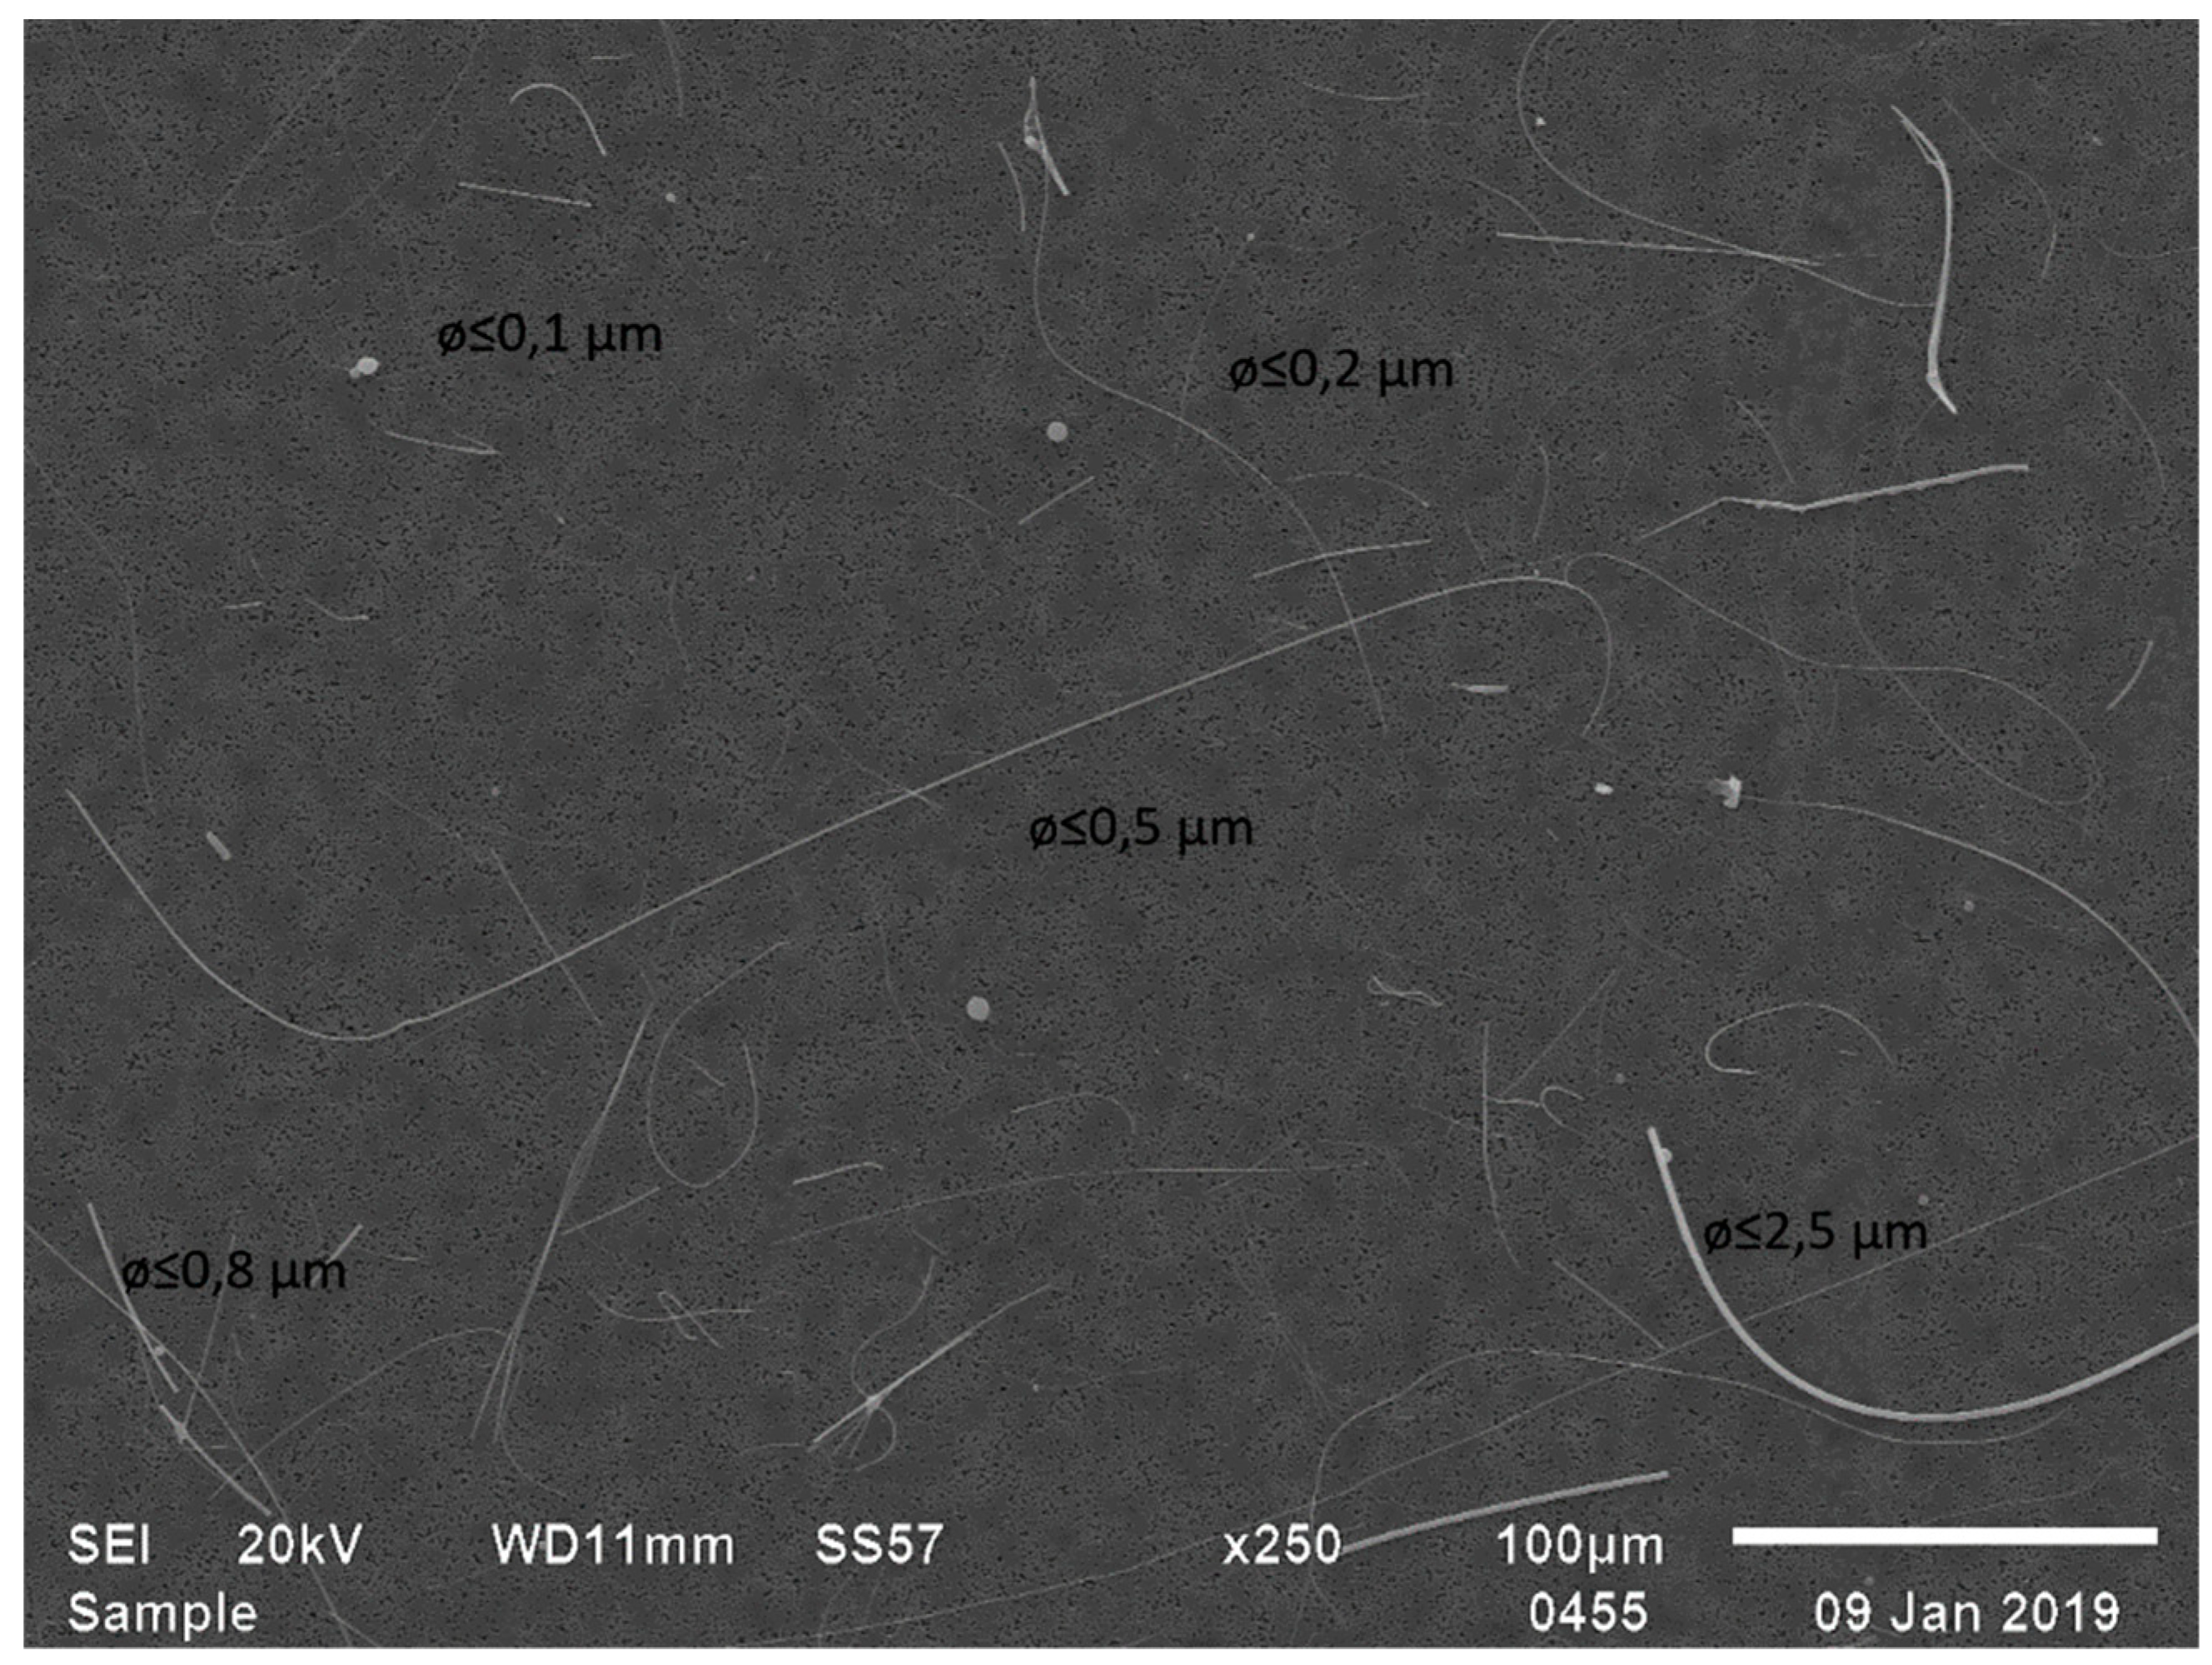
The gilded polycarbonate filters were analyzed as described in ISO standard 14966 [
19]. Briefly, ca. one-quarter portions of the filters were cut out and the pieces analyzed using a Quanta 200 FEG (Thermo Fischer Scientific, Massachusetts, USA) or a JSM 6610 LA (JEOL Technics Ltd, Tokyo, Japan) scanning electron microscope. A magnification of 500 was used to count the fibers and 50–100 image fields were counted. The size of the image field used to calculate fiber counts per square µm and, hence, per sample was adjusted according to the magnification used. Fibers were identified based on morphology and dimensions, using the WHO criteria (L > 5 µm, W < 3 µm, W:L > 3:1). All MMVF fibers meeting the WHO criteria mentioned above, but including fibers more than 3 µm in width and excluding fibers <0.5 µm in width, were counted. In uncertain cases, MMMF fibers were identified by obtaining energy dispersive x-ray (EDX) spectra and comparing the Si:Ca:Al:Na/Mg ratio to reference spectra.
2.5. Analysis of Adhesive Tapes
The tapes were counted under a stereomicroscope (Leica MZ12, Wetzlar, Germany) using a magnification of 100. A graticule slide with twenty lines (ten bands) per 20 mm was used underneath the tape and the magnification adjusted to cover a diameter corresponding to ca. 2 mm (the space between bands) to facilitate counting. All MMVF fibers meeting the WHO criteria mentioned above, but including fibers more than 3 µm in width, were counted.
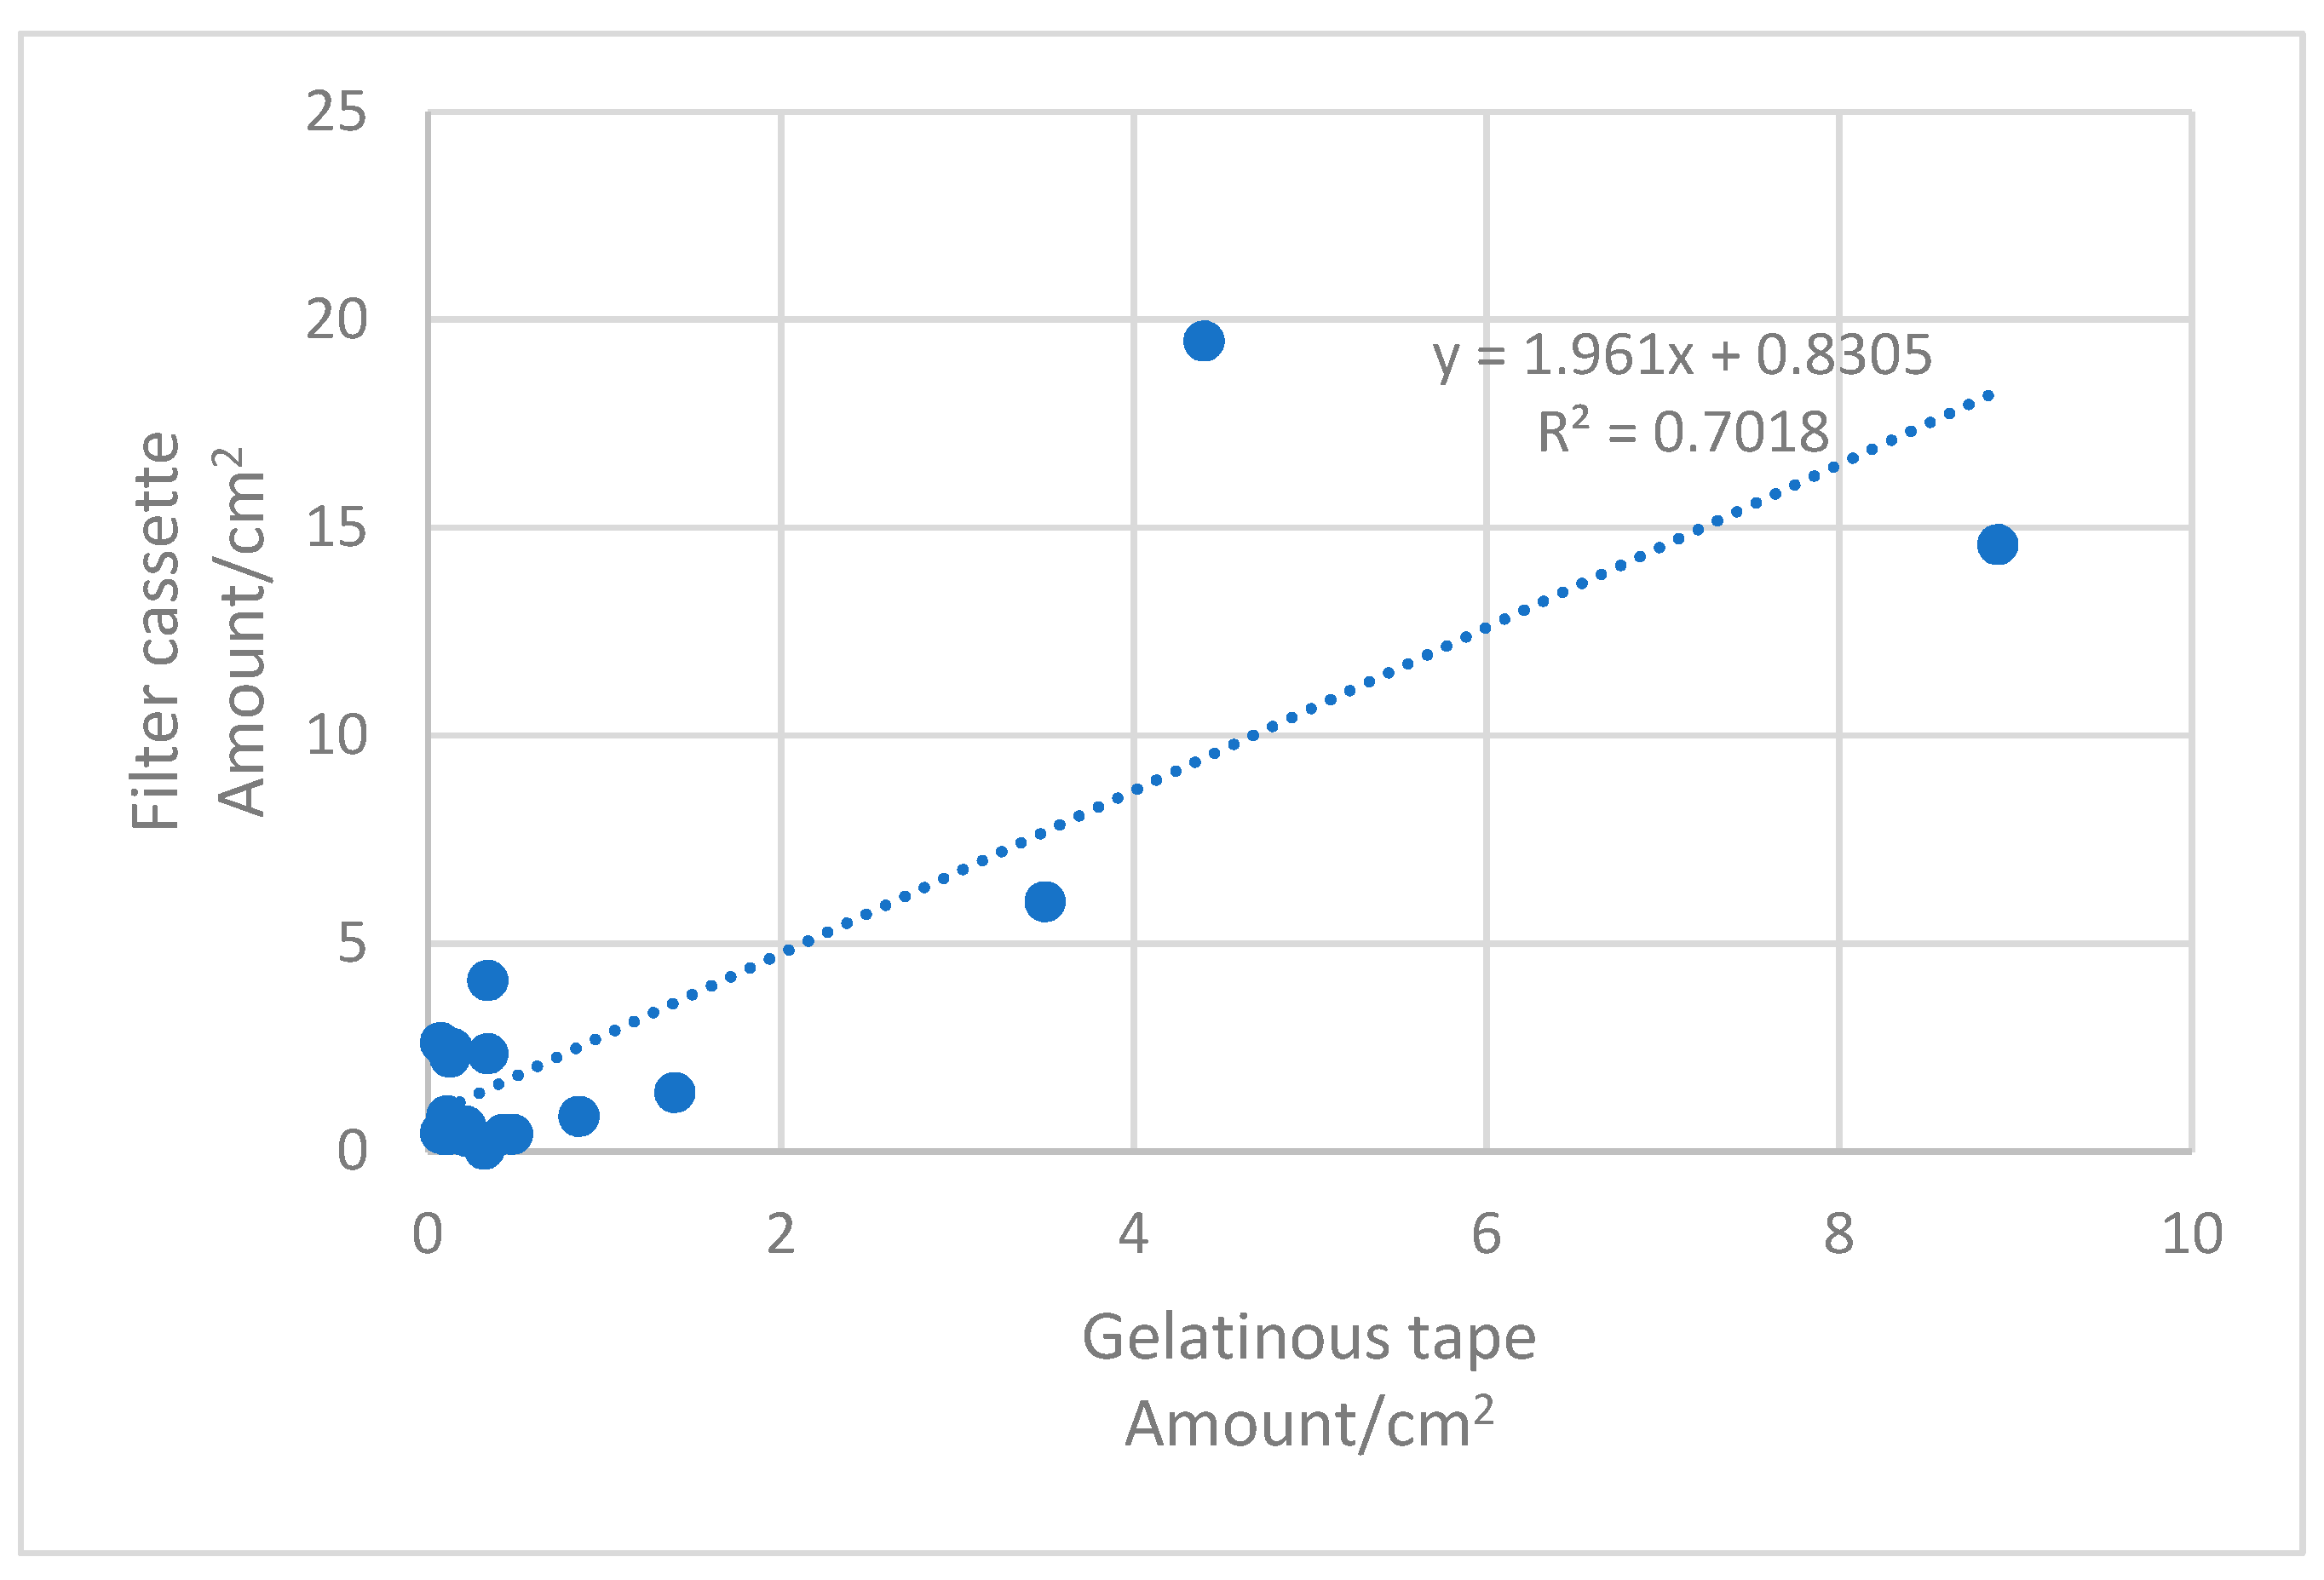
2.6. Testing the Difference between Method-Specific Data and the Correlation between the Methods
Standard t-tests with a 95% confidence interval were used to compare results derived with the two methods in different concentration ranges.
A linear regression analysis was performed with data points derived with the two methods. The Pearson correlation coefficient was tested against its sample-size-dependent
p-value (critical value, 95% level of significance, two-tailed test) as described by Warner [
24]:
at the
t-test critical value (
t) corresponding to the relevant degree of freedom.
2.7. Assessing the Fiber Size Range in a Novel Acoustic Panel and a Filter for Incoming Air
Samples were cut out from an Ecophon Gedina AT24 PE acoustic panel (Saint-Gobain Ecophon Oy, Hyvinkää, Finland) as well as a Camfil F7 ventilation filter for incoming air (Camfil Svenska AB, Trosa, Sweden). Samples were dissolved in deionized water with the help of an Instrusonic model W181F ultrasound bath (Ultrasonic Finland Ltd, Lahti, Finland) and filtered onto 37 mm membrane filters, gilded, and analyzed, as described above.
4. Conclusions
In environments where the MMVFs present are predominantly more than 1 µm in diameter, and where the fiber count on surfaces is 80–10,000 fibers/cm2, the two methods compared yielded similar results. This was the case, however, in mechanically ventilated office-type environments. In these, the surface concentration of fibers is usually below 10 fibers/cm2, and the within-method standard deviation of the gel tape method results high, due to the small area sampled in combination with the uneven distribution of fibers on surfaces. In addition, fibers less than 1 µm in diameter, possibly originating from ventilation filters, may constitute a major portion of fibers present. Even though we excluded fibers less than 0.5 µm in width in the SEM analyses, the results in office-type environments were systematically higher with the filter cassette method when compared to the gel tape samples analyzed by PM. This may be explained by the fact that fibers from 0.5 to 1 µm in width may remain undetected by PM from the gel tapes. When also considering that the within-method deviation of the gel tape method in low concentrations was high, necessitating a minimum of three parallel samples, we recommend using the filter cassette method in office-type environments where the fiber count is below 10 fibers/cm2.
In addition, gel tapes become overloaded in high surface concentrations and, therefore, the filter cassette method is the method of choice in industrial environments and in other environments where the surface count of fibers is more than 100 fibers/cm2. When a limit of quantitation of 0.1 fibers/cm2 needs to be achieved, a sampling area of 100 × 100 cm2 and an analytical filter with a maximum width of 2.5 cm should be used with the filter cassette method.
Two surface samples will never be truly parallel when the surface concentration is low and when the samples are small in area and/or far apart. Using the filter cassette method will, however, help to overcome some, but not all, of these sources of error because the sampling surface is much larger than with the gel tape method.
Sampling and preparation of samples with the filter cassette method is clearly more laborious than with the gel tape method. However, as the gel tape method requires a minimum of three parallel samples due to the deviation of results in parallel samples, and since both methods require counting an identical number of microscopical fields, counting of fibers with the filter cassette method will take up ca. one-third of the time required to analyze gel tapes. It should be considered, however, that the filter cassette method requires analyzing a minimum of one field blank per sampling site and/or one blank for each five samples.
Using the filter cassette method will require new guide values to be formed for office-type environments, since the results are higher than with the gel tape method. Alternatively, if the present values are to be used with the filter cassette method, conventions as to which fiber sizes to count should be set, since SEM analysis in any case will allow for including a larger size range than PM. We would, however, recommend against such an approach, since fibers less than 1 µm in width may not be less harmful by inhalation than larger fibers.


