Review of Methodologies for Assessing Sustainable Diets and Potential for Development of Harmonised Indicators


Abstract
1. Introduction
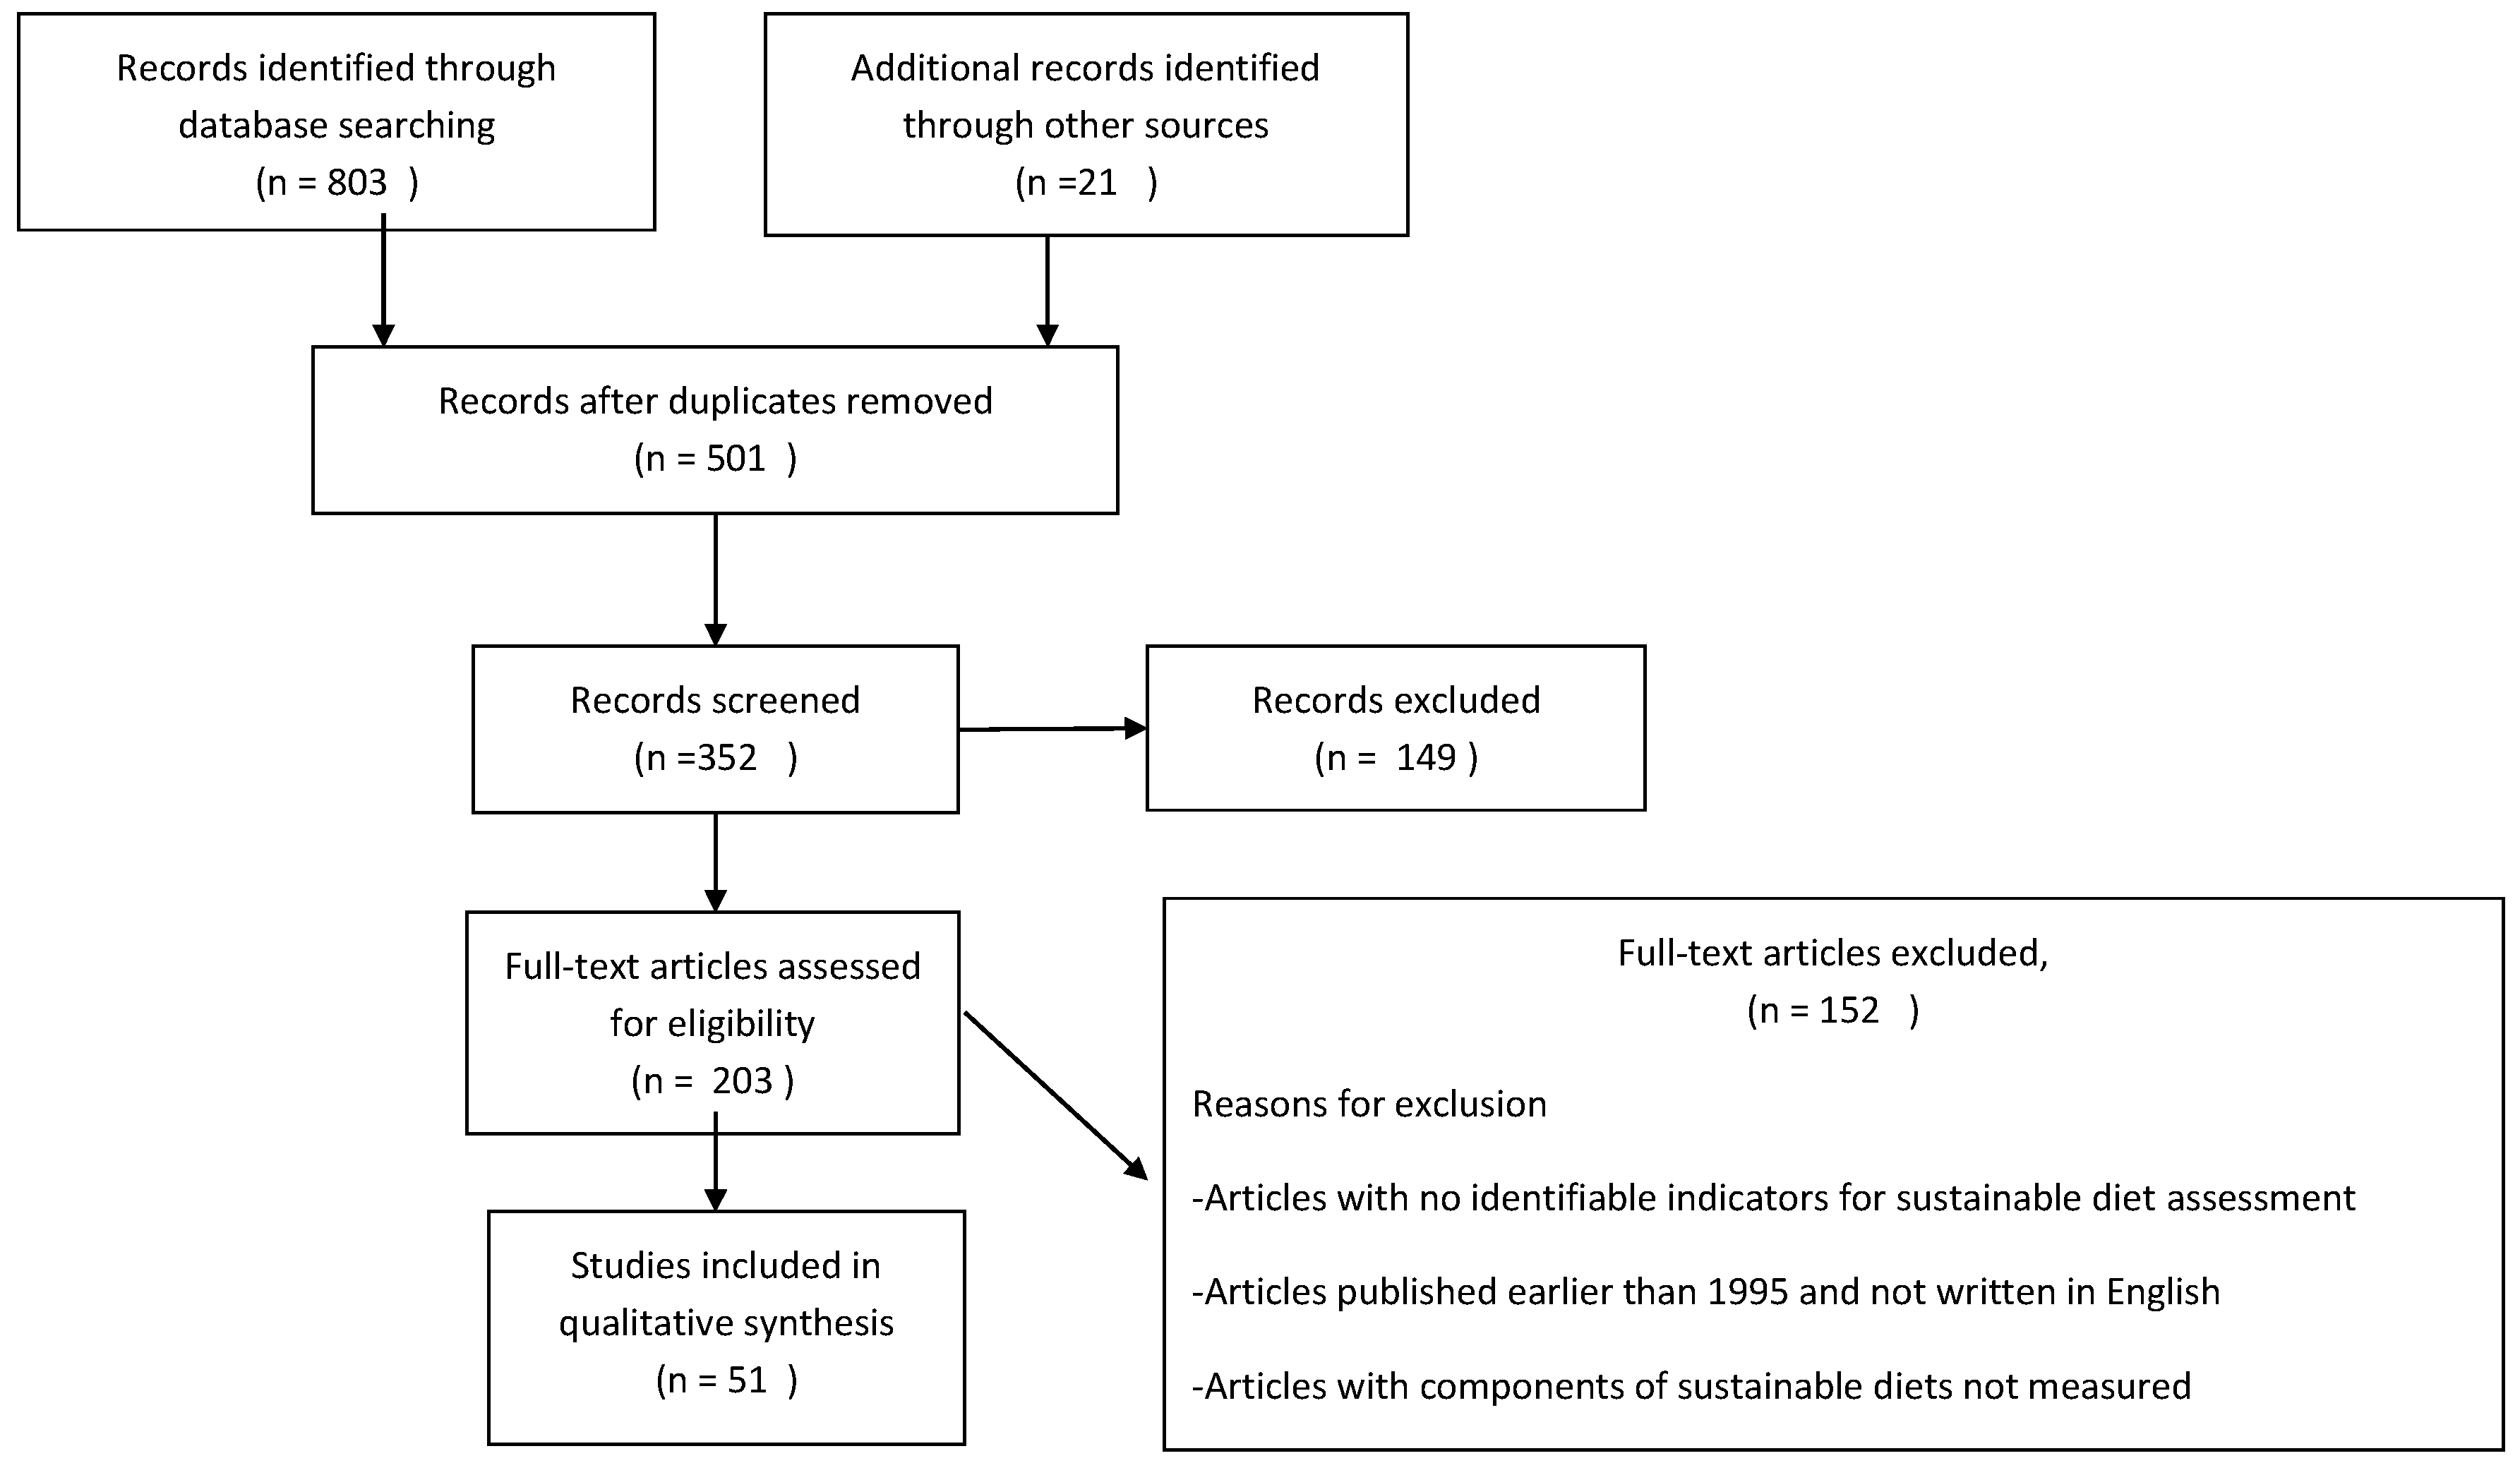
2. Materials and Methods
3. Results and Discussion
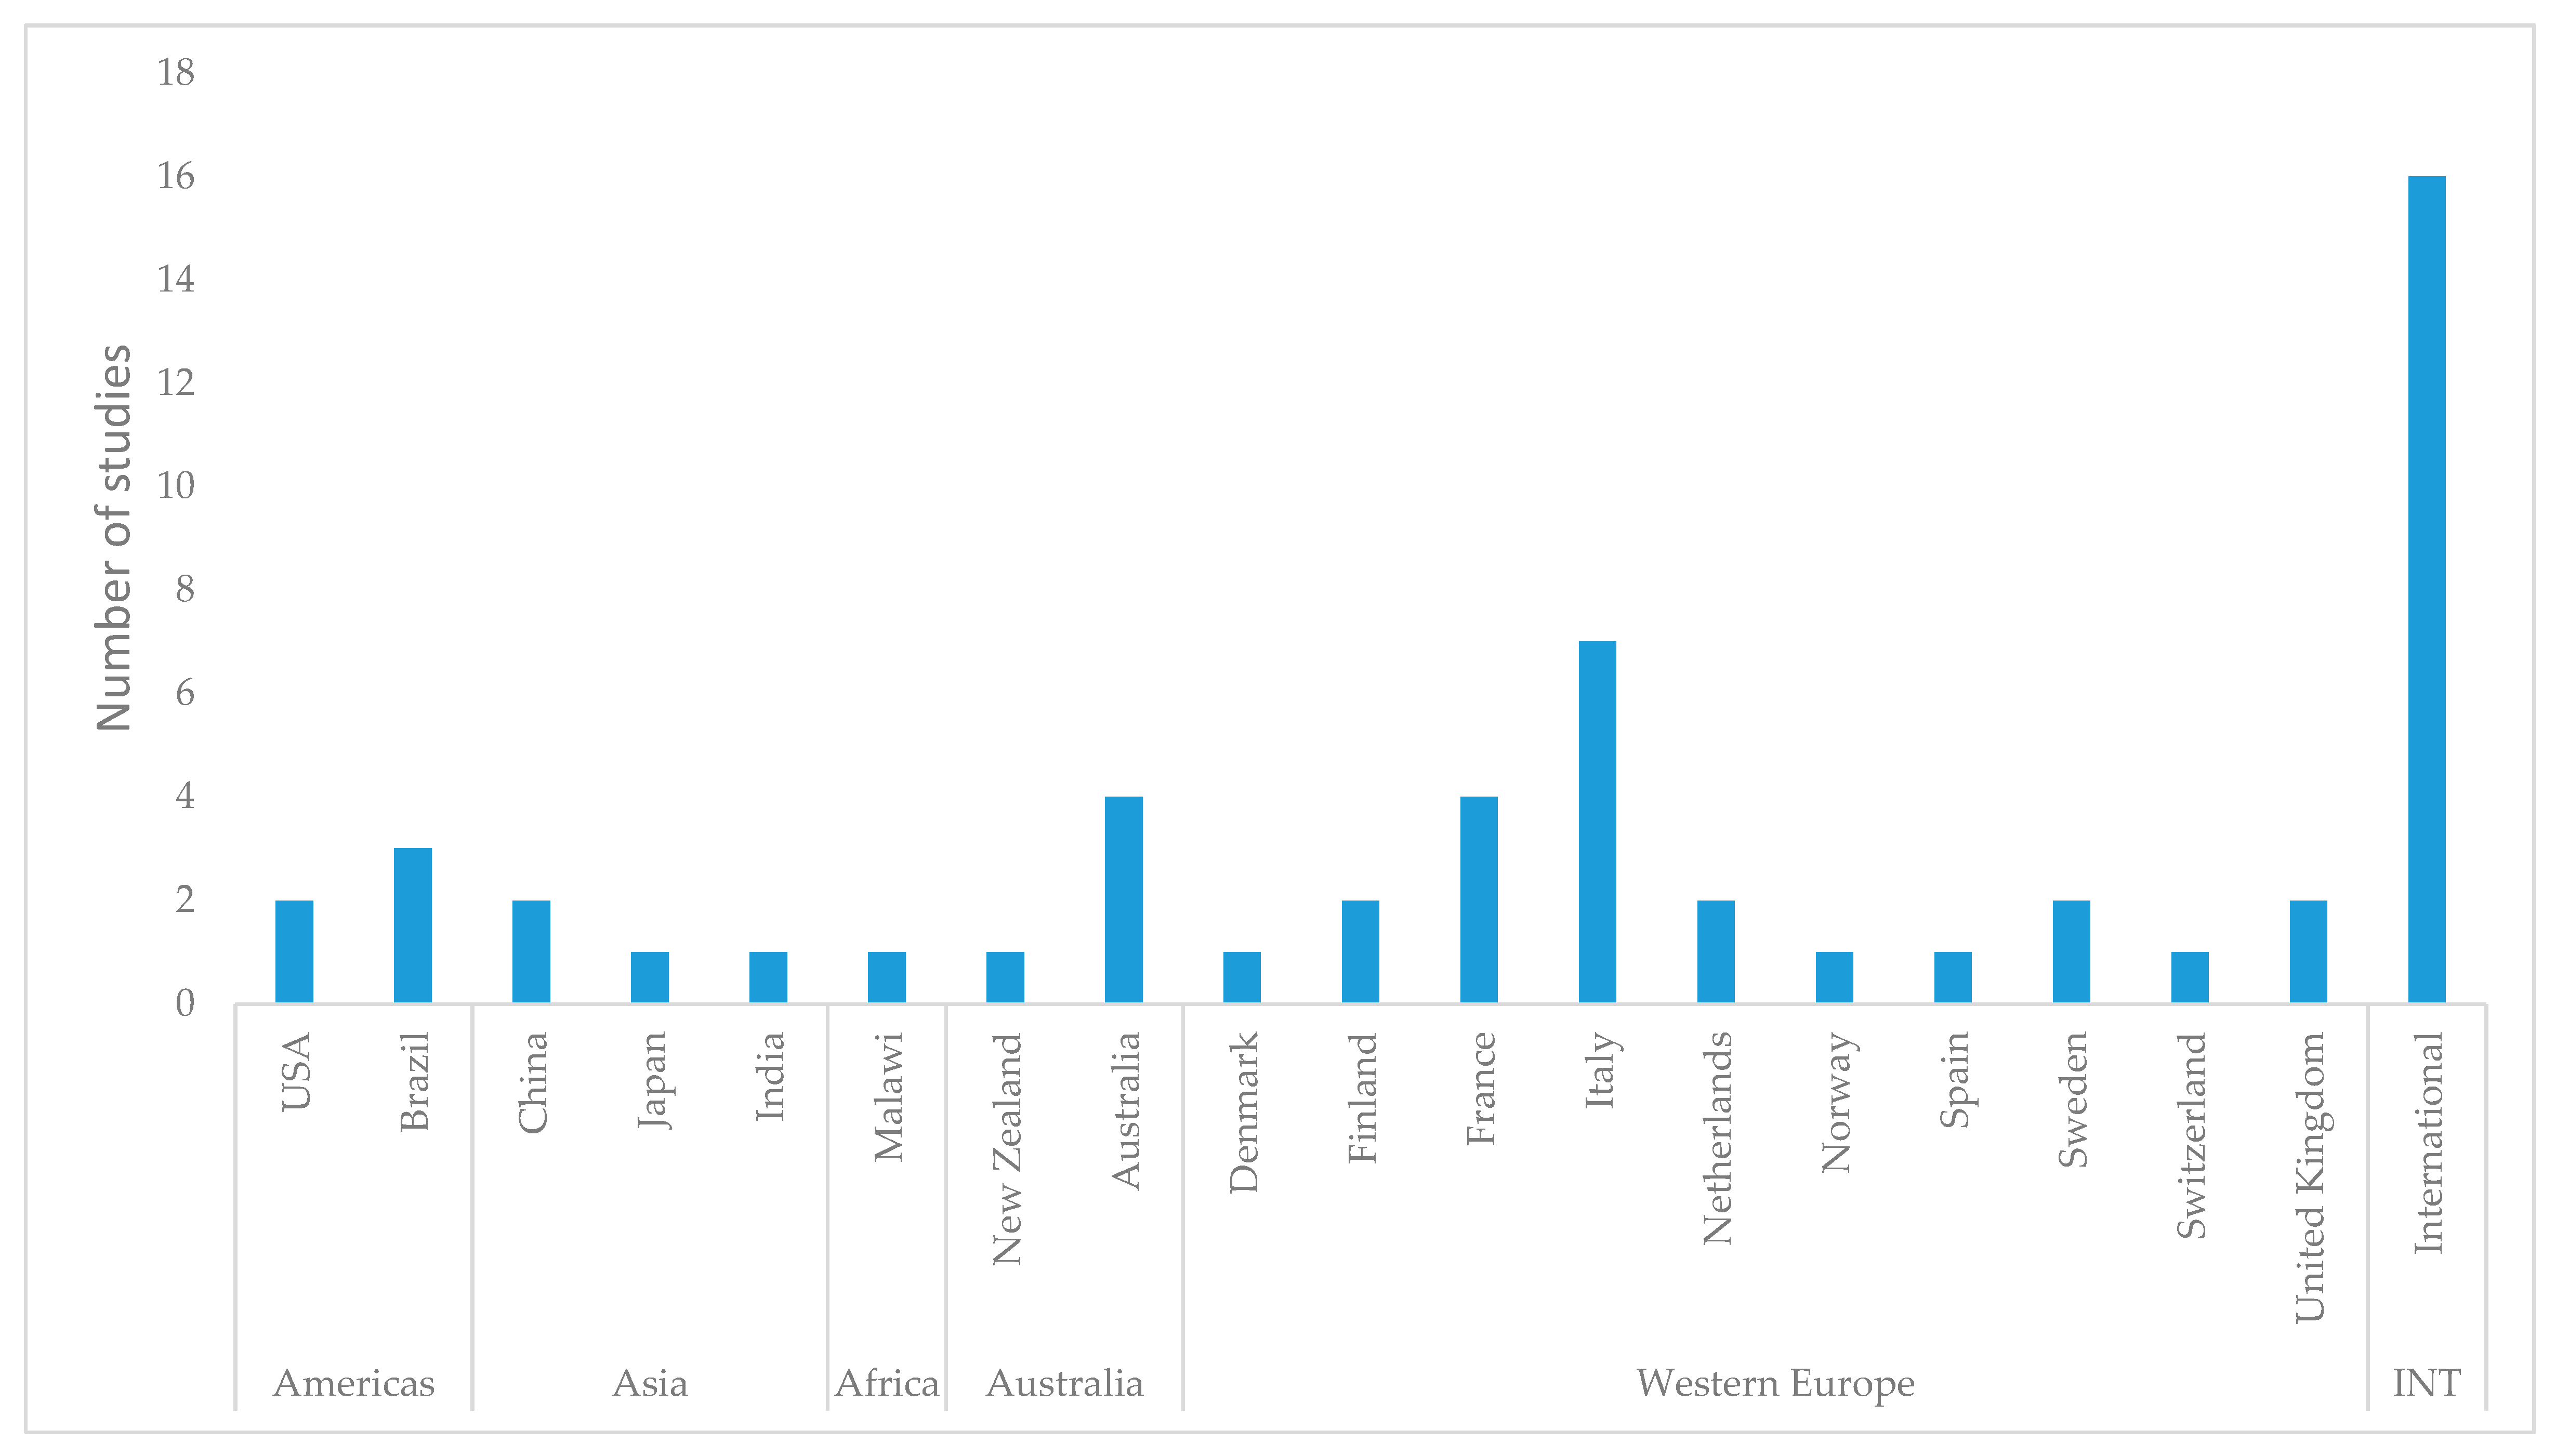
3.1. Potential for Geographic Bias
3.2. Environmental Indicators
3.3. Nutrition and Health Indicators
3.4. Socioeconomic and Other Indicators
3.5. Development of the Harmonised Indicators
4. Conclusions
Author Contributions
Funding
Conflicts of Interest
References
- FAO/WHO/UNU. Human Energy Requirements. Report of a Joint FAO/WHO/UNU Expert Consultation; Food and Nutrition Technical Report Series; FAO: Rome, Italy, 2001. [Google Scholar]
- FAO. 31st Regional Conference for the Near East; Report; FAO Publications: Rome, Italy, 2012; pp. 14–17. Available online: www.fao.org/docrep/meeting/025/md988e.pdf (accessed on 12 December 2017).
- Ericksen, P.J.; Bohle, H.G.; Stewart, B. Vulnerability and Resilience of Food Systems; Food Security and Global Environmental Change; Earthscan: London, UK; Washington, DC, USA, 2010; pp. 67–77. [Google Scholar]
- Ingram, J.S.I.; Wright, H.L.; Foster, L.; Aldred, T.; Barling, D.; Benton, T.; Berryman, P.M.; Bestwick, C.S.; Bows-Larkin, A.; Brocklehurst, T.F.; et al. Priority research questions for the UK food system. Food Secur. 2013, 5, 617. [Google Scholar] [CrossRef]
- HLPE. Food Losses and Waste in the Context of Sustainable Food Systems; High Level Panel of Experts on Food Security and Nutrition of the Committee on World Food Security: Rome, Italy, 2014. [Google Scholar]
- FAO Fisheries and Aquaculture Department. The State of the World Fisheries and Aquaculture; Food and Agriculture Organization of the United Nations: Rome, Italy, 2009. [Google Scholar]
- Bell, J.; Taylor, M. Building Climate-Resilient Food Systems for Pacific Islands; Program Report; WorldFish: Penang, Malaysia, 2015; p. 15. [Google Scholar]
- Donini, L.M.; Dernini, S.; Lairon, D.; Serra-Majem, L.; Amiot, M.J.; del Balzo, V. A Consensus Proposal for Nutritional Indicators to Assess the Sustainability of a Healthy Diet: The Mediterranean Diet as a Case Study. Front. Nutr. 2016, 3, 37. [Google Scholar] [CrossRef] [PubMed]
- UNIFEM. Strengthening of Gender Monitoring: Harmonization of Gender Indicators. 2006. Available online: www2.un.md/UNIFEM/programme_areas/statistics/harmonization/Best_Practices_Development_process_of_gender_sensitive_indicators_in_Kyrgyzatan_eng.pdf (accessed on 2 March 2018).
- Mulder, I.; Fahy, C.; Hribernik, K.; Velthausz, D.; Feurstein, K.; Garcia, M.; Schaffers, H.; Mirijamdotter, A.; Stahlbrost, A. Towards harmonized methods and tools for living labs. Conference Papers. PLoS ONE 2007, 11, e0165797. [Google Scholar] [CrossRef]
- Mulder, I. Understanding Designers, Designing for Understanding; Telematica Instituut: Enschede, The Netherlands, 2004. [Google Scholar]
- Jones, A.D.; Yosef, S. The implications of a changing climate on global nutrition security. In New Directions in the Fight against Hunger and Malnutrition; Sahn, D., Ed.; Oxford University Press: New York, NY, USA, 2015. [Google Scholar]
- Carlsson-Kanyama, A. Climate change and dietary choices—How can emissions of greenhouse gases from food consumption be reduced? Food Policy 1998, 23, 277–293. [Google Scholar] [CrossRef]
- Smedman, A.; Lindmark-Månsson, H.; Drewnowski, A.; Edman, A.K. Nutrient density of beverages in relation to climate impact. Food Nutr. Res. 2010, 54, 1–23. [Google Scholar] [CrossRef]
- Carvalho, A.M.D.; Cesar, C.L.G.; Fisberg, R.M.; Marchioni, D.M. Excessive meat consumption in Brazil: Diet quality and environmental impacts. Public Health Nutr. 2013, 16, 1893–1899. [Google Scholar] [CrossRef]
- Springmann, M.; Wiebe, K.; Mason-D’Croz, D.; Sulser, T.B.; Rayner, M.; Scarborough, P. Health and nutritional aspects of sustainable diet strategies and their association with environmental impacts: A global modelling analysis with country-level detail. Lancet Planet Health 2018, 2, e451–e461. [Google Scholar] [CrossRef]
- Ruini, L.F.; Gati, R.; Pratesi, C.A.; Marino, M.; Principato, L.; Vannuzi, E. Working toward healthy and sustainable diets: The ‘Double Pyramid Model’ developed by the Barilla Centre for Food and Nutrition to raise awareness about the environmental and nutritional impact of foods. Front. Nutr. 2015, 2, 1–6. [Google Scholar] [CrossRef]
- Kramer, G.F.H.; Martinez, E.V.; Espinoza-Orias, N.D.; Cooper, K.A.; Tyszler, M.; Blonk, H. Comparing the Performance of Bread and Breakfast Cereals, Dairy, and Meat in Nutritionally Balanced and Sustainable Diets. Front. Nutr. 2018, 5, 51. [Google Scholar] [CrossRef] [PubMed]
- Vieux, F.; Perignon, M.; Gazan, R.; Darmon, N. Dietary changes needed to improve diet sustainability: Are they similar across Europe? Eur. J. Clin. Nutr. 2012, 72, 951–960. [Google Scholar] [CrossRef]
- Hallstroem, E.; Carlsson-Kanyama, A.; BoÈrjesson, P. Environmental impact of dietary change: A systematic review. J. Clean. Prod. 2015, 91, 1–11. [Google Scholar] [CrossRef]
- Joyce, A.; Hallett, J.; Hannelly, T.; Carey, G. The impact of nutritional choices on global warming and policy implications: Examining the link between dietary choices and greenhouse gas emissions. Energy Emiss. Control Technol. 2014, 2, 33–43. [Google Scholar] [CrossRef]
- Villa, K.M.; Barrett, C.B.; Just, D.R. Whose Fast and Whose Feast? Intrahousehold Asymmetries in Dietary Diversity Response Among East African Pastoralists. Am. J. Agric. Econ. 2011, 93, 1062–1081. [Google Scholar] [CrossRef]
- Karmakar, S.; Sarkar, D. Income inequality, poverty and food security in West Bengal, India. J. Soc. Sci. Stud. 2014, 1, 31–43. [Google Scholar] [CrossRef]
- The Sustainability Consortium. Transforming the Consumer Goods Industry to Deliver More Sustainable Consumer Products; The Sustainability Consortium: Fayetteville, AR, USA, 2015. [Google Scholar]
- Azzini, E.; Durazzo, A.; Polito, A.; Veneria, E.; Foddai, M.S.; Zaccaria, M.; Mauro, B.; Intorre, F.; Maiani, G. Biodiversity and local food products in Italy. In Sustainable Diets and Bioversity: Directions and Solutions for Policy, Research and Action-Chapter 4; FAO and Bioversity International: Roma, Italy, 2015. [Google Scholar]
- Barré, T.; Perignon, M.; Gazan, R.; Vieux, F.; Micard, V.; Amiot, M.-J. Integrating nutrient bioavailability and co-production links when identifying sustainable diets: How low should we reduce meat consumption? PLoS ONE 2018, 13, e0191767. [Google Scholar] [CrossRef]
- Wratten, S.D.; Hofmans, M.; Thomsen, S.; Williams, P.; Groves, G.; Eason, C. Measuring Sustainability in agricultural systems. In Proceedings of the 50th New Zealand Plant Protection Conference, Lincoln, New Zealand, 18–21 August 1997; pp. 514–519. [Google Scholar]
- Jungbluth, N.; Tietje, O.; Scholz, R. Food purchases: Impacts from the consumers’ point of view investigated with a modular LCA. Int. J. Life Cycle Assess. 2000, 5, 134–142. [Google Scholar] [CrossRef]
- White, T. Diet and the distribution of environmental impact. Ecol. Econ. 2000, 34, 145–153. [Google Scholar] [CrossRef]
- Gerbens-Leenes, P.W.; Moll, H.C.; SchootUiterkamp, A.J.M. Design and development of a measuring method for environmental sustainability in food production systems. Ecol. Econ. 2003, 46, 231–245. [Google Scholar] [CrossRef]
- Moldan, B.; Hak, T.; Knvanda, J.; Havranek, M.; Kuskora, P. Composite indicators of environmental sustainability. In Proceedings of the Statistics, Knowledge and Policy, OECD World Forum on Key Indicators, Palermo, Italy, 10–13 November 2004. [Google Scholar]
- Gerbens-Leenes, W.; Nonhebel, S. Food and land use. The influence of consumption patterns on the use of agricultural resources. Appetite 2005, 45, 24–31. [Google Scholar] [CrossRef]
- Risku-Norja, H.; Kurppa, S.; Helenius, J. Dietary choices and greenhouse gas emissions—Assessment of impact of vegetarian and organic options at national scale. Programme Ind. Econ. 2009, 6, 340–354. [Google Scholar] [CrossRef]
- Stehfest, E.; Bouwman, L.; van Vuuren, D.; den Elzen, M.J.; Eickhout, B.; Kabat, P. Climate benefits of changing diet. Clim. Chang. 2009, 95, 83–102. [Google Scholar] [CrossRef]
- MacDiarmid, J.I.; Kyle, J.; Horgan, G.W.; Loe, J.; Fyfe, C.; Johnstone, A.; McNeill, G. Sustainable diets for the future: Can we contribute to reducing greenhouse gas emissions by eating a healthy diet? Am. J. Clin. Nutr. 2012, 96, 632–639. [Google Scholar] [CrossRef]
- Scarborough, P.; Allender, S.; Clarke, D.; Wickramasinghe, K.; Rayner, M. Modelling the health impact of environmentally sustainable dietary scenarios in the UK. Eur. J. Clin. Nutr. 2012, 66, 710–715. [Google Scholar] [CrossRef]
- Capone, R.; Iannetta, M.; El Bilali, H.; Nicola, C.; Debs, P.; Dernini, S.; Maiani, G.; Intorre, F.; Polito, A.; Turrini, A.; et al. A Preliminary Assessment of the Environmental Sustainability of the Current Italian Dietary Pattern: Water Footprint Related to Food Consumption. J. Food Nutr. Res. 2003, 1, 59–67. [Google Scholar]
- Liu, F.; Zhang, H. Novel methods to assess environmental, economic and social sustainability of main agricultural regions in China. Agrob. Sustain. Dev. 2013, 33, 621–633. [Google Scholar] [CrossRef]
- Masset, G.; Soler, L.G.; Vieux, F.; Darmon, N. Identifying sustainable foods: The relationship between environmental impact, nutritional quality and prices of foods representative of the French diet. J. Acad. Nutr. 2014, 114, 862–869. [Google Scholar] [CrossRef]
- Masset, G.; Vieux, F.; Verger, E.O.; Soler, L.G.; Touazi, D.; Darmon, N. Reducing energy intake and energy density for a sustainable diet: A study based on self-selected diets in French adults. Am. J. Clin. Nutr. 2014, 99, 1460–1469. [Google Scholar] [CrossRef]
- Peano, C.; Migliorini, P.; Sottile, F. A methodology for the sustainability assessment of agri-food systems: An application to the Slow Food Presidia project. Ecol. Soc. 2014, 19, 24. [Google Scholar] [CrossRef]
- Van Dooren, C.; Marinussen, M.; Blonk, H.; Aiking, H.; Vellinga, P. Exploring dietary guideline based on ecological and nutritional values: A comparison of six dietary patterns. Food Policy 2014, 44, 36–46. [Google Scholar] [CrossRef]
- EAT, SDDSN and CGIAR. Integrated Indicators for Sustainable Food Systems and Healthy Diets in the Post-2015 Development Agenda. Final Statement Prepared by the Working Group-A Partnership between EAT, SDDSN and CGIAR. 2015. Available online: https://cgspace.cgiar.org/handle/10947/4011 (accessed on 2 April 2019).
- Gill, M.; Feliciano, D.; Macdiarmid, J.; Smith, P. The environmental impact of nutrition transition in three case study countries. Food Secur. 2015, 7, 493–504. [Google Scholar] [CrossRef]
- Aleksandrowicz, L.; Green, R.; Joy, E.J.M.; Smith, P.; Haines, A. The Impacts of Dietary Change on Greenhouse Gas Emissions, Land Use, Water Use, and Health: A Systematic Review. PLoS ONE 2016, 11, e0165797. [Google Scholar] [CrossRef] [PubMed]
- Immacolata, V.; Augusto, M. Life Cycle Assessment and environmental sustainability in the food system. Agric. Agric. Sci. Procedia 2016, 8, 317–323. [Google Scholar]
- Mertens, E.; Veer, P.V.; Hiddink, G.J.; Steijns, J.; Kuijsten, A. Operationalising the health aspects of sustainable diets: A review. Public Health Nutr. 2016, 20, 739–757. [Google Scholar] [CrossRef]
- Pires, A.; Morato, J.; Peixoto, H.; Botero, V.; Zuluaga, L.; Figuero, A. Sustainability Assessment of indicators for integrated water resources management. Sci. Total Environ. 2017, 578, 139–147. [Google Scholar] [CrossRef]
- Pellicer-Martínez, F.; Martínez-Paz, J.M. Grey water footprint assessment at the river basin level: Accounting method and case study in the Segura River Basin, Spain. Ecol. Indices 2016, 60, 1173–1183. [Google Scholar] [CrossRef]
- Seconda, L.; Baudry, J.; Allès, B.; Hamza, O.; Boizot-Szantai, C.; Soler, L.-G.; Galan, P.; Hercberg, S.; Lairon, D.; Kesse-Guyot, E. Assessment of the sustainability of the Mediterranean Diet combined with organic food consumption: An individual Behaviour Approach. Nutrients 2017, 9, 61. [Google Scholar] [CrossRef] [PubMed]
- Dooren, C.V.; Aiking, H.; Vellinga, P. In search of indicators to assess the environmental impact of diets. Int. J. Life Cycle Asses. 2018, 23, 1297–1314. [Google Scholar] [CrossRef]
- Osita, A.; Nagano, I.; Matsuda, H. Food Nitrogen footprint reductions related to a balanced Japanese diet. Ambio 2018, 47, 318–326. [Google Scholar]
- Schacht, K.; Filho, W.L.; Koppe, W.; Struksnaes, G.; Busch-Stockfisch, M. Sustainability as a new paradigm regarding food consumption. Br. Food J. 2010, 112, 476–488. [Google Scholar] [CrossRef]
- Pearson, D.; Bailey, A. Exploring the Market Potential of ‘Local’ in Food Systems. Locale Australas. Pac. J. Reg. Food Stud. 2012, 2, 82–103. [Google Scholar]
- WHO. Health Indicators of Sustainable Agriculture, Food and Nutrition Security in the Context of the RIO +20 UN Conference on Sustainable Development; Initial Findings from a WHO Expert Consultation from 17–18 May 2012; WHO: Geneva, Switzerland, 2012. [Google Scholar]
- Dixon, J.; Isaacs, B. Why sustainable and ‘nutritionally correct’ food is not on the agenda: Western Sydney, the moral arts of everyday life and public policy. Food Policy 2013, 43, 67–76. [Google Scholar] [CrossRef]
- Luckett, B.G.; Declerck, F.A.J.; Fanzo, J.; Mundorf, A.R.; Rose, D. Application of the Nutrition Functional Diversity Indicator to assess food system contributions to dietary diversity and sustainable diets of Malawian Households. Public Health Nutr. 2015, 18, 2479–2487. [Google Scholar] [CrossRef]
- Harry, A.J.; Boushey, C.J.; Pollard, C.M.; Delp, E.J.; Ahmad, Z.; Dhaliwal, S.S.; Mukhtar, S.; Kerr, D. Novel Dietary assessment method to measure a healthy and sustainable diet using the mobile food record: Protocol and methodology. Nutrients 2015, 7, 5375–5395. [Google Scholar] [CrossRef]
- Benedetti, I.; Biggeri, L.; Laureti, T.; Secondi, L. Exploring the Italians’ food habits and tendency towards a sustainable diet: The Mediterranean eating pattern. Agric. Agric. Sci. Procedia 2016, 8, 433–440. [Google Scholar] [CrossRef]
- Dernini, S.; Meybeck, A.; Burlingame, B.; Gitz, G.; Lacirignola, C.; Debs, P.; Capone, R.; El Bilali, H. Developing a methodological approach for assessing the sustainability of diets: The Mediterranean diet as a case study. New Medit 2013, 12, 28–36. [Google Scholar]
- Benedetti, I.; Laureti, T.; Secondi, L. Choosing a healthy and sustainable diet: A three-level approach for understanding the drivers of the Italians’ dietary regime over time. Appetite 2018, 123, 357–366. [Google Scholar] [CrossRef] [PubMed]
- Lachat, C.; Raneri, J.E.; Smith, K.W.; Kolsteren, P.; Damme, P.V.; Penafiel, D.; Penafiel, D.; Vanhove, W.; Kennedy, G.; Hunter, D.; et al. Dietary species richness as a measure of food biodiversity and nutritional quality of diets. Proc. Natl. Acad. Sci. USA 2018, 115, 127–132. [Google Scholar] [CrossRef]
- FAO. Nutrition Indicators for Development; FAO Publications: Rome, Italy, 2003. [Google Scholar]
- Jensen, J.D.; Poulsen, S.K. The new nordic diet—Consumer expenditures and economic incentives estimated from a controlled intervention. BMC Public Health 2013, 13, 1–9. [Google Scholar] [CrossRef]
- Lombardini, C.; Lankoski, L. Forced choice restriction in promoting sustainable food consumption: Intended and unintended effects of the mandatory vegetarian day in Helsinki Schools. J. Consum. Policy 2013, 36, 159–178. [Google Scholar] [CrossRef]
- Barosh, L.; Friel, S.; Engelhardt, K.; Chan, L. The cost of a healthy and sustainable diet—Who can afford it? Aust. N. Z. J. Public Health 2014, 38, 7–12. [Google Scholar] [CrossRef] [PubMed]
- Institute of Medicine (IOM) and National Research Council (NRC). A Framework for Assessing Effects of the Food System; The National Academies Press: Washington, DC, USA, 2015. [Google Scholar]
- Gustafson, D.; Gutman, A.; Leet, W.; Drewnowski, A.; Fanzo, J.; Ingram, J. Seven Food System metrics of Sustainable Nutrition Security. Sustainablity 2016, 8, 196. [Google Scholar] [CrossRef]
- Barone, B.; Nogueira, R.M.; Guimaraes, K.R.L.; Behrens, J.H. Sustainable diet from the urban Brazilian consumer perspective. Food Res. Int. 2018. [Google Scholar] [CrossRef]


| Reference | Country | Objective of the Paper | Main Findings | Main Indicators/Index Identified |
|---|---|---|---|---|
| Wratten et al. [27] | New Zealand | Measuring of sustainability in agricultural systems | The “Selwyn Stewardship Monitoring Scheme” in New Zealand showed that the arable farm was the most efficient with meat and that farms that deals with dairy were considerably less efficient. |
|
| Carlsson-Kanyama. [12] | Sweden | Determine the outcome of greenhouse gas emissions (GHGEs) on rice, dry pea, carrot, potato, tomato and pork production | Animal rearing and crop management practices were more relevant to environmental outcomes than other areas of the food supply chain. |
|
| Jungbluth et al. [28] | Switzerland | Assess obstacles and choices for the purchase of foods that are environmentally friendly | The largest impact on lowering diet-related GHGEs was not buying air-transported products and meat consumption reduction. |
|
| White [29] | International | Examines how the role of changes in diet across populations leads to inequality in the delivery of environmental impacts | An inequality in dietary energy distribution is linked with an inequality in the use of land to a lesser extent than meat-intensive diets. |
|
| Gerbens-Leenes, Moll and SchootUiterkamp [30] | International | The use of environmental indicators for the production and sustainability of food systems | Three performance indicators were identified: energy, the total land and water requirement per kilogram of available food to be used by individuals, business sectors and companies. |
|
| Moldan et al. [31] | International | To identify and describe composite indicators of environmental sustainability | A number of composite indicators were identified and described. which include the Environmental Sustainability Index (ESI), Dashboard of Sustainability (DS) and Wellbeing/Stress Index (WI) |
|
| Gerbens-Leenes and Nonhebel [32] | International | Examine the association between agricultural land use and eating patterns | Eating patterns linked to greater wealth (i.e., cheese, fruits and meats) require more agricultural lands. |
|
| Risku-Norja et al. [33] | Finland | Determine agricultural GHGE for 4 diet settings and organic production in comparison with industrial production | Organic production has a higher GHGE because of more cultivated acreage, and the main origin of GHGEs from agricultural production is the soil management practices. |
|
| Stehfest et al. [34] | International | Measure the effect of a dietary shift toward less meat on the environment | The emissions of methane and nitrous oxide would permit an increased carbon uptake, and consumption of less meat would productively scale down land use. |
|
| Smedman et al. [14] | Sweden | Evaluate GHGEs from producing different beverages | Milk has the highest GHGEs when compared to the GHGEs of other beverages. |
|
| Carvalho et al. [15] | Brazil | Evaluate red- and processed-meat intake and the impact meat consumption has on diet attributes and the environment | Diet quality was inversely associated with meat intake in men. Meat consumption emitted greenhouse gas emissions of 18071988 tonnes of CO2 equivalents, which represent about 4% of the total CO2 emitted by agriculture. |
|
| Macdiarmid et al. [35] | United Kingdom | Determine the outcome of varied dietary options on GHGEs | The removal of meats and foods from dairy does not necessarily lead to a reduction of diet-related GHGE. |
|
| Scarborough et al. [36] | United Kingdom | Models the effect of the three environmental scenarios on life loss from cardiovascular disease and cancer | The model showed that in Scenario 1 resulted in 36,910 deaths prevented per year, and Scenario 2 averted 1999 deaths per year, while Scenario 3 resulted in 9297 deaths delayed per year. A 19%, 9% and 3% reduction in GHGE characterised Scenarios 1, 2 and 3 respectively. |
|
| Capone et al. [37] | Italy | Analysed the environmental cost of nonadherence to the Mediterranean dietary pattern from a water footprint perspective | A reduced total water abstraction is linked to an adherence to the Mediterranean dietary pattern. |
|
| Liu and Zhang [38] | China | Proposing a methodological framework for measuring the sustainability level of main agricultural regions in China on regional and country levels | The balanced method yields lower sustainable values than the aggregate method and sensitivity analysis. |
|
| Masset et al. [39] | France | Identify the most frequently consumed sustainable diets by people daily | The diets were categorized into lower carbon diets, higher-quality diets and more-sustainable diets. Each of them had beneficial outputs, but the more-sustainable diets had the best outcome. |
|
| Masset et al. [40] | France | Identify foods using measures of sustainability dimensions | Foods such as meat and fish had the biggest negative impact on the environment. A low nutritional quality and a high price characterised food that had a high environmental impacts. |
|
| Peano et al. [41] | Italy | To develop an indicator–based tool to monitor sustainability in agric-food systems using the Slow Food Presidia project approach | The Slow Food Presidia project increased all the dimensions of sustainability and, in particular, socioeconomic and cultural capital by preserving the environmental quality aspects of the food products. |
|
| Van Dooren et al. [42] | International | Explore the relationship between nutritionally healthy and ecologically sustainable diets | Meat and dairy consumption were mostly responsible for low sustainability scores. |
|
| EAT Initiative, Sustainable Development Solutions Network (SDSN)and Consultative Group for International Agricultural Research (CGIAR) [43] | International | Develop integrated indicators for Sustainable Food Systems and Healthy diets in the Post-2015 Development Agenda | Integrated indicators were developed in three thematic categories: sufficient, nutritional, varied and safe diets; climate-resilient and environmentally sustainable food production; and resilient and equitable food system. |
|
| Gill et al. [44] | Brazil, China and India | Evaluate the environmental effects of dietary changes consistent with the nutrition shifts | Increases in cereal supply in China and India and beef production in Brazil increased GHGEs and had an effect on the phosphorus and nitrogen cycles, respectively. |
|
| Ruini et al. [17] | Italy | Present the Barilla centre for Food and Nutrition’s “Double Pyramid Model” in order to raise people’s awareness of the impact of the environment on food | A diet based on the principles of the Mediterranean Diet (MD), as suggested by Double Pyramid, generates a lower environmental impact compared to diets that are heavily based on daily meat consumption. Eating lower on the pyramid lowers the environmental impact. |
|
| Aleksandrowicz et al. [45] | International | Review the evidence on changes on sustainable dietary pattern in relation to dietary intake on the environment variables | An animal-based restriction was directly related to a decrease in environmental footprints, and a dietary transition yielded a moderate gain in the all-cause mortality risk. |
|
| Dernini et al. [8] | International | Assessment of sustainability of diets based on the MD | A standard set of information (definition, methodology, background, data sources, limitations of the indicators and references) was provided for thirteen nutrition indicators identified. |
|
| Immacolata and Augusto [46] | Italy | Measured environmental sustainability in the food systems | The application of the method of LCA for the reduction of environmental shocks were related to the life of the product chosen (olive oil), and the decisions were related to interventions on processes, products and activities. |
|
| Mertens et al. [47] | Netherlands | To categorize and summarize the different approaches to operationalise the health aspects of environmentally sustainable diets | Five approaches to operationalize the health aspects of the diet were identified: food item replacement; dietary guidelines; dietary quality scores; diet modelling techniques; and a diet-related health impact analysis. |
|
| Pires et al. [48] | International | Evaluate how indicators related to water use and management perform against a set of sustainability criteria | Twenty-four indicators comply with the majority of the sustainability criteria; 59 indicators comply with two sustainability criteria, while 86 indicators fulfill just one of the four sustainability criteria; and one indicator does not fulfil any of the sustainability criteria. |
|
| Pellicer-Martinez and Martinez [49] | Spain | The use of a water footprint (WP) to assess environmental sustainability in water resources at the river basin level | “Blue water” use is not sustainable due to a generalized overexploitation of aquifers, and surface water pollution is mainly caused by phosphate concentration. |
|
| Seconda et al. [50] | France | Draw up a comparative description of four diets differing in the level of organic food consumption and the adherence to the Mediterranean Diet (MD) using multidisciplinary indicators to assess the sustainability of these diets | The adherence to nutritional recommendations was highest among the organic consumers and Mediterranean diet followers, lower among conventional consumers and Mediterranean diet followers and the lowest among conventional consumers and non-Mediterranean diet followers. |
|
| Dooren et al. [51] | Global | Identify a set of important indicators to assess the most pressing environmental impacts of diets | At the global and national levels, the planetary boundaries and the footprint approaches were respectively used to identify indicators, while the LCA was used at the product (micro) level. |
|
| Kramer et al. [18] | Netherlands | Measure the performance of food products in a sustainable diet based on the balance of their contribution to nutrient intake and environmental impact, within the context of the Dutch diet | Increasing amounts of dairy in the optimized diet were associated with a steep increase in the environmental impact and in meat. Bread and breakfast cereals are sources of nutrients with a better environmental performance compared to dairy or meat within the context of the Dutch diet. |
|
| Barre et al. [26] | France | Assess the impact of nutrient bioavailability and coproduction link considerations on dietary changes needed to promote a sustainable diet with a special focus on meat | The “fruits and vegetables” and “starches” quantities increased in all the modelled diets compared to the mean observed French diet. |
|
| Osita et al. [52] | Japan | Examined the impact of changes in a Japanese diet from 1961 to 2011 and the effect of alternative diets on the nitrogen footprints of food | The 1975 Japanese diet, a balanced omnivorous diet, was reported to delay aging, with a protein content similar to the current level, and to reduce the current food nitrogen footprint (15.2kg N) to 12.6 kg N, which is comparable to the level in the protein diet (12.3 kg N). |
|
| Reference | Objective of the Paper | Main Findings | Main Indicators/Index Identified | |
|---|---|---|---|---|
| Schacht et al. [53] | Norway | Determine consumers’ preference of fish with different origins and management practices | Farmed and wild salmon were least accepted while fish fed with a feed of plant origin were more accepted compared to other fishes. |
|
| Pearson [54] | Australia | Determine the consumers’ dietary preferences in choosing organic foods | Greater than half (54%) of the respondents expressed readiness to increase the organic consumption, and 3% of them reported a high anticipation in the purchases of organic foods. |
|
| WHO [55] | International | Measured health indicators of sustainable agriculture, food and nutrition security | The health indicators identified and linked to nutritional status, food quality and trade policies and programmes. |
|
| Dixon and Isaacs [56] | Australia | Assess consumer views on sustainable and healthy diets | Food purchase decisions were mainly influenced by cost, availability and family responsibility and not necessarily by sustainability or healthy foods. |
|
| Luckett et al. [57] | Malawi | To estimate and examine the role of household production and market acquisitions in providing dietary diversity to farm households in Malawi | Households further from roads and population centres had lower diversification (p < 0.01) and spread through comparatively more of their diversity from household production than households closer to market centres (p < 0.01). |
|
| Harry et al. [58] | Australia | Assess the dietary assessment method of sustainable dietary behaviour using a mobile food record (mFR) application | The use of mFR images for assessing fruit and vegetables, eggs, red meat and poultry was developed and tested for validity and reliability. |
|
| Benedetti et al. [59] | Italy | Assess the current dietary patterns among Italians, and analyse the effect of socioeconomic and lifestyle factors on Mediterranean diet constancy | Of all the socioeconomic characteristics, education proved to have a central role in determining the adherence to MD. Individuals with at least 8 years of education increase from the lowest (39%) to the highest (44%) category of the Mediterranean score. |
|
| Dernini et al. [60] | International | Assessment of the sustainability of diets based on the MD | A standard set of information (definition, methodology, background, data sources, limitations of the indicators and references) was provided for thirteen nutrition indicators identified. |
|
| Benedetti et al. [61] | Italy | Determine the current food patterns of Italians using a composite indicator, and establish which of the indicators had a higher adherence to Mediterranean diet in Italy | Education, the tendency to practice sports on a regular basis and the ability to have breakfast and lunch at home positively impact people’s adherence to the Mediterranean diet. |
|
| Springmann et al. [16] | Global | Examined three different approaches to sustainable diets. | Animal-source replacement with plant-based ones were efficient, especially in improving nutrient levels, decreasing untimely mortality and lowering the environmental impacts. |
|
| Lachat et al. [62] | Global | Assessed the relationship between food biodiversity and diet quality of women and young children using diet species richness for wet and dry seasons | The dietary species richness showed stronger and more consistent associations with the diet quality indicators (Mean Adequacy Ratios and Dietary Diversity Scores) than Simpson’s index of Diversity index and Functional Diversity. |
|
| ||||
| ||||
| Vieux et al. [19] | Europe | Determine if the dietary changes needed to improve diet sustainability are similar across some European countries | Nutritional adequacy was not necessarily associated with a reduced GHGE, and maximum GHGE reductions attainable were filed from 62 to 78% with a minimal weight change of 2.8 Kg/day from the observed diet. |
|
| Reference | Objective of the Paper | Main Findings | Main Indicators/Index Identified | |
|---|---|---|---|---|
| FAO (Food Agriculture Organization) [63] | International | Assess sustainability in the Food and agriculture sector | The sustainability monitoring and assessment routine (SMART) was developed to be used by companies and the agriculture sector. |
|
| Jensen and Poulsen [64] | Denmark | Assess the economic effects for the New Nordic diet consumer compared with an average Danish Diet | The New Nordic Diet was about 17% more expensive than the Average Danish Diet when the energy content of the diet was adjusted and 25% more costly when there was no adjustment. |
|
| Lombardini and Lankoski [65] | Finland | Assess the consequences of forced food choice restriction in schools on students’ diet | The effects were manifested in a decrease in the number of people who took part in school lunches and in the quantity of food taken to the plate and in an increase in plate waste. |
|
| Peano et al. [41] | Italy | Develop an indicator-based tool to monitor sustainability in agric-food systems using the Slow Food Presidia project approach | The Slow Food Presidia project increased all dimensions of sustainability and, in particular, socioeconomic and cultural capital by preserving the environmental quality aspects of the food products. |
|
| Barosh et al. [66] | Australia | Assess the affordability of a typical compared to a healthy and sustainable food basket in Greater Western Sydney, Australia | Healthy and sustainable food basket was more costly than the typical basket in all five socioeconomic neighbourhoods studied. |
|
| IOM (Institute of Medicine) and NRC (National Research Council) [67] | USA | Assess the social and economic effects of the U.S. system | Major classes of social and economic effects that can be linked to characteristics of the U.S. food system were outlined. |
|
| Gustafson et al. [68] | USA | Develop a methodology on the concept of sustainable nutrition security using different metrics | Seven metrics for characterizing sustainable nutrition outcomes of food systems were proposed and developed using multiple indicators. |
|
| Barone et al. [69] | Brazil | Investigating the association between sustainability and foods, and to identify consumer’s perspective about the characteristics of sustainable and unsustainable foods | The terms “healthy diet” and “sustainable production” stood out in the sustainable diets concept. A higher educational level of the participants linked food to the natural environment and sustainability while individuals with lower educational levels associated food with source, nutrition and health. |
|
| Nutrition and Health Indicators | Environment Indicators | Socio-Economic Indicators |
|---|---|---|
|
|
|
© 2019 by the authors. Licensee MDPI, Basel, Switzerland. This article is an open access article distributed under the terms and conditions of the Creative Commons Attribution (CC BY) license (http://creativecommons.org/licenses/by/4.0/).
Share and Cite
Eme, P.E.; Douwes, J.; Kim, N.; Foliaki, S.; Burlingame, B. Review of Methodologies for Assessing Sustainable Diets and Potential for Development of Harmonised Indicators. Int. J. Environ. Res. Public Health 2019, 16, 1184. https://doi.org/10.3390/ijerph16071184
Eme PE, Douwes J, Kim N, Foliaki S, Burlingame B. Review of Methodologies for Assessing Sustainable Diets and Potential for Development of Harmonised Indicators. International Journal of Environmental Research and Public Health. 2019; 16(7):1184. https://doi.org/10.3390/ijerph16071184
Chicago/Turabian StyleEme, Paul Eze, Jeroen Douwes, Nicholas Kim, Sunia Foliaki, and Barbara Burlingame. 2019. "Review of Methodologies for Assessing Sustainable Diets and Potential for Development of Harmonised Indicators" International Journal of Environmental Research and Public Health 16, no. 7: 1184. https://doi.org/10.3390/ijerph16071184
APA StyleEme, P. E., Douwes, J., Kim, N., Foliaki, S., & Burlingame, B. (2019). Review of Methodologies for Assessing Sustainable Diets and Potential for Development of Harmonised Indicators. International Journal of Environmental Research and Public Health, 16(7), 1184. https://doi.org/10.3390/ijerph16071184