A Novel Method in Surface Water Quality Assessment Based on Improved Variable Fuzzy Set Pair Analysis


Abstract
1. Introduction
2. Methods and Materials
2.1. Development of Set Pair Analysis
2.1.1. Calculation of Connection Degree
2.1.2. Proposed Weighting Method
| Algorithm 1: Empowerment algorithm for balanced comprehensive weight |
| Step 1: Calculated by the entropy method formula, the index weight is obtained:
Step 3: By optimizing the i linear combination coefficients αi in Equation (7), the deviation of wi between wj and each basic weight is minimized. The optimization model of weights is as follows: |
| then substitute it into Equation (6) to find the optimal comprehensive weight “w”. |
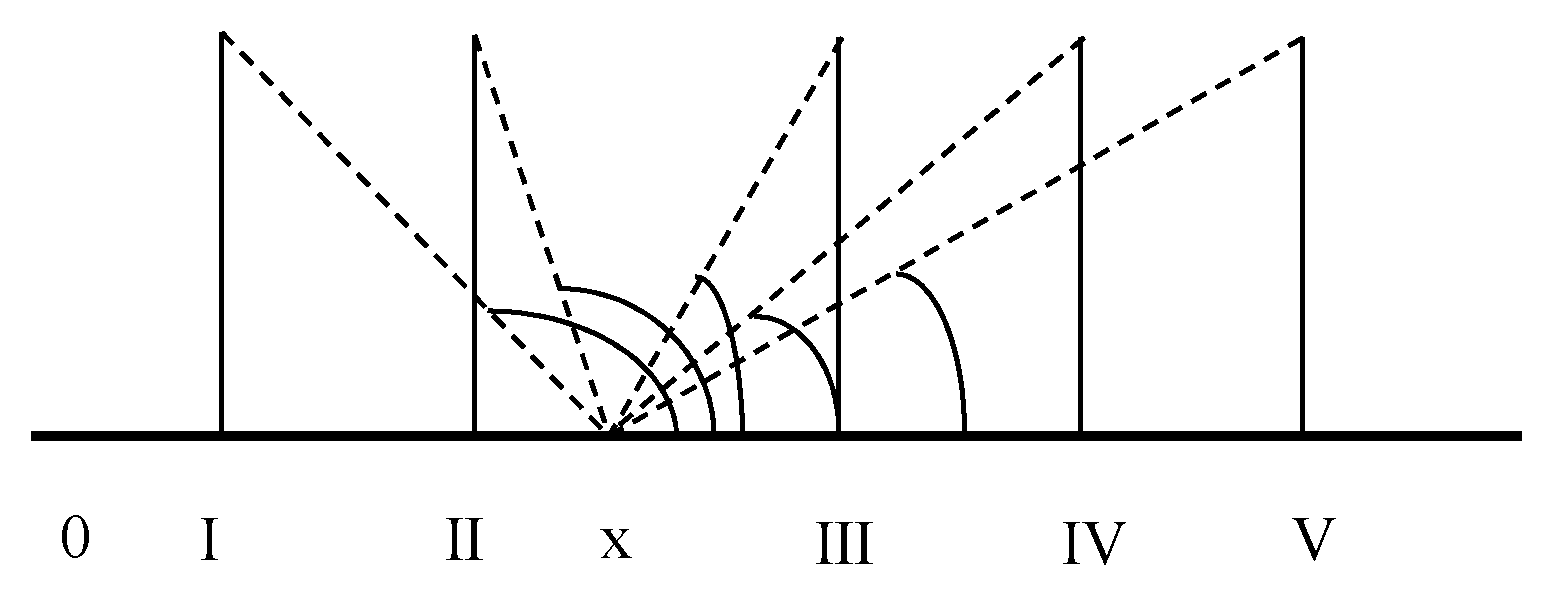
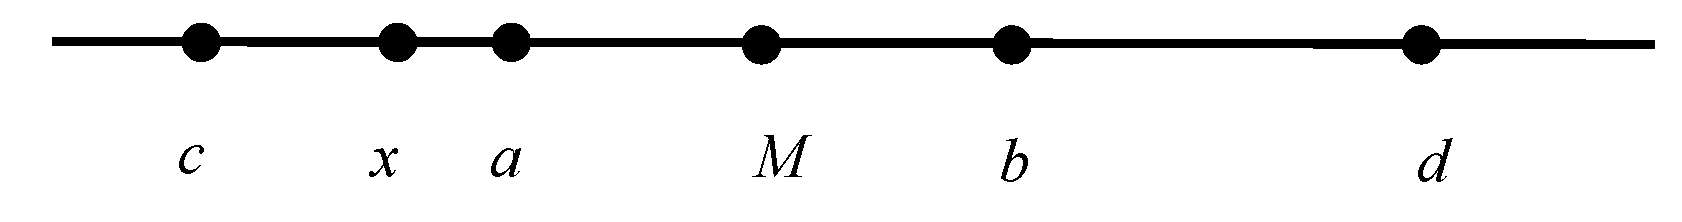
2.2. Development of Variable Fuzzy Set
2.3. Proposed Improved N.L.Nemerow Method
2.4. The Improved Variable Fuzzy Set Pair Analysis Method
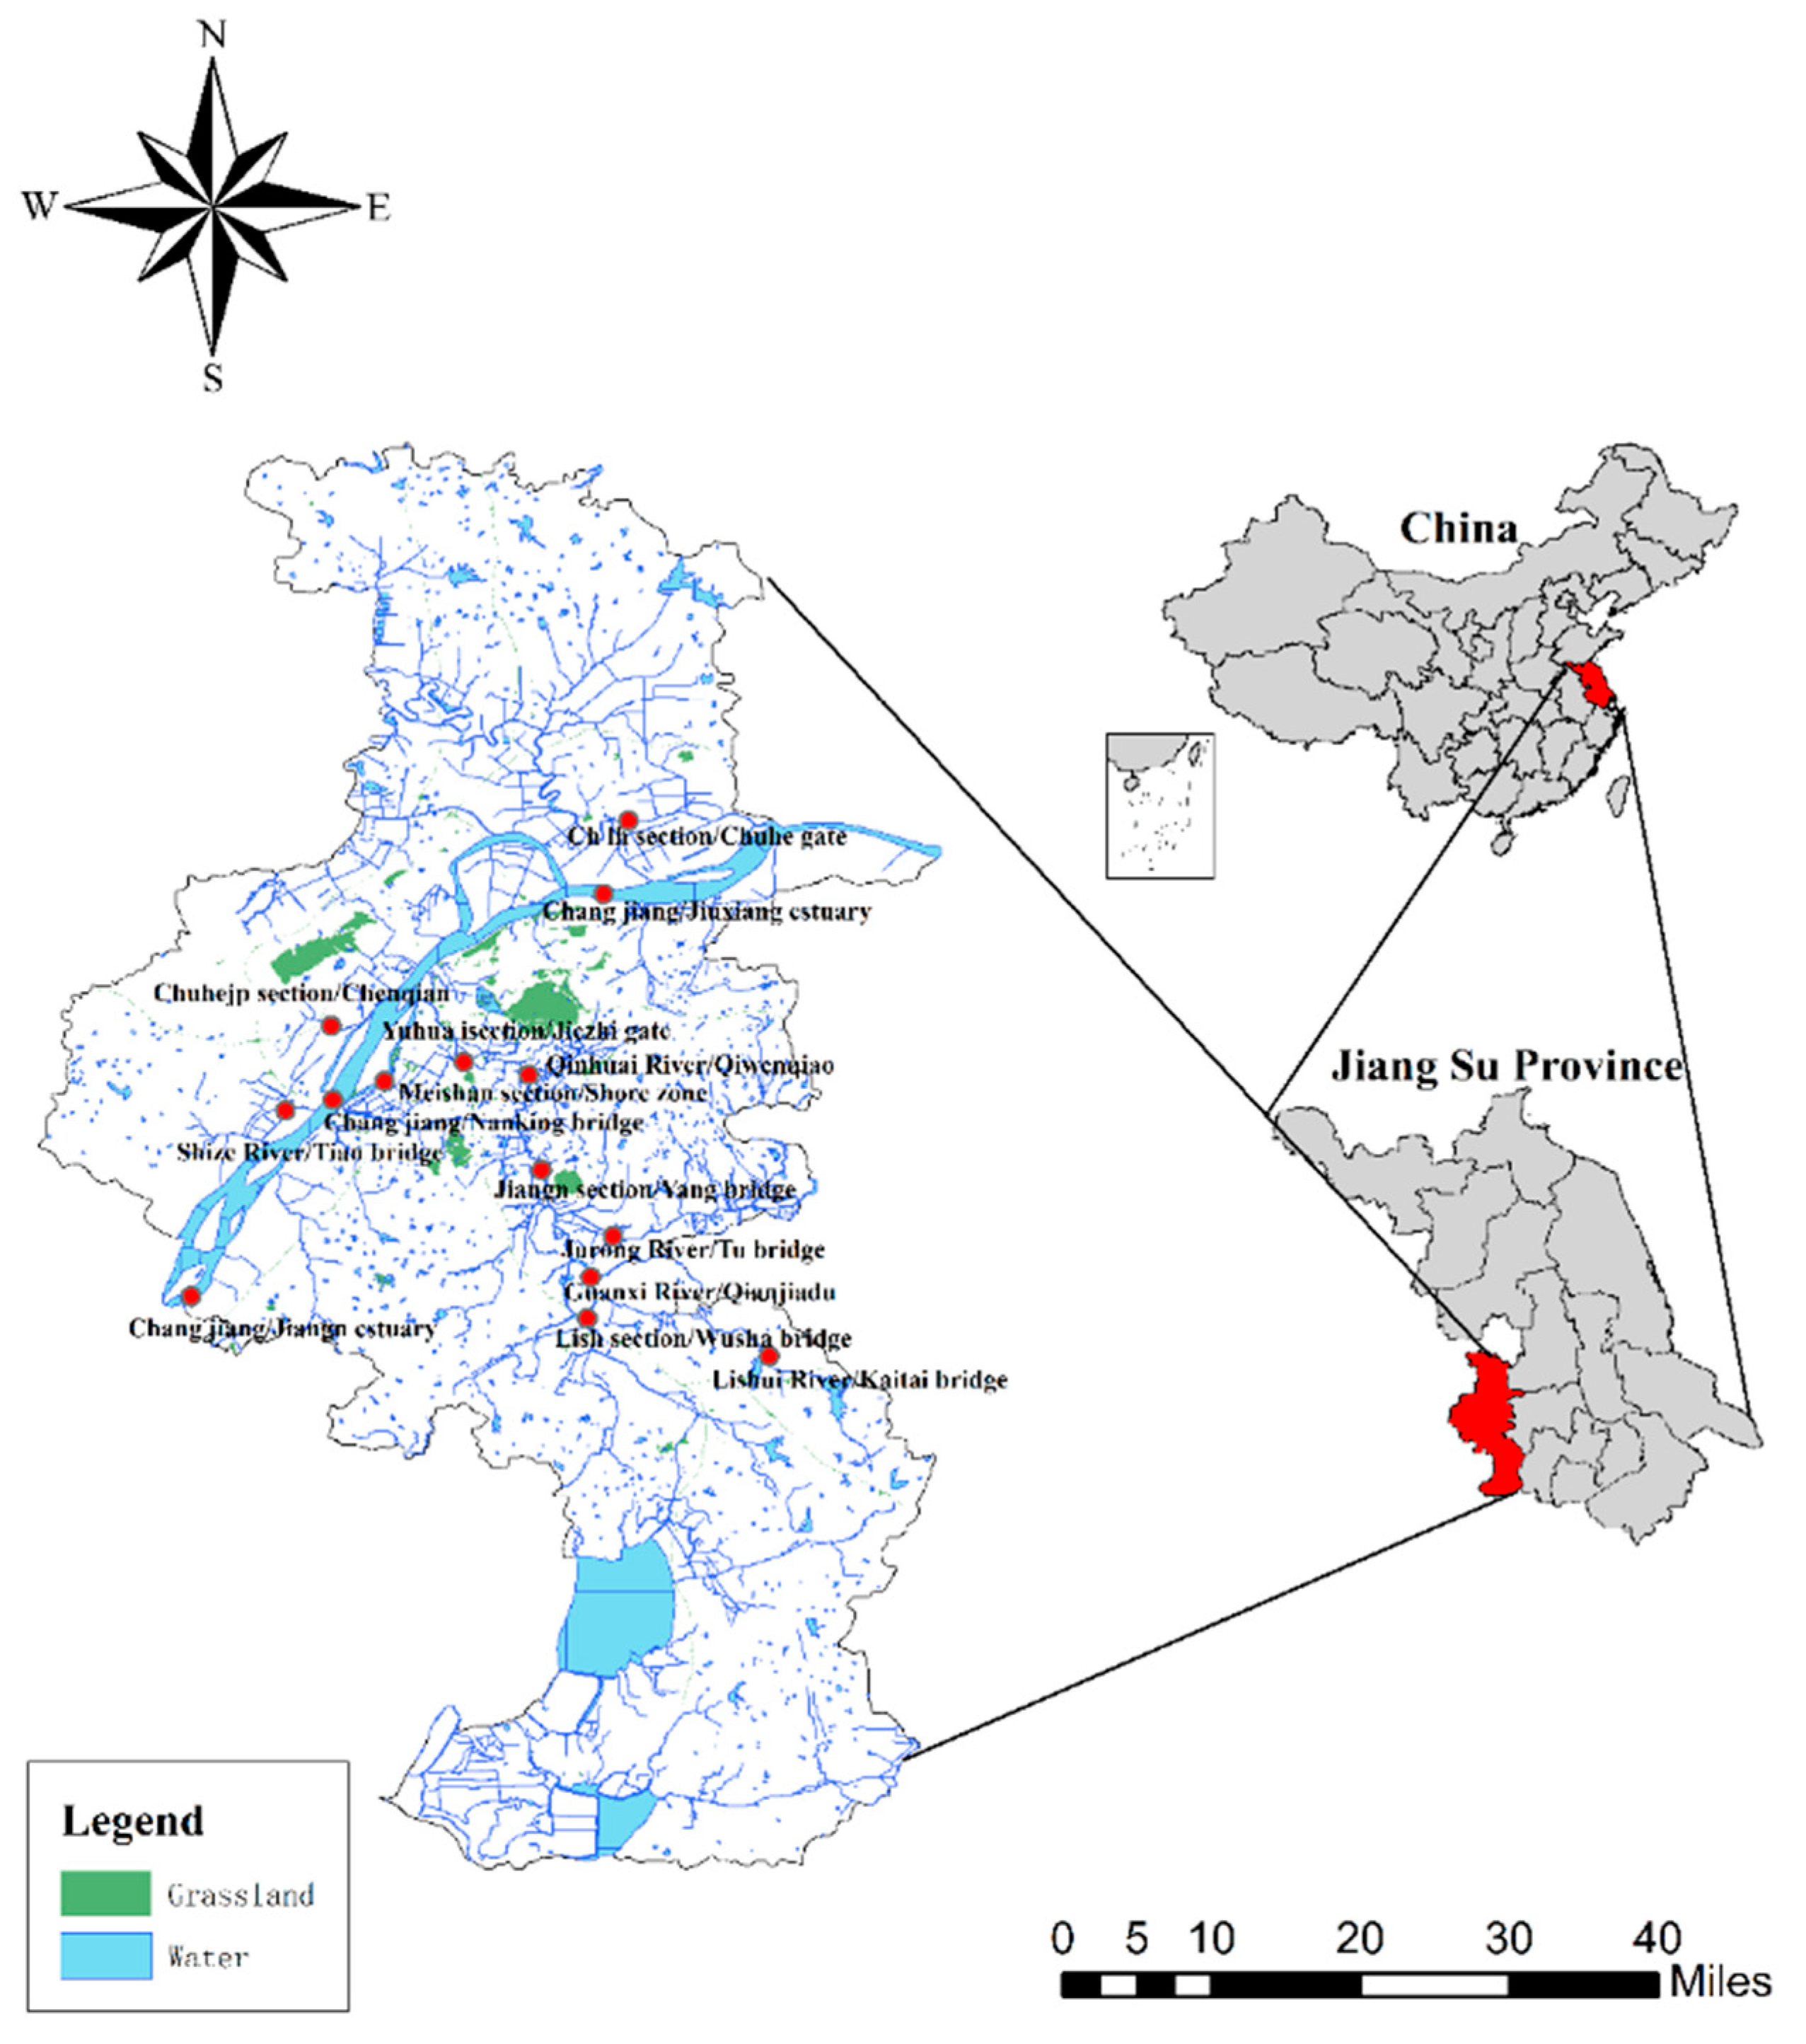
2.5. Study Area and Sampling
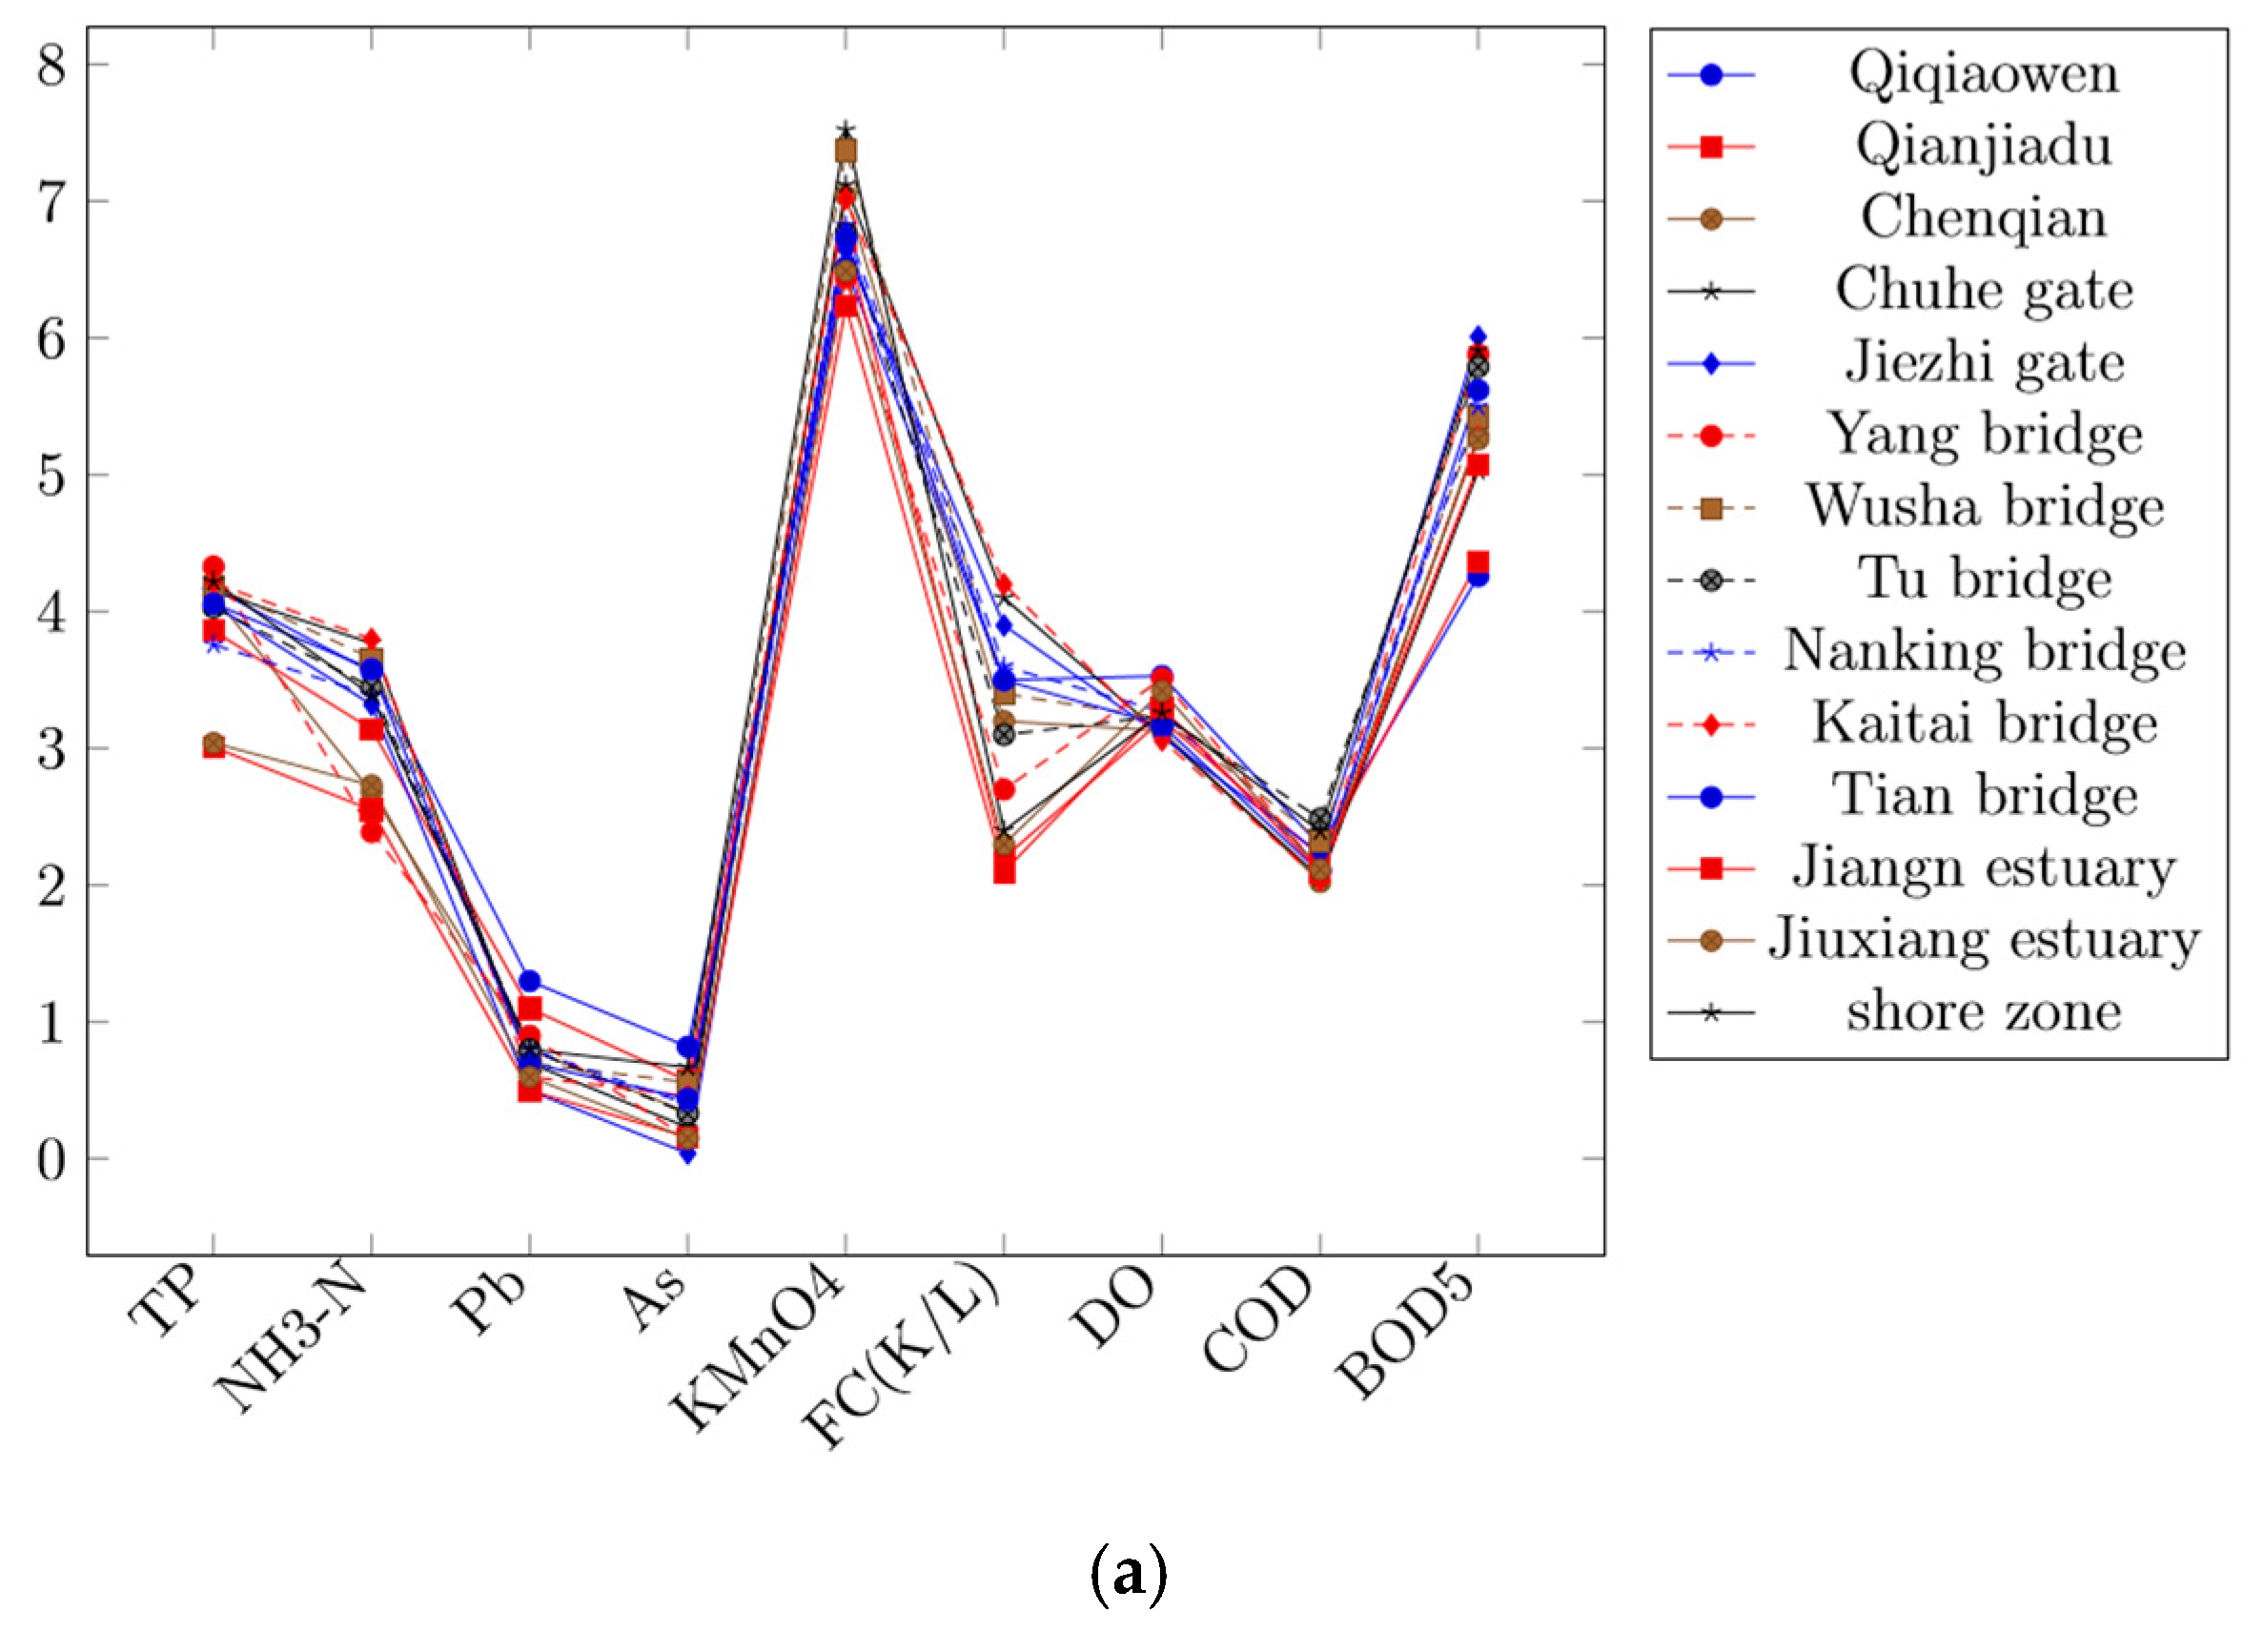
2.6. Evaluation Indicators and Class Criteria
3. Experiments
4. Results and Discussion
4.1. Analysis of Assessment Results
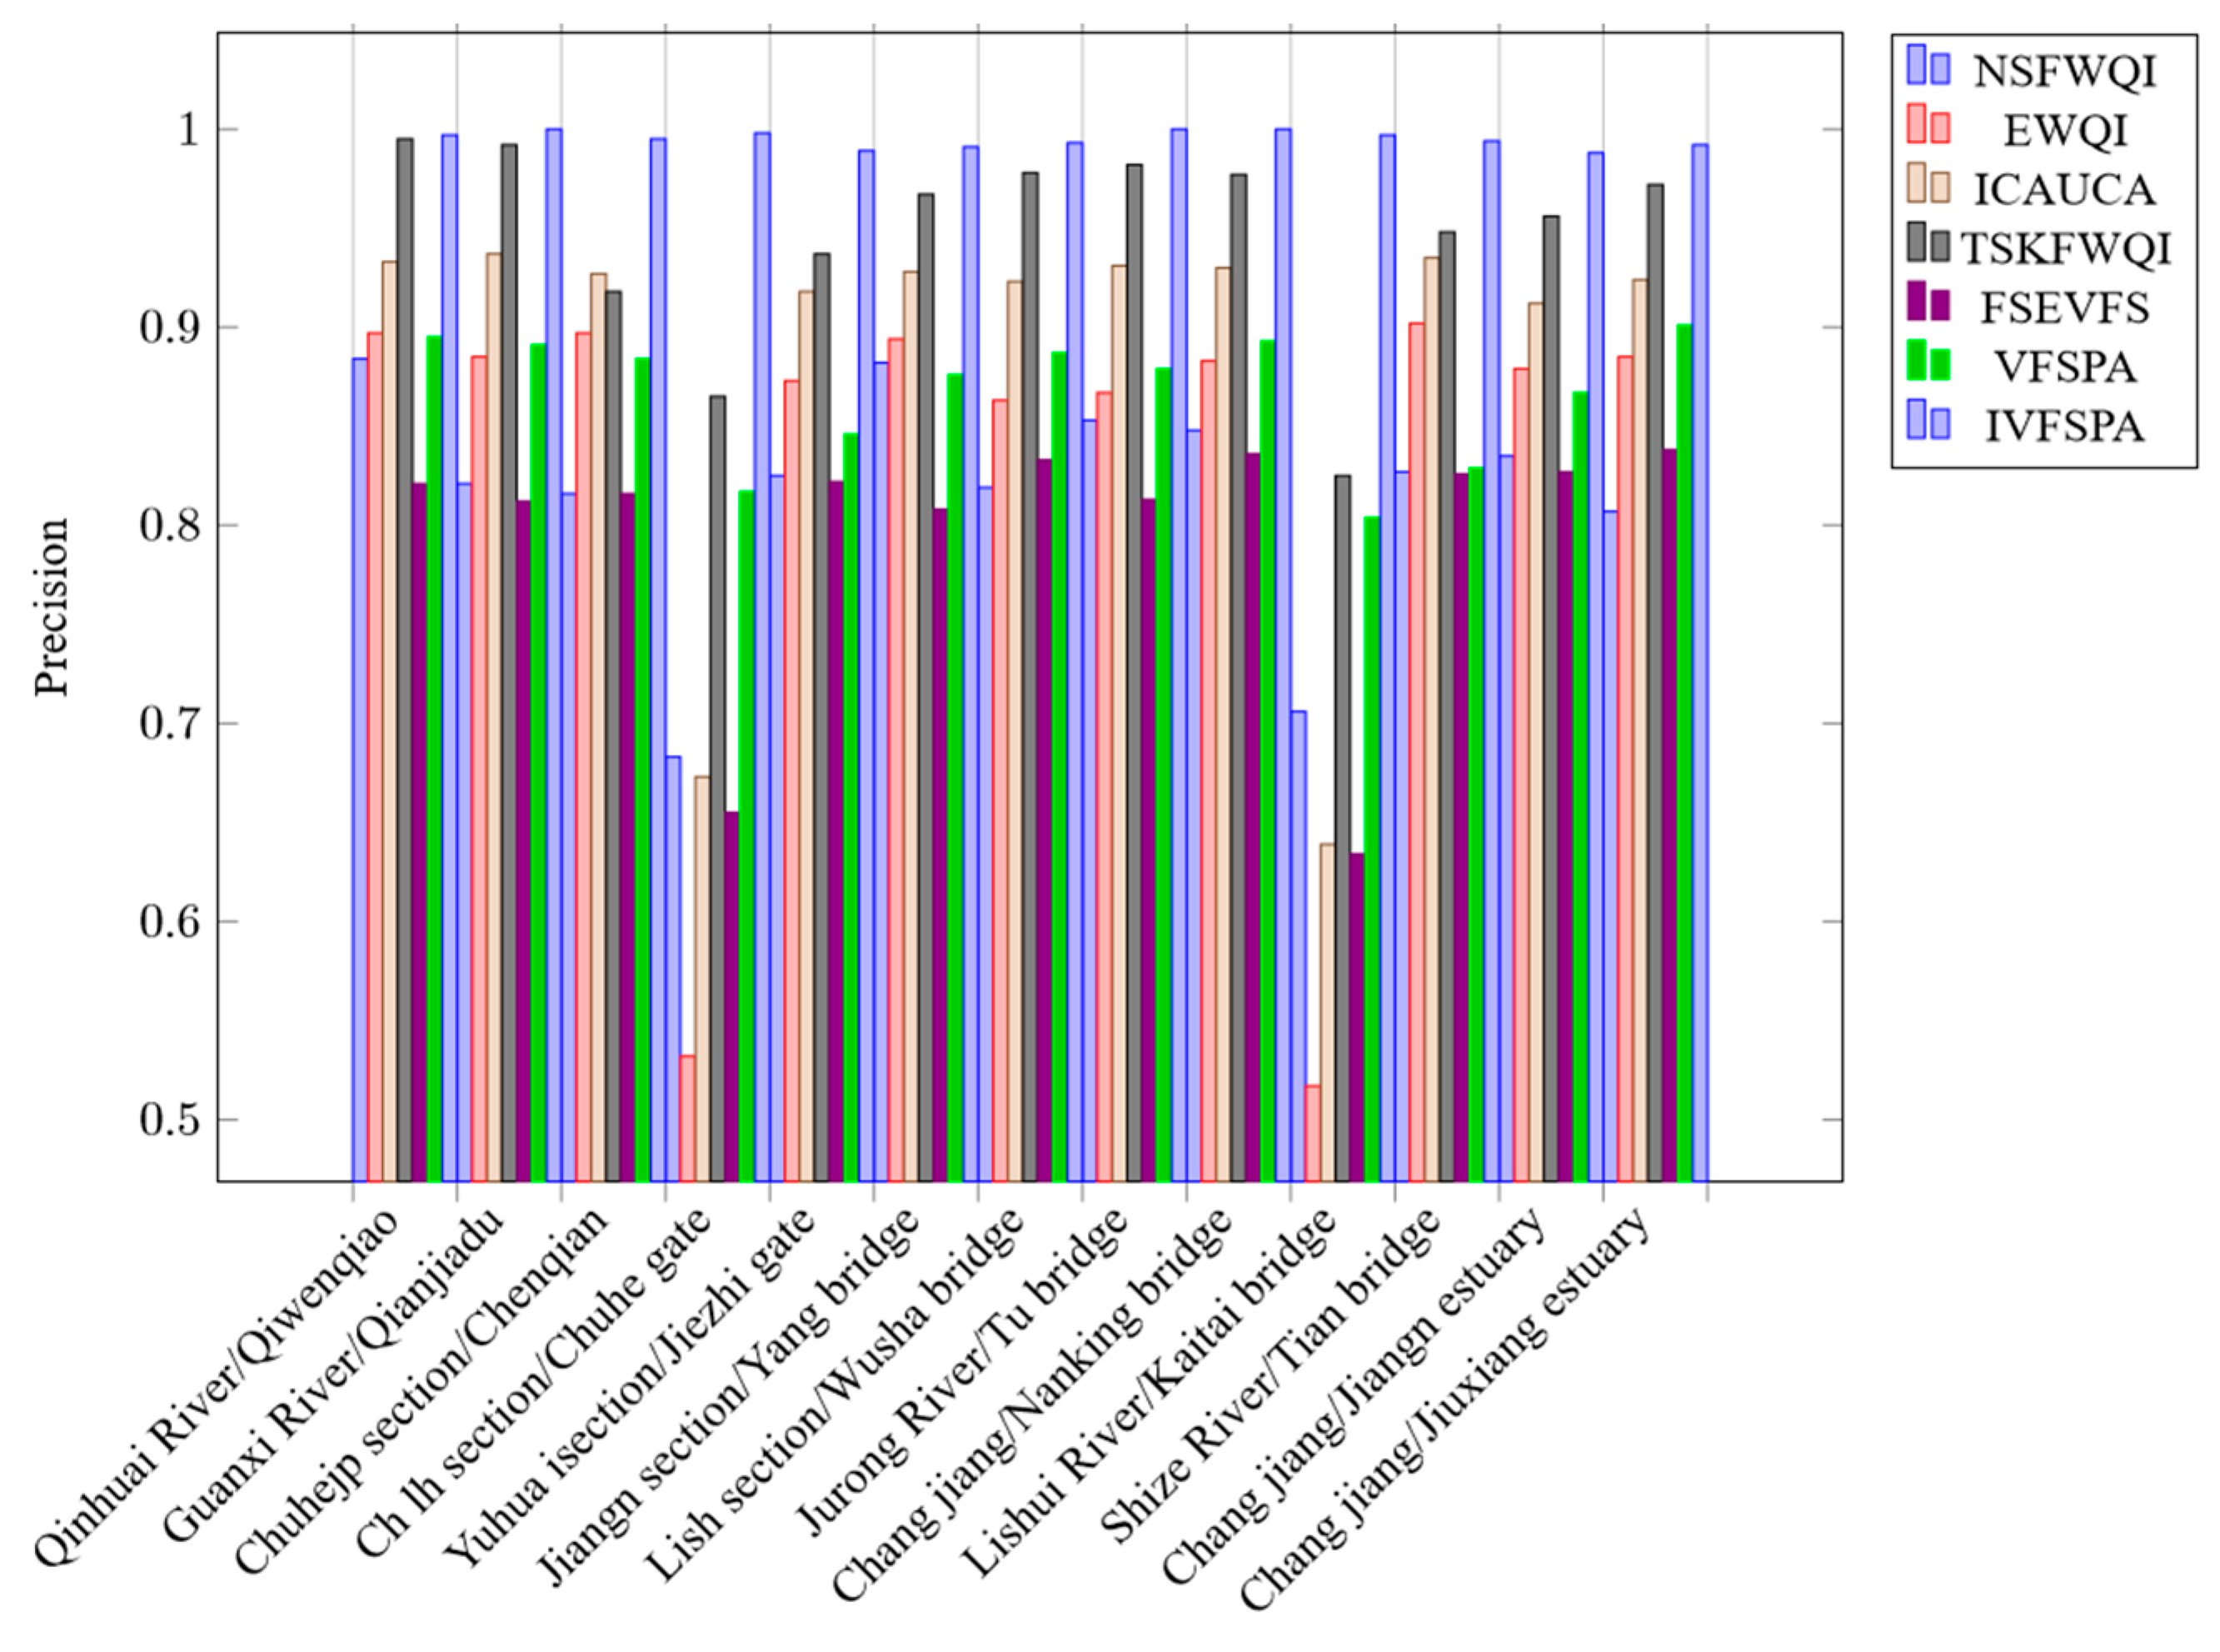
4.2. Method Performance Evaluation
4.3. Metrics Validation of Method Performance
5. Conclusions
Author Contributions
Funding
Acknowledgments
Conflicts of Interest
References
- Ott, W.R. Water Quality Indices: A Survey of Indices Used in the United States; Technical Report EPA 600/4 78 005; US Environmental Protection Agency: Washington, DC, USA, 1978.
- Ocampoduque, W.; Ferrehuguet, N.; Domingo, J.L.; Schuhmacher, M. Assessing Water Quality in Rivers with Fuzzy Inference Systems: A Case Study. Environ. Int. 2006, 32, 733–742. [Google Scholar] [CrossRef] [PubMed]
- Sun, W.; Xia, C.; Xu, M.; Guo, J.; Sun, G. Application of Modified Water Quality Indices as Indicators to Assessthe Spatial and Temporal Trends of Water Quality in the Dongjiang River. Ecol. Indic. 2016, 66, 306–312. [Google Scholar] [CrossRef]
- Mirauda, D.; Ostoich, M. Assessment of Pressure Sources and Water Body Resilience: An Integrated Approach for Action Planning in a Polluted River Basin. Int. J. Environ. Res. Public Heal. 2018, 15, 390. [Google Scholar] [CrossRef] [PubMed]
- Koçer, M.A.T.; Sevgili, H. Parameters Selection for Water Quality Index in the Assessment of the Environmental Impacts of Land-Based Trout Farms. Ecol. Indic. 2014, 36, 672–681. [Google Scholar] [CrossRef]
- Ocampoduque, W.; Schuhmacher, M.; Domingo, J.L. Aneural Fuzzy Approach to Classify the Ecological Status in Surface Waters. Environ. Pollut. 2007, 148, 634–641. [Google Scholar] [CrossRef] [PubMed]
- Vasanthavigar, M.; Srinivasamoorthy, K.; Vijayaragavan, K.; Ganthi, R.R.; Chidambaram, S.; Anandhan, P.; Manivannan, R.; Vasudevan, S. Application of Water Quality Index for Groundwater Quality Assessment: Thirumanimuttar Sub-Basin, Tamilnadu, India. Environ. Monit. Assess. 2010, 171, 595–609. [Google Scholar] [CrossRef]
- Mohebbi, M.R.; Saeedi, R.; Montazeri, A.; Vaghefi, K.A.; Labbafi, S.; Oktaie, S.; Abtahi, M.; Mohagheghian, A. Assessment of Water Quality in Ground Water Resources of Iran Using a Modified Drinking Water Quality Index (DWQI). Ecol. Indic. 2013, 30, 28–34. [Google Scholar] [CrossRef]
- Sikder, M.; Tanaka, S.; Saito, T.; Hosokawa, T.; Gumiri, S.; Ardianor, A.; Uddin, M.; Tareq, S.M.; Shammi, M.; Kamal, A.K.I.; et al. Vulnerability Assessment of Surface Water Quality with an Innovative Integrated Multi Parameter Water Quality Index (imwqi). Polym. J. 2015, 1, 333–346. [Google Scholar]
- Hoseinzadeh, E.; Khorsandi, H.; Wei, C.; Alipour, M. Evaluation of Aydugh Mush River Water Quality Using the National Sanitation Foundation Water Quality Index (NSFWQI), River Pollution Index (RPI), and Forestry Water Quality Index (FWQI). Desalin. Water Treat. 2015, 54, 2994–3002. [Google Scholar] [CrossRef]
- Benouara, N.; Laraba, A.; Rachedi, L.H. Assessment of Ground Water Quality in the Seraidi Region (North East of Algeria) Using Nsf-Wqi. Water Sci. Technol. Water Supply 2016, 16, 1132–1137. [Google Scholar] [CrossRef]
- Misaghi, F.; Delgosha, F.; Razzaghmanesh, M.; Myers, B. Introducing a Water Quality Index for Assessing Water for Irrigation Purposes: A Case Study of the Ghezelozan River. Sci. Total Environ. 2017, 589, 107–116. [Google Scholar] [CrossRef] [PubMed]
- Pham, L. Comparison between Water Quality Index (WQI) and Biological Indices, Based on Planktonic Diatom for Water Quality Assessment in the Dong Nai River, Vietnam. Polym. J. 2017, 3, 311–323. [Google Scholar]
- Wu, Z.; Wang, X.; Chen, Y.; Cai, Y.; Deng, J. Assessing River Water Quality Using Water Quality Index in Lake Taihu Basin, China. Sci. Total. Environ. 2018, 612, 914–922. [Google Scholar] [CrossRef] [PubMed]
- Sutadian, A.D.; Muttil, N.; Yilmaz, A.G.; Perera, B. Development of a Water Quality Index for Rivers in West Java Province, Indonesia. Ecol. Indic. 2018, 85, 966–982. [Google Scholar] [CrossRef]
- Amiri, V.; Rezaei, M.; Sohrabi, N. Ground Water Quality Assessment Using Entropy Weighted Water Quality Index (Ewqi) in Lenjanat, Iran. Environ. Earth Sci. 2014, 72, 3479–3490. [Google Scholar] [CrossRef]
- Chen, Y.; Yeh, H.; Wei, C. Estimation of River Pollution Index in a Tidal Stream Using Kriging Analysis. Int. J. Environ. Res. Public Health 2012, 9, 3085–3100. [Google Scholar] [CrossRef]
- Torres, P.; Cruz, C.; Patino, P.; Escobar, J.C.; Perez, A. Aplicacion De Indices De Calidad De Agua Ica Orientados Al Usode La Fuente Para Consumo Humano. Rev. Ing. E Investig. 2010, 30, 86–95. [Google Scholar]
- Lu, X.; Li, L.Y.; Lei, K.; Wang, L.; Zhai, Y.; Zhai, M. Water Quality Assessment of Wei River, China Using Fuzzy Synthetice Valuation. Environ. Earth Sci. 2010, 60, 1693–1699. [Google Scholar] [CrossRef]
- Yan, F.; Liu, L.; Zhang, Y.; Chen, M.; Chen, N. The Research of Dynamic Variable Fuzzy Set Assessment Model in Water Quality Evaluation. Water Resour. Manag. 2016, 30, 63–78. [Google Scholar] [CrossRef]
- Zadeh, L.A. Fuzzy Sets. Inf. Control 1965, 8, 338–353. [Google Scholar] [CrossRef]
- Dahiya, S.; Singh, B.; Gaur, S.; Garg, V.K.; Kushwaha, H.S. Analysis of Ground Water Quality Using Fuzzy Synthetic Evaluation. J. Hazard. Mater. 2007, 147, 938–946. [Google Scholar] [CrossRef]
- Saberi Nasr, A.; Rezaei, M.; Dashti Barmaki, M. Ground Water Contamination Analysis Using Fuzzy Water Quality Index (FWQI): Yazd Province, Iran. Geopersia 2013, 3, 47–55. [Google Scholar]
- Abomonasar, A.; Alzahrani, M.A. Framework for Water Quality Monitoring System in Water Distribution Networks Based on Vulnerability and Population Sensitivity Risks. Water Sci. Technol. Water Supply 2017, 17, 811–824. [Google Scholar] [CrossRef]
- Li, H.; Liu, G.; Yang, Z. Improved Gray Water Footprint Calculation Method Based on a Mass-Balance Model and on Fuzzy Synthetic Evaluation. J. Clean. Prod. 2019, 219, 377–390. [Google Scholar] [CrossRef]
- Lermontov, A.; Yokoyama, L.; Lermontov, M.; Machado, M.A.S. River Quality Analysis Using Fuzzy Water Quality Index: Ribeira Do Iguape River Watershed, Brazil. Ecol. Indic. 2009, 9, 1188–1197. [Google Scholar] [CrossRef]
- Ocampoduque, W.; Osorio, C.; Piamba, C.; Schuhmacher, M.; Domingo, J.L. Water Quality Analysis in Rivers with Nonparametric Probability Distributions and Fuzzy Inference Systems: Application to Thecauca River, Colombia. Env. Int. 2013, 52, 17–28. [Google Scholar] [CrossRef] [PubMed]
- Abadi, M.M.; Arshad, R.R. Long Term Evaluation of Water Quality Parameters of the Karoun River Using are Gression Approach and the Adaptive Neuro Fuzzy Inference System. Mar. Pollut. Bull. 2018, 126, 372–380. [Google Scholar]
- Wang, X.; Zou, Z.; Zou, H. Water Quality Evaluation of Haihe River with Fuzzy Similarity Measure Methods. J. Environ. Sci. 2013, 25, 2041–2046. [Google Scholar] [CrossRef]
- Fang, Y.; Zheng, X.; Peng, H.; Wang, H.; Xin, J. A New Method of the Relative Membership Degree Calculation in Variable Fuzzy Sets for Water Quality Assessment. Ecol. Indic. 2019, 98, 515–522. [Google Scholar] [CrossRef]
- Chen, S.Y.; Guo, Y. Variable Fuzzy Sets and Their Application to Comprehensive Risk Evaluation for Flood Control Engineering System. Adv. Sci. Technol. Water Resour. 2005, 5, 153–162. [Google Scholar]
- Zhang, D.; Wang, G.; Zhou, H. Assessment on Agricultural Drought Risk Based on Variable Fuzzy Sets Model. Chin. Geogr. Sci. 2011, 21, 167–175. [Google Scholar] [CrossRef]
- Wang, D.; Singh, V.P.; Zhu, Y. Hybrid Fuzzy and Optimal Modeling for Water Quality Evaluation. Water Resour. Res. 2007, 43. [Google Scholar] [CrossRef]
- An, Y.; Zou, Z.; Li, R. Water Quality Assessment in the Harbin Reach of the Song Huajiang River (China) Based on a Fuzzy Rough Set and an Attribute Recognition the Oretical Model. Int. J. Environ. Res. Public Health 2014, 11, 3507–3520. [Google Scholar] [CrossRef] [PubMed]
- Xu, S.; Wang, T.; Hu, S. Dynamic Assessment of Water Quality Based on a Variable Fuzzy Pattern Recognition Model. Int. J. Environ. Res. Public Heal. 2015, 12, 2230–2248. [Google Scholar] [CrossRef]
- Wensheng, W. Set Pair Analysis Based Variable Fuzzy Set Assessment Model for Water Shed Water Resources Security. J. Sichuan Univ. 2008, 40, 6–12. [Google Scholar]
- Su, M.; Yang, Z.; Chen, B. Set Pair Analysis for Urban Ecosystem Health Assessment. Commun. Nonlinear Sci. Numer. Simul. 2009, 14, 1773–1780. [Google Scholar] [CrossRef]
- Su, S.; Chen, X.; Degloria, S.D.; Wu, J. Integrative Fuzzy Set Pair Model for Land Ecological Security Assessment: A Case Study of Xiaolang Di Reservoir Region, China. Stoch. Environ. Res. Risk Assess. 2010, 24, 639–647. [Google Scholar] [CrossRef]
- Wang, W.; Xu, D.; Chau, K.; Lei, G. Assessment of River Water Quality Based on Theory of Variable Fuzzy Sets and Fuzzy Binary Comparison Method. Water Resour. Manag. 2014, 28, 4183–4200. [Google Scholar] [CrossRef]
- Shuang, Z.; Zhou, J.Z.; Xie, M.F.; Jiang, W.; Ding, X.L. Ahybridmodel Integrated Variable Fuzzy Set Theory and Set Pair Analysis for Water Quality Assessment in Huai River Basin. In Proceedings of the 2016 IEEE International Conference on Knowledge Engineering and Applications, Singapore, 28–30 September 2016; IEEE: Piscataway, NJ, USA, 2017; pp. 251–254. [Google Scholar]
- Wang, X.; Zhao, R.; Hao, Y. Flood Control Operations Based on the Theory of Variable Fuzzy Sets. Water Resour. Manag. 2011, 25, 777–792. [Google Scholar] [CrossRef]
- Zou, Z.H.; Yun, Y.; Sun, J.N. Entropy Method for Determination of Weight of Evaluating Indicators in Fuzzy Synthetic Evaluation for Water Quality Assessment. J. Environ. Sci. China 2006, 18, 1020–1023. [Google Scholar] [CrossRef]
- US Environmental Protection Agency. Techniques and Methods for Monitoring and Assessment of Drinking Water in the United States; US Environmental Protection Agency: Washington, WA, USA, 2018.
- Ministry of Water Resources of China. Guidelines for the Assessment of Ecological Water Demand in Rivers and Lakes (Trial) (SL/Z 479-2010); Ministry of Water Resources of China: Beijing, China, 2010.
- Beck, M.B. Water Quality Modeling: A Review of the Analysis of Uncertainty. Water Resour. Res. 1987, 23, 1393–1442. [Google Scholar] [CrossRef]
- Osborne, L.L.; Kovacic, D.A. Riparian Vegetated Buffer Strips in Water Quality Restoration and Stream Management. Fresh Water Biol. 2010, 29, 243–258. [Google Scholar] [CrossRef]
- Gorchev, H.G. WHO Guidelines for Drinking Water Quality; WHO: Geneva, Switzerland, 1984. [Google Scholar]


| Expression | Fuzzy Synthesis Operator | ||||
|---|---|---|---|---|---|
| Characteristic | M (●,+) | M (●,∨) | M (∧,⊕) | M (∨,∧) | |
| Feature efficiency | Weighted Average Significant | Highlight main Cause | Highlight main Main cause | Highlight main Main cause | |
| Weight effect | Significant | Not Significant | Not Significant | ||
| R function | Sufficient use | Insufficient | Under sufficient | Insufficient | |
| Overall effect | Very strong | Weak | Very strong | Weak | |
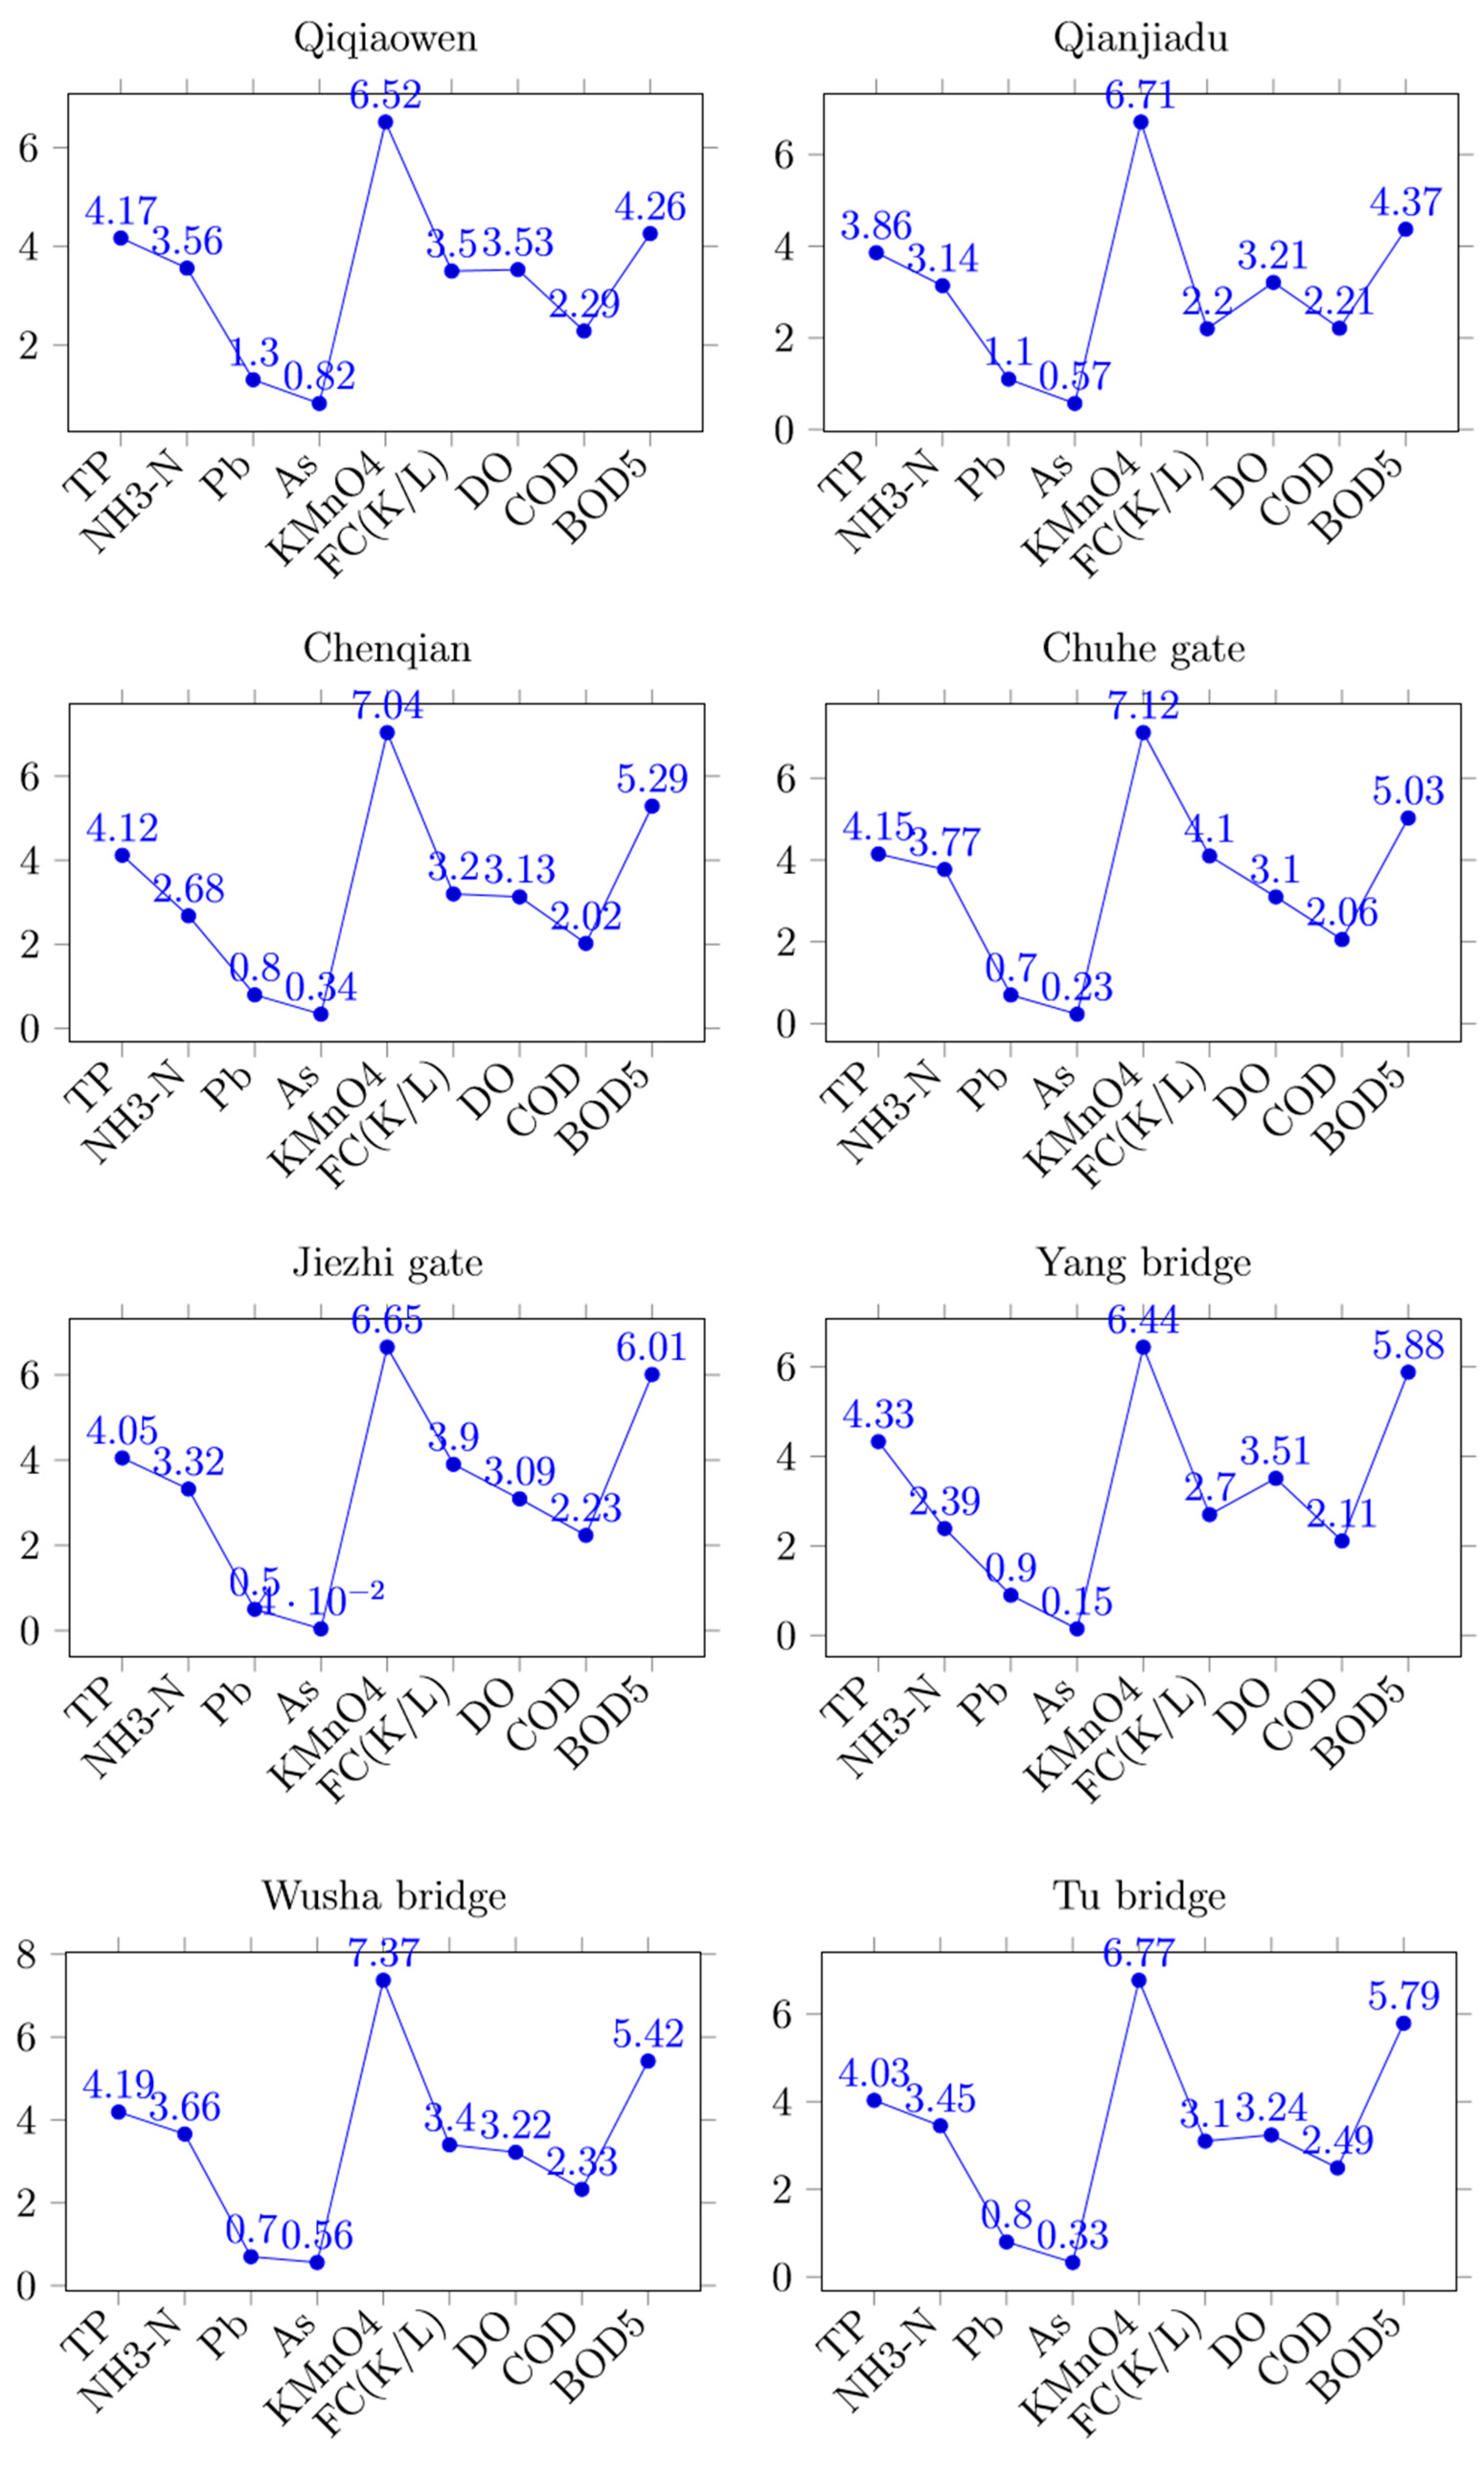
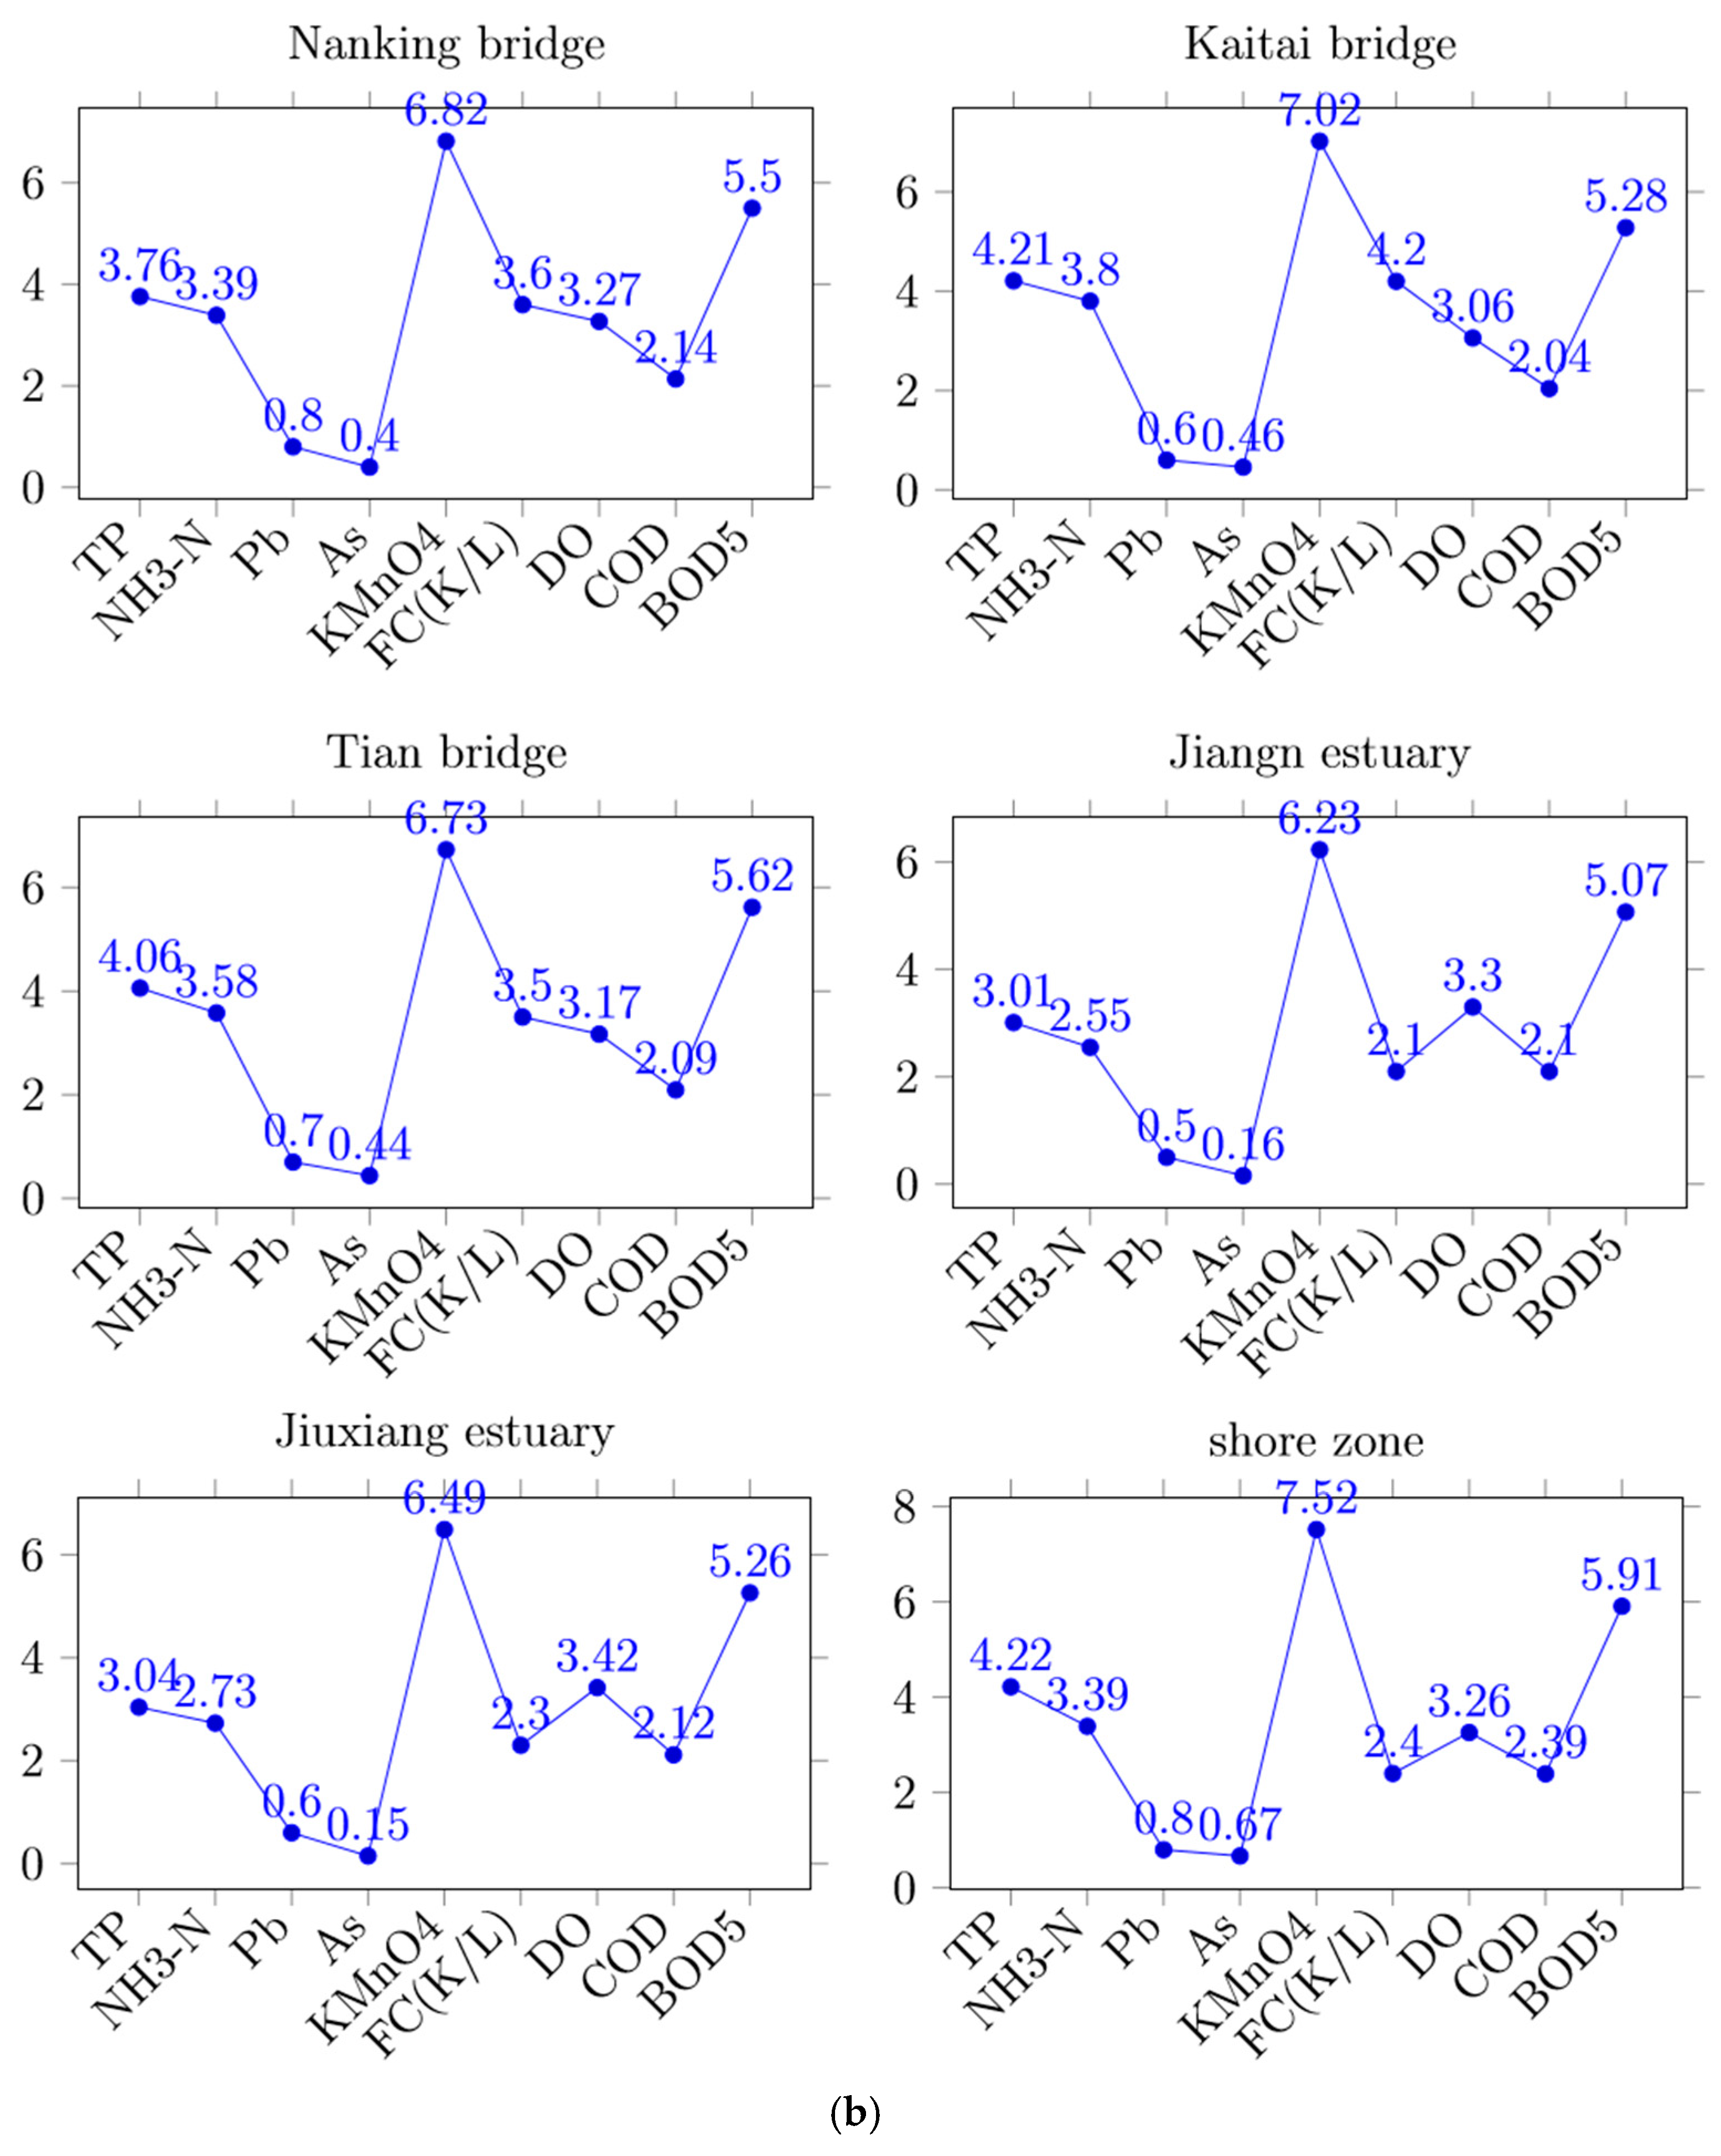
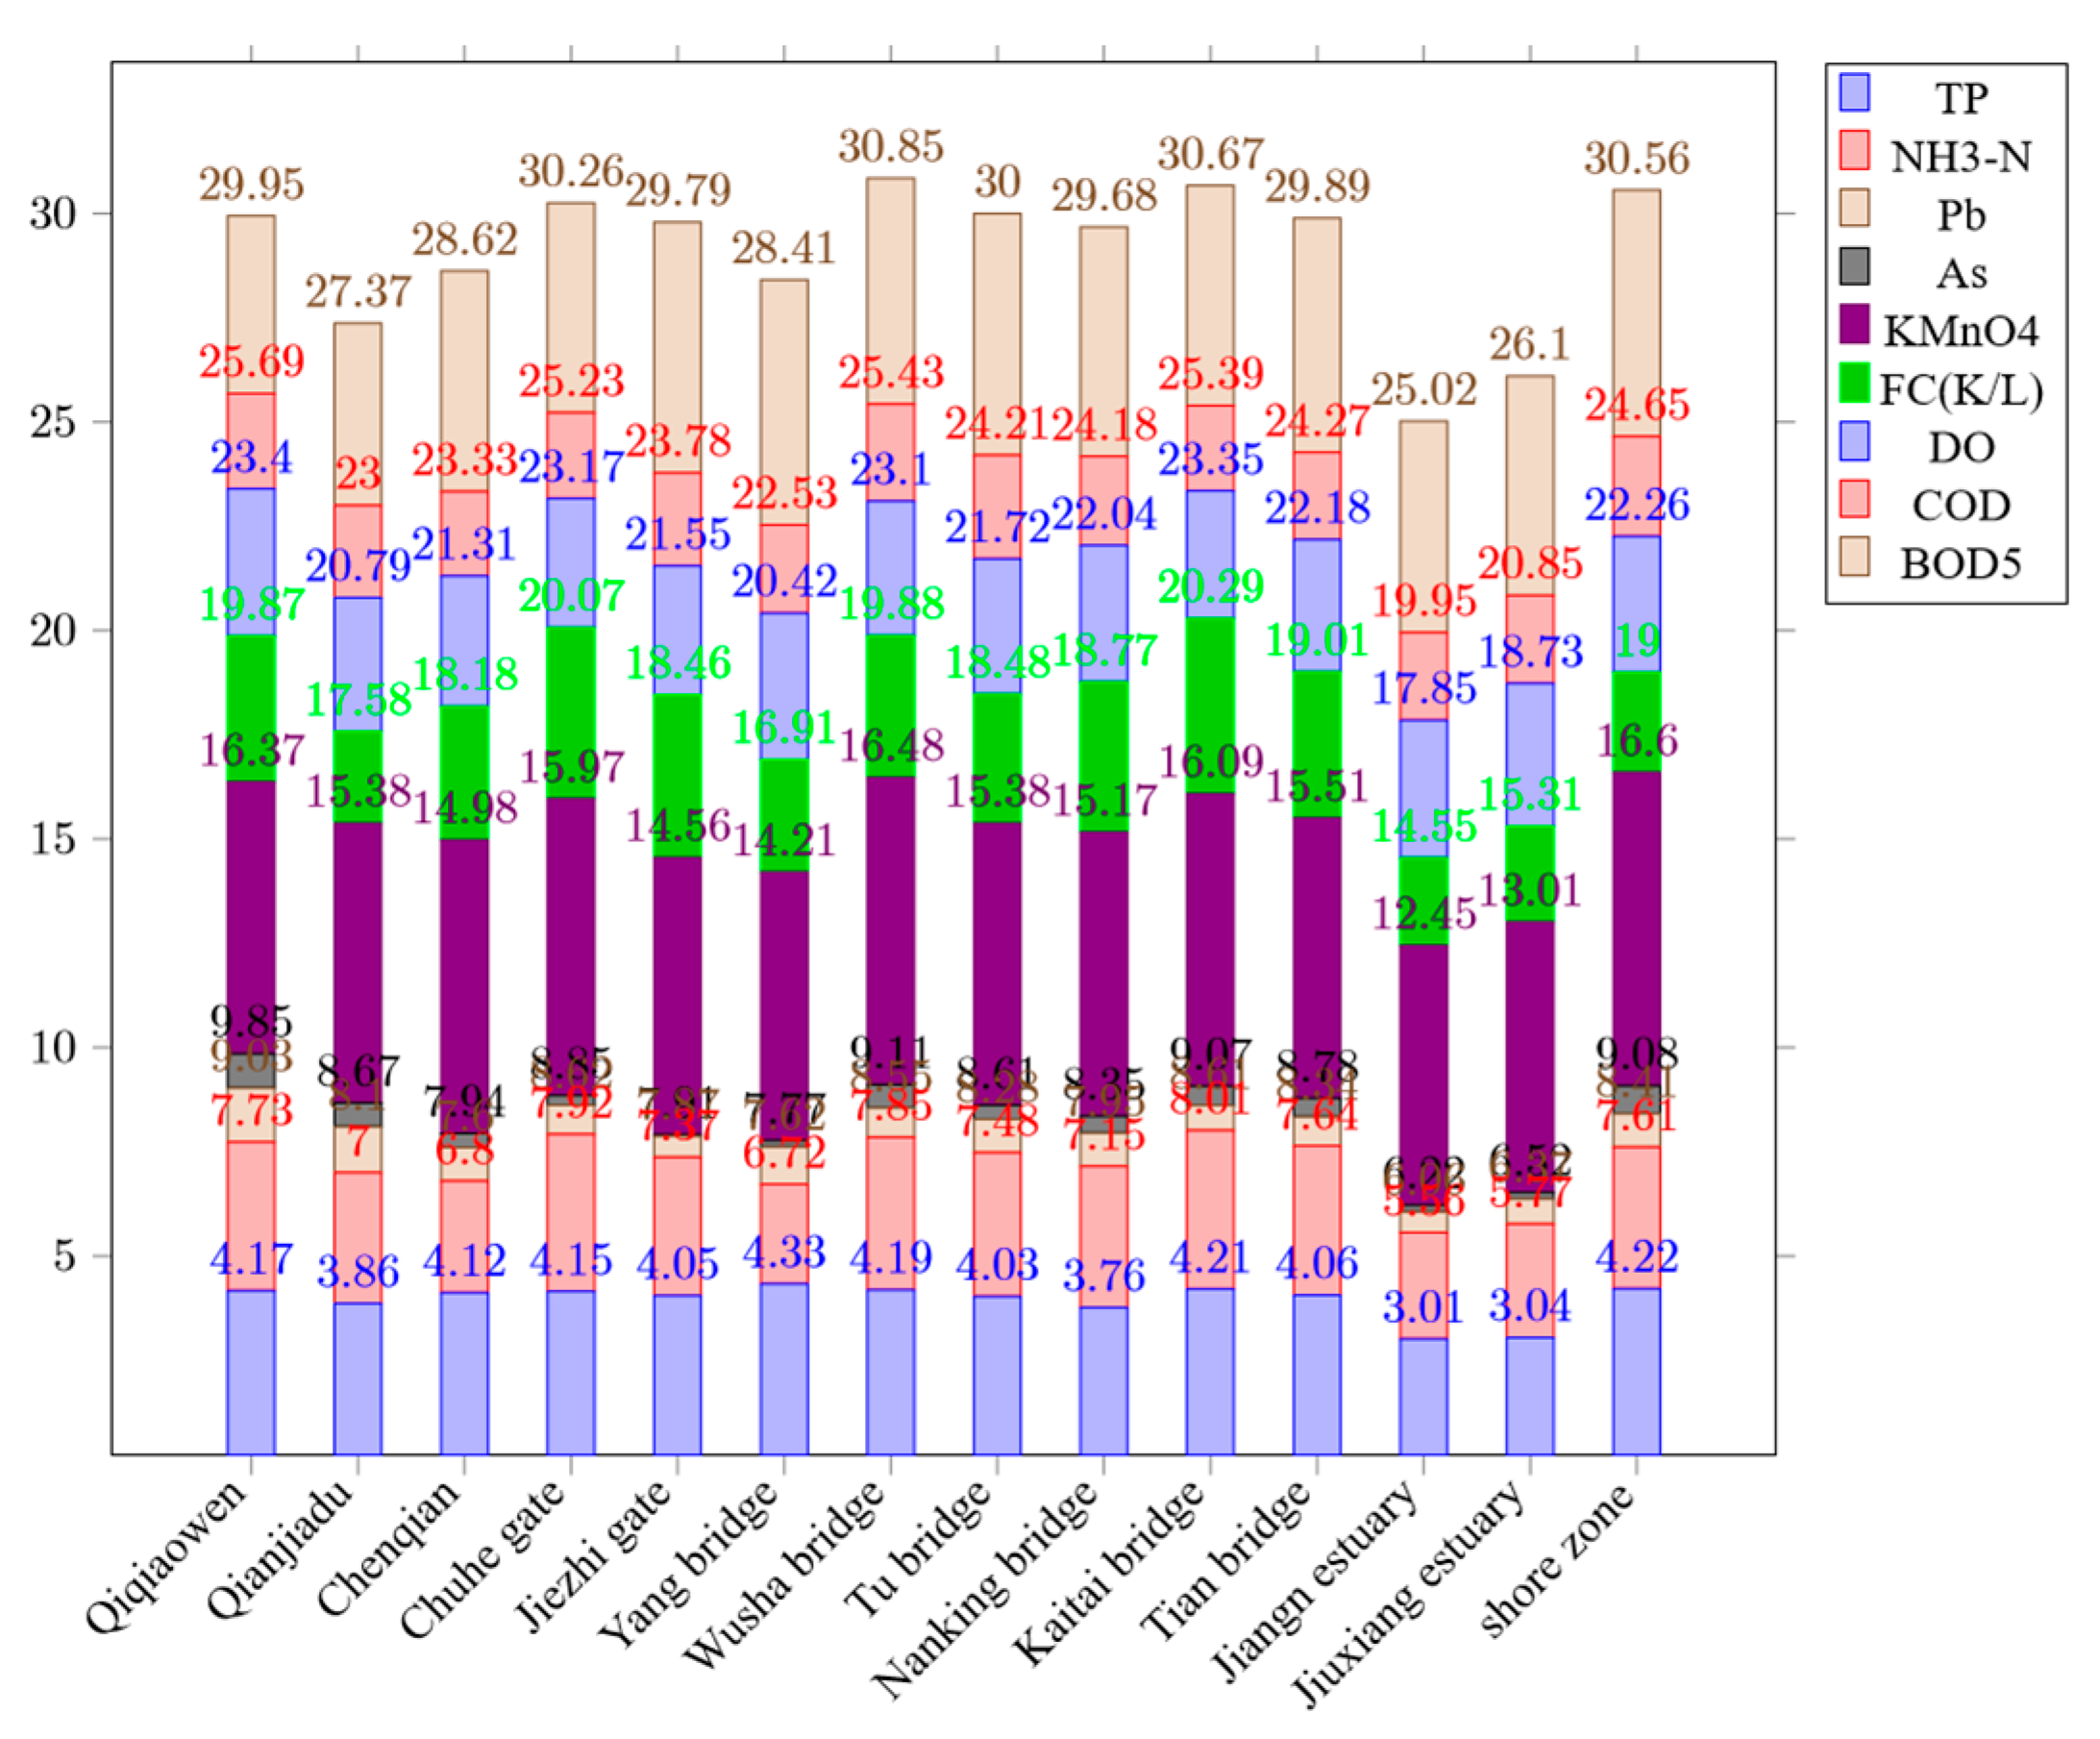
| River Section/Collection Point | TP | NH3-N | Pb | As | KMnO4 | FC (K/L) | DO | COD | BOD5 |
|---|---|---|---|---|---|---|---|---|---|
| Qinhuai River/Qiqiaowen | 0.417 | 3.56 | 0.13 | 0.82 | 6.52 | 35 | 3.53 | 22.87 | 4.26 |
| Guanxi River/Qianjiadu | 0.386 | 3.14 | 0.11 | 0.57 | 6.71 | 22 | 3.21 | 22.12 | 4.37 |
| Chuhe jp section/Chenqian | 0.412 | 2.68 | 0.08 | 0.34 | 7.04 | 32 | 3.13 | 20.24 | 5.29 |
| Chuhe lh section/Chuhe gate | 0.415 | 3.77 | 0.07 | 0.23 | 7.12 | 41 | 3.1 | 20.56 | 5.03 |
| Yuhuai section/Jiezhi gate | 0.405 | 3.32 | 0.05 | 0.04 | 6.65 | 39 | 3.09 | 22.33 | 6.01 |
| Jiangning section/Yang bridge | 0.433 | 2.39 | 0.09 | 0.15 | 6.44 | 27 | 3.51 | 21.13 | 5.88 |
| Lishui section/Wusha bridge | 0.419 | 3.66 | 0.07 | 0.56 | 7.37 | 34 | 3.22 | 23.27 | 5.42 |
| Jurong River/Tu bridge | 0.403 | 3.45 | 0.08 | 0.33 | 6.77 | 31 | 3.24 | 24.88 | 5.79 |
| Chang jiang/Nanking bridge | 0.376 | 3.39 | 0.08 | 0.4 | 6.82 | 36 | 3.27 | 21.36 | 5.5 |
| Lishui River/Kaitai bridge | 0.421 | 3.8 | 0.06 | 0.46 | 7.02 | 42 | 3.06 | 20.41 | 5.28 |
| Shize River/Tian bridge | 0.406 | 3.58 | 0.07 | 0.44 | 6.73 | 35 | 3.17 | 20.93 | 5.62 |
| Chang jiang/ | 0.301 | 2.55 | 0.05 | 0.16 | 6.23 | 21 | 3.3 | 21.01 | 5.07 |
| Jiangning estuary | |||||||||
| Chang jiang/ | 0.304 | 2.73 | 0.06 | 0.15 | 6.49 | 23 | 3.42 | 21.15 | 5.26 |
| Jiuxiang estuary | |||||||||
| Meishan section/shore zone | 0.422 | 3.39 | 0.08 | 0.67 | 7.52 | 24 | 3.26 | 23.94 | 5.91 |
| Serial number | Index/Element | Class I | Class II | Class III | Class IV | Class V |
|---|---|---|---|---|---|---|
| 1 | TP | ≤0.02 | ≤0.1 | ≤0.2 | ≤0.3 | ≤0.4 |
| 2 | NH3-N | ≤0.15 | ≤0.5 | ≤1 | ≤1.5 | ≤2 |
| 3 | Pb | ≤0.01 | ≤0.01 | ≤0.05 | ≤0.05 | ≤0.1 |
| 4 | As | ≤0.01 | ≤0.05 | ≤0.05 | ≤0.1 | ≤0.1 |
| 5 | KMnO4 | ≤2 | ≤4 | ≤6 | ≤10 | ≤15 |
| 6 | FC(K/L) | ≤0.2 | ≤2 | ≤10 | ≤20 | ≤40 |
| 7 | DO | ≥7.5 | ≥6 | ≥5 | ≥3 | ≥2 |
| 8 | COD | ≤15 | ≤15 | ≤20 | ≤30 | ≤40 |
| 9 | BOD5 | ≤3 | ≤3 | ≤4 | ≤6 | ≤10 |
| River Section/Collection Point | Class I | Class II | Class III | Class IV | Class V | Evaluation Level |
|---|---|---|---|---|---|---|
| Qinhuai River/Qiqiaowen | 0.1921 | 0.1879 | 0.1899 | 0.2713 | 0.2066 | V |
| Guanxi River/Qianjiadu | 0.1641 | 0.1757 | 0.1908 | 0.2705 | 0.1989 | V |
| Chuhe jp section/Chenqian | 0.143 | 0.1981 | 0.201 | 0.2633 | 0.1946 | IV |
| Ch lh section/Chuhe gate | 0.144 | 0.2001 | 0.1783 | 0.2719 | 0.2057 | V |
| Yuhuai section/Jiezhi gate | 0.2167 | 0.1422 | 0.1942 | 0.2537 | 0.1932 | IV |
| Jiangn section/Yang bridge | 0.1785 | 0.1661 | 0.1955 | 0.2612 | 0.1987 | IV |
| Lish section/Wusha bridge | 0.0972 | 0.2135 | 0.2004 | 0.2236 | 0.2653 | V |
| Jurong River/Tu bridge | 0.15 | 0.1895 | 0.1787 | 0.2705 | 0.2113 | V |
| Chang jiang/Nanking bridge | 0.1706 | 0.157 | 0.1945 | 0.2534 | 0.2245 | V |
| Lishui River/Kaitai bridge | 0.1219 | 0.1853 | 0.1985 | 0.2406 | 0.2537 | V |
| Shize River/Tian bridge | 0.1225 | 0.1624 | 0.2007 | 0.2728 | 0.2416 | V |
| Chang jiang/Jiangn estuary | 0.1183 | 0.1974 | 0.2391 | 0.2526 | 0.1927 | IV |
| Chang jiang/Jiuxiang estuary | 0.1426 | 0.2011 | 0.1976 | 0.2604 | 0.1983 | IV |
| Meishan section/shore zone | 0.1125 | 0.1648 | 0.2107 | 0.2355 | 0.2765 | V |
| Approach | NSFWQI | EWQI | ICAUCA | TSKFWQI | FSEVFS | VFSPA | IVFSPA |
|---|---|---|---|---|---|---|---|
| Qinhuai River/Qiqiaowen | V | IV | IV | V | V | V | V |
| Guanxi River/Qianjiadu | IV | V | V | V | V | IV | V |
| Chuhe jp section/Chenqian | III | IV | IV | III | IV | IV | IV |
| Ch lh section/Chuhe gate | IV | IV | IV | IV | IV | IV | V |
| Yuhuai section/Jiezhi gate | IV | IV | V | IV | IV | IV | IV |
| Jiangn section/Yang bridge | IV | IV | IV | V | IV | IV | IV |
| Lish section/Wusha bridge | V | V | V | V | V | V | V |
| Jurong River/Tu bridge | V | V | V | V | IV | V | V |
| Chang jiang/Nanking bridge | V | V | V | V | V | V | V |
| Lishui River/Kaitai bridge | IV | IV | IV | IV | IV | IV | V |
| Shize River/Tian bridge | V | V | V | V | V | V | V |
| Chang jiang/Jiangn estuary | IV | III | IV | IV | IV | IV | IV |
| Chang jiang/Jiuxiang estuary | IV | IV | III | IV | IV | IV | IV |
| Meishan section/shore zone | V | V | V | V | IV | V | V |
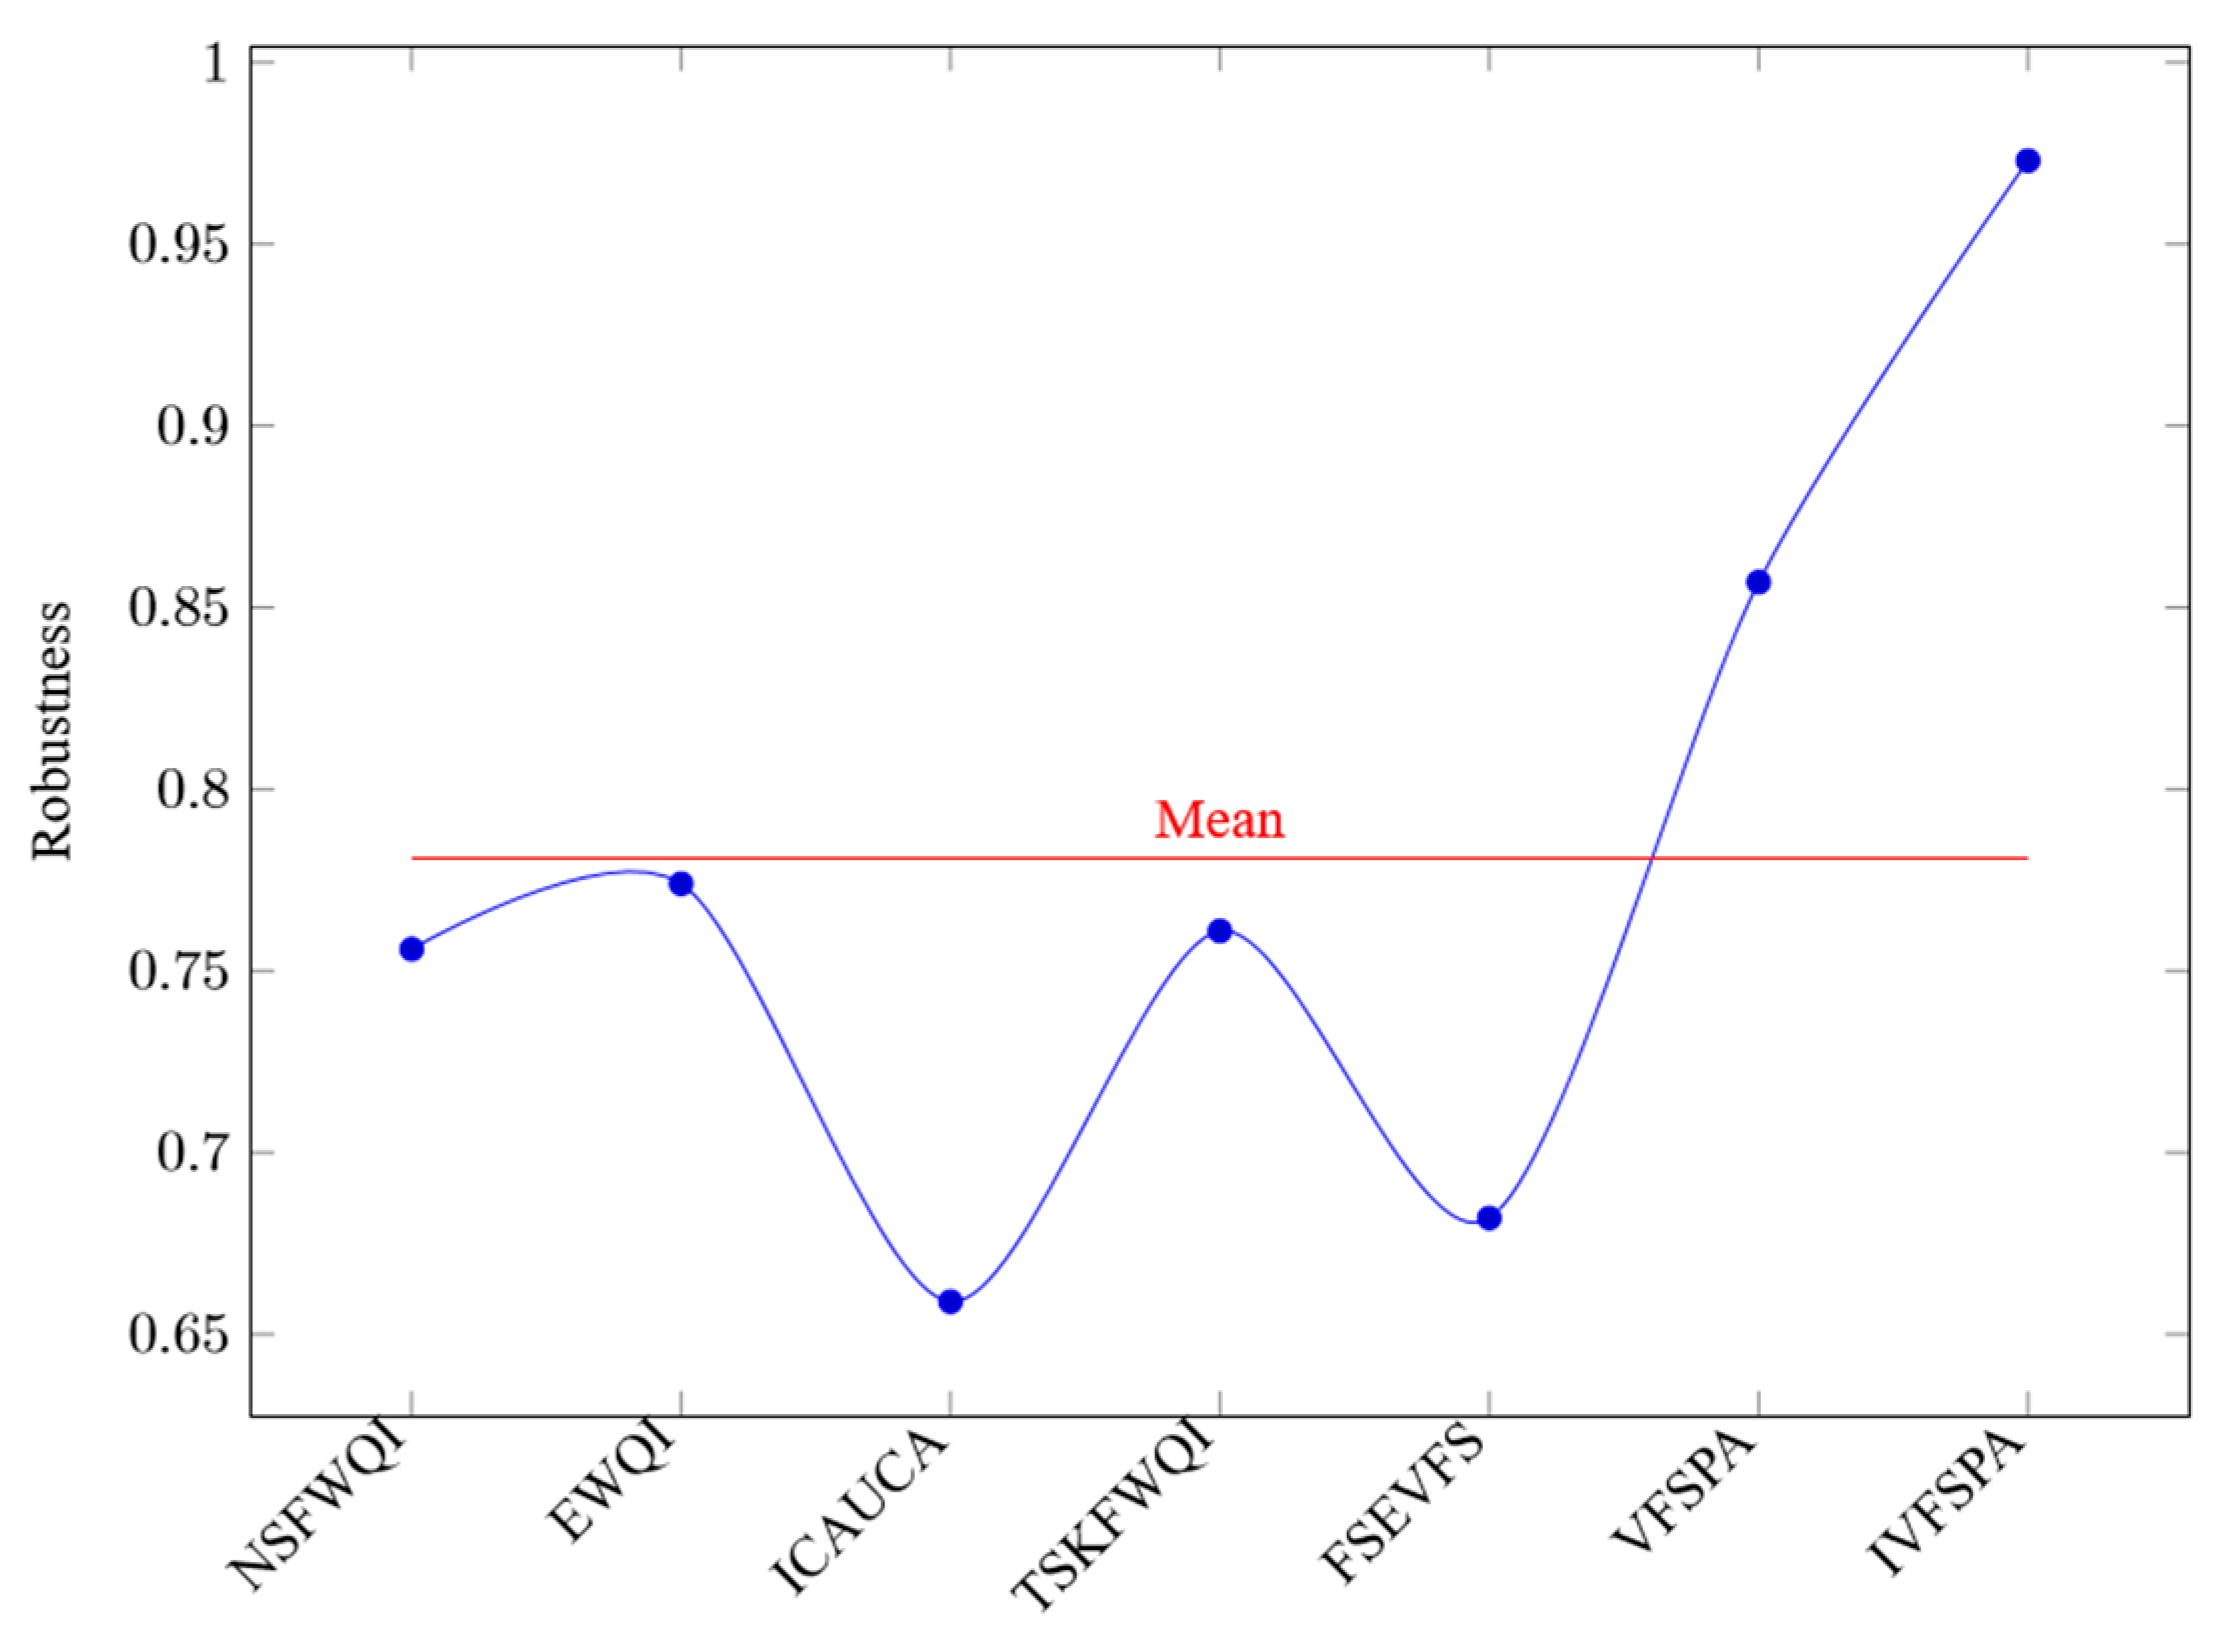
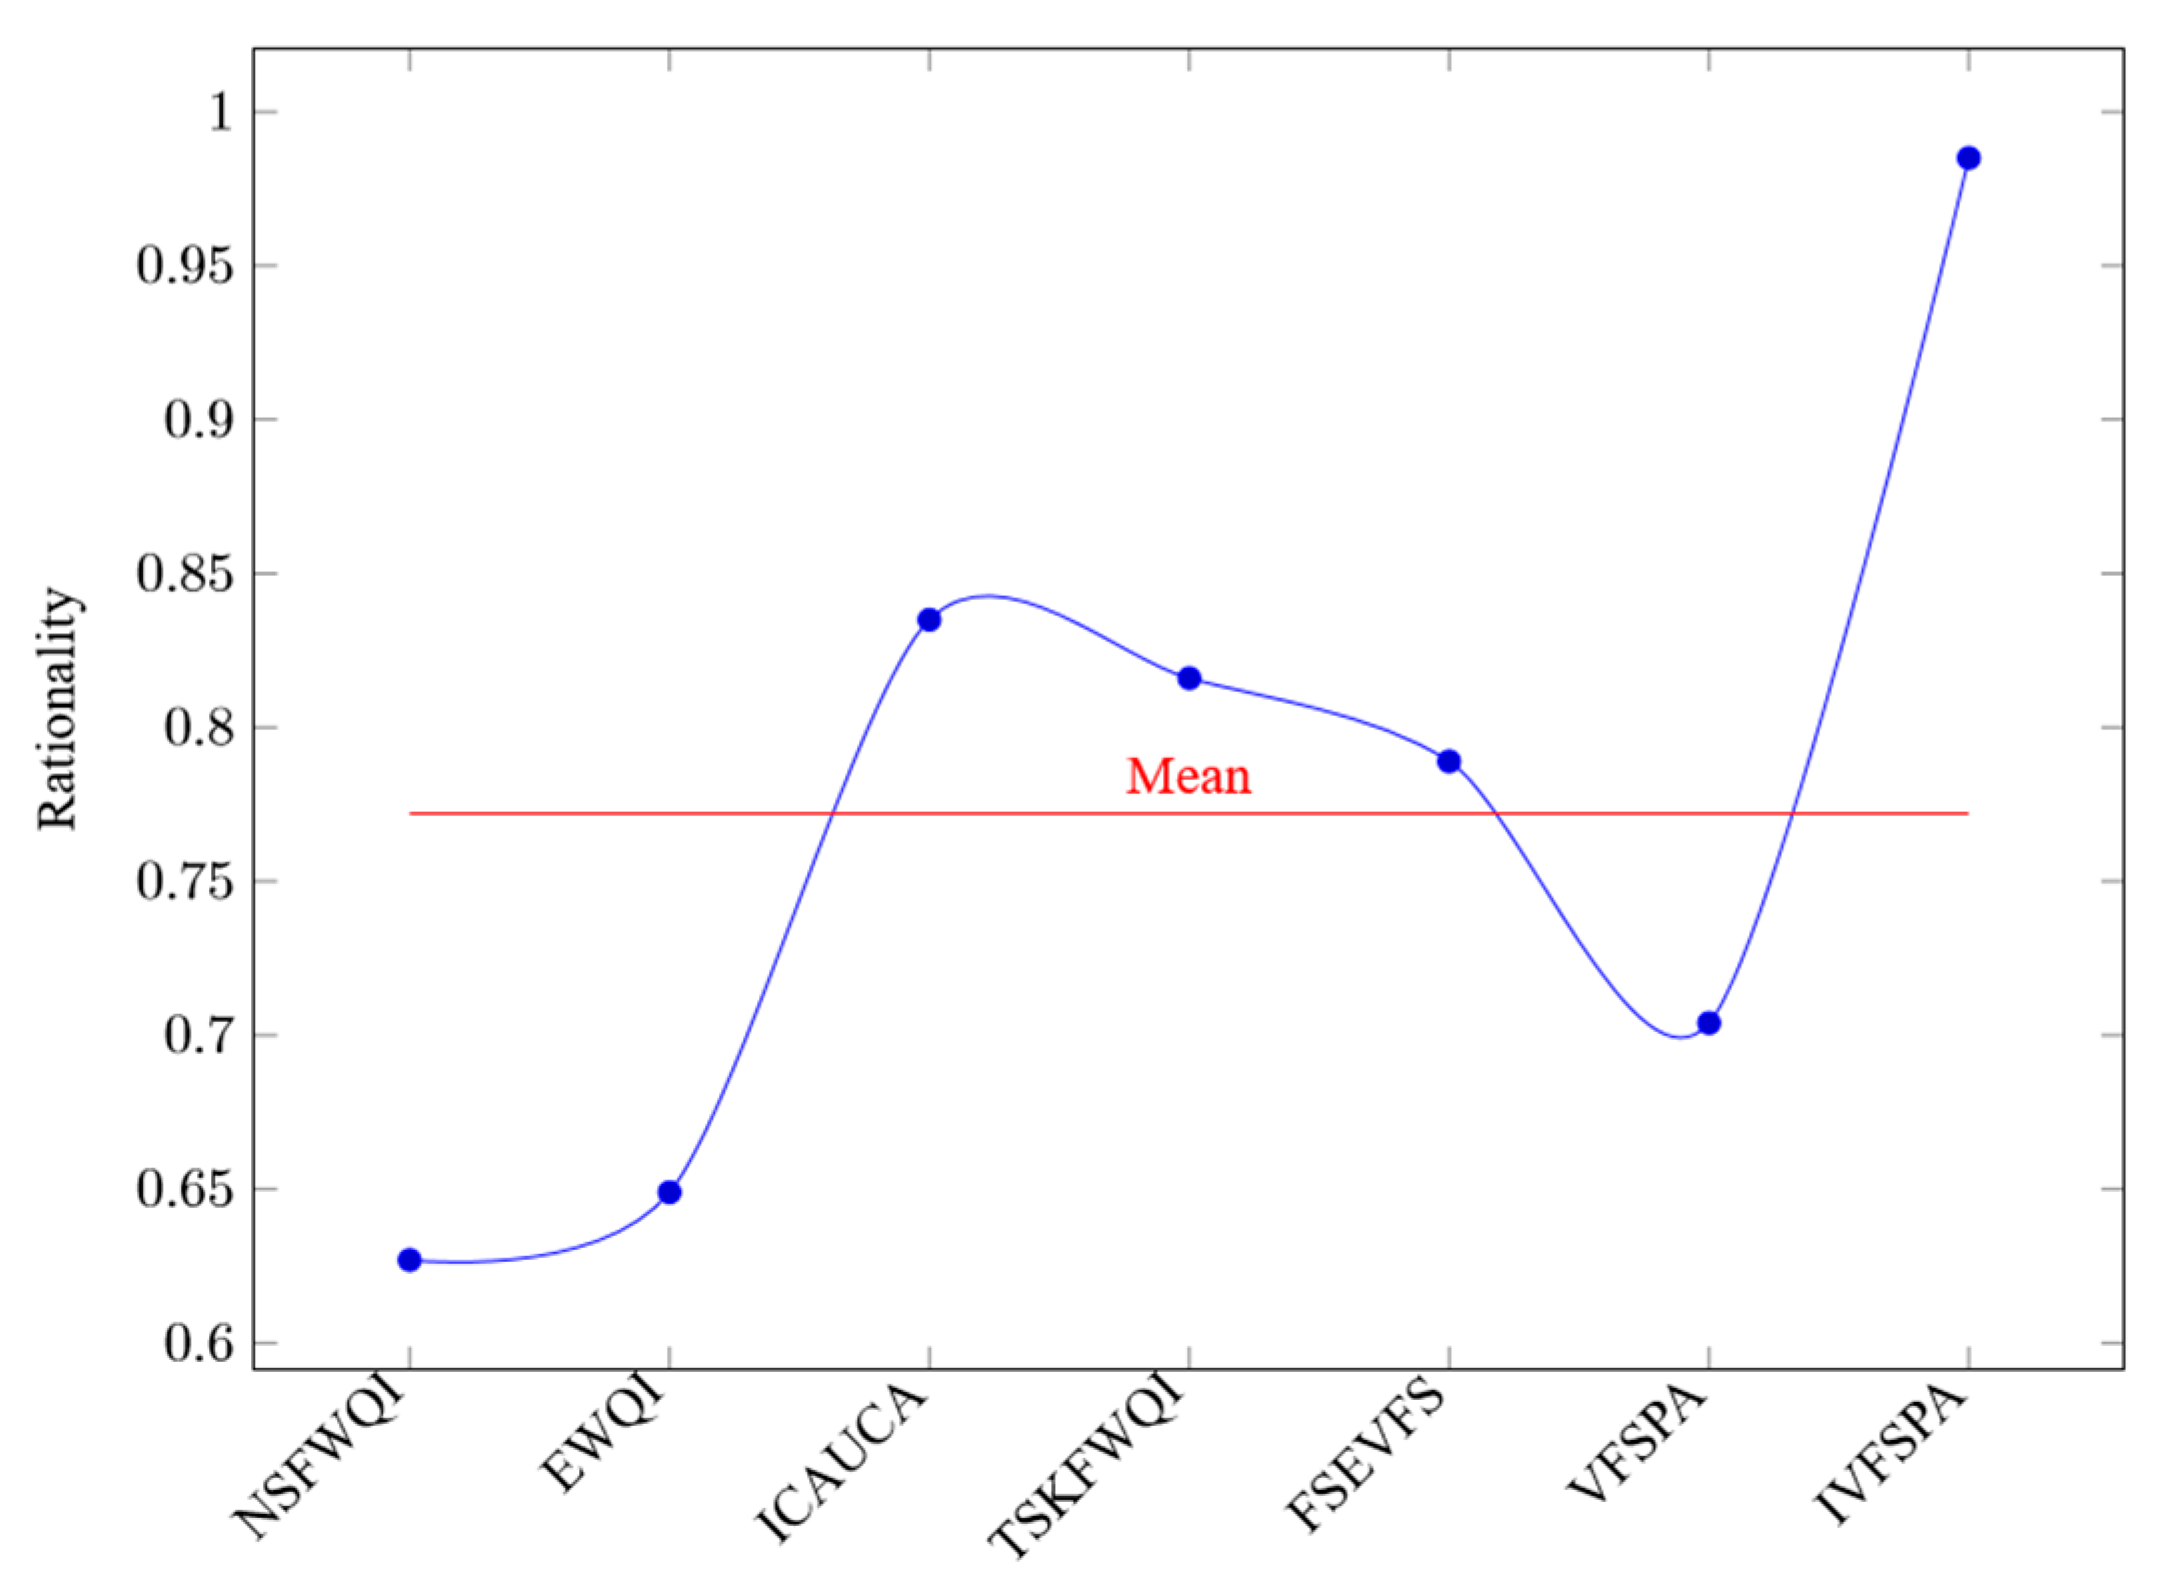
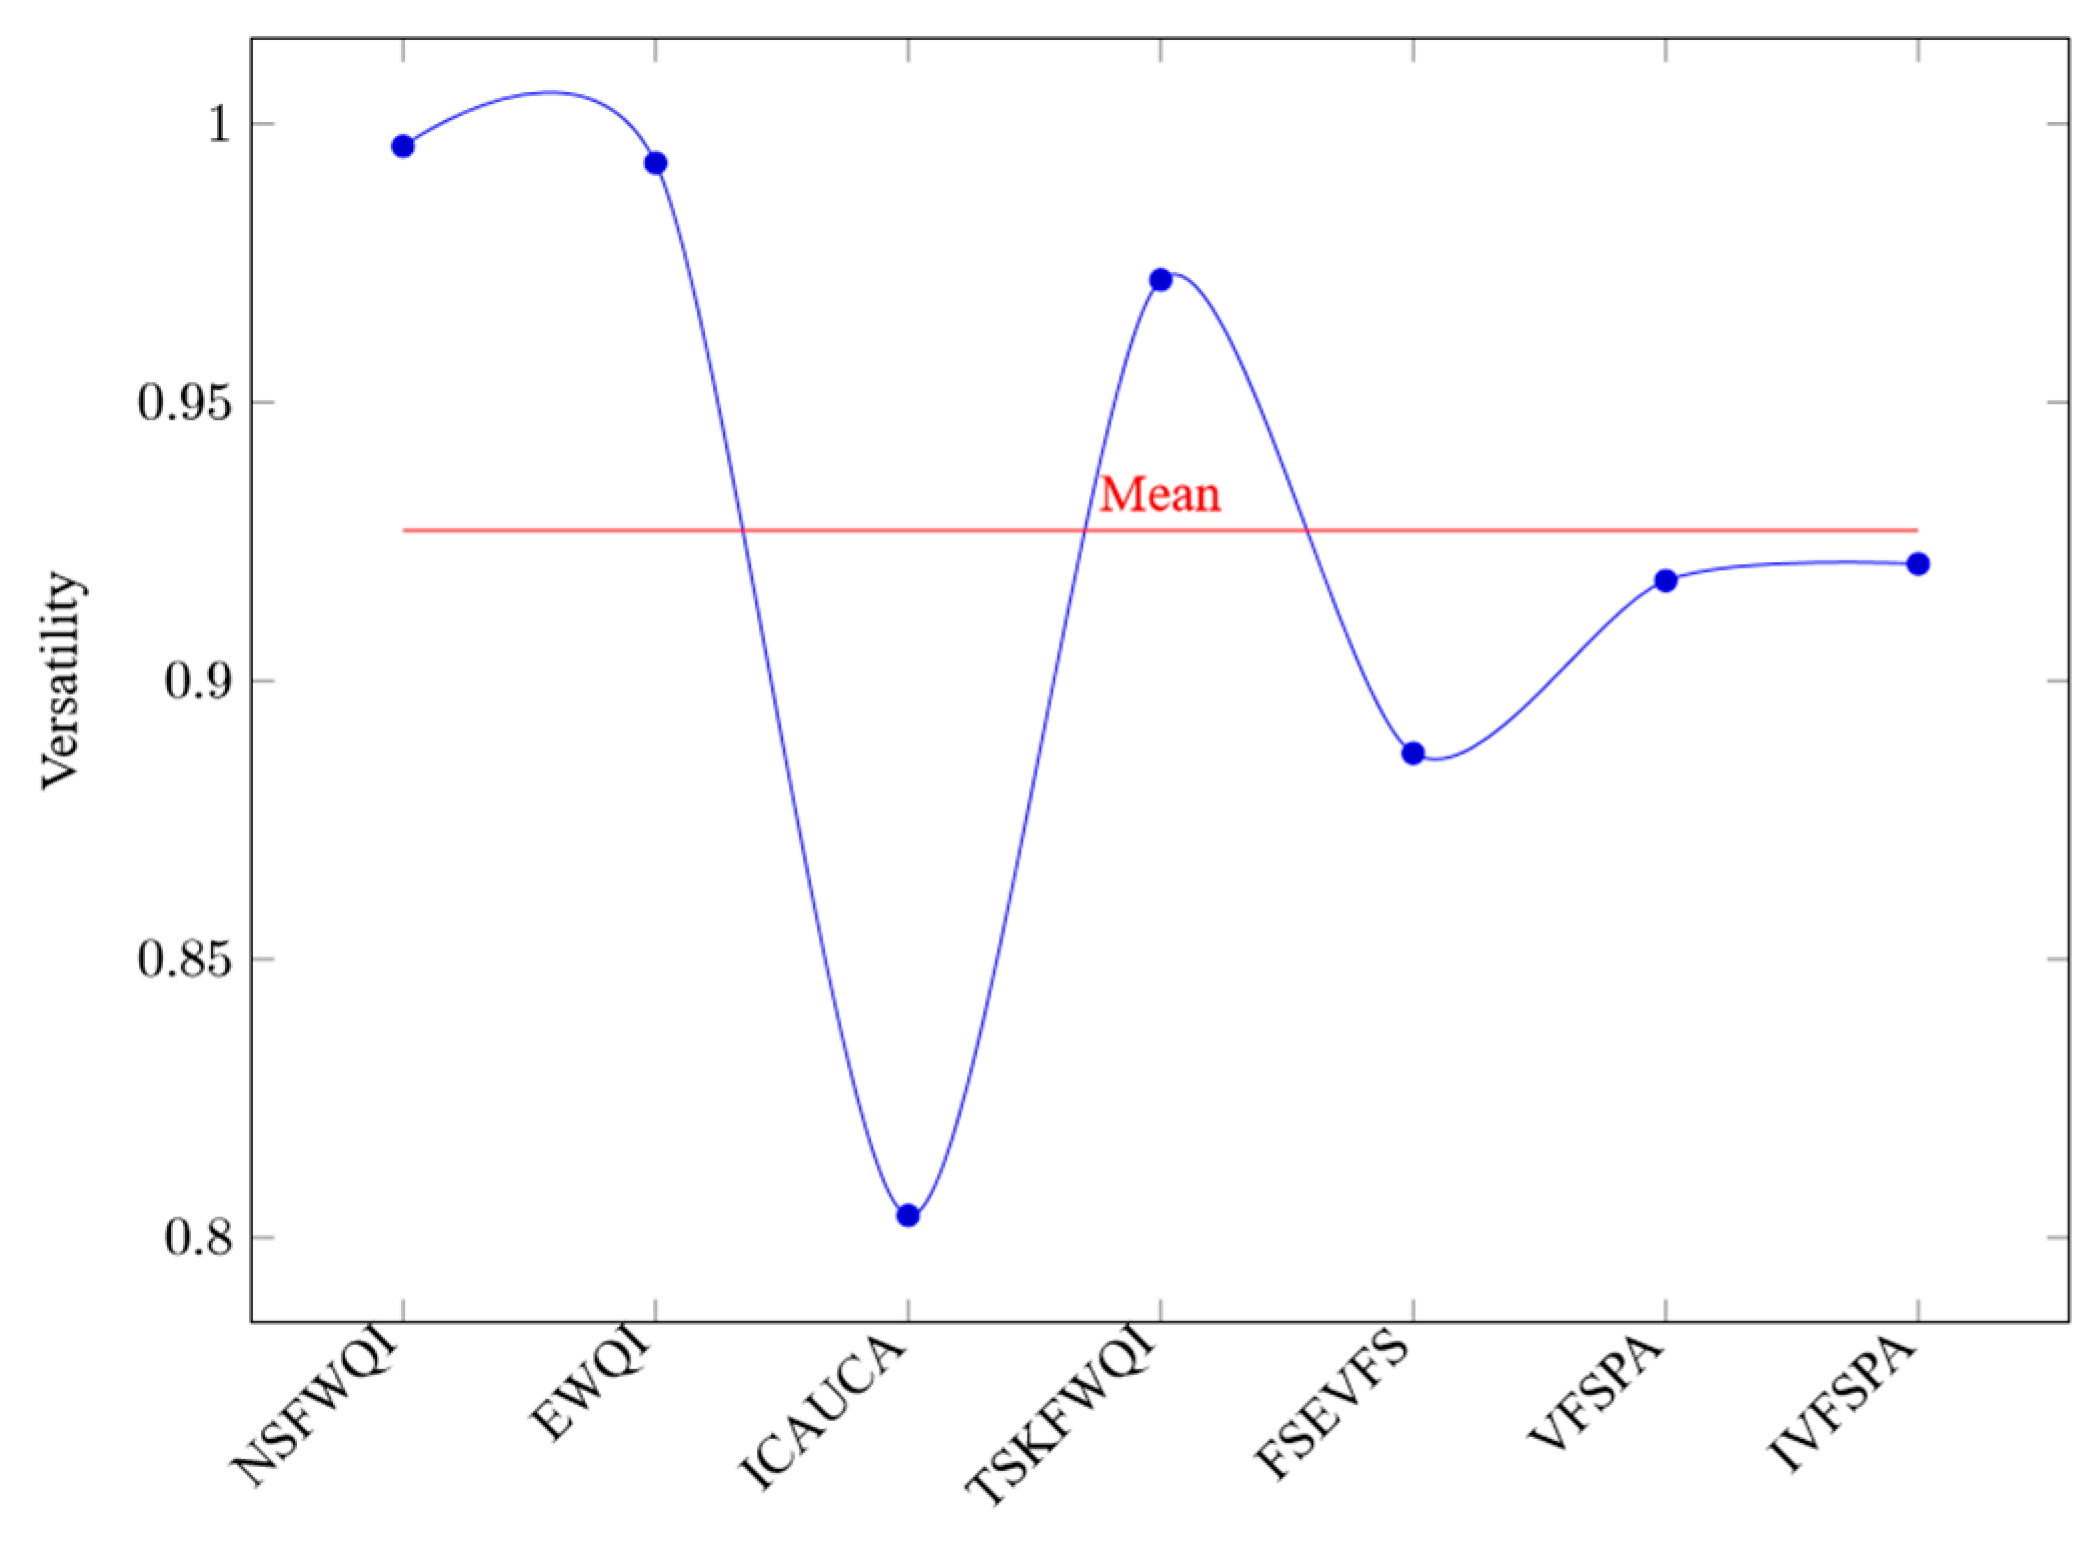
| Method | Precision | Robustness | Rationality | Versatility |
|---|---|---|---|---|
| NSFWQI | 0.819 | 0.756 | 0.627 | 0.996 |
| EWQI | 0.832 | 0.774 | 0.649 | 0.993 |
| ICAUCA | 0.889 | 0.659 | 0.835 | 0.804 |
| TSKFWQI | 0.95 | 0.761 | 0.816 | 0.972 |
| FSEVFS | 0.798 | 0.682 | 0.789 | 0.887 |
| VFSPA | 0.867 | 0.857 | 0.704 | 0.918 |
| IVFSPA | 0.995 | 0.973 | 0.985 | 0.921 |
| (a) | |||||||
|---|---|---|---|---|---|---|---|
| Approach | Qinhuai River/Qiwenqiao | Guanxi River/Qianjiadu | Chuhejp Section/Chenqian | Ch lh Section/Chuhe Gate | Yuhuai Section/Jiezhi Gate | Jiangn Section/Yang Bridge | Lish Section/Wusha Bridge |
| NSFWQI | 0.884 | 0.821 | 0.816 | 0.683 | 0.825 | 0.882 | 0.819 |
| EWQI | 0.897 | 0.885 | 0.897 | 0.532 | 0.873 | 0.894 | 0.863 |
| ICAUCA | 0.933 | 0.937 | 0.927 | 0.673 | 0.918 | 0.928 | 0.923 |
| TSKFWQI | 0.995 | 0.992 | 0.918 | 0.865 | 0.937 | 0.967 | 0.978 |
| FSEVFS | 0.821 | 0.812 | 0.816 | 0.655 | 0.822 | 0.808 | 0.833 |
| VFSPA | 0.895 | 0.891 | 0.884 | 0.817 | 0.846 | 0.876 | 0.887 |
| IVFSPA | 0.997 | 1 | 0.995 | 0.998 | 0,989 | 0.991 | 0.993 |
| (b) | |||||||
|---|---|---|---|---|---|---|---|
| Approach | Jurong River/Tu Bridge | Chang Jiang/Nanking Bridge | Lishui River/Kaitai Bridge | Shize River/Tian Bridge | Chang jiang/Jiangn Estuary | Chang jiang/Jiuxiang Estuary | Meishan Section/Shore Zone |
| NSFWQI | 0.853 | 0.848 | 0.706 | 0.827 | 0.835 | 0.807 | 0.856 |
| EWQI | 0.867 | 0.883 | 0.517 | 0.902 | 0.879 | 0.885 | 0.877 |
| ICAUCA | 0.931 | 0.93 | 0.639 | 0.935 | 0.912 | 0.924 | 0.939 |
| TSKFWQI | 0.982 | 0.977 | 0.825 | 0.948 | 0.956 | 0.972 | 0.989 |
| FSEVFS | 0.813 | 0.836 | 0.634 | 0.826 | 0.827 | 0.838 | 0.834 |
| VFSPA | 0.879 | 0.893 | 0.804 | 0.829 | 0.867 | 0.901 | 0.862 |
| IVFSPA | 1 | 1 | 0.997 | 0.994 | 0.988 | 0.992 | 0.995 |
© 2019 by the authors. Licensee MDPI, Basel, Switzerland. This article is an open access article distributed under the terms and conditions of the Creative Commons Attribution (CC BY) license (http://creativecommons.org/licenses/by/4.0/).
Share and Cite
Liu, Y.; Wang, C.; Chun, Y.; Yang, L.; Chen, W.; Ding, J. A Novel Method in Surface Water Quality Assessment Based on Improved Variable Fuzzy Set Pair Analysis. Int. J. Environ. Res. Public Health 2019, 16, 4314. https://doi.org/10.3390/ijerph16224314
Liu Y, Wang C, Chun Y, Yang L, Chen W, Ding J. A Novel Method in Surface Water Quality Assessment Based on Improved Variable Fuzzy Set Pair Analysis. International Journal of Environmental Research and Public Health. 2019; 16(22):4314. https://doi.org/10.3390/ijerph16224314
Chicago/Turabian StyleLiu, Yucheng, Chuansheng Wang, Yutong Chun, Luxin Yang, Wei Chen, and Jack Ding. 2019. "A Novel Method in Surface Water Quality Assessment Based on Improved Variable Fuzzy Set Pair Analysis" International Journal of Environmental Research and Public Health 16, no. 22: 4314. https://doi.org/10.3390/ijerph16224314
APA StyleLiu, Y., Wang, C., Chun, Y., Yang, L., Chen, W., & Ding, J. (2019). A Novel Method in Surface Water Quality Assessment Based on Improved Variable Fuzzy Set Pair Analysis. International Journal of Environmental Research and Public Health, 16(22), 4314. https://doi.org/10.3390/ijerph16224314