Heavy Metals in Sediment from the Urban and Rural Rivers in Harbin City, Northeast China

 ,
, 


Abstract
:1. Introduction
2. Materials and Methods
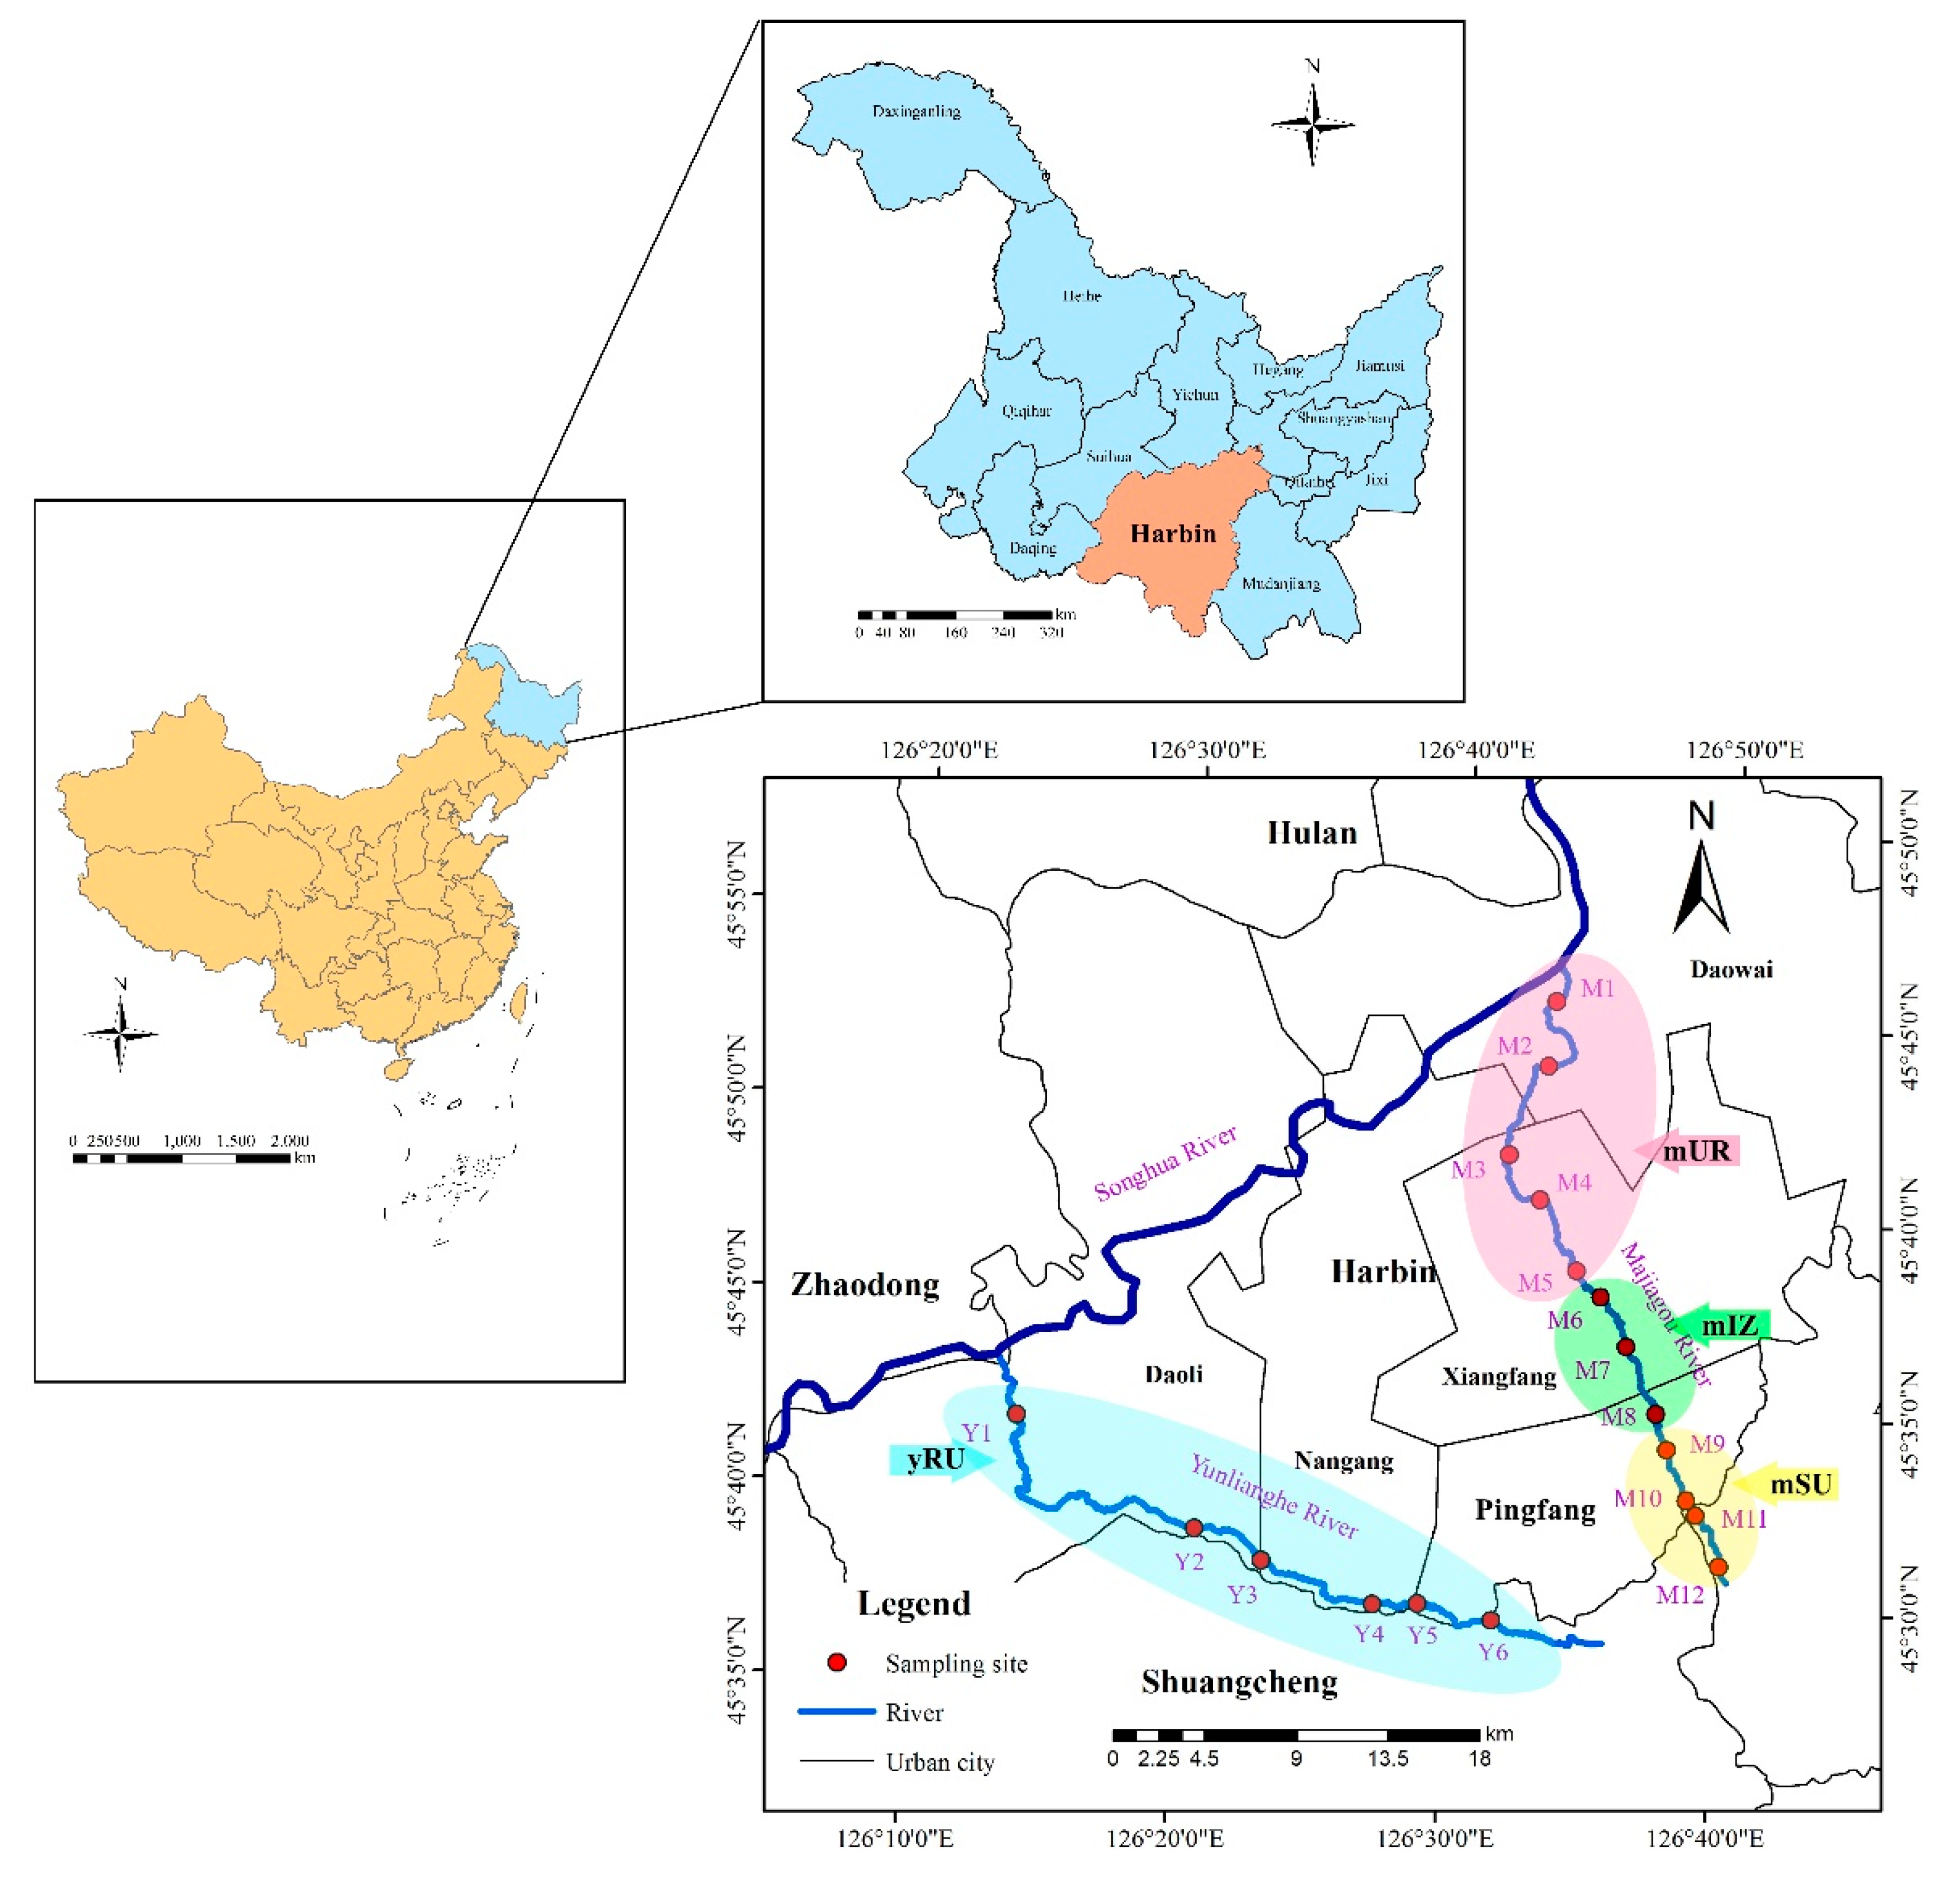
2.1. Study Area
2.2. Sample Collection
2.3. Sample Processing and Analysis
2.4. Quality Assurance/Quality Control
2.5. Pollution Assessment Methods
2.5.1. Single Factor Pollution Index and Improved Nemerow Pollution Index
2.5.2. Potential Ecological Risk Index
2.5.3. Statistical Analysis
3. Results
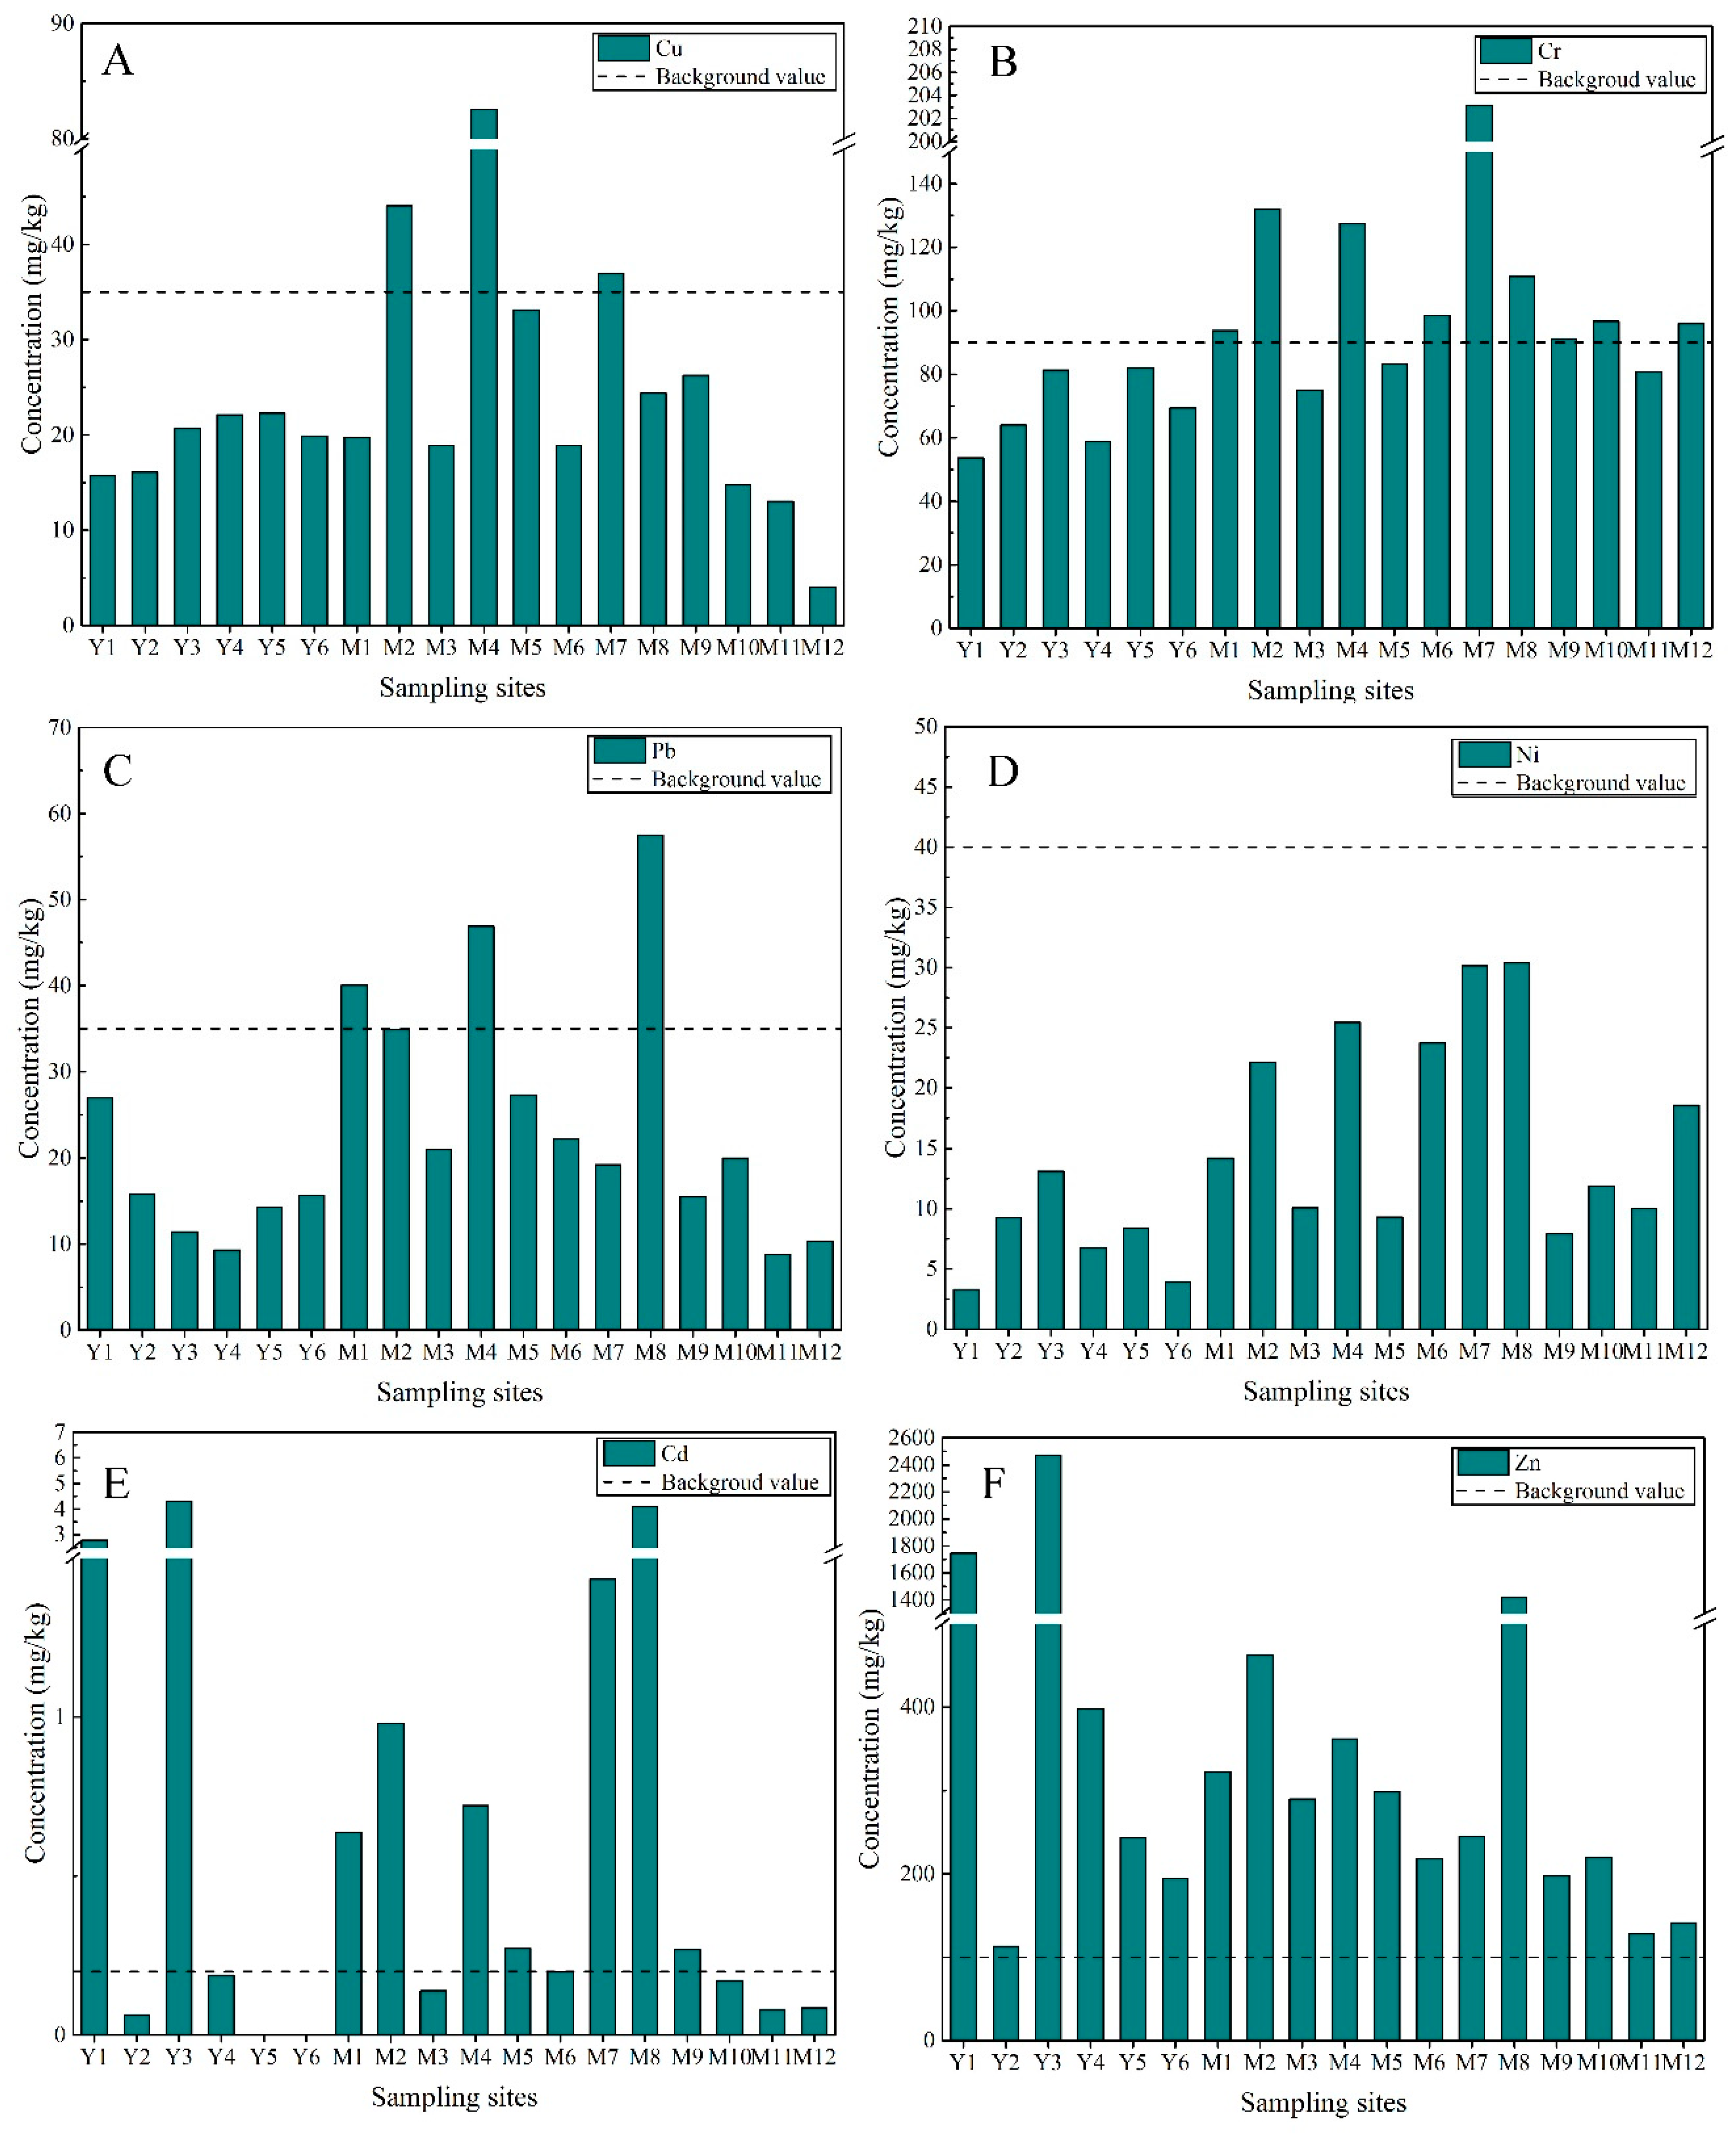
3.1. Concentrations
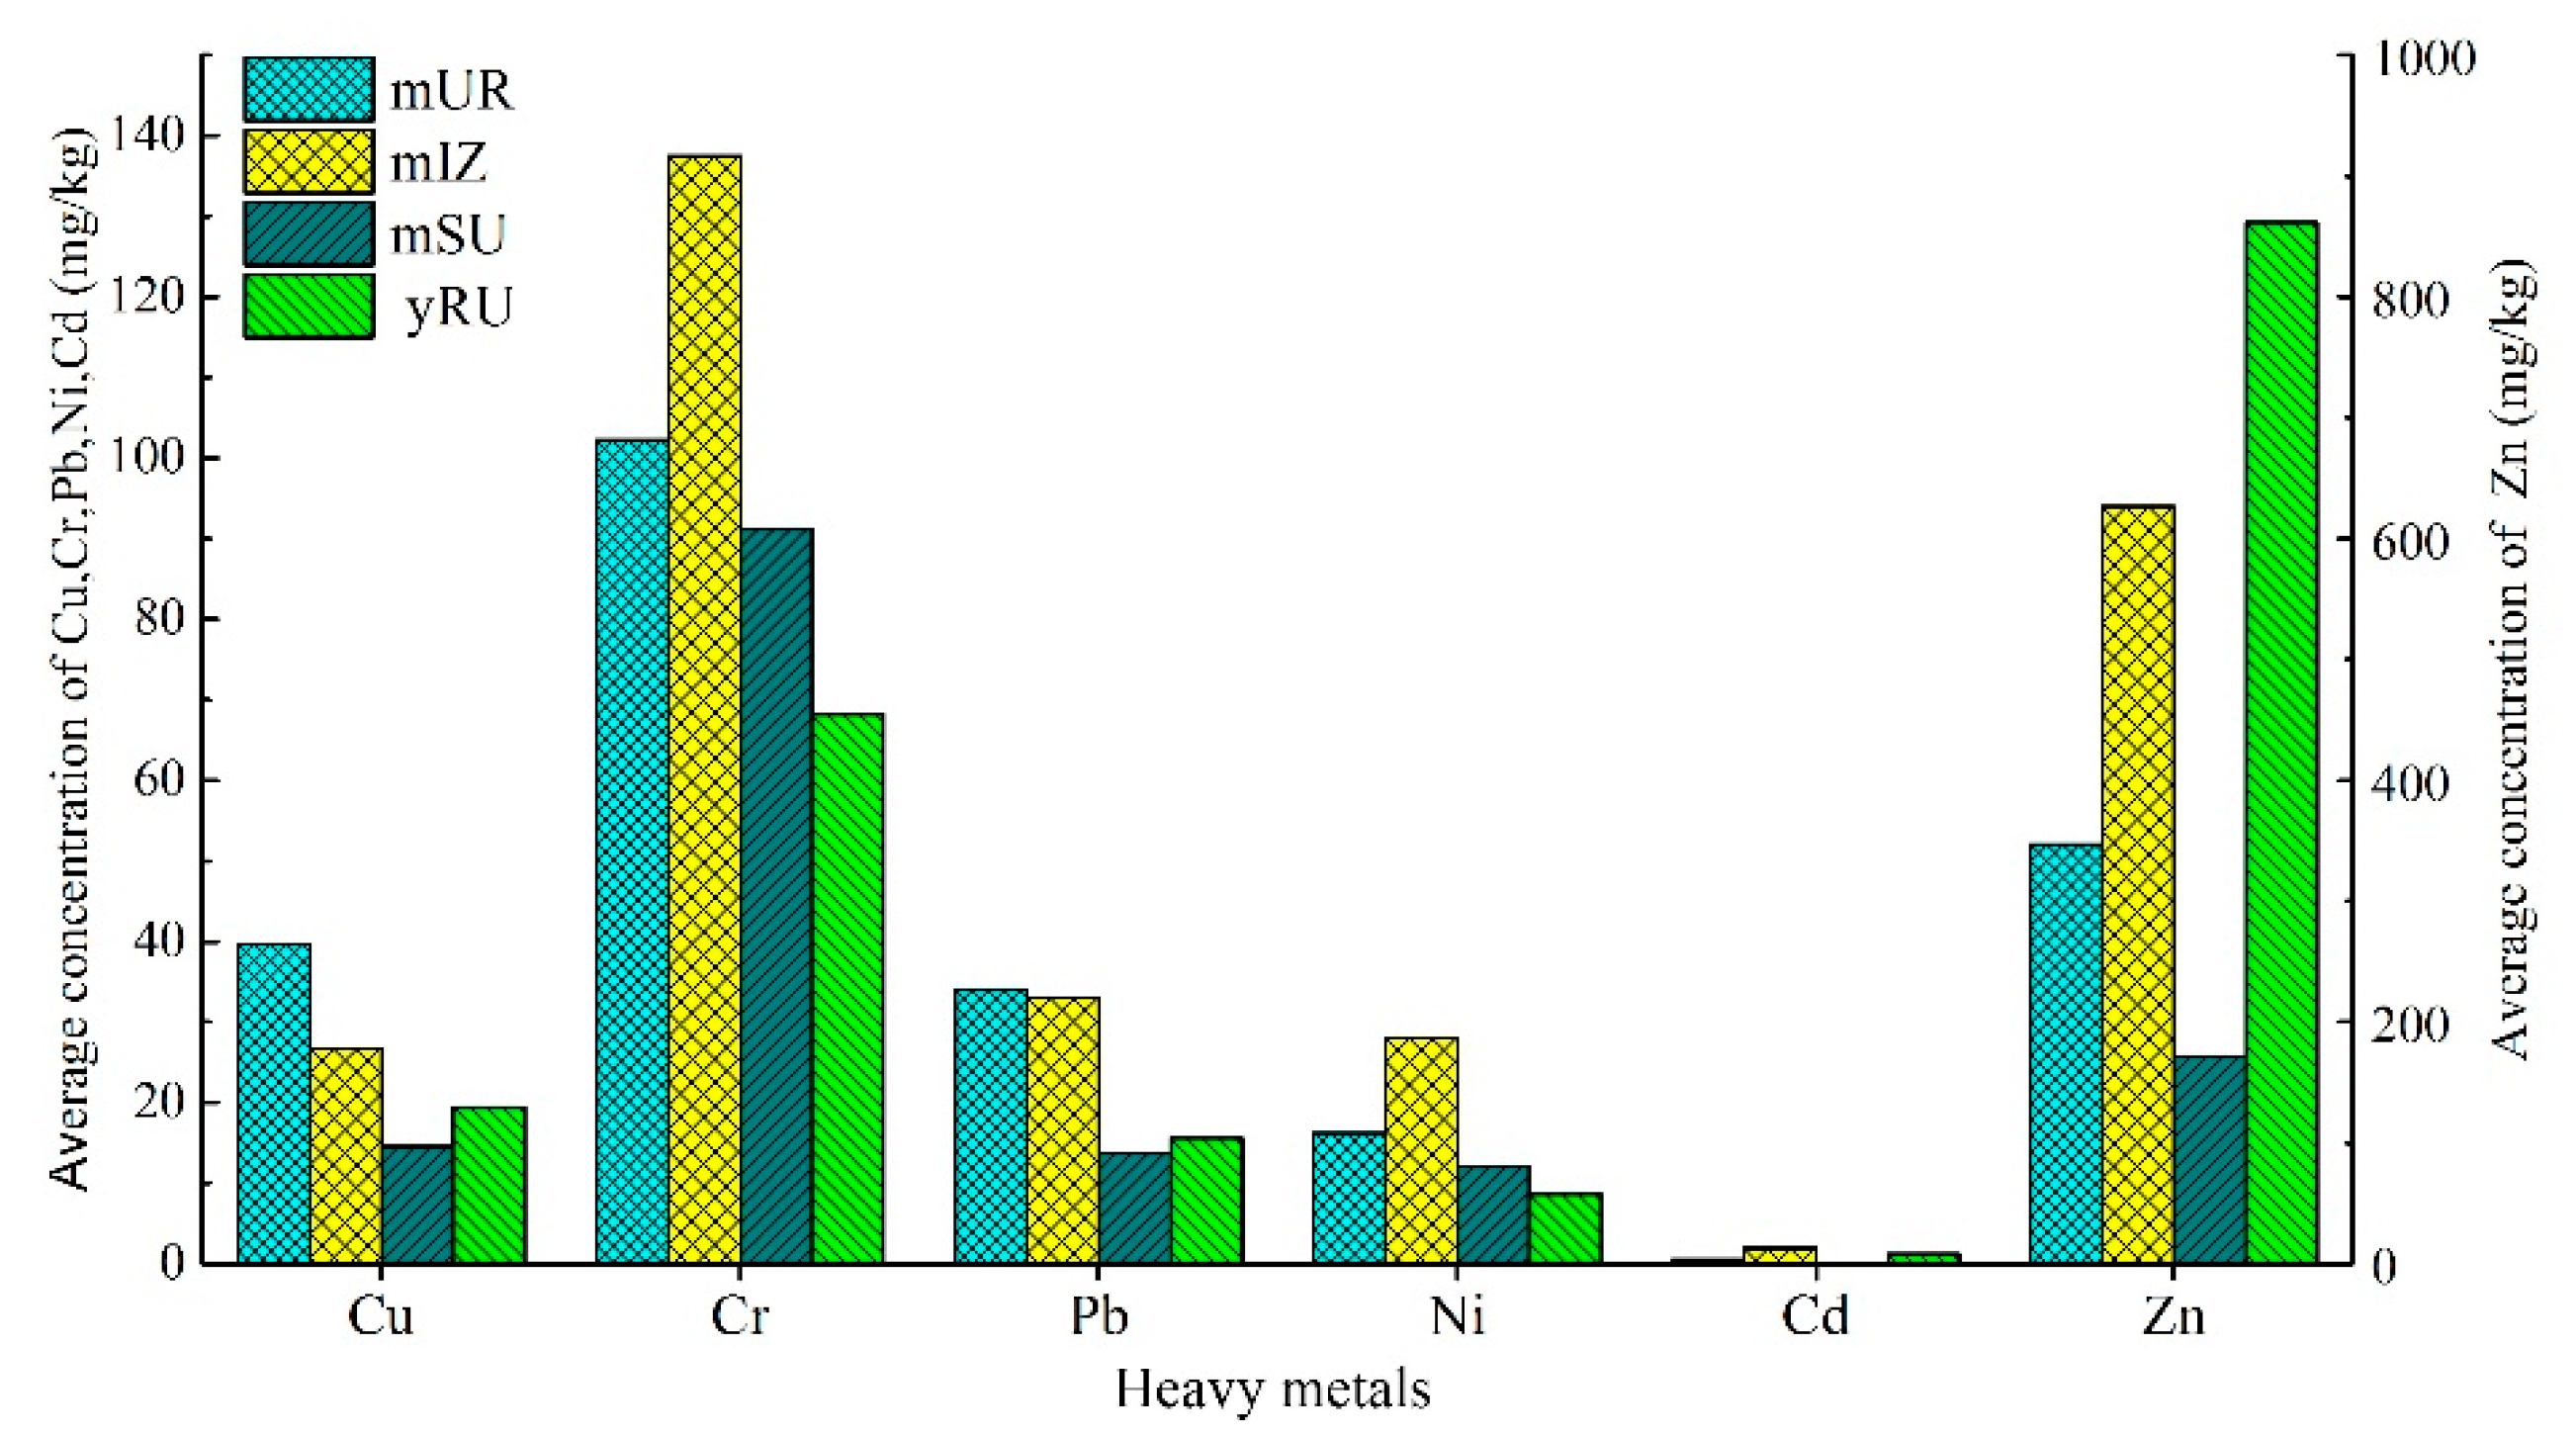
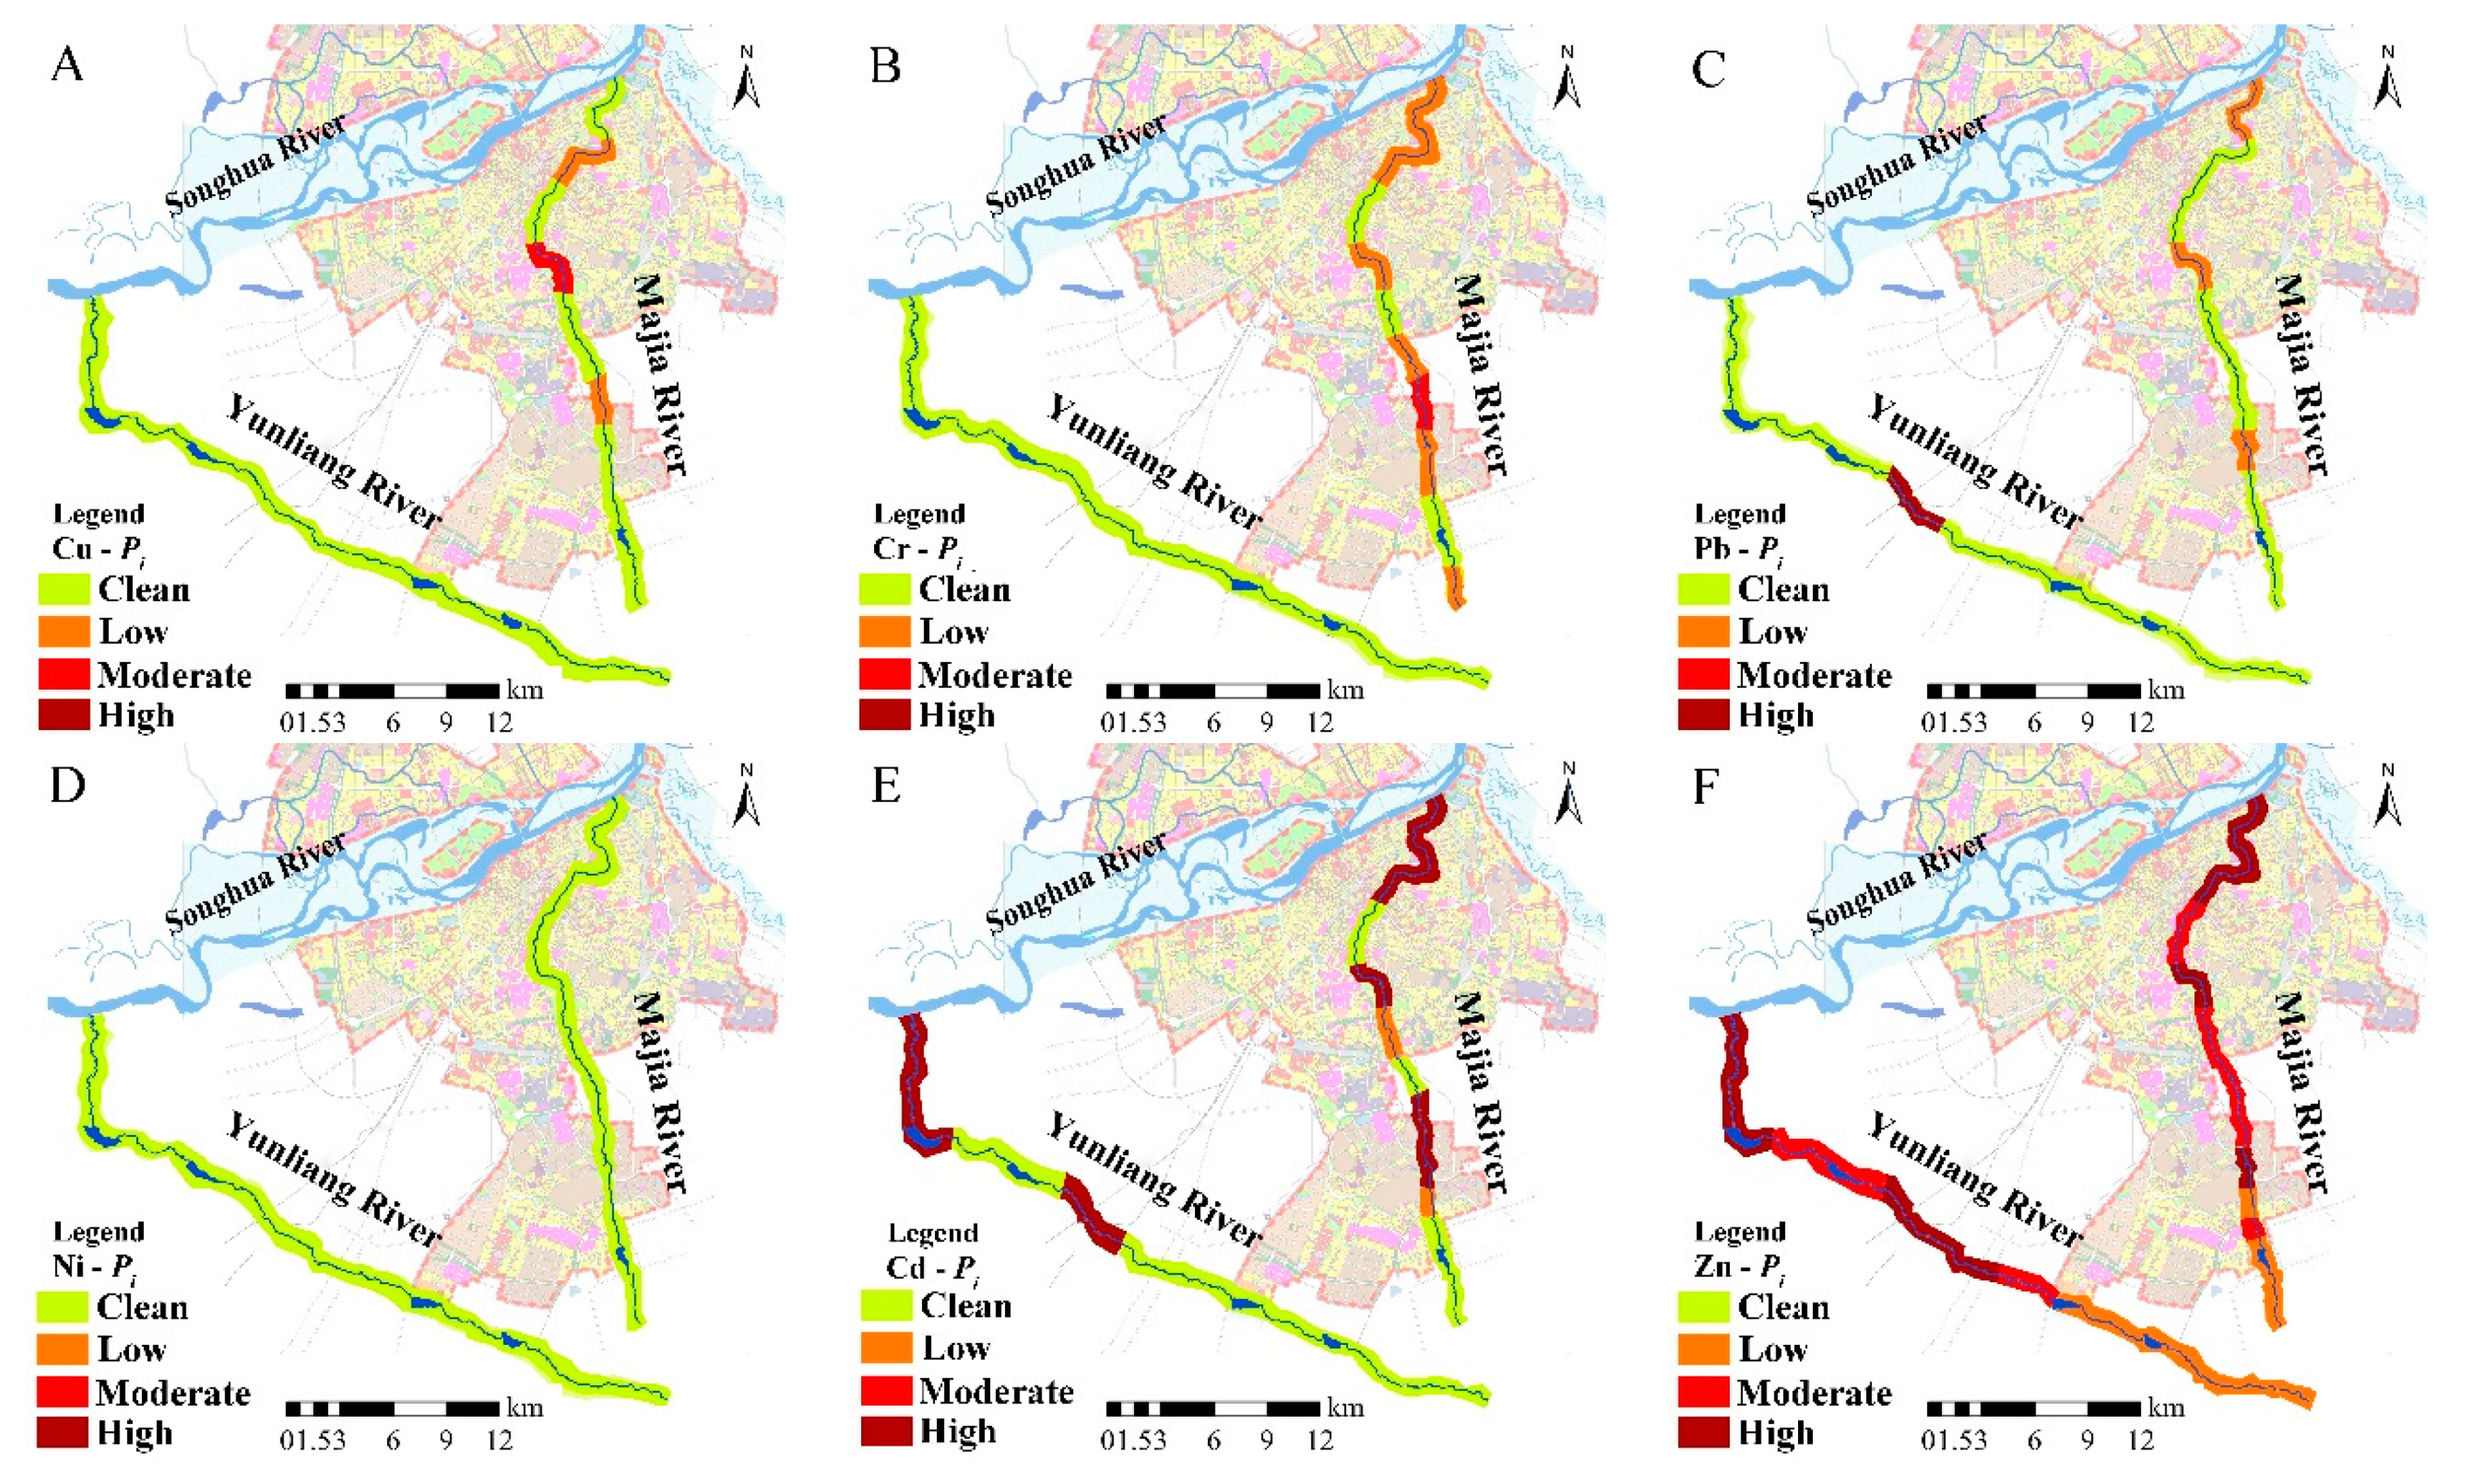
3.2. Spatial Distribution
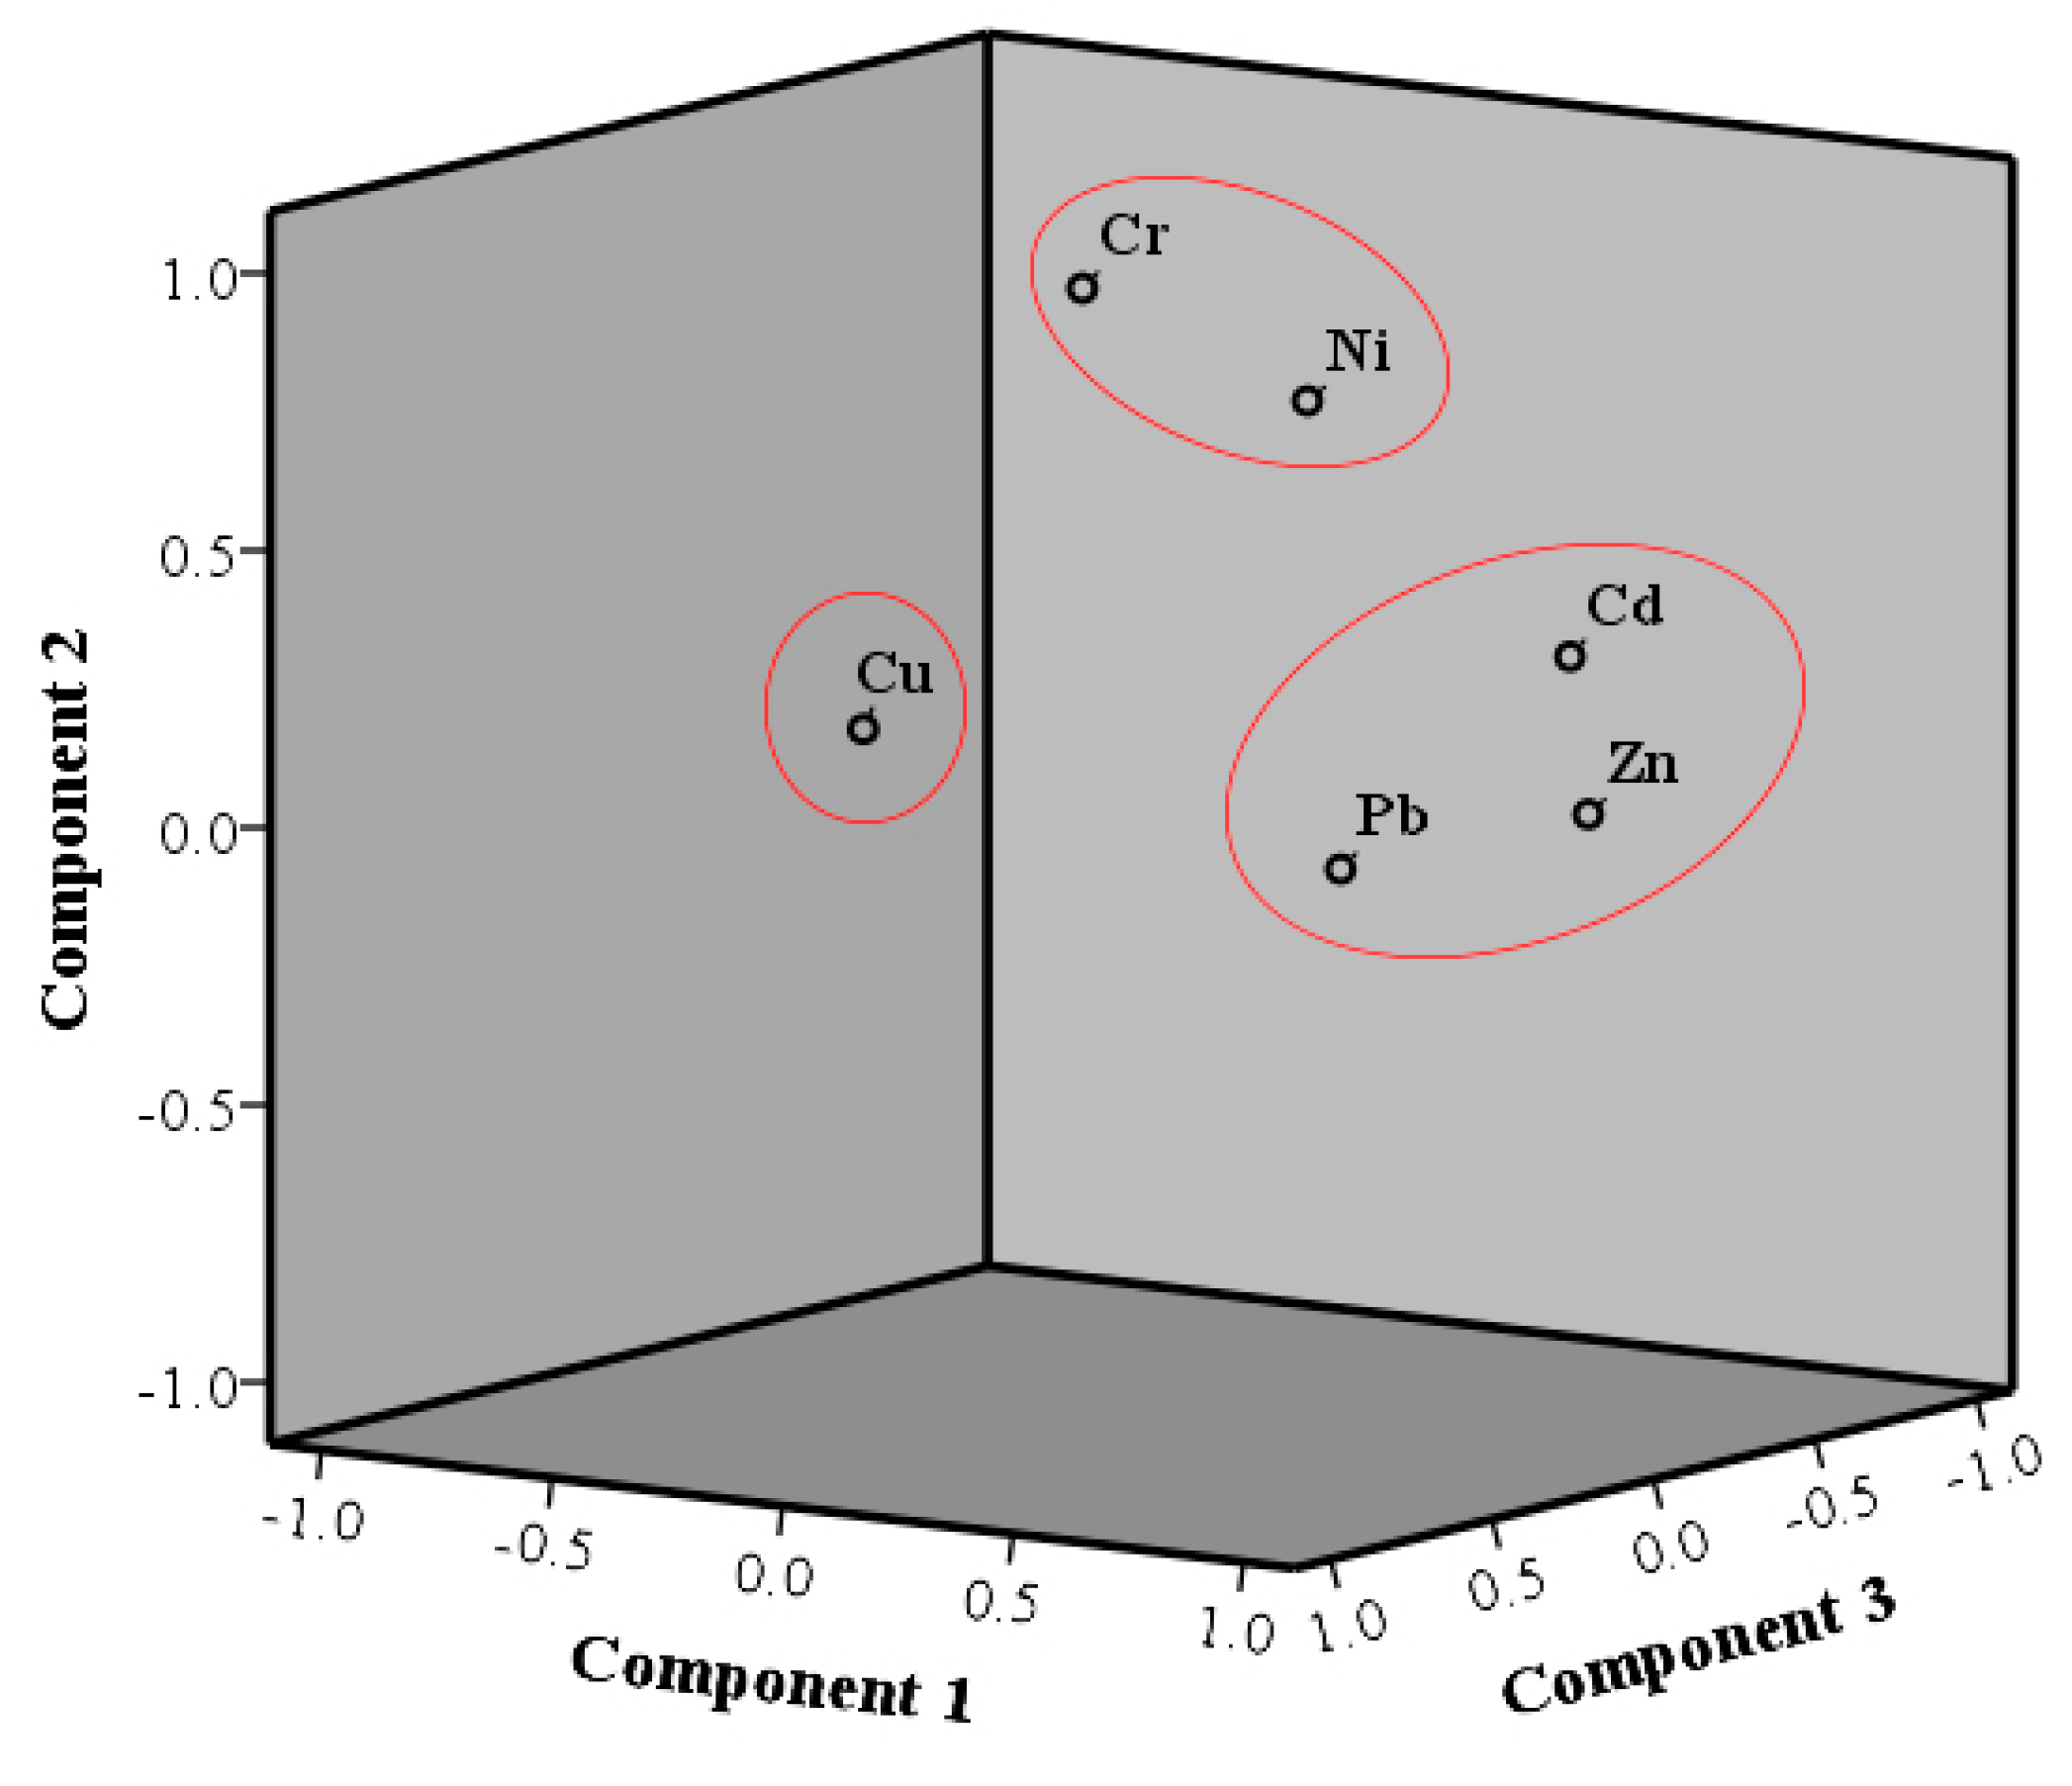
3.3. Possible sources
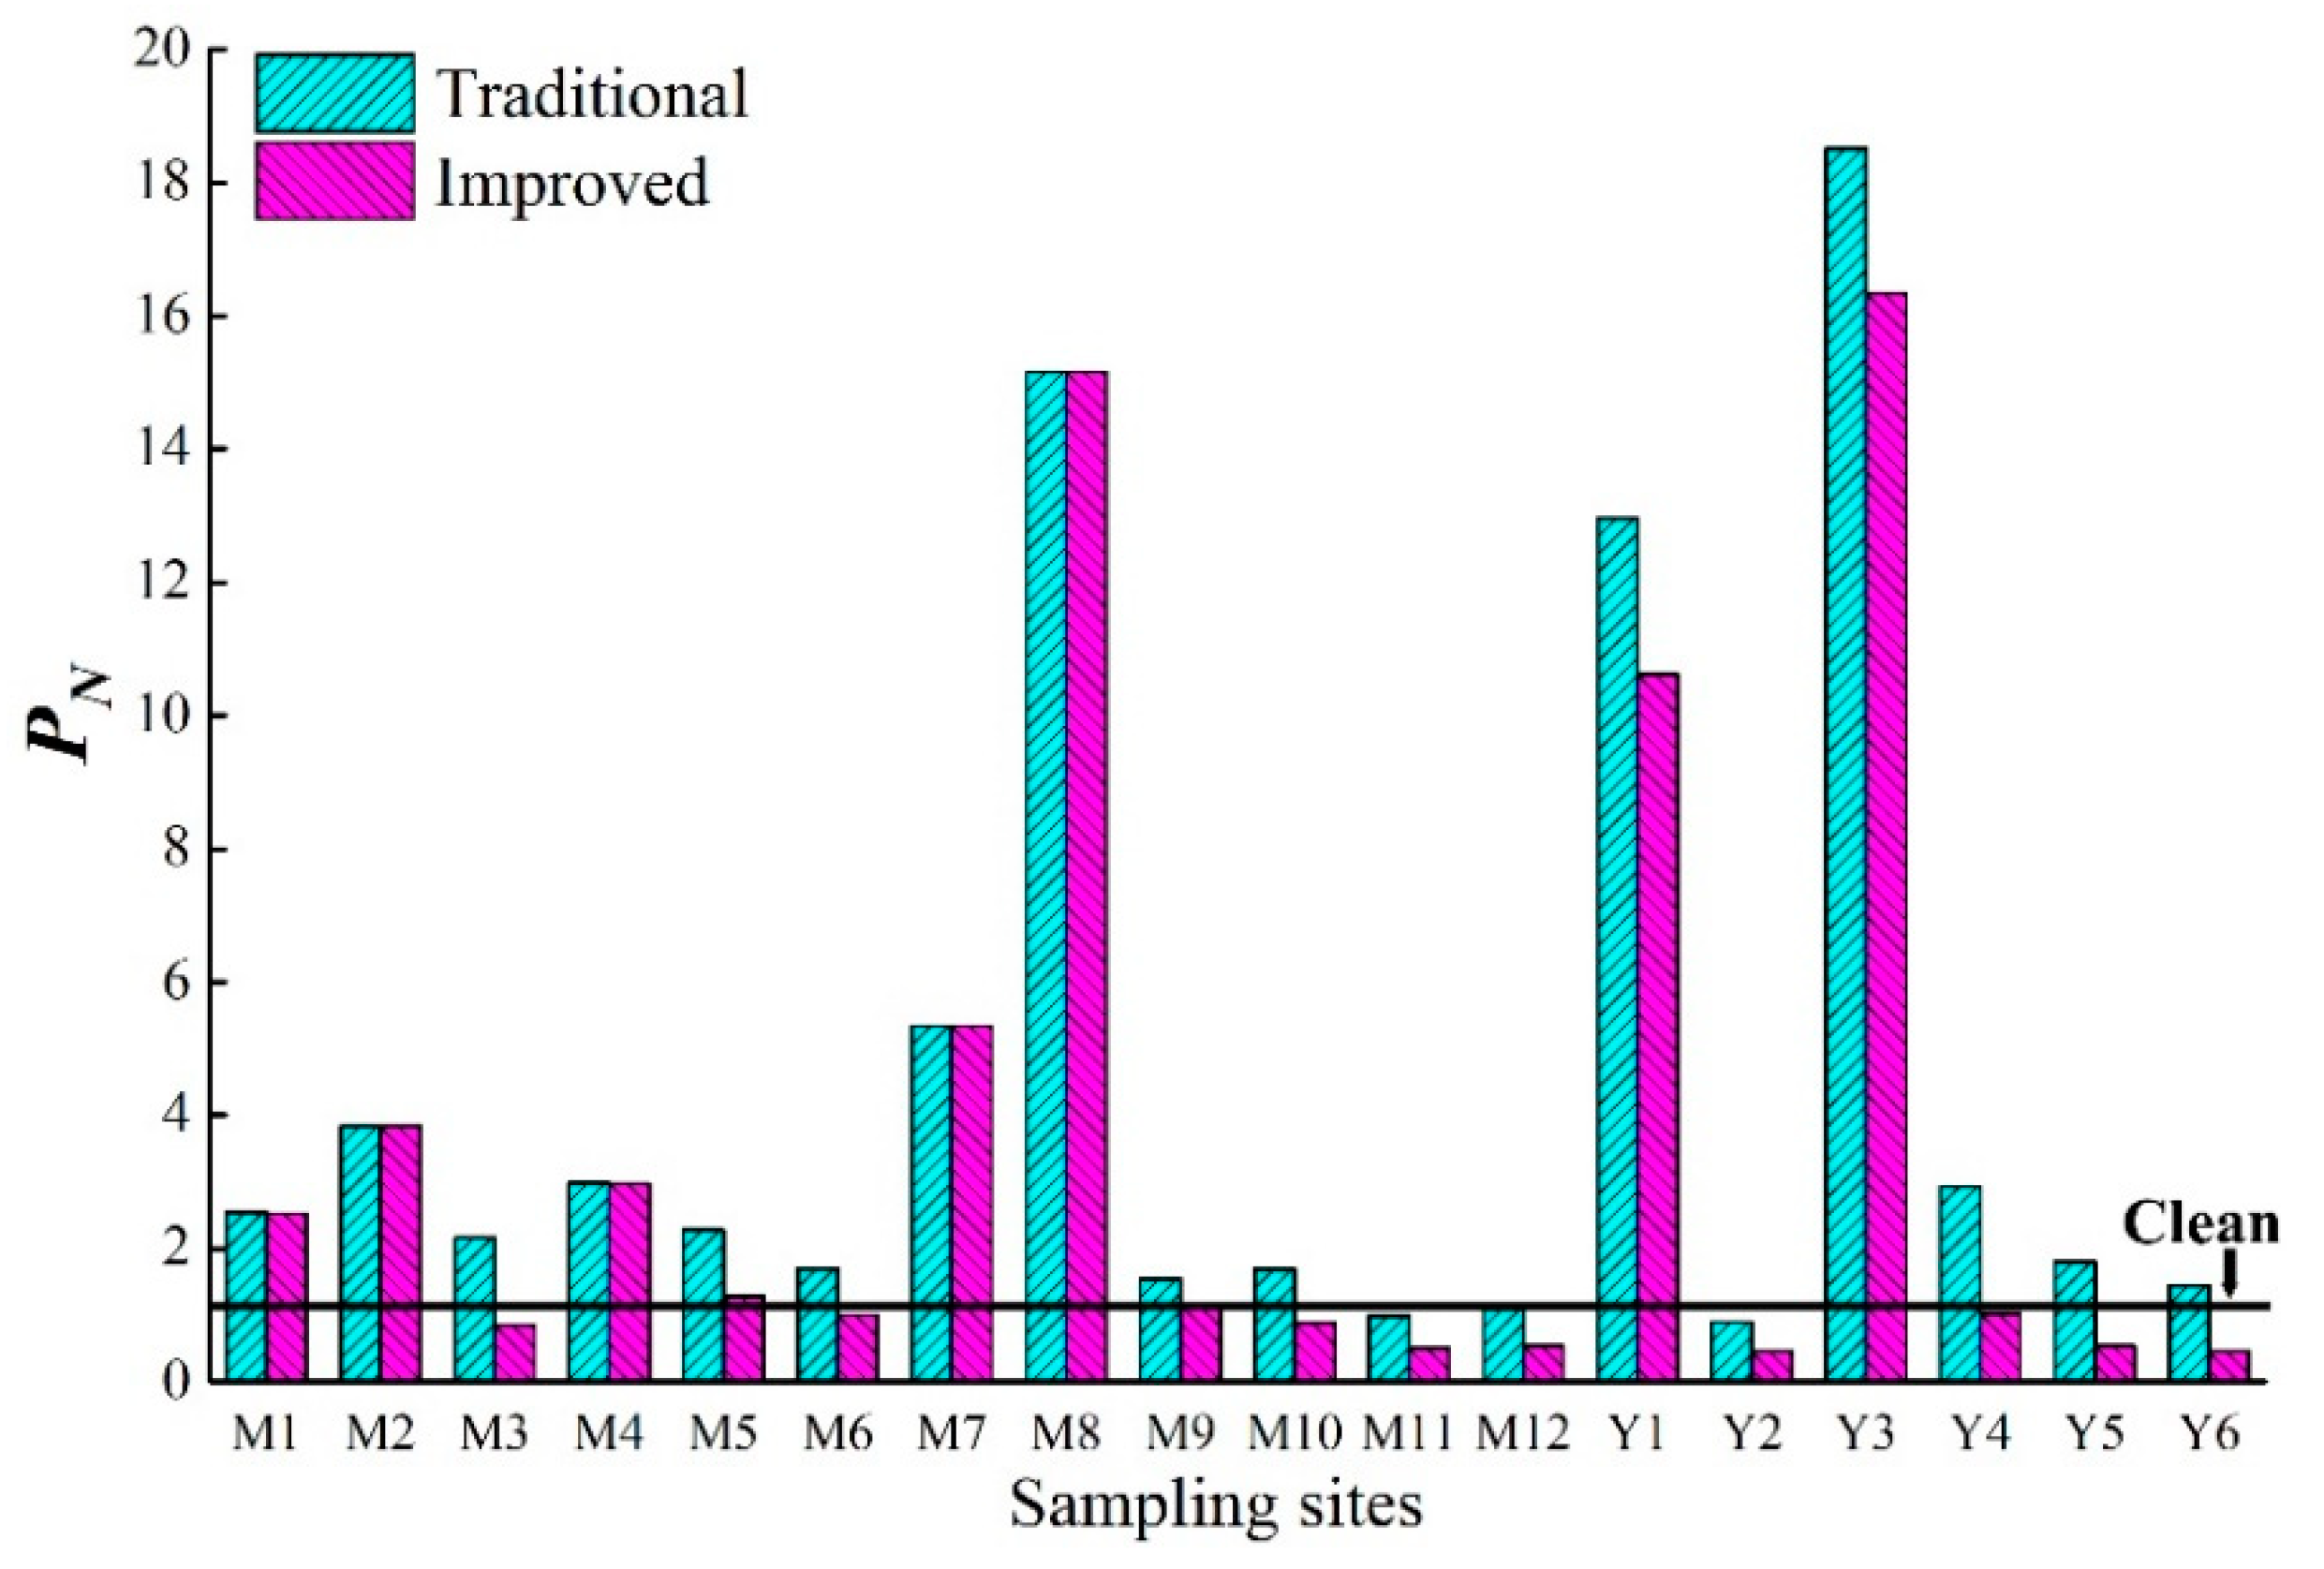
3.4. Pollution Degree Assessment
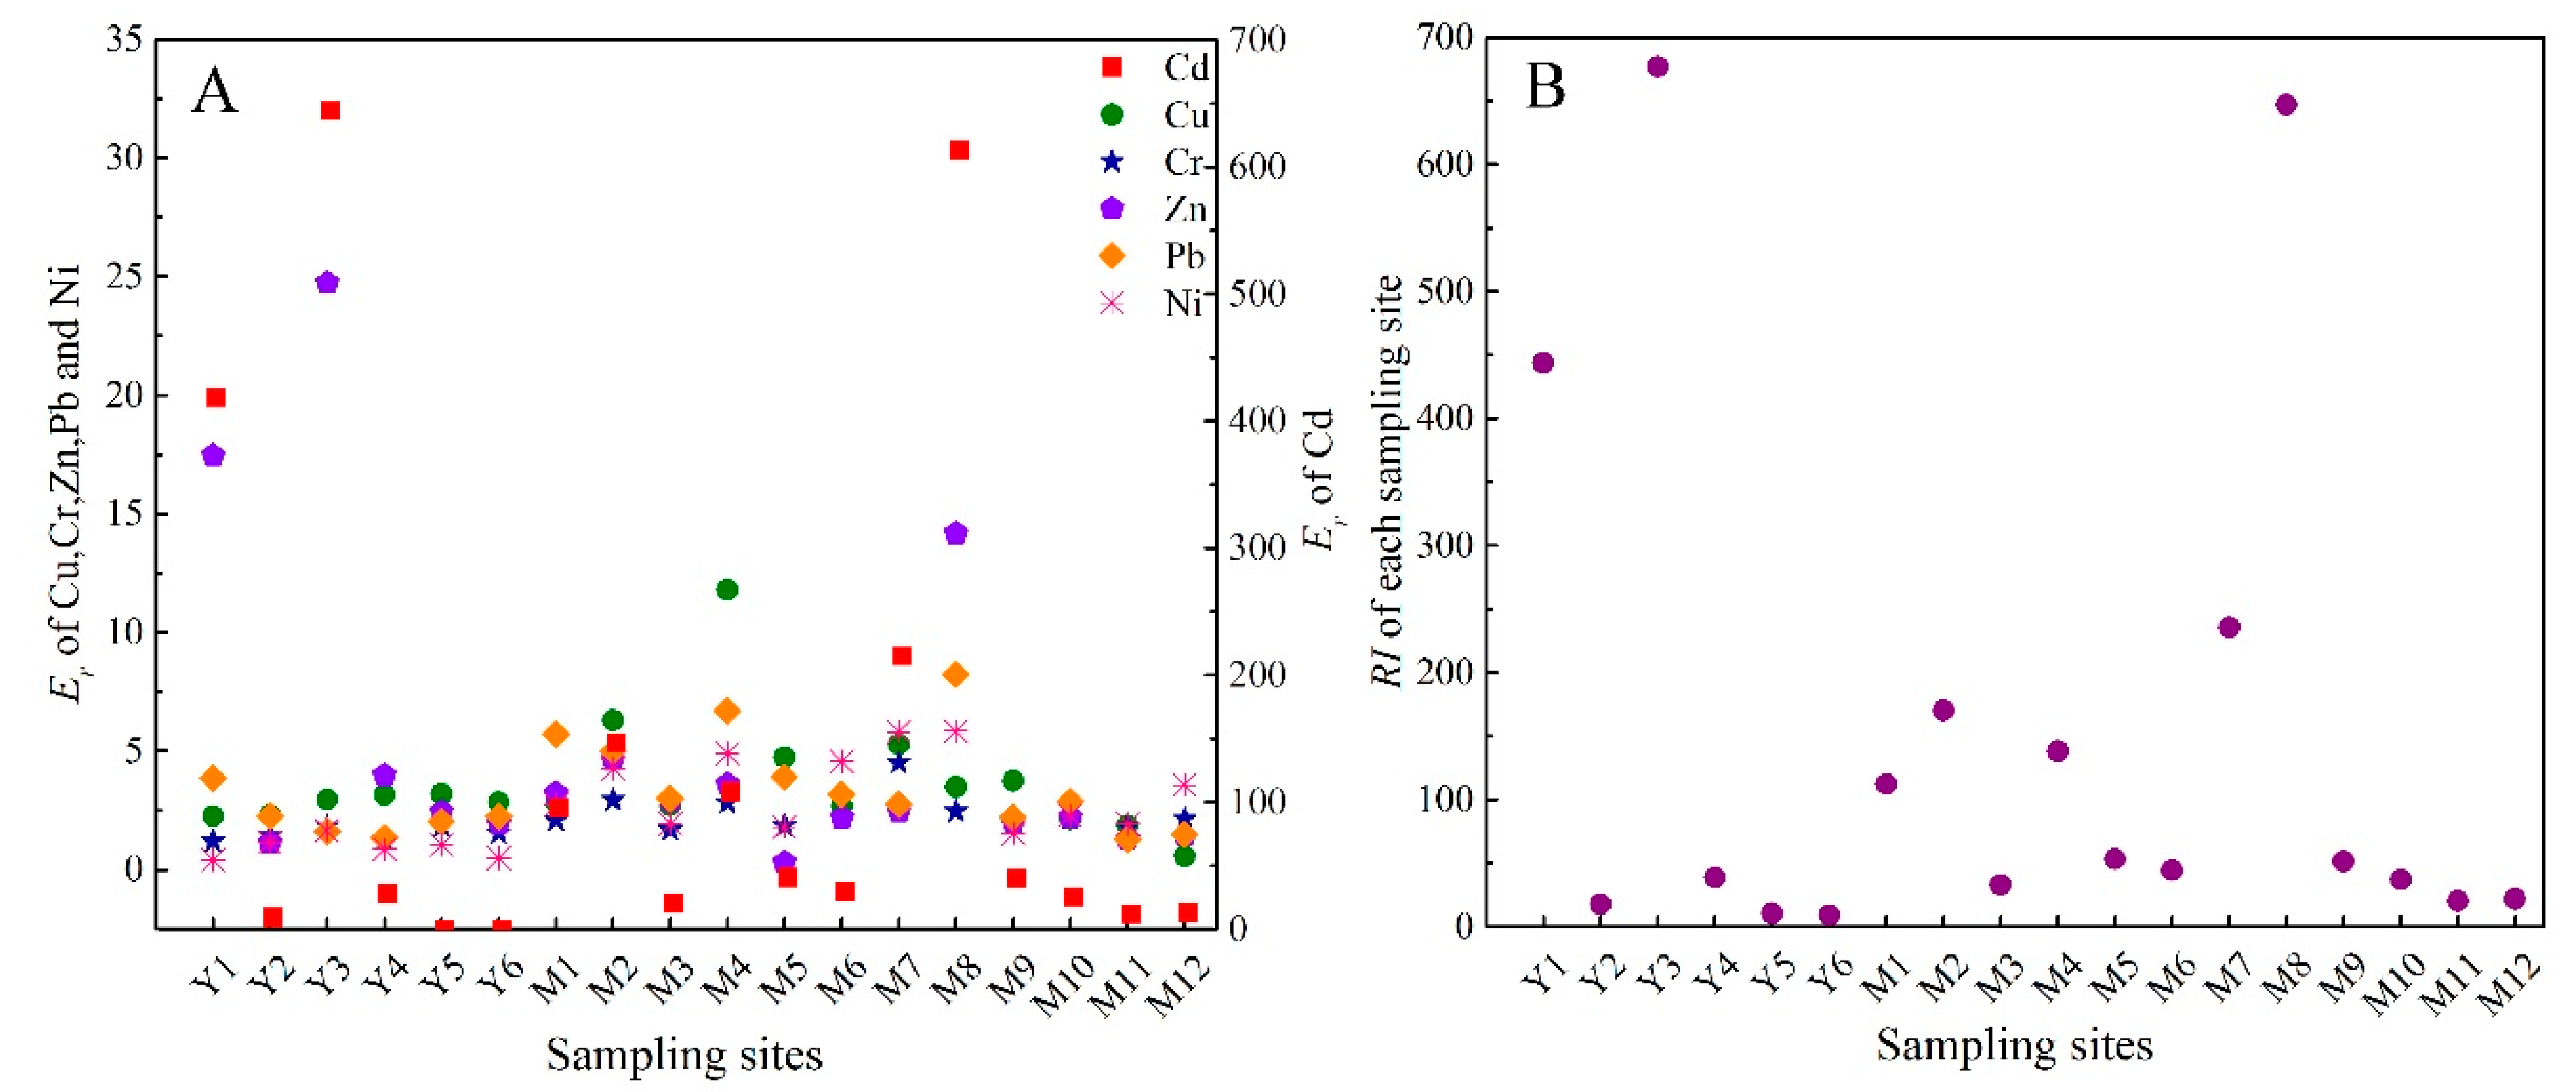
3.5. Potential Ecological Risk Assessment
4. Discussion
5. Conclusions
Supplementary Materials
Author Contributions
Funding
Conflicts of Interest
References
- Bryan, G.W.; Langston, W.J. Bioavailability, accumulation and effects of heavy metals in sediments with special reference to United Kingdom estuaries: A review. Environ. Pollut. 1992, 76, 89–131. [Google Scholar] [CrossRef]
- Birch, G.F.; Apostolatos, C. Use of sedimentary metals to predict metal concentrations in black mussel (Mytilus galloprovincialis) tissue and risk to human health (Sydney estuary, Australia). Environ. Sci. Pollut. Res. 2013, 20, 5481–5491. [Google Scholar] [CrossRef]
- Lafabrie, C.; Pergent, G.; Kantin, R.; Pergent-Martini, C.; Gonzalez, J.L. Trace metals assessment in water, sediment, mussel and seagrass species—Validation of the use of Posidonia oceanica as a metal biomonitor. Chemosphere 2007, 68, 2033–2039. [Google Scholar] [CrossRef]
- Hill, N.; Simpson, S.; Johnston, E. Beyond the bed: Effects of metal contamination on recruitment to bedded sediments and overlying substrata. Environ. Pollut. 2013, 173, 182–191. [Google Scholar] [CrossRef] [PubMed]
- Adams, W.J.; Kimerle, R.A.; Barnett, J.W. Sediment quality and aquatic life assessment. Environ. Sci. Technol. 1992, 26, 1864–1875. [Google Scholar] [CrossRef]
- Tuncer, G.; Tuncel, G.; Balkas, T.I. Evolution of metal pollution in the golden horn (turkey) sediments between 1912 and 1987. Mar. Pollut. Bull. 2001, 42, 350–360. [Google Scholar] [CrossRef]
- Yan, N.; Liu, W.; Xie, H.; Gao, L.; Han, Y.; Wang, M.; Li, H. Distribution and assessment of heavy metals in the surface sediment of Yellow River, China. J. Environ. Sci. 2016, 39, 45–51. [Google Scholar] [CrossRef]
- Ma, C.; Zheng, R.; Zhao, J.; Han, X.; Wang, L.; Gao, X.; Zhang, C. Relationships between heavy metal concentrations in soils and reclamation history in the reclaimed coastal area of Chongming Dongtan of the Yangtze River Estuary, China. J. Soils Sediments 2015, 15, 139–152. [Google Scholar] [CrossRef]
- Paul, D. Research on heavy metal pollution of river Ganga: A review. Ann. Agrar. Sci. 2017, 15, 278–286. [Google Scholar] [CrossRef]
- Li, J.; Zheng, C. Environmental Background Data Handbook; China Environmental Science Press: Beijing, China, 1989. [Google Scholar]
- Lin, C.; He, M.; Zhou, Y.; Guo, W.; Yang, Z. Distribution and contamination assessment of heavy metals in sediment of the Second Songhua River, China. Environ. Monit. Assess. 2008, 137, 329. [Google Scholar] [CrossRef] [PubMed]
- Jiang, J.; Wang, J.; Liu, S.; Lin, C.; He, M.; Liu, X. Background, baseline, normalization, and contamination of heavy metals in the Liao river watershed sediments of China. Asian Earth Sci. 2013, 73, 87–94. [Google Scholar] [CrossRef]
- Lin, C.; Wang, J.; Liu, S.; He, M.; Liu, X. Geochemical baseline and distribution of cobalt, manganese, and vanadium in the Liao River watershed sediments of China. Geosci. J. 2013, 17, 455–464. [Google Scholar] [CrossRef]
- Zhao, L.; Wang, W.; Jiang, X.; Wang, S.; Li, J.; Chen, J. Determination of Background Value and Potential Ecological Risk Assessment of Heavy Metals in Sediments of the Danjiangkou Reservoir. Environ. Sci. 2016, 6, 2113–2120. (In Chinese) [Google Scholar]
- Cao, Q.; Wang, H.; Li, Y.; Zhang, Y.; Zheng, P.; Wang, R.; Lal, R.; Ge, X.; Liu, J. The National Distribution Pattern and Factors Affecting Heavy Metals in Sediments of Water Systems in China. Soil Sediment Contam. 2018, 27, 79–97. [Google Scholar] [CrossRef]
- Zhang, G.; Bai, J.; Xiao, R.; Zhao, Q.; Jia, J.; Cui, B.; Liu, X. Heavy metal fractions and ecological risk assessment in sediments from urban, rural and reclamation-affected rivers of the Pearl River Estuary, China. Chemosphere 2017, 184, 278–288. [Google Scholar] [CrossRef]
- Ma, J.; Liu, Y.; Yu, G.; Li, H.; Yu, S.; Jiang, Y.; Li, G.; Lin, J. Temporal dynamics of urbanization-driven environmental changes explored by metal contamination in surface sediments in a restoring urban wetland park. J. Hazard. Mater. 2016, 309, 228–235. [Google Scholar] [CrossRef]
- Nemerow, N.L.C. Scientific Stream Pollution Analysis; Scripta Book Company: Washington, DC, USA, 1974. [Google Scholar]
- Müller, G. Index of Geoaccumulation in sediments of the Rhine River. Geojournal 1969, 2, 108–118. [Google Scholar]
- Förstner, U.; Wittman, G.T.W. Metal Pollution in Aquatic Environment; Springer: Berlin, Germany, 1983; p. 453. [Google Scholar]
- Hakanson, L. An ecological risk index for aquatic pollution control: A sediment ecological approach. Water Res. 1980, 14, 975–1001. [Google Scholar] [CrossRef]
- Shui, T.; Liu, J.; Xiao, Y.; Shi, L. Effects of snow cover on urban surface energy exchange: Observations in Harbin, China during the winter season. Int. J. Climatol. 2019, 39, 1230–1242. [Google Scholar] [CrossRef]
- Cui, S.; Li, K.; Fu, Q.; Li, Y.; Liu, D.; Gao, S.; Song, Z. Levels, spatial variations, and possible sources of polycyclic aromatic hydrocarbons in sediment from Songhua River, China. Arab. J. Geosci. 2018, 11, 445. [Google Scholar] [CrossRef]
- State Environmental Protection Administration of China (SEPA). Environmental Quality Standard for Soils (GB15618-1995); China Environmental Science Press: Beijing, China, 1995. [Google Scholar]
- Deng, H.; Gu, T.; Li, M.; Deng, X. Comprehensive Assessment Model on Heavy Metal Pollution in Soil. Int. J. Electrochem. Sci. 2012, 7, 5286–5296. [Google Scholar]
- Islam, M.S.; Ahmed, M.K.; Raknuzzaman, M.; Habibullah-Al-Mamun, M.; Islam, M.K. Heavy metal pollution in surface water and sediment: A preliminary assessment of an urban river in a developing country. Ecol. Indic. 2015, 48, 282–291. [Google Scholar] [CrossRef]
- Chen, Y.; Jiang, X.; Wang, Y.; Zhuang, D. Spatial characteristics of heavy metal pollution and the potential ecological risk of a typical mining area: A case study in China. Process Saf. Environ. Protect. 2018, 113, 204–219. [Google Scholar] [CrossRef]
- Zhang, X.; Wei, S.; Sun, Q.; Abdul, W.S.; Boli, G. Source identification and spatial distribution of arsenic and heavy metals in agricultural soil around hunan industrial estate by positive matrix factorization model, principle components analysis and geo statistical analysis. Ecotoxicol. Environ. Saf. 2018, 159, 354–362. [Google Scholar] [CrossRef]
- Li, N.; Li, H.; Yang, Z.; Min, X.; Liao, Q.; Liu, Y.; Men, S.; Yan, Y.; Xu, J. Heavy metals and metalloids in the surface sediments of the Xiangjiang river, Hunan, China: Distribution, contamination, and ecological risk assessment. Environ. Sci. Pollut. Res. 2016, 24, 874–885. [Google Scholar]
- Li, D.; Pi, J.; Zhang, T.; Tan, X.; Fraser, D. Evaluating a 5-year metal contamination remediation and the biomonitoring potential of a freshwater gastropod along the Xiangjiang River, China. Environ. Sci. Pollut. Res. 2018, 25, 21127–21137. [Google Scholar] [CrossRef]
- Filgueiras, A.V.; Lavilla, I.; Bendicho, C. Evaluation of distribution, mobility and binding behaviour of heavy metals in surficial sediments of Louro River (galicia, spain) using chemometric analysis: A case study. Sci. Total Environ. 2004, 330, 115–129. [Google Scholar] [CrossRef]
- Alyazichi, Y.M.; Jones, B.G.; Mclean, E.J.; Pease, J.; Brown, H.K. Geochemical assessment of trace element pollution in surface sediments from the Georges River, Southern Sydney, Australia. Arch. Environ. Contam. Toxicol. 2016, 72, 1–13. [Google Scholar] [CrossRef]
- Larrose, A.; Coynel, A.; SchaFer, J.; Blanc, G.; Masse, L.; Maneux, E. Assessing the current state of the Gironde Estuary by mapping priority contaminant distribution and risk potential in surface sediment. Appl. Geochem. 2010, 25, 1912–1923. [Google Scholar] [CrossRef]
- An, Q.; Wu, Y.; Wang, J.; Li, Z. Heavy metals and polychlorinated biphenyls in sediments of the Yangtze river estuary, China. Environ. Earth Sci. 2009, 59, 363–370. [Google Scholar] [CrossRef]
- Li, N.; Tian, Y.; Zhang, J.; Zuo, W.; Zhan, W.; Zhang, J. Heavy metal contamination status and source apportionment in sediments of Songhua river Harbin region, Northeast China. Environ. Sci. Pollut. Res. 2017, 24, 3214–3225. [Google Scholar] [CrossRef] [PubMed]
- Wei, J.; Wei, O.; Hao, F.; Wang, F.; Liu, B. Long-term cultivation impact on the heavy metal behavior in a reclaimed wetland, Northeast China. J. Soils Sediments 2014, 14, 567–576. [Google Scholar]
- Sun, C.; Zhang, Z.; Cao, H.; Xu, M.; Xu, L. Concentrations, speciation, and ecological risk of heavy metals in the sediment of the Songhua River in an urban area with petrochemical industries. Chemosphere 2019, 219, 538–545. [Google Scholar] [CrossRef] [PubMed]
- Wang, Y.; Yang, L.; Kong, L.; Liu, E.; Wang, L.; Zhu, J. Spatial distribution, ecological risk assessment and source identification for heavy metals in surface sediments from Dongping Lake, Shandong, East China. Catena 2015, 125, 200–205. [Google Scholar] [CrossRef]
- Ke, X.; Gui, S.; Huang, H.; Zhang, H.; Wang, C.; Guo, W. Ecological risk assessment and source identification for heavy metals in surface sediment from the Liaohe River protected area, China. Chemosphere 2017, 175, 473–481. [Google Scholar] [CrossRef]
- Guan, Q.; Wang, F.; Xu, C.; Pan, N.; Lin, J.; Zhao, R.; Yang, Y.; Luo, H. Source apportionment of heavy metals in agricultural soil based on PMF: A case study in Hexi corridor, Northwest China. Chemosphere 2017, 193, 189–197. [Google Scholar] [CrossRef]
- Wu, B. Potential ecological risk of heavy metals and metalloid in the sediments of Wuyuer River basin, Heilongjiang province, China. Ecotoxicology 2014, 23, 589–600. [Google Scholar]
- Tang, J.; Han, W.; Li, N.; Li, Z.; Bian, J.; Li, H. Multivariate analysis of heavy metal element concentrations in atmospheric deposition in Harbin city, northeast China. Spectrosc. Spectr. Anal. 2011, 31, 3087–3091. [Google Scholar]
- 43 Liang, J.; Feng, C.; Zeng, G.; Gao, X.; Zhong, M.; Li, X.; He, X.; Fang, Y. Spatial distribution and source identification of heavy metals in surface soils in a typical coal mine city, Lianyuan, China. Environ. Pollut. 2017, 225, 681–690. [Google Scholar] [CrossRef]
- Hjortenkrans, D.; Bergback, B.; Haggerud, A. New metal emission patterns in road traffic environments. Environ. Monit. Assess. 2006, 117, 85–98. [Google Scholar] [CrossRef]
- Pan, H.; Lu, X.; Lei, K. A comprehensive analysis of heavy metals in urban road dust of Xian, China: Contamination, source apportionment and spatial distribution. Sci. Total Environ. 2017, 609, 1361–1369. [Google Scholar] [CrossRef] [PubMed]
- Yi, C.; Na, X.; Fu, Z.; Zhang, M.; Yang, Y. Survey of heavy metal content in soils of main streets in Harbin. J. Environ. Health 2013, 30, 159–160. [Google Scholar]
© 2019 by the authors. Licensee MDPI, Basel, Switzerland. This article is an open access article distributed under the terms and conditions of the Creative Commons Attribution (CC BY) license (http://creativecommons.org/licenses/by/4.0/).
Share and Cite
Cui, S.; Zhang, F.; Hu, P.; Hough, R.; Fu, Q.; Zhang, Z.; An, L.; Li, Y.-F.; Li, K.; Liu, D.; et al. Heavy Metals in Sediment from the Urban and Rural Rivers in Harbin City, Northeast China. Int. J. Environ. Res. Public Health 2019, 16, 4313. https://doi.org/10.3390/ijerph16224313
Cui S, Zhang F, Hu P, Hough R, Fu Q, Zhang Z, An L, Li Y-F, Li K, Liu D, et al. Heavy Metals in Sediment from the Urban and Rural Rivers in Harbin City, Northeast China. International Journal of Environmental Research and Public Health. 2019; 16(22):4313. https://doi.org/10.3390/ijerph16224313
Chicago/Turabian StyleCui, Song, Fuxiang Zhang, Peng Hu, Rupert Hough, Qiang Fu, Zulin Zhang, Lihui An, Yi-Fan Li, Kunyang Li, Dong Liu, and et al. 2019. "Heavy Metals in Sediment from the Urban and Rural Rivers in Harbin City, Northeast China" International Journal of Environmental Research and Public Health 16, no. 22: 4313. https://doi.org/10.3390/ijerph16224313
APA StyleCui, S., Zhang, F., Hu, P., Hough, R., Fu, Q., Zhang, Z., An, L., Li, Y.-F., Li, K., Liu, D., & Chen, P. (2019). Heavy Metals in Sediment from the Urban and Rural Rivers in Harbin City, Northeast China. International Journal of Environmental Research and Public Health, 16(22), 4313. https://doi.org/10.3390/ijerph16224313