First Trimester Combined Test (FTCT) as a Predictor of Gestational Diabetes Mellitus


 ,
,  ,
, 

Abstract
1. Introduction
2. Materials and Methods
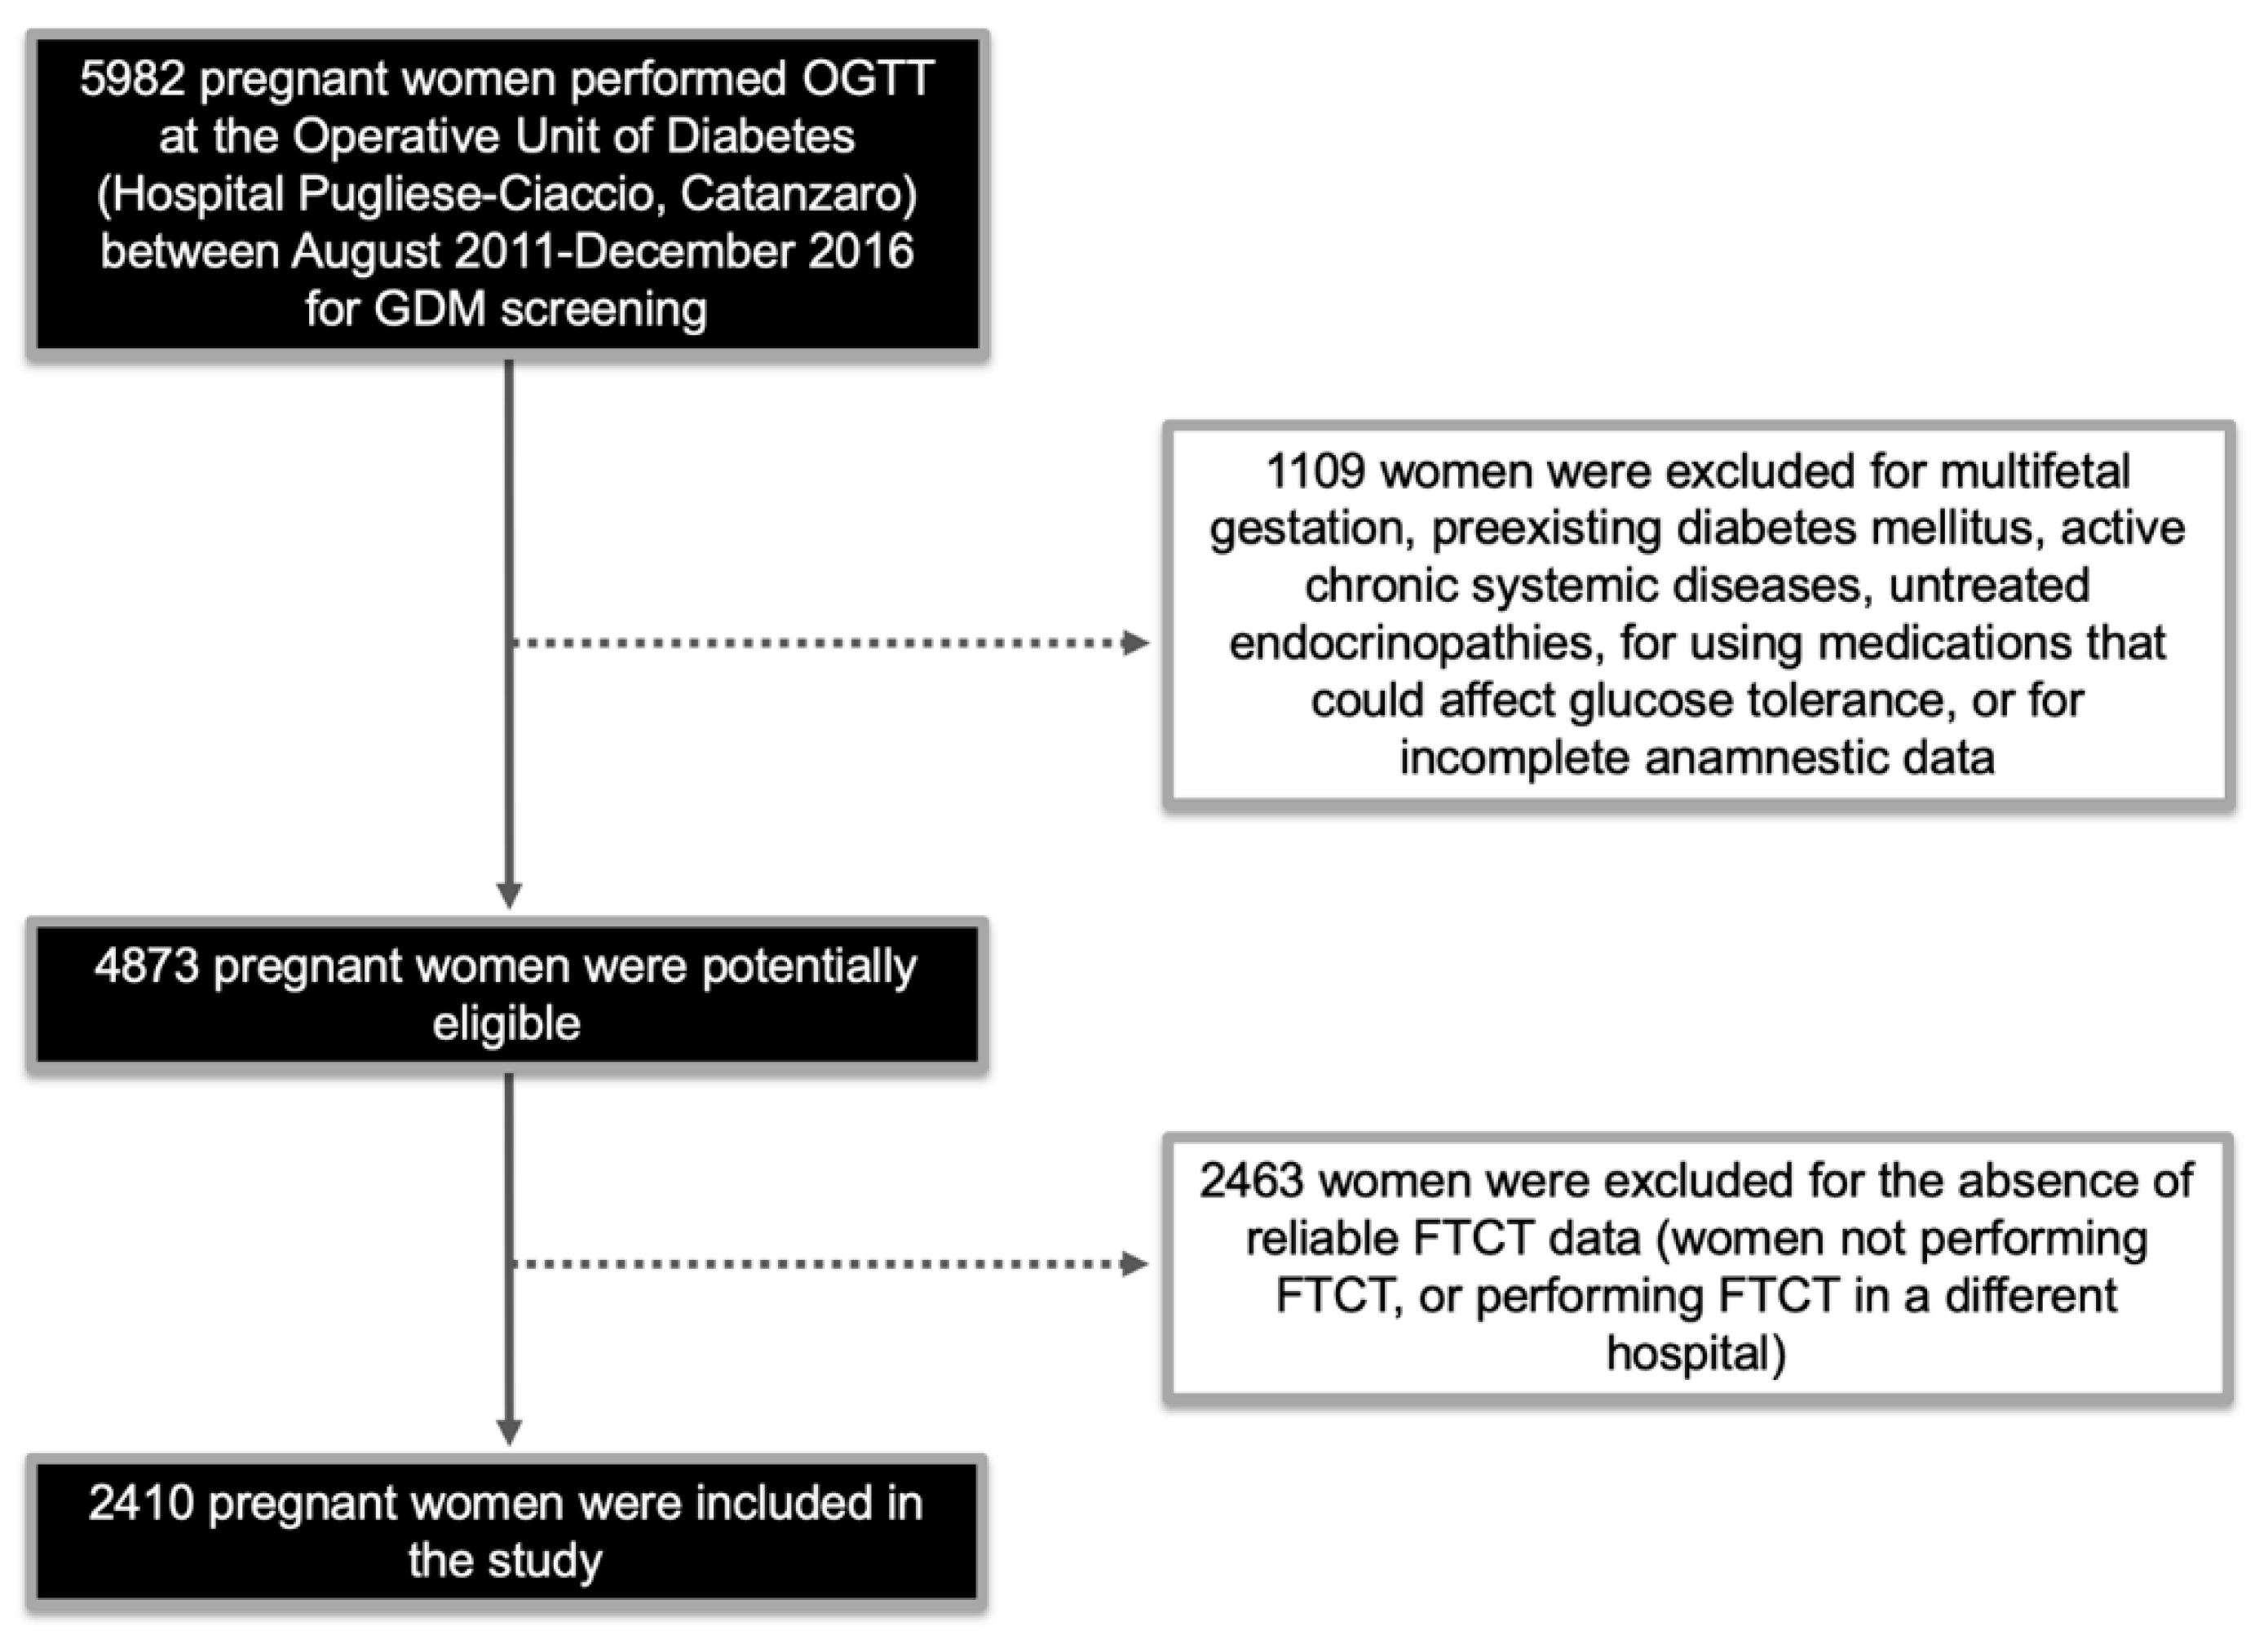
2.1. Study Population
2.2. Ultrasound, Biochemical Analyses, and FTCT Calculation
2.3. Statistical Analysis
3. Results
3.1. Characteristics of the Study Population
3.2. FTCT as Predictor of GDM
4. Discussion
5. Conclusions
Author Contributions
Funding
Acknowledgments
Conflicts of Interest
References
- Chiefari, E.; Arcidiacono, B.; Foti, D.; Brunetti, A. Gestational diabetes mellitus: An updated overview. J. Endocrinol. Investig. 2017, 40, 899–909. [Google Scholar] [CrossRef] [PubMed]
- HAPO Study Cooperative Research Group. The Hyperglycemia and Adverse Pregnancy Outcome (HAPO) Study. Int. J. Gynecol. Obstet. 2002, 78, 69–77. [Google Scholar] [CrossRef]
- Bellamy, L.; Casas, J.P.; Hingorani, A.D.; Williams, D. Type 2 diabetes mellitus after gestational diabetes: A systematic review and meta-analysis. Lancet 2009, 373, 1773–1779. [Google Scholar] [CrossRef]
- Sullivan, S.D.; Umans, J.G.; Ratner, R. Gestational diabetes: Implications for cardiovascular health. Curr. Diabetes Rep. 2012, 12, 43–52. [Google Scholar] [CrossRef] [PubMed]
- International Association of Diabetes and Pregnancy Study Groups Consensus Panel. International Association of Diabetes and Pregnancy Study Groups. Recommendations on the Diagnosis and Classification of Hyperglycemia in Pregnancy. Diabetes Care 2010, 33, 676–682. [Google Scholar] [CrossRef]
- ACOG Committee on Practice Bulletins. ACOG Practice Bullettin no 77: Screening for fetal chromosomal abnormalities. Obstet. Gynecol. 2007, 109, 217–227. [Google Scholar] [CrossRef]
- Pajkrt, E.; Bilardo, C.M.; Van Lith, J.M.; Mol, B.W.; Bleker, O.P. Nuchal translucency measurement in normal fetuses. Obstet. Gynecol. 1995, 86, 994–997. [Google Scholar] [CrossRef]
- Nicolaides, K.H.; Snijders, R.J.; Gosden, C.M.; Berry, C.; Campbell, S. Ultrasonographically detectable markers of fetal chromosomal abnormalities. Lancet 1992, 340, 704–707. [Google Scholar] [CrossRef]
- Cole, L.A. Biological functions of hCG and hCG-related molecules. Reprod. Biol. Endocrinol. 2010, 8, 102. [Google Scholar] [CrossRef]
- Androutsopoulos, G.; Gkogkos, P.; Decavalas, G. Mid-trimester maternal serum HCG and alpha fetal protein levels: Clinical significance and prediction of adverse pregnancy outcome. Int. J. Endocrinol. Metab. 2013, 11, 102–106. [Google Scholar] [CrossRef]
- Ong, C.Y.; Liao, A.W.; Spencer, K.; Munim, S.; Nicolaides, K.H. First trimester maternal serum free beta human chorionic gonadotrophin and pregnancy associated plasma protein A as predictors of pregnancy complications. Br. J. Obstet. Gynaecol. 2000, 107, 1265–1270. [Google Scholar] [CrossRef]
- Spencer, K.; Cowans, N.J.; Avgidou, K.; Molina, F.; Nicolaides, K.H. First-trimester biochemical markers of aneuploidy and the prediction of small-for-gestational age fetuses. Ultrasound Obstet. Gynecol. 2008, 31, 15–19. [Google Scholar] [CrossRef] [PubMed]
- Spencer, K.; Cowans, N.J.; Molina, F.; Kagan, K.O.; Nicolaides, K.H. First-trimester ultrasound and biochemical markers of aneuploidy and the prediction of preterm or early preterm delivery. Ultrasound Obstet. Gynecol. 2008, 31, 147–152. [Google Scholar] [CrossRef] [PubMed]
- Spencer, K.; Cowans, N.J.; Nicolaides, K.H. Low levels of maternal serum PAPP-A in the first trimester and the risk of pre-eclampsia. Prenat. Diagn. 2008, 28, 7–10. [Google Scholar] [CrossRef]
- Patil, M.; Panchanadikar, T.M.; Wagh, G. Variation of PAPP-A level in the first trimester of pregnancy and its clinical outcome. J. Obstet. Gynaecol. India 2014, 64, 116–119. [Google Scholar] [CrossRef] [PubMed]
- Spencer, K.; Cowans, N.J. The association between gestational diabetes mellitus and first trimester aneuploidy screening markers. Ann. Clin. Biochem. 2013, 50, 603–610. [Google Scholar] [CrossRef] [PubMed]
- Beneventi, F.; Simonetta, M.; Lovati, E.; Albonico, G.; Tinelli, C.; Locatelli, E.; Spinillo, A. First trimester pregnancy-associated plasma protein-A in pregnancies complicated by subsequent gestational diabetes. Prenat. Diagn. 2011, 31, 523–528. [Google Scholar] [CrossRef]
- Sirikunalai, P.; Wanapirak, C.; Sirichotiyakul, S.; Tongprasert, F.; Srisupundit, K.; Luewan, S.; Traisrisilp, K.; Tongsong, T. Associations between maternal serum free beta human chorionic gonadotropin (β-hCG) levels and adverse pregnancy outcomes. J. Obstet. Gynaecol. 2016, 36, 178–182. [Google Scholar] [CrossRef]
- Tul, N.; Pusenjak, S.; Osredkar, J.; Spencer, K.; Novak-Antolic, Z. Predicting complications of pregnancy with first-trimester maternal serum free-betahCG, PAPP-A and inhibin-A. Prenat. Diagn. 2003, 23, 990–996. [Google Scholar] [CrossRef]
- Savvidou, M.D.; Syngelaki, A.; Muhaisen, M.; Emelyanenko, E.; Nicolaides, K.H. First trimester maternal serum free beta-human chorionic gonadotropin and pregnancy-associated plasma protein A in pregnancies complicated by diabetes mellitus. Br. J. Obstet. Gynaecol. 2012, 119, 410–416. [Google Scholar] [CrossRef]
- Chiefari, E.; Tanyolaç, S.; Iiritano, S.; Sciacqua, A.; Capula, C.; Arcidiacono, B.; Nocera, A.; Possidente, K.; Baudi, F.; Ventura, V.; et al. A polymorphism of HMGA1 is associated with increased risk of metabolic syndrome and related components. Sci. Rep. 2013, 3, 1491. [Google Scholar] [CrossRef] [PubMed]
- Chiefari, E.; Ventura, V.; Capula, C.; Randazzo, G.; Scorcia, V.; Fedele, M.; Arcidiacono, B.; Nevolo, M.T.; Bilotta, F.L.; Vitiello, M.; et al. A polymorphism of HMGA1 protects against proliferative diabetic retinopathy by impairing HMGA1-induced VEGFA expression. Sci. Rep. 2016, 6, 39429. [Google Scholar] [CrossRef] [PubMed]
- Linea Guida Gravidanza Fisiologica. Sistema Nazionale per le Linee Guida dell’Istituto Superiore di Sanità. Available online: http://www.salute.gov.it/imgs/C_17_pubblicazioni_1436_allegato.pdf (accessed on 20 August 2019).
- Rotterdam ESHRE/ASRM-Sponsored PCOS Consensus Workshop Group. Revised 2003 consensus on diagnostic criteria and long-term health risks related to polycystic ovary syndrome. Fertil. Steril. 2004, 81, 19–25. [Google Scholar] [CrossRef] [PubMed]
- The Fetal Medicine Foundation. Online Education: The 11–13 Weeks Scan. Available online: https://fetalmedicine.org/education/the-11-13-weeks-scan (accessed on 20 August 2019).
- Resta, R.G. Changing demographics of advanced maternal age (AMA) and the impact on the predicted incidence of Down syndrome in the United States: Implications for prenatal screening and genetic counseling. Am. J. Med. Genet. 2005, 133, 31–36. [Google Scholar] [CrossRef] [PubMed]
- Pedersen, J.F.; Rensen, S.; Ruge, S. Human placental lactogen and pregnancy-associated plasma protein A in first trimester and subsequent fetal growth. Acta Obstet. Gynecol. Scand. 1995, 74, 505–508. [Google Scholar] [CrossRef] [PubMed]
- Capula, C.; Chiefari, E.; Vero, A.; Arcidiacono, B.; Iiritano, S.; Puccio, L.; Pullano, V.; Foti, D.P.; Brunetti, A.; Vero, R. Gestational diabetes mellitus: Screening and outcomes in Southern Italian pregnant women. ISRN Endocrinol. 2013, 2013, 387495. [Google Scholar] [CrossRef] [PubMed]
- Capula, C.; Chiefari, E.; Borelli, M.; Oliverio, R.; Vero, A.; Foti, D.; Puccio, L.; Vero, R.; Brunetti, A. A new predictive tool for the early risk assessment of gestational diabetes mellitus. Prim. Care Diabetes 2016, 10, 315–323. [Google Scholar] [CrossRef] [PubMed]
- Donovan, B.M.; Nidey, N.L.; Jasper, E.A.; Robinson, J.G.; Bao, W.; Saftlas, A.F.; Ryckman, K.K. First trimester prenatal screening biomarkers and gestational diabetes mellitus: A systematic review and meta-analysis. PLoS ONE. 2018, 13, e0201319. [Google Scholar] [CrossRef]
- Talasaz, Z.H.; Sadeghi, R.; Askari, F.; Dadgar, S.; Vatanchi, A. First trimesters Pregnancy-Associated Plasma Protein-A levels value to Predict Gestational diabetes Mellitus: A systematic review and meta-analysis of the literature. Taiwan J. Obstet. Gynecol. 2018, 57, 181–189. [Google Scholar] [CrossRef]
- Sweeting, A.N.; Wong, J.; Appelblom, H.; Ross, G.P.; Kouru, H.; Williams, P.F.; Sairanen, M.; Hyett, J.A. A first trimester prediction model for gestational diabetes utilizing aneuploidy and pre-eclampsia screening markers. J. Matern. Fetal Neonatal Med. 2018, 31, 2122–2130. [Google Scholar] [CrossRef]
- Caliskan, R.; Atis, A.; Aydin, Y.; Acar, D.; Kiyak, H.; Topbas, F. PAPP-A concentrations change in patients with gestational diabetes. J. Obstet. Gynaecol. 2019, 23, 1–5. [Google Scholar] [CrossRef] [PubMed]
- Husslein, H.; Lausegger, F.; Leipold, H.; Worda, C. Association between pregnancy-associated plasma protein-A and gestational diabetes requiring insulin treatment at 11–14 weeks of gestation. J. Matern. Fetal Neonatal Med. 2012, 25, 2230–2233. [Google Scholar] [CrossRef]
- Leipold, H.; Worda, C.; Ozbal, A.; Husslein, P.; Krampl, E. First-trimester nuchal translucency screening in pregnant women who subsequently developed gestational diabetes. J. Soc. Gynecol. Investig. 2005, 12, 529–532. [Google Scholar] [CrossRef] [PubMed]
- Capula, C.; Chiefari, E.; Vero, A.; Foti, D.P.; Brunetti, A.; Vero, R. Prevalence and predictors of postpartum glucose intolerance in Italian women with gestational diabetes mellitus. Diabetes Res. Clin. Pract. 2014, 105, 223–230. [Google Scholar] [CrossRef] [PubMed]
- Chiefari, E.; Pastore, I.; Puccio, L.; Caroleo, P.; Oliverio, R.; Vero, A.; Foti, D.P.; Vero, R.; Brunetti, A. Impact of seasonality in gestational diabetes mellitus. Endocr. Metab. Immune Disord. Drug Targets. 2017, 17, 246–252. [Google Scholar] [CrossRef]
- Agarwal, M.M.; Dhatt, G.S.; Othman, Y. Gestational diabetes mellitus prevalence: Effect of the laboratory analytical variation. Diabetes Res. Clin. Pract. 2015, 109, 493–499. [Google Scholar] [CrossRef]
- Lamain-de Ruiter, M.; Kwee, A.; Naaktgeboren, C.A.; Franx, A.; Moons, K.G.M.; Koster, M.P.H. Prediction models for the risk of gestational diabetes: A systematic review. Diagn Progn Res. 2017, 1, 3. [Google Scholar] [CrossRef]
- Ritchie, K.; Bradbury, I.; Slattery, J.; Wright, D.; Iqbal, K.; Penney, G. Economic modelling of antenatal screening and ultrasound scanning programmes for identification of fetal abnormalities. BJOG 2005, 112, 866–874. [Google Scholar] [CrossRef]
- Silva-Zolezzi, I.; Samuel, T.M.; Spieldenner, J. Maternal nutrition: Opportunities in the prevention of gestational diabetes. Nutr. Rev. 2017, 75 (Suppl. 1), 32–50. [Google Scholar] [CrossRef]


| Characteristics | No GDM (N = 1828) | GDM (N = 596) | p Value |
|---|---|---|---|
| Age, years | 31 (28–34) | 33 (29–34) | <0.001 |
| Familiarity for T2DM, N | 759 (41.5) | 277 (46.5) | 0.038 |
| Pregravidic BMI, kg/m2 | 22.5 (21.7–25.5) | 24.8 (21.9–28.7) | <0.001 |
| Previous GDM, N | 43 (2.4) | 78 (13.1) | <0.001 |
| Previous macrosomy, N | 28 (1.5) | 9 (1.5) | 0.877 |
| Smoking, N | 75 (4.1) | 24 (4.0) | 0.970 |
| PCOS, N | 3 (0.2) | 27 (4.5) | <0.001 |
| Gravidity, N | 1 (1–2) | 2 (1–2) | 0.282 |
| No. of pregnancies >1 | 532 (29.1) | 288 (48.3) | <0.001 |
| High risk 1 | 150 (8.2) | 169 (28.4) | <0.001 |
| Intermediate risk 1 | 1126 (61.6) | 270 (45.3) | <0.001 |
| Low risk 1 | 552 (30.2) | 157 (26.3) | <0.001 |
| Early GDM screening, N | 27 (18.0) | 61 (36.1) | <0.001 |
| GDM diagnosis at early screening | 0 | 42 (68.9) | - |
| Later screening, N | 1828 | 554 | - |
| Time of FTCT, weeks | 12.2 (11.5–12.5) | 12.2 (11.5–12.5) | 0.488 |
| FTCT | 0.00011 (0.00010–0.00023) | 0.00013 (0.00010–0.00026) | 0.024 |
| β-hCG, MoM | 0.91 (0.61–1.36) | 1.02 (0.60–1.36) | 0.376 |
| PAPP-A, MoM | 1.19 (0.82–1.67) | 1.02 (0.77–1.68) | 0.130 |
| CRL, mm | 58.7 (53.0–65.0) | 59.0 (53.0–65.0) | 0.363 |
| NT, mm | 1.10 (0.9–1.4) | 1.10 (0.9–1.5) | 0.352 |
| FTCT <1:10000, N | 1033 (56.5) | 373 (62.6) | 0.010 |
| PAPP-A <1 MoM, N | 680 | 257 | 0.011 |
| Parameter | GDM (N = 596) | p Value | Glycemia Fasting | p Value | Glycemia 1 h-OGTT | p Value | Glycemia 2 h-OGTT | p Value |
|---|---|---|---|---|---|---|---|---|
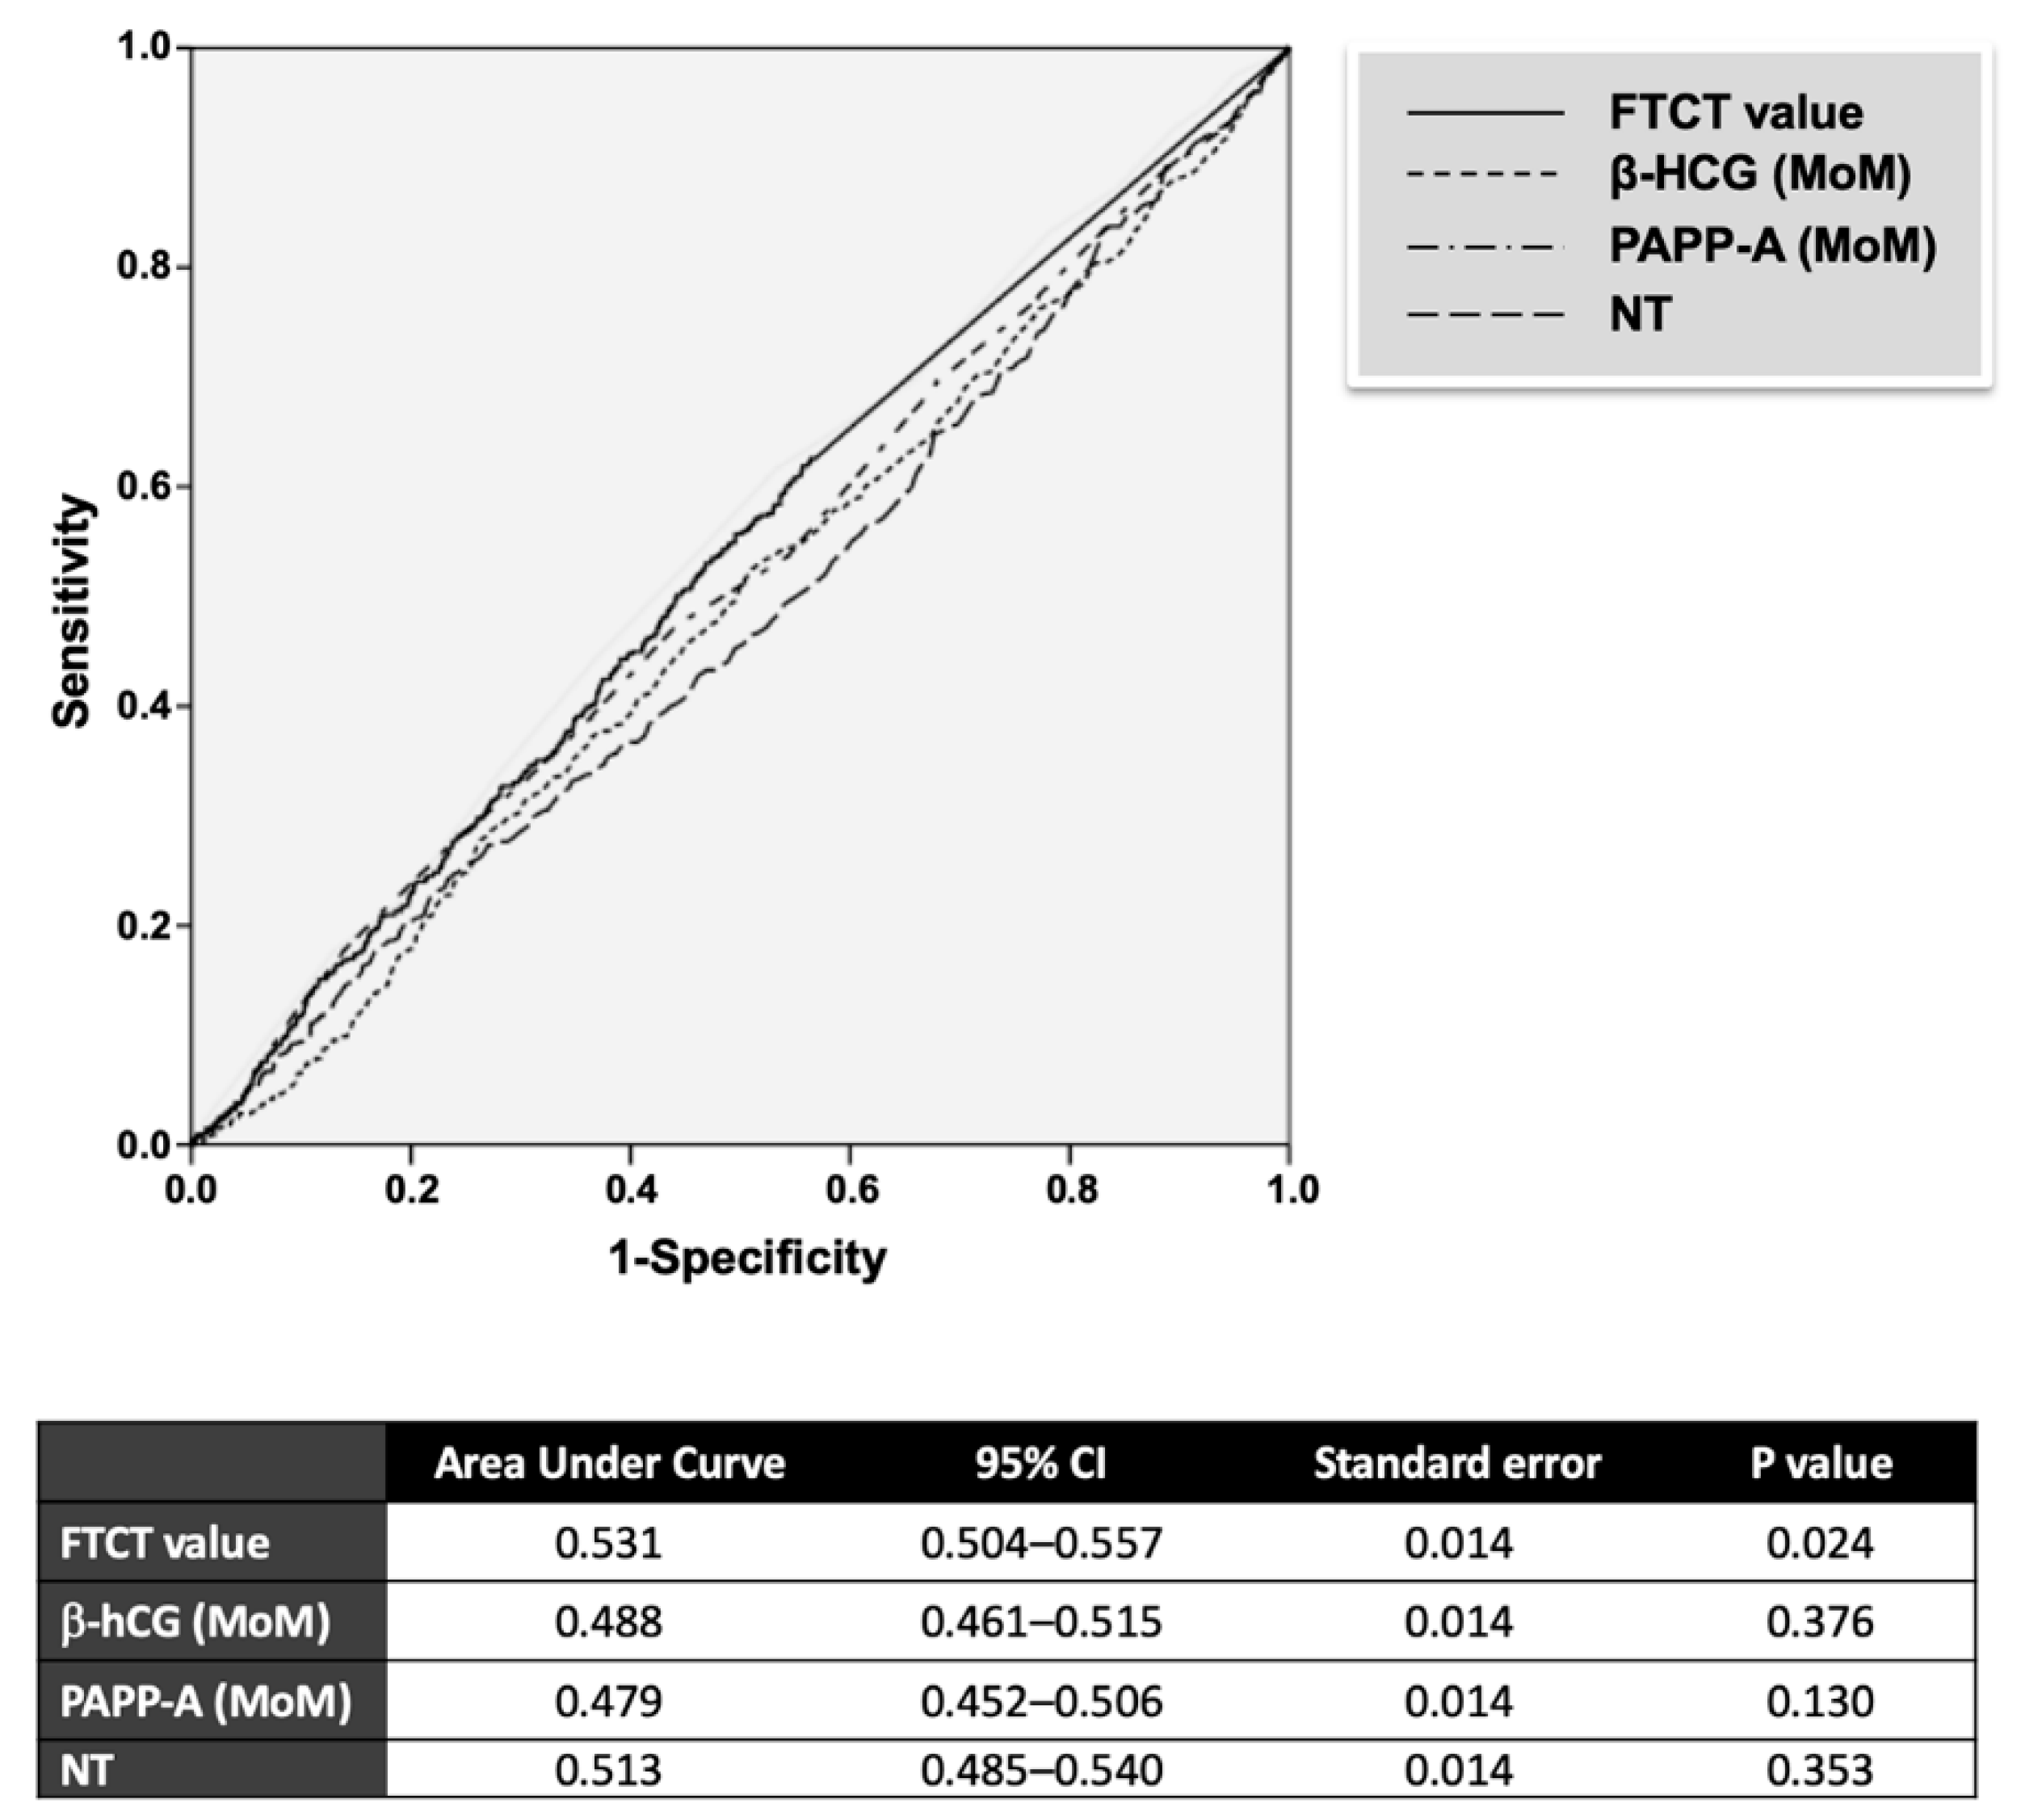
| FTCT value | ρ = 0.048 | 0.018 | ρ = 0.067 | 0.001 | ρ = 0.060 | 0.004 | ρ = −0.034 | 0.101 |
| β-hCG MoM | ρ = −0.018 | 0.377 | ρ = −0.035 | 0.091 | ρ = 0.001 | 0.980 | ρ = −0.004 | 0.844 |
| PAPP-A MoM | ρ = −0.031 | 0.130 | ρ = −0.082 | <0.001 | ρ = −0.018 | 0.401 | ρ = −0.032 | 0.125 |
| NT | ρ = 0.019 | 0.352 | ρ = 0.015 | 0.466 | ρ = 0.037 | 0.073 | ρ = 0.029 | 0.161 |
| CRL | ρ = 0.019 | 0.363 | ρ = −0.010 | 0.626 | ρ = 0.019 | 0.369 | ρ = 0.035 | 0.096 |
| Variable | No GDM | GDM | OR (95% CI) | p Value |
|---|---|---|---|---|
| FTCT <1:10000 | 1033/795 | 373/223 | 1.26 (1.05–1.53) | 0.016 |
| FTCT <1:8000 | 832/996 | 302/294 | 1.22 (1.02–1.47) | 0.033 |
| β-hCG <0.5 MoM | 250/1578 | 99/497 | 1.25 (0.97–1.61) | 0.089 |
| β-hCG ≥2.0 MoM | 208/1620 | 47/549 | 0.66 (0.47–0.92) | 0.014 |
| PAPP-A <0.4 MoM | 44/1784 | 19/577 | 1.32 (0.77–2.29) | 0.313 |
| PAPP-A <1 MoM | 680/1148 | 257/339 | 1.26 (1.05–1.53) | 0.014 |
| NT >1.5 mm | 330/1498 | 130/466 | 1.27 (1.01–1.60) | 0.039 |
| NT >1.5 mm 1 | 330/1498 | 130/466 | 1.20 (0.94–1.51) 1 | 0.140 1 |
© 2019 by the authors. Licensee MDPI, Basel, Switzerland. This article is an open access article distributed under the terms and conditions of the Creative Commons Attribution (CC BY) license (http://creativecommons.org/licenses/by/4.0/).
Share and Cite
Visconti, F.; Quaresima, P.; Chiefari, E.; Caroleo, P.; Arcidiacono, B.; Puccio, L.; Mirabelli, M.; Foti, D.P.; Di Carlo, C.; Vero, R.; et al. First Trimester Combined Test (FTCT) as a Predictor of Gestational Diabetes Mellitus. Int. J. Environ. Res. Public Health 2019, 16, 3654. https://doi.org/10.3390/ijerph16193654
Visconti F, Quaresima P, Chiefari E, Caroleo P, Arcidiacono B, Puccio L, Mirabelli M, Foti DP, Di Carlo C, Vero R, et al. First Trimester Combined Test (FTCT) as a Predictor of Gestational Diabetes Mellitus. International Journal of Environmental Research and Public Health. 2019; 16(19):3654. https://doi.org/10.3390/ijerph16193654
Chicago/Turabian StyleVisconti, Federica, Paola Quaresima, Eusebio Chiefari, Patrizia Caroleo, Biagio Arcidiacono, Luigi Puccio, Maria Mirabelli, Daniela P. Foti, Costantino Di Carlo, Raffaella Vero, and et al. 2019. "First Trimester Combined Test (FTCT) as a Predictor of Gestational Diabetes Mellitus" International Journal of Environmental Research and Public Health 16, no. 19: 3654. https://doi.org/10.3390/ijerph16193654
APA StyleVisconti, F., Quaresima, P., Chiefari, E., Caroleo, P., Arcidiacono, B., Puccio, L., Mirabelli, M., Foti, D. P., Di Carlo, C., Vero, R., & Brunetti, A. (2019). First Trimester Combined Test (FTCT) as a Predictor of Gestational Diabetes Mellitus. International Journal of Environmental Research and Public Health, 16(19), 3654. https://doi.org/10.3390/ijerph16193654