Research on the Relationship between Water Diversion and Water Quality of Xuanwu Lake, China


Abstract
1. Introduction
2. Study Area and Methods
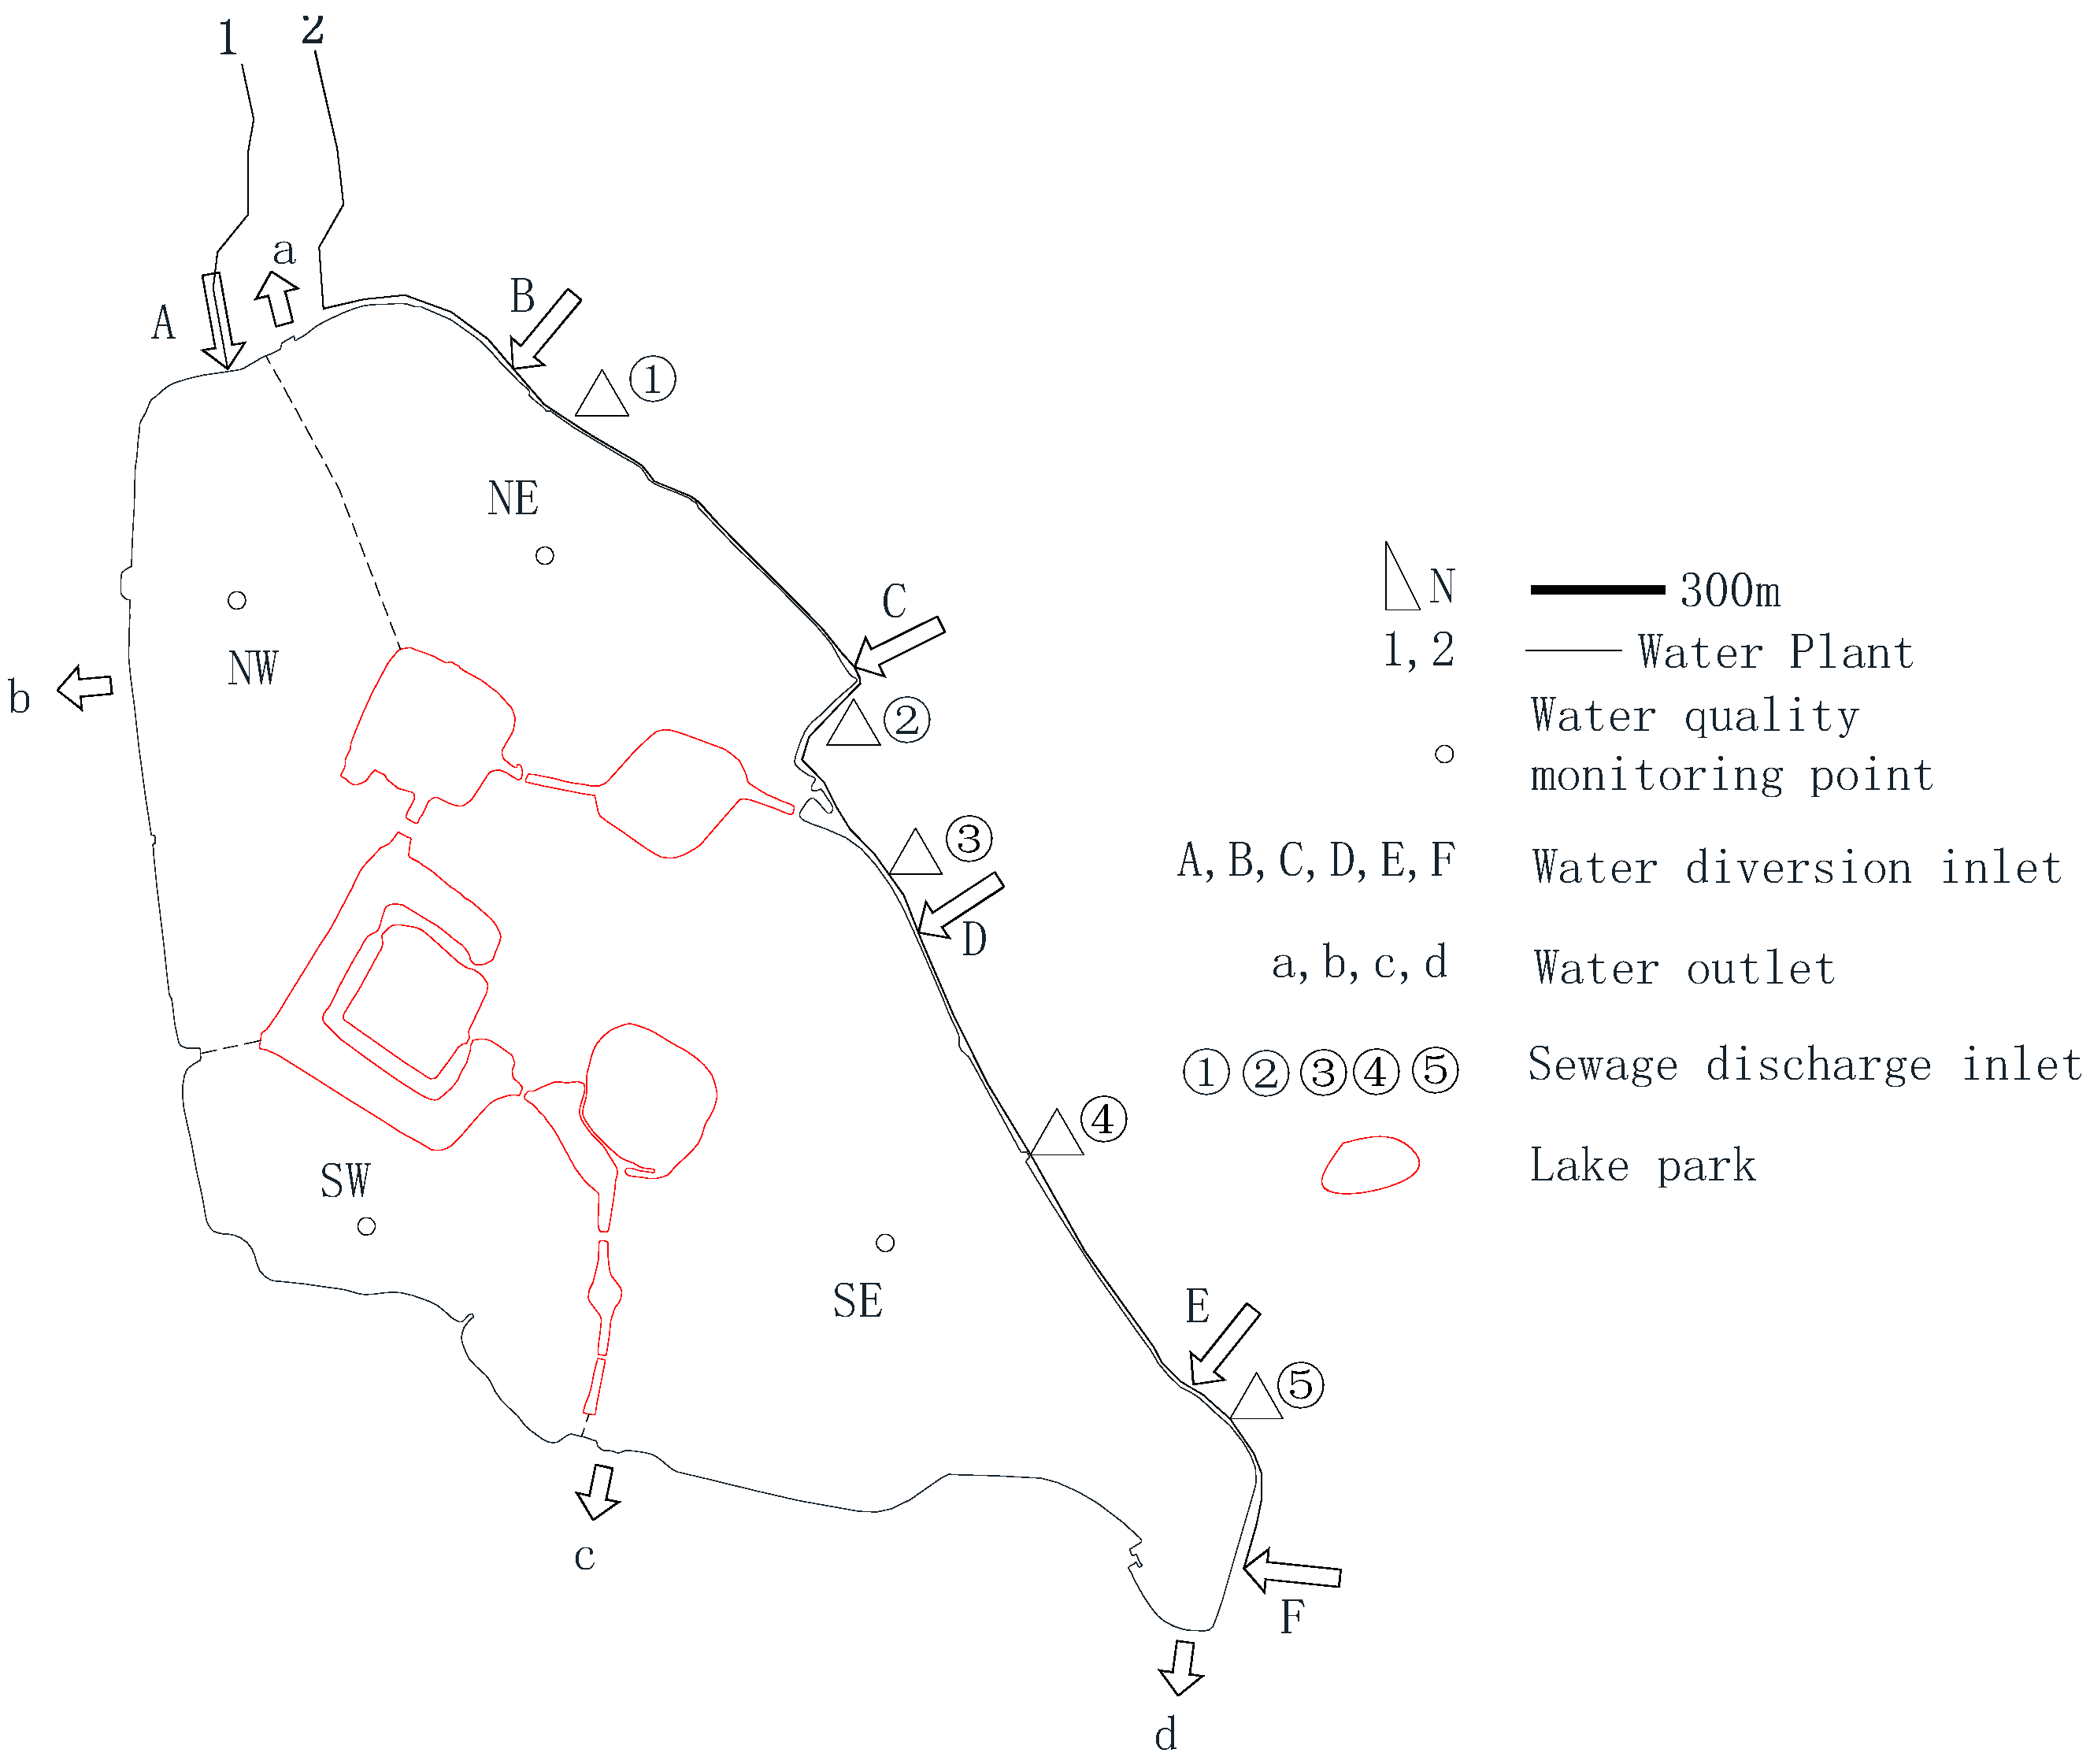
2.1. Study Area
2.2. Study Methods
2.2.1. Hydrodynamic Two-Dimensional Model
2.2.2. Water Quality Two-Dimensional Model
Basic Equations of Water Quality Model
2.3. Model Setup and Calibration
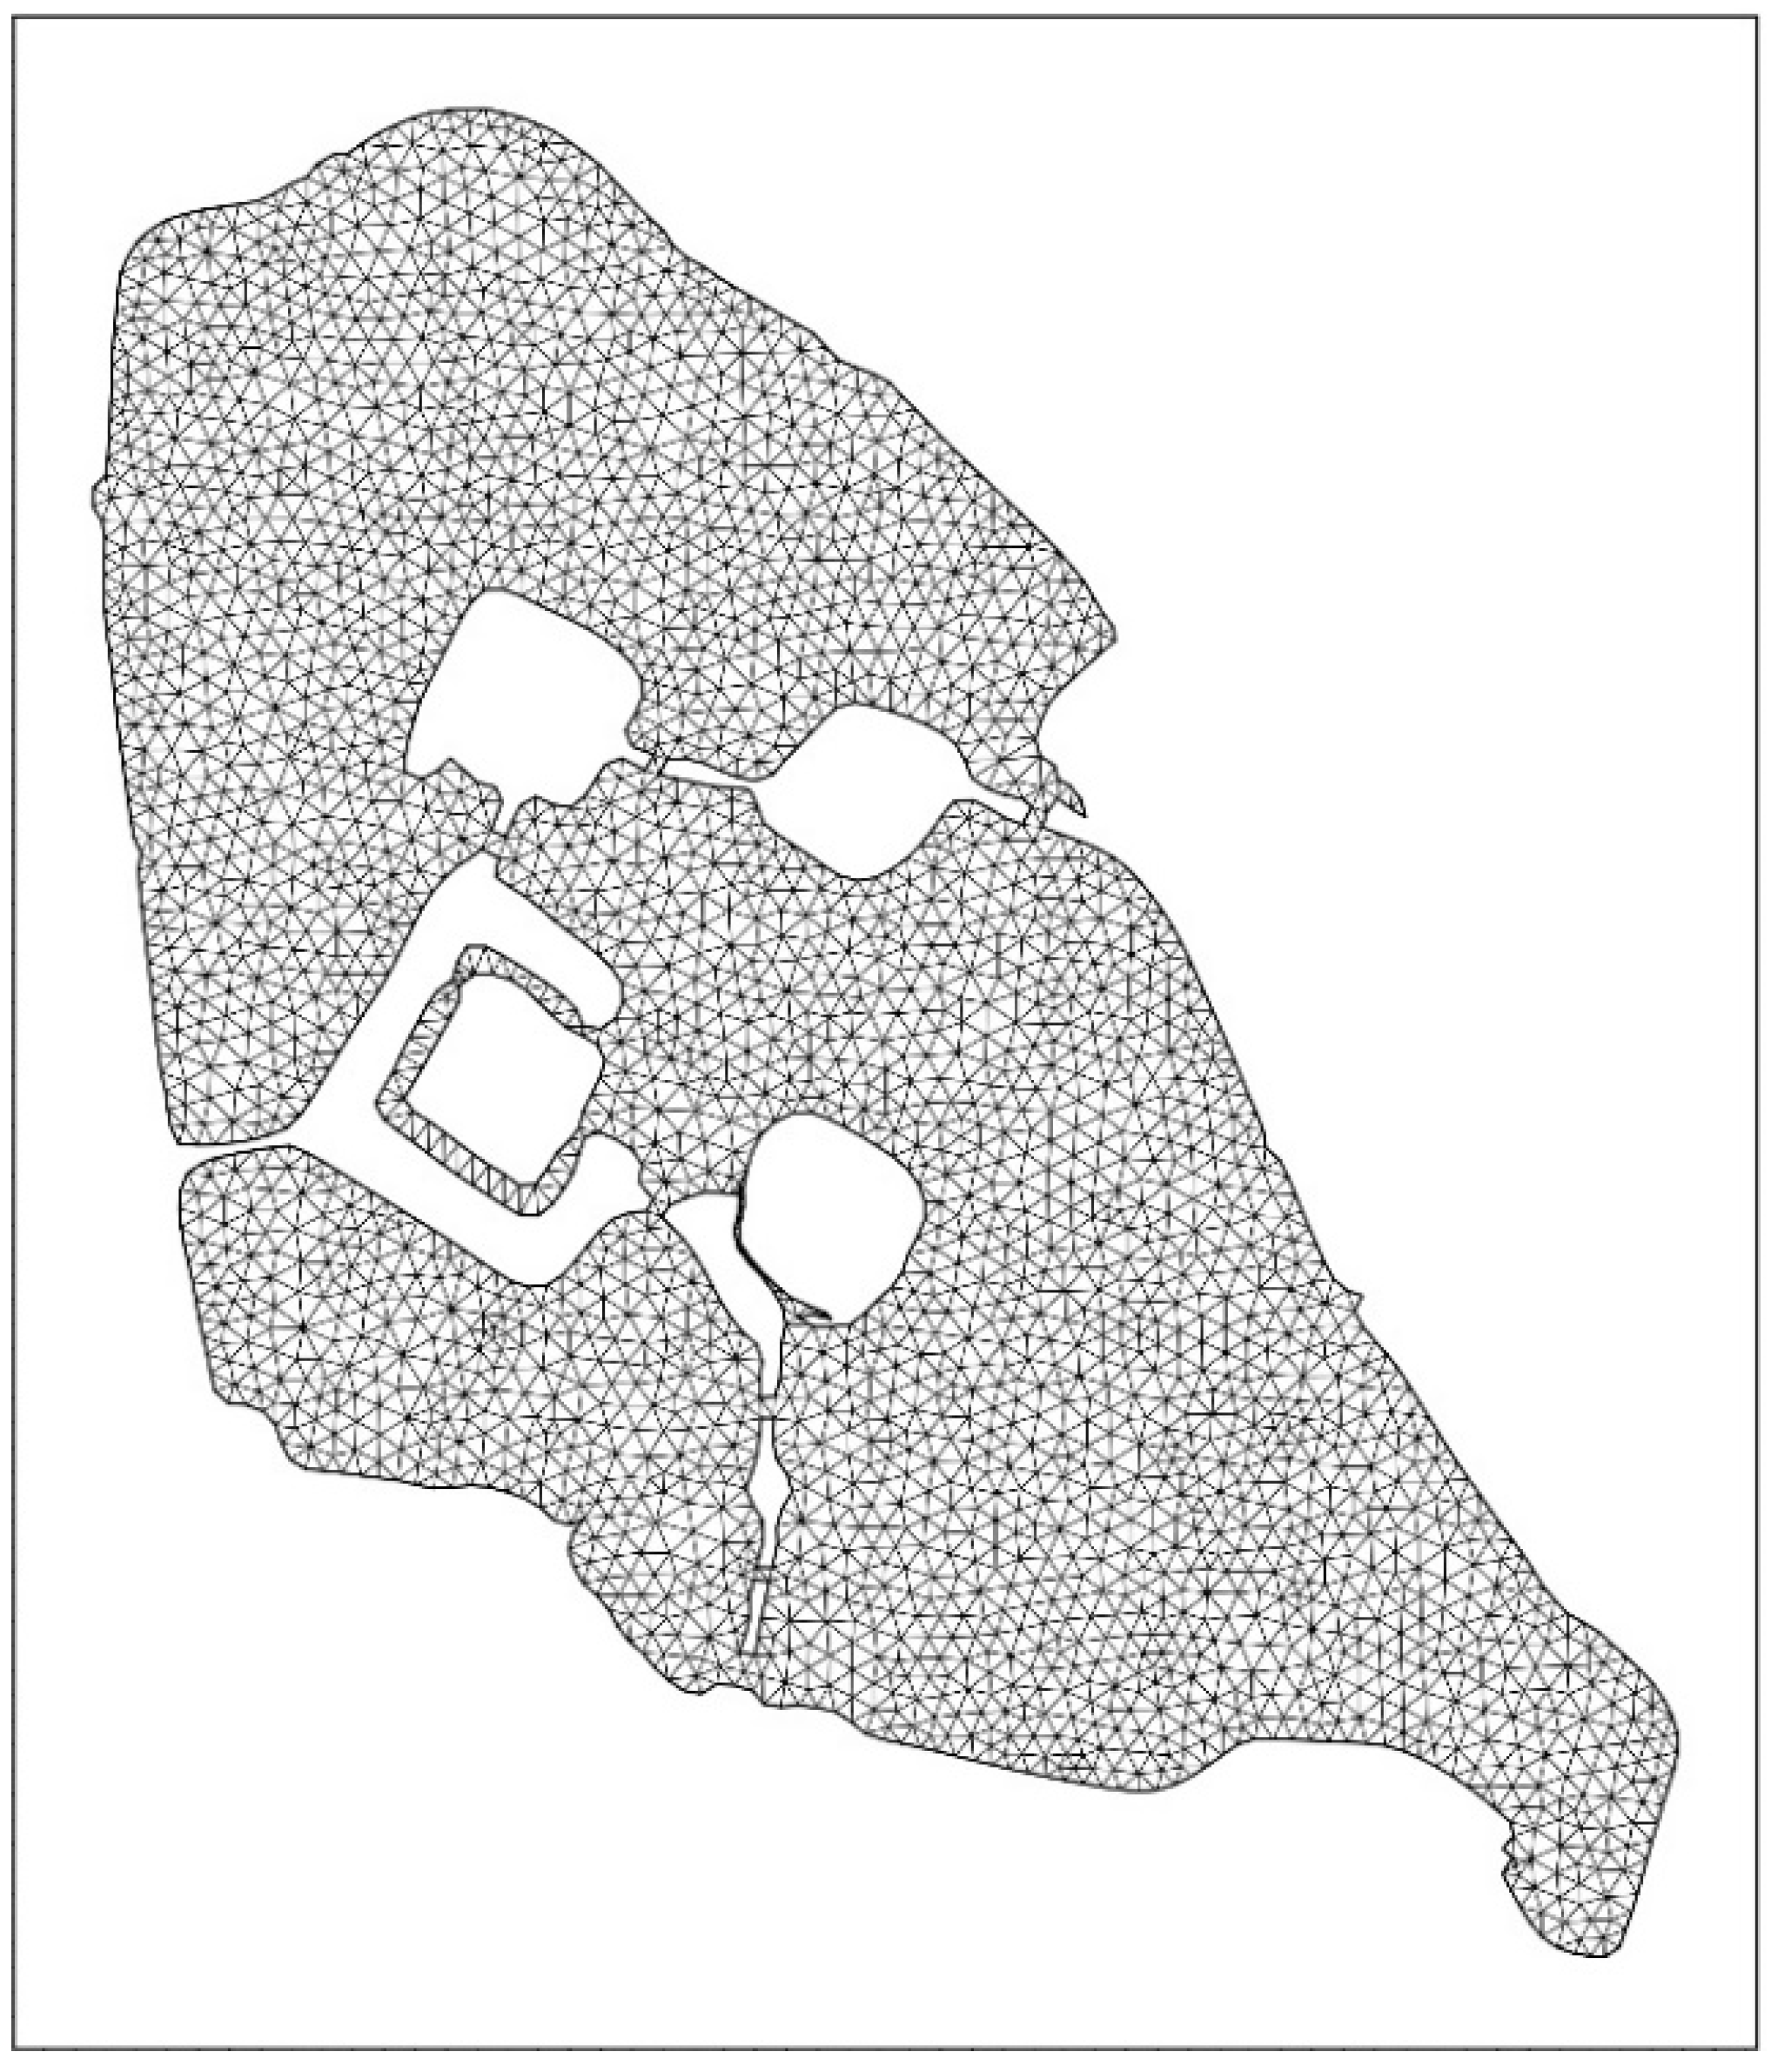
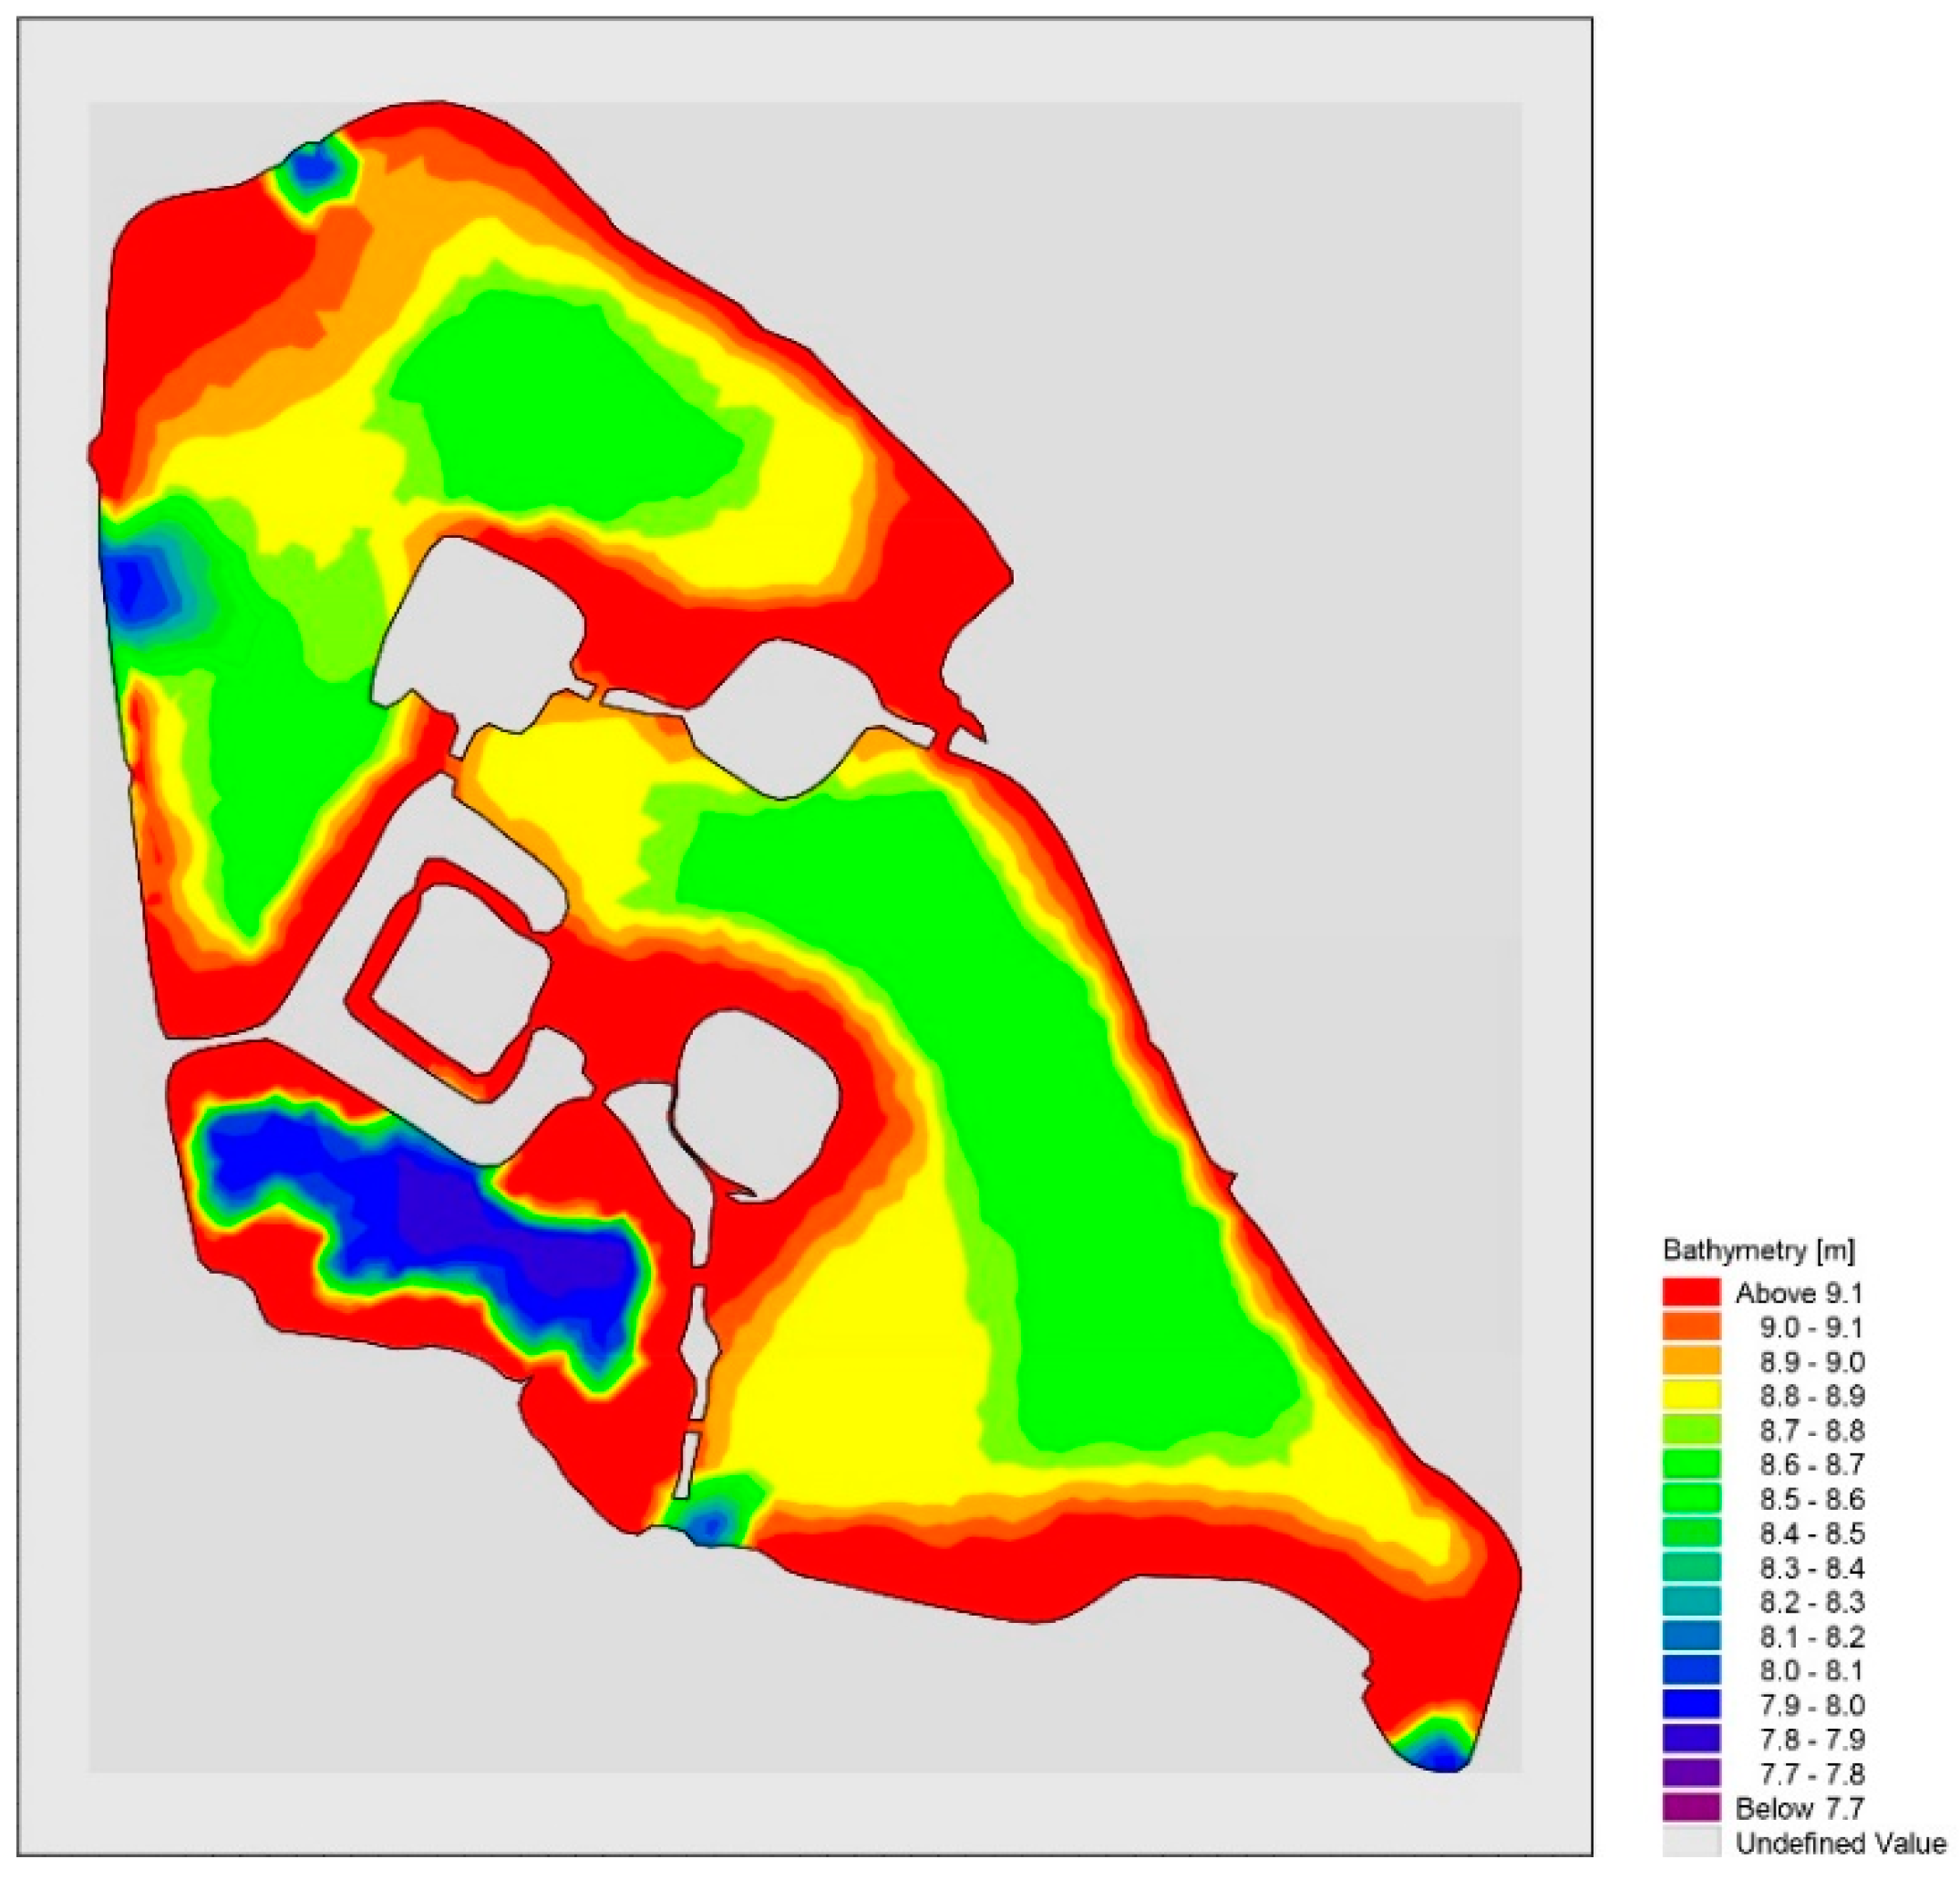
2.3.1. Model Setup
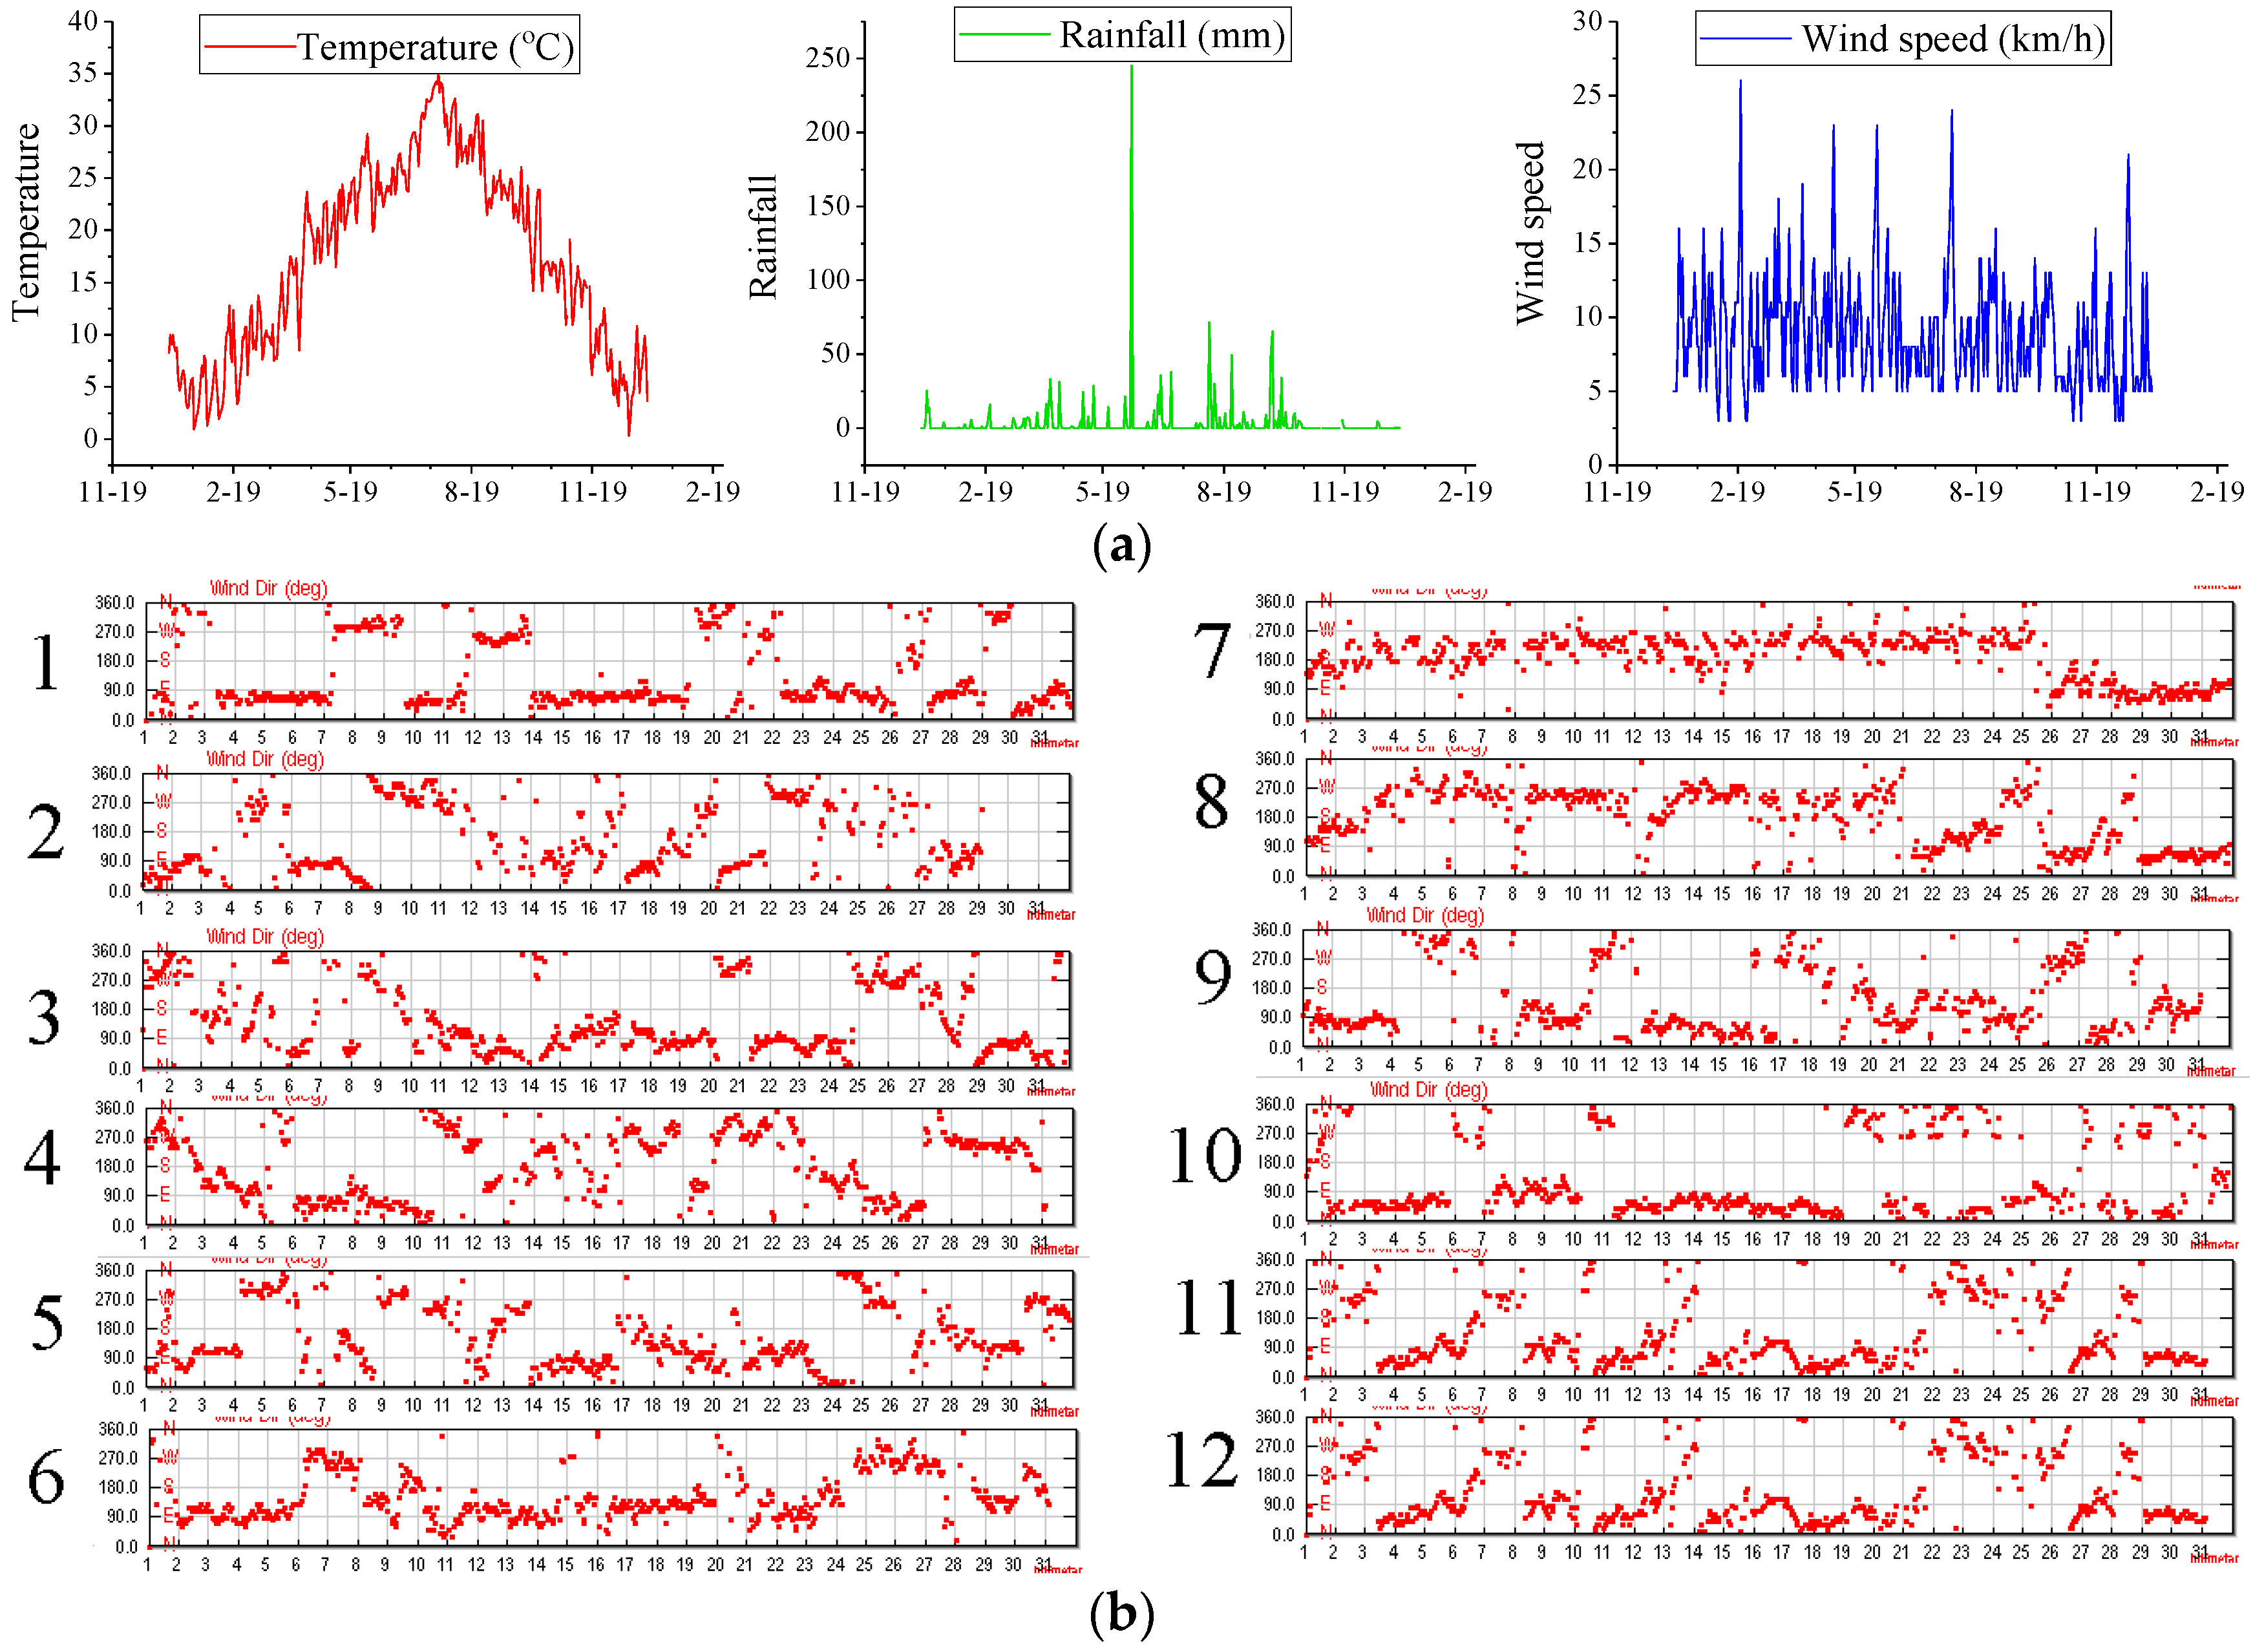
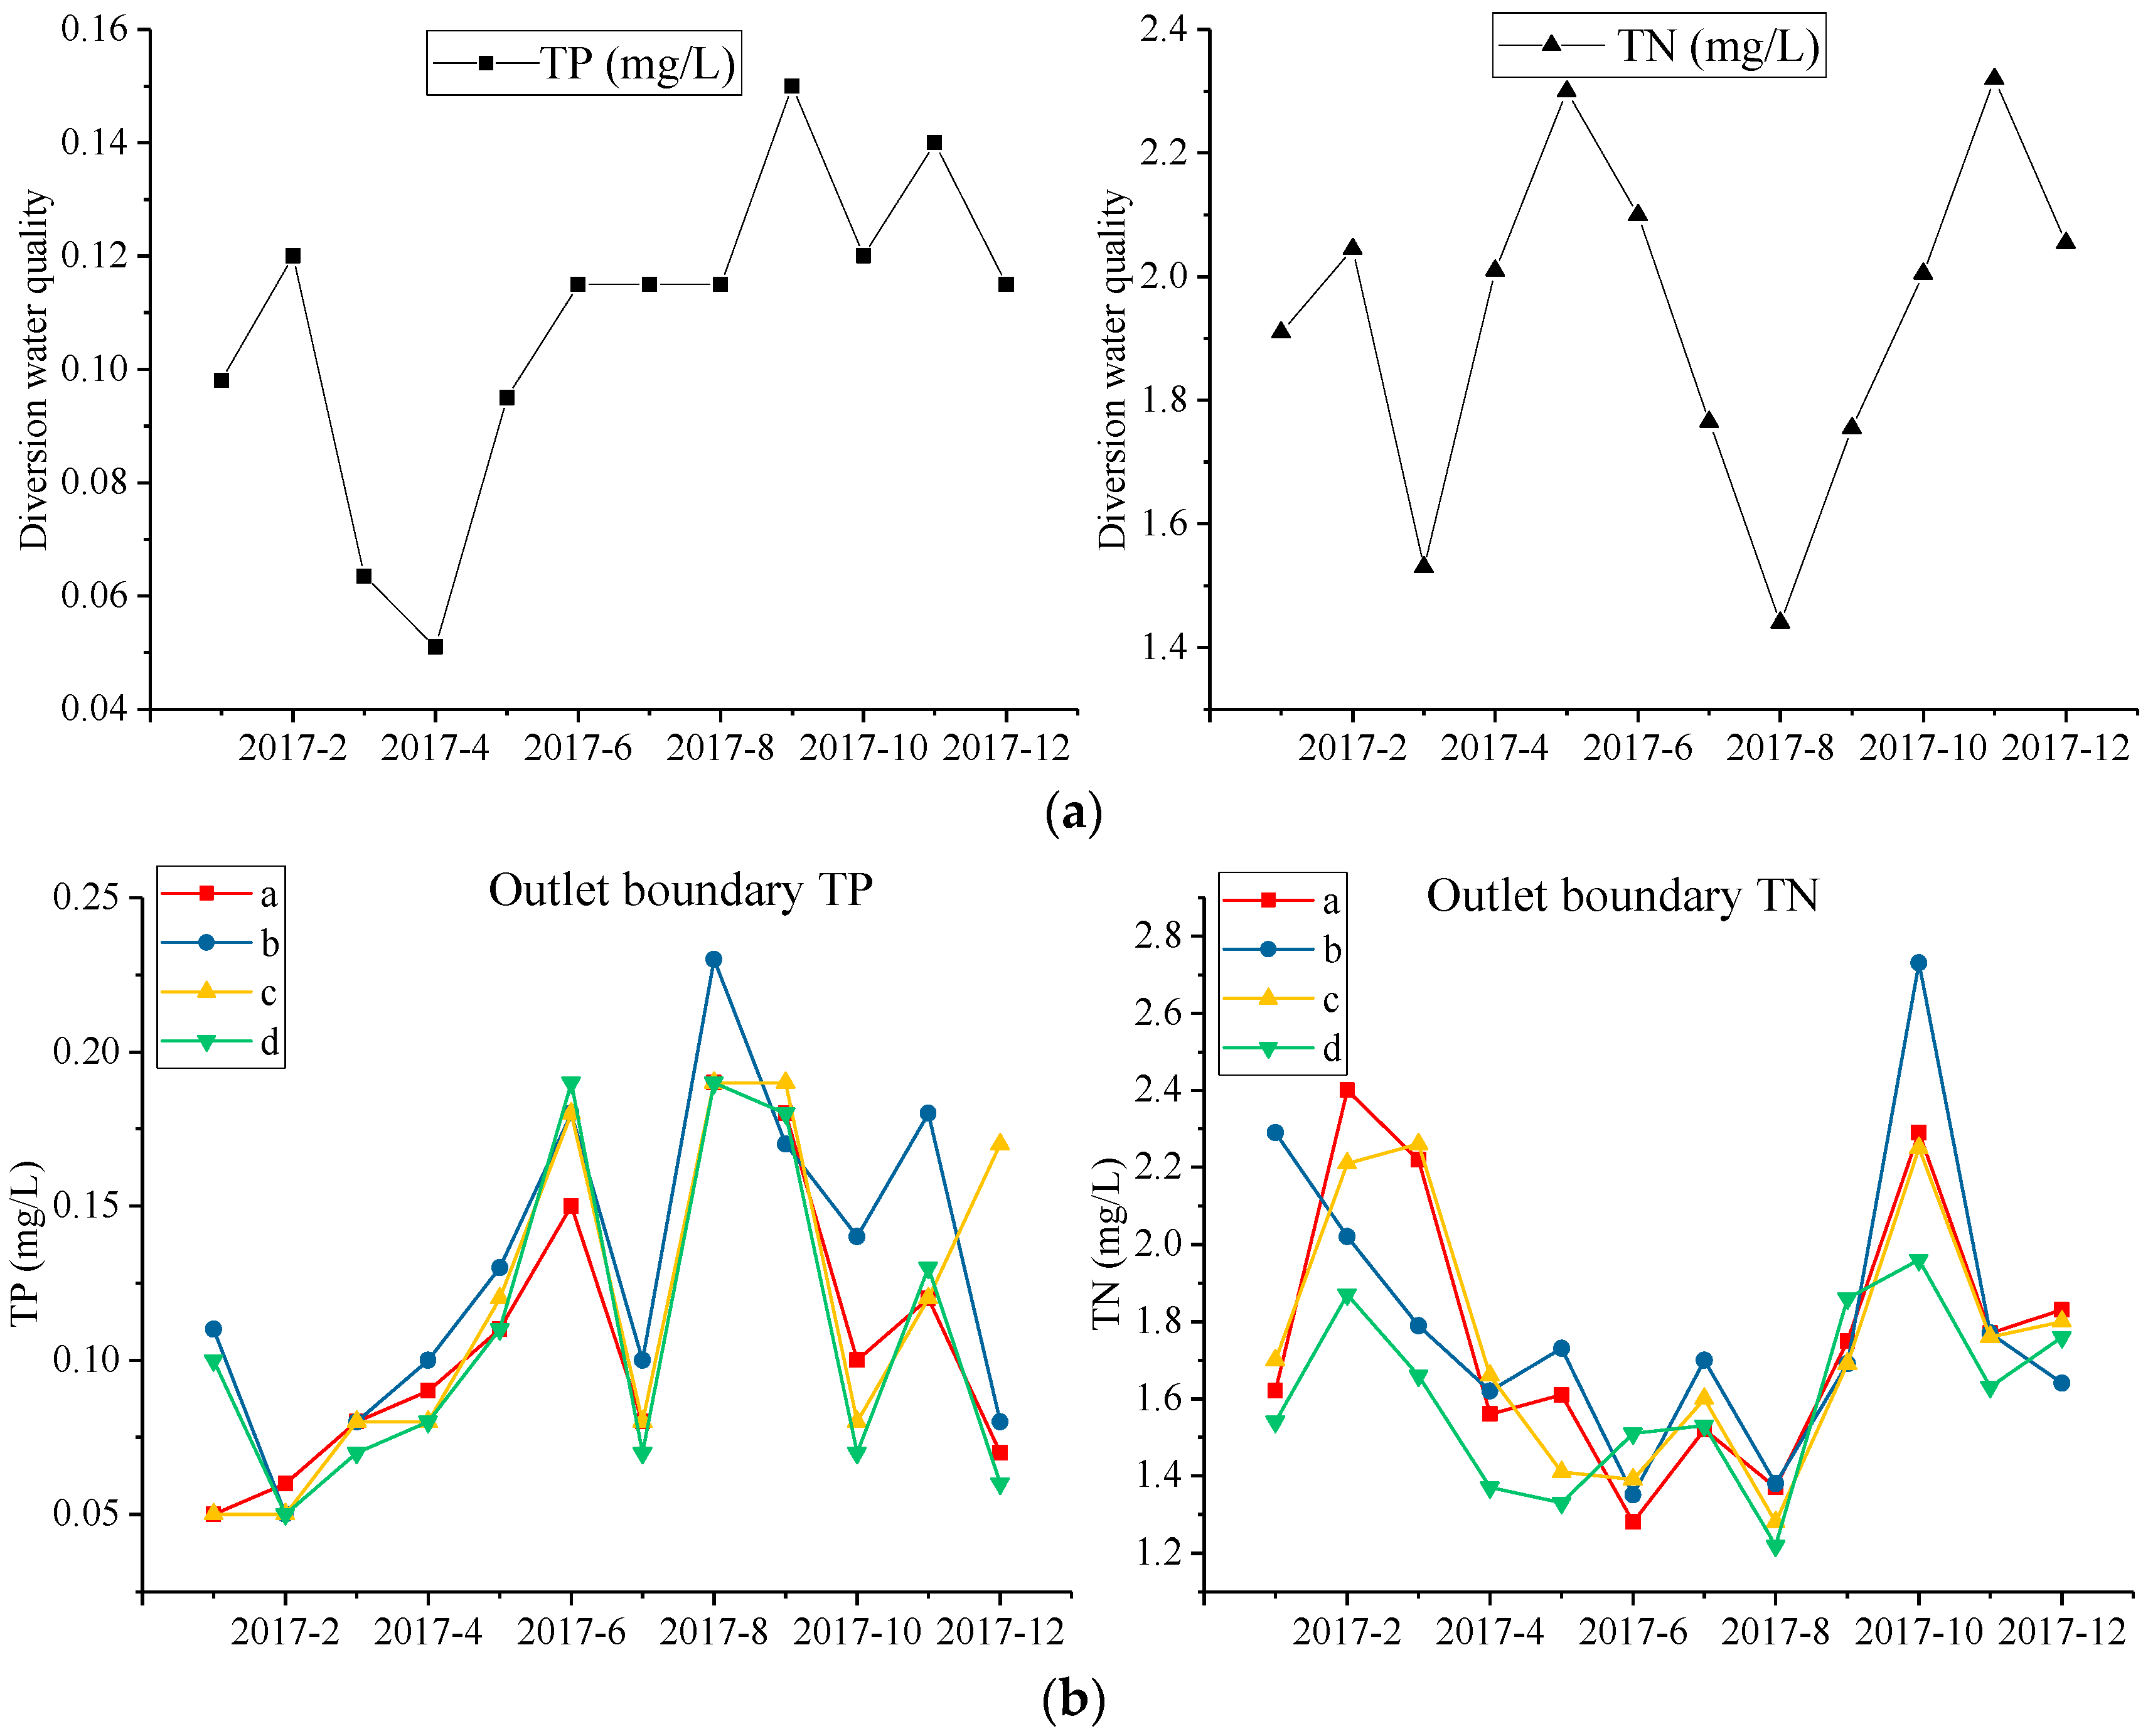
2.3.2. Boundary Conditions
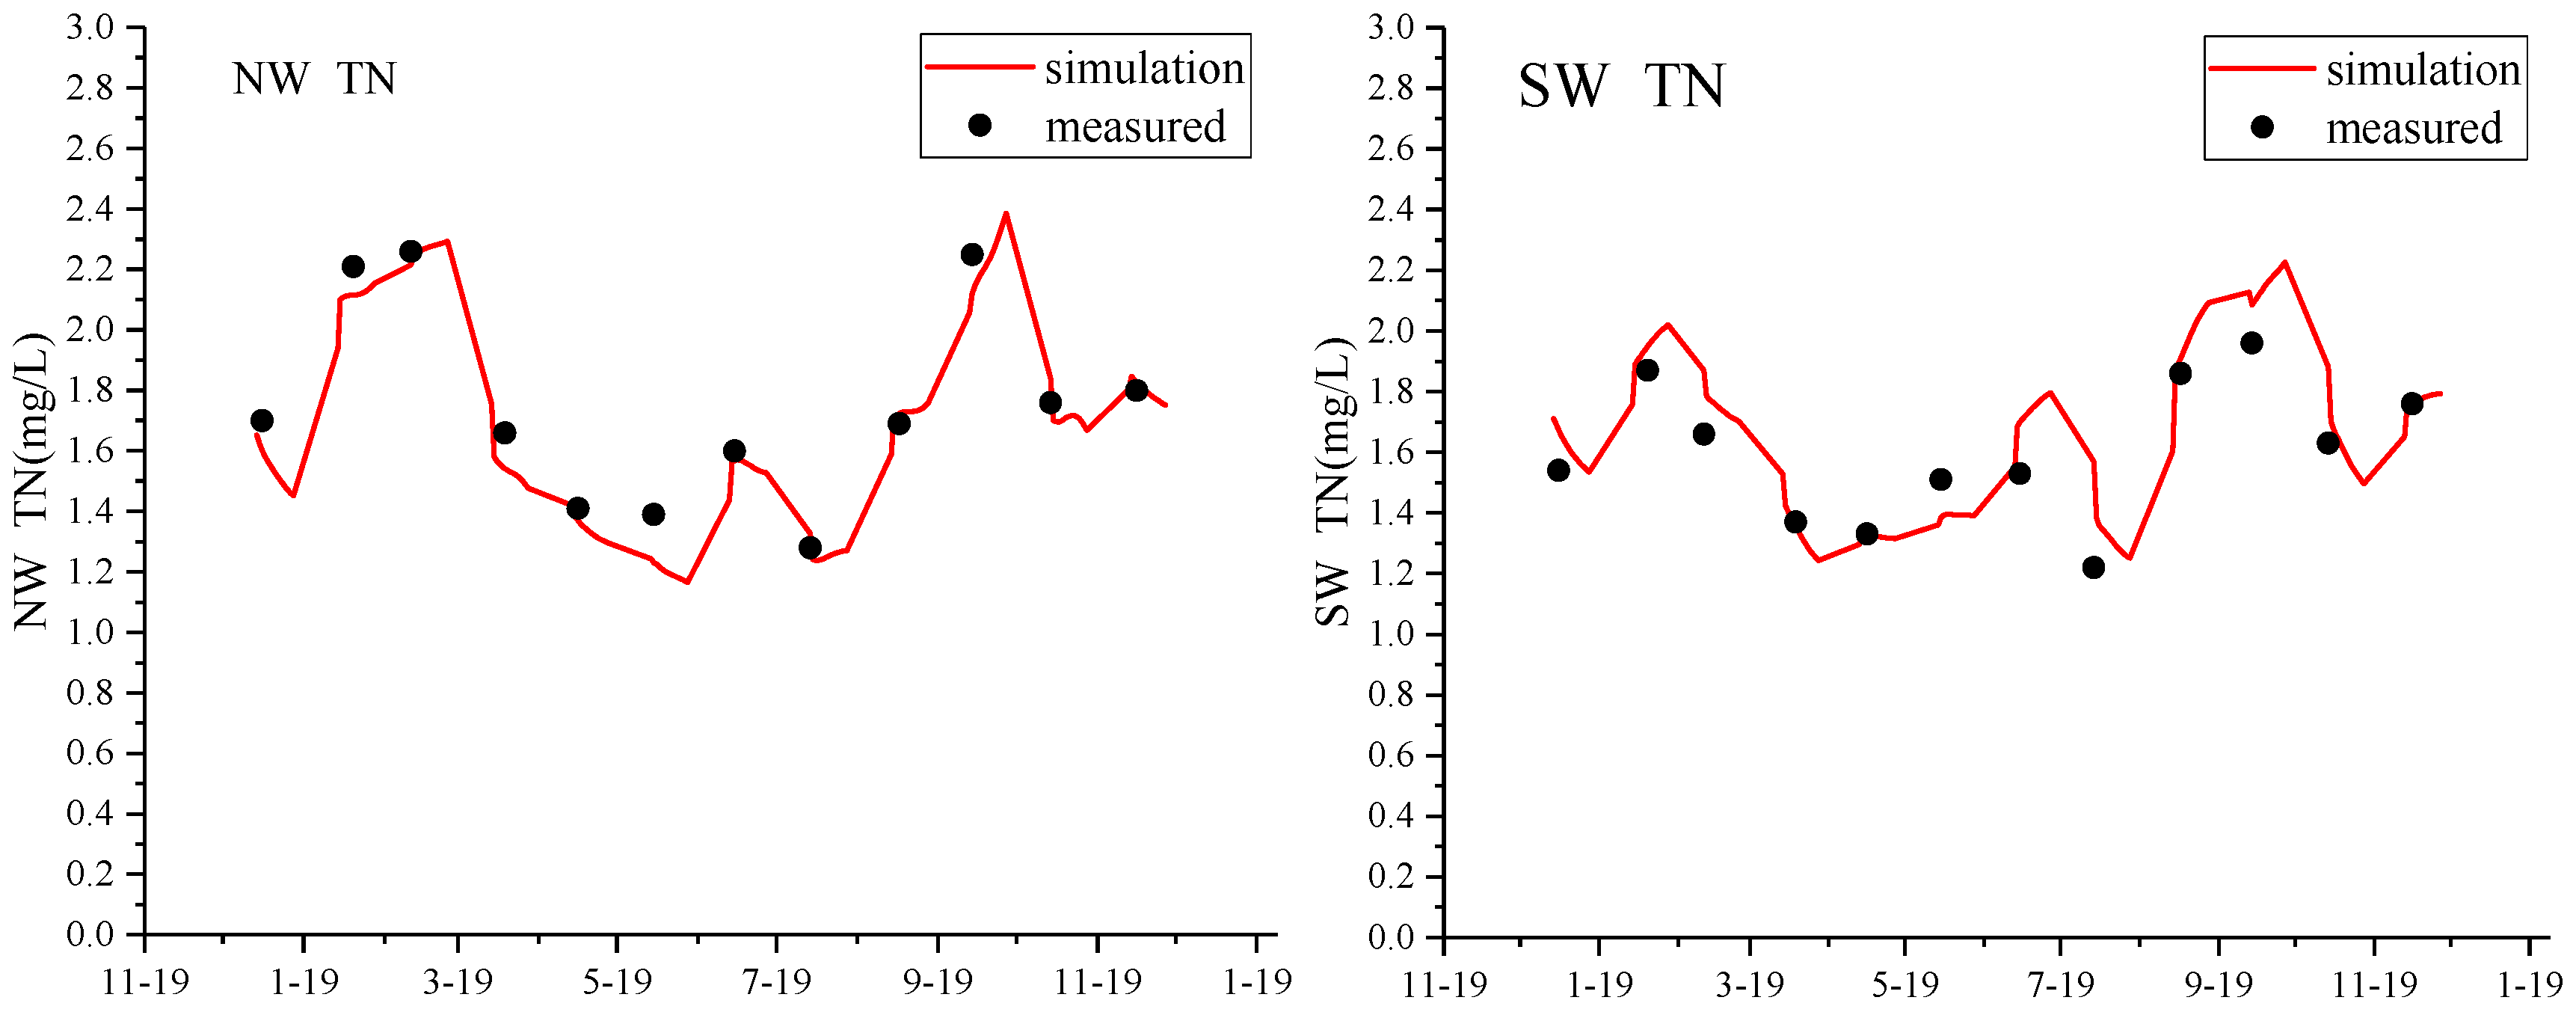
2.3.3. Model Calibration
3. Results and Discussion
3.1. Analysis of the Relationship between Water Diversion and Quality of Xuanwu Lake
3.1.1. Measured Data Analysis
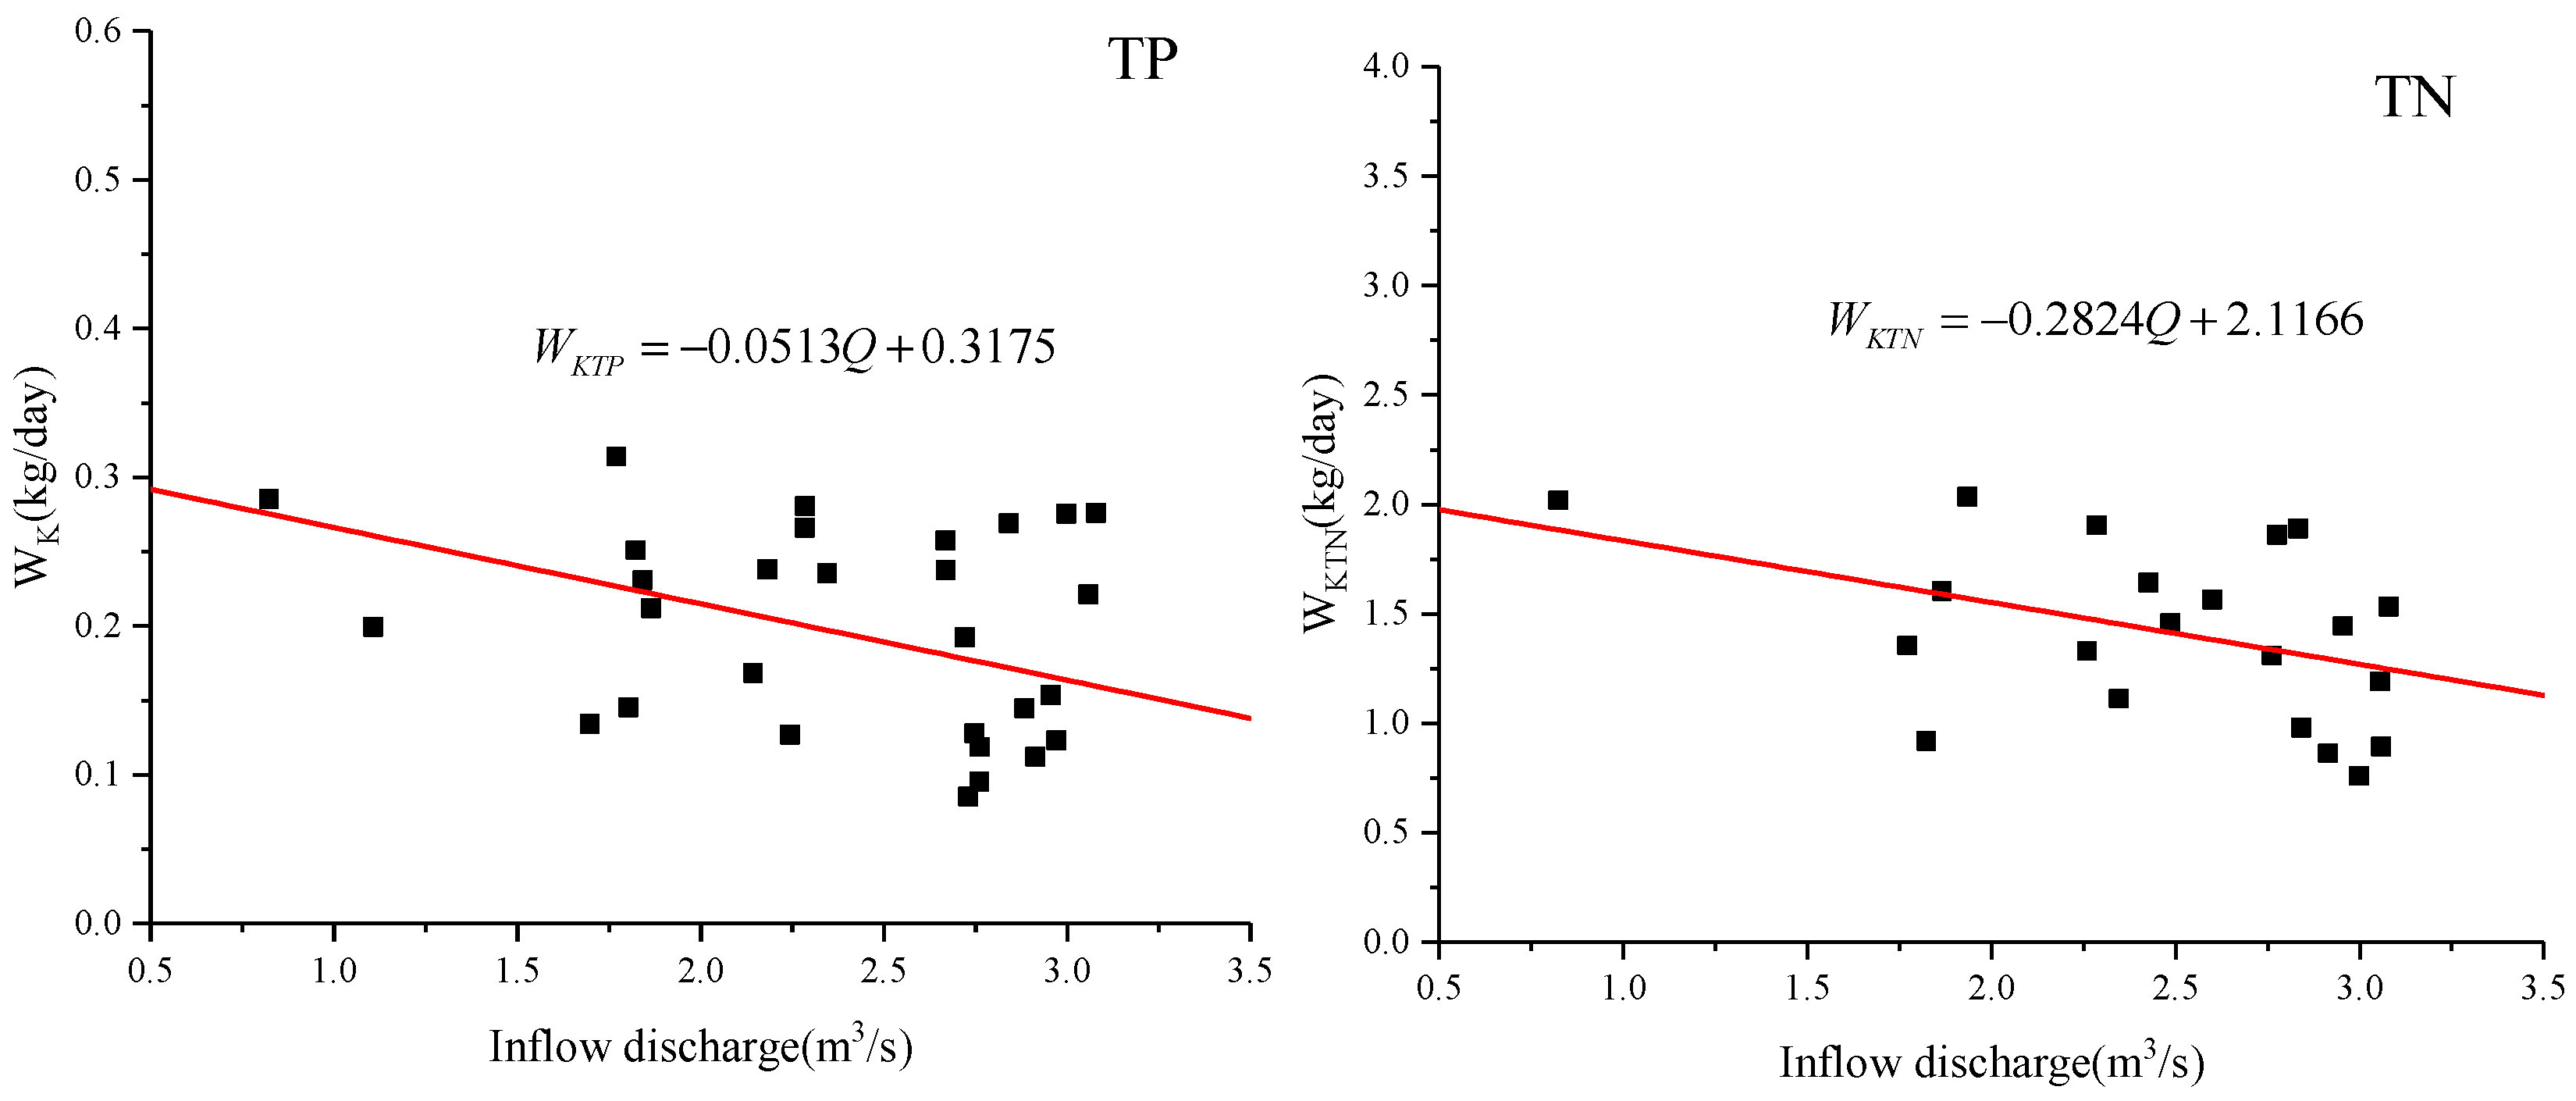
3.1.2. Theoretical Analysis
3.2. Calculation Programs
3.3. Calculation Results
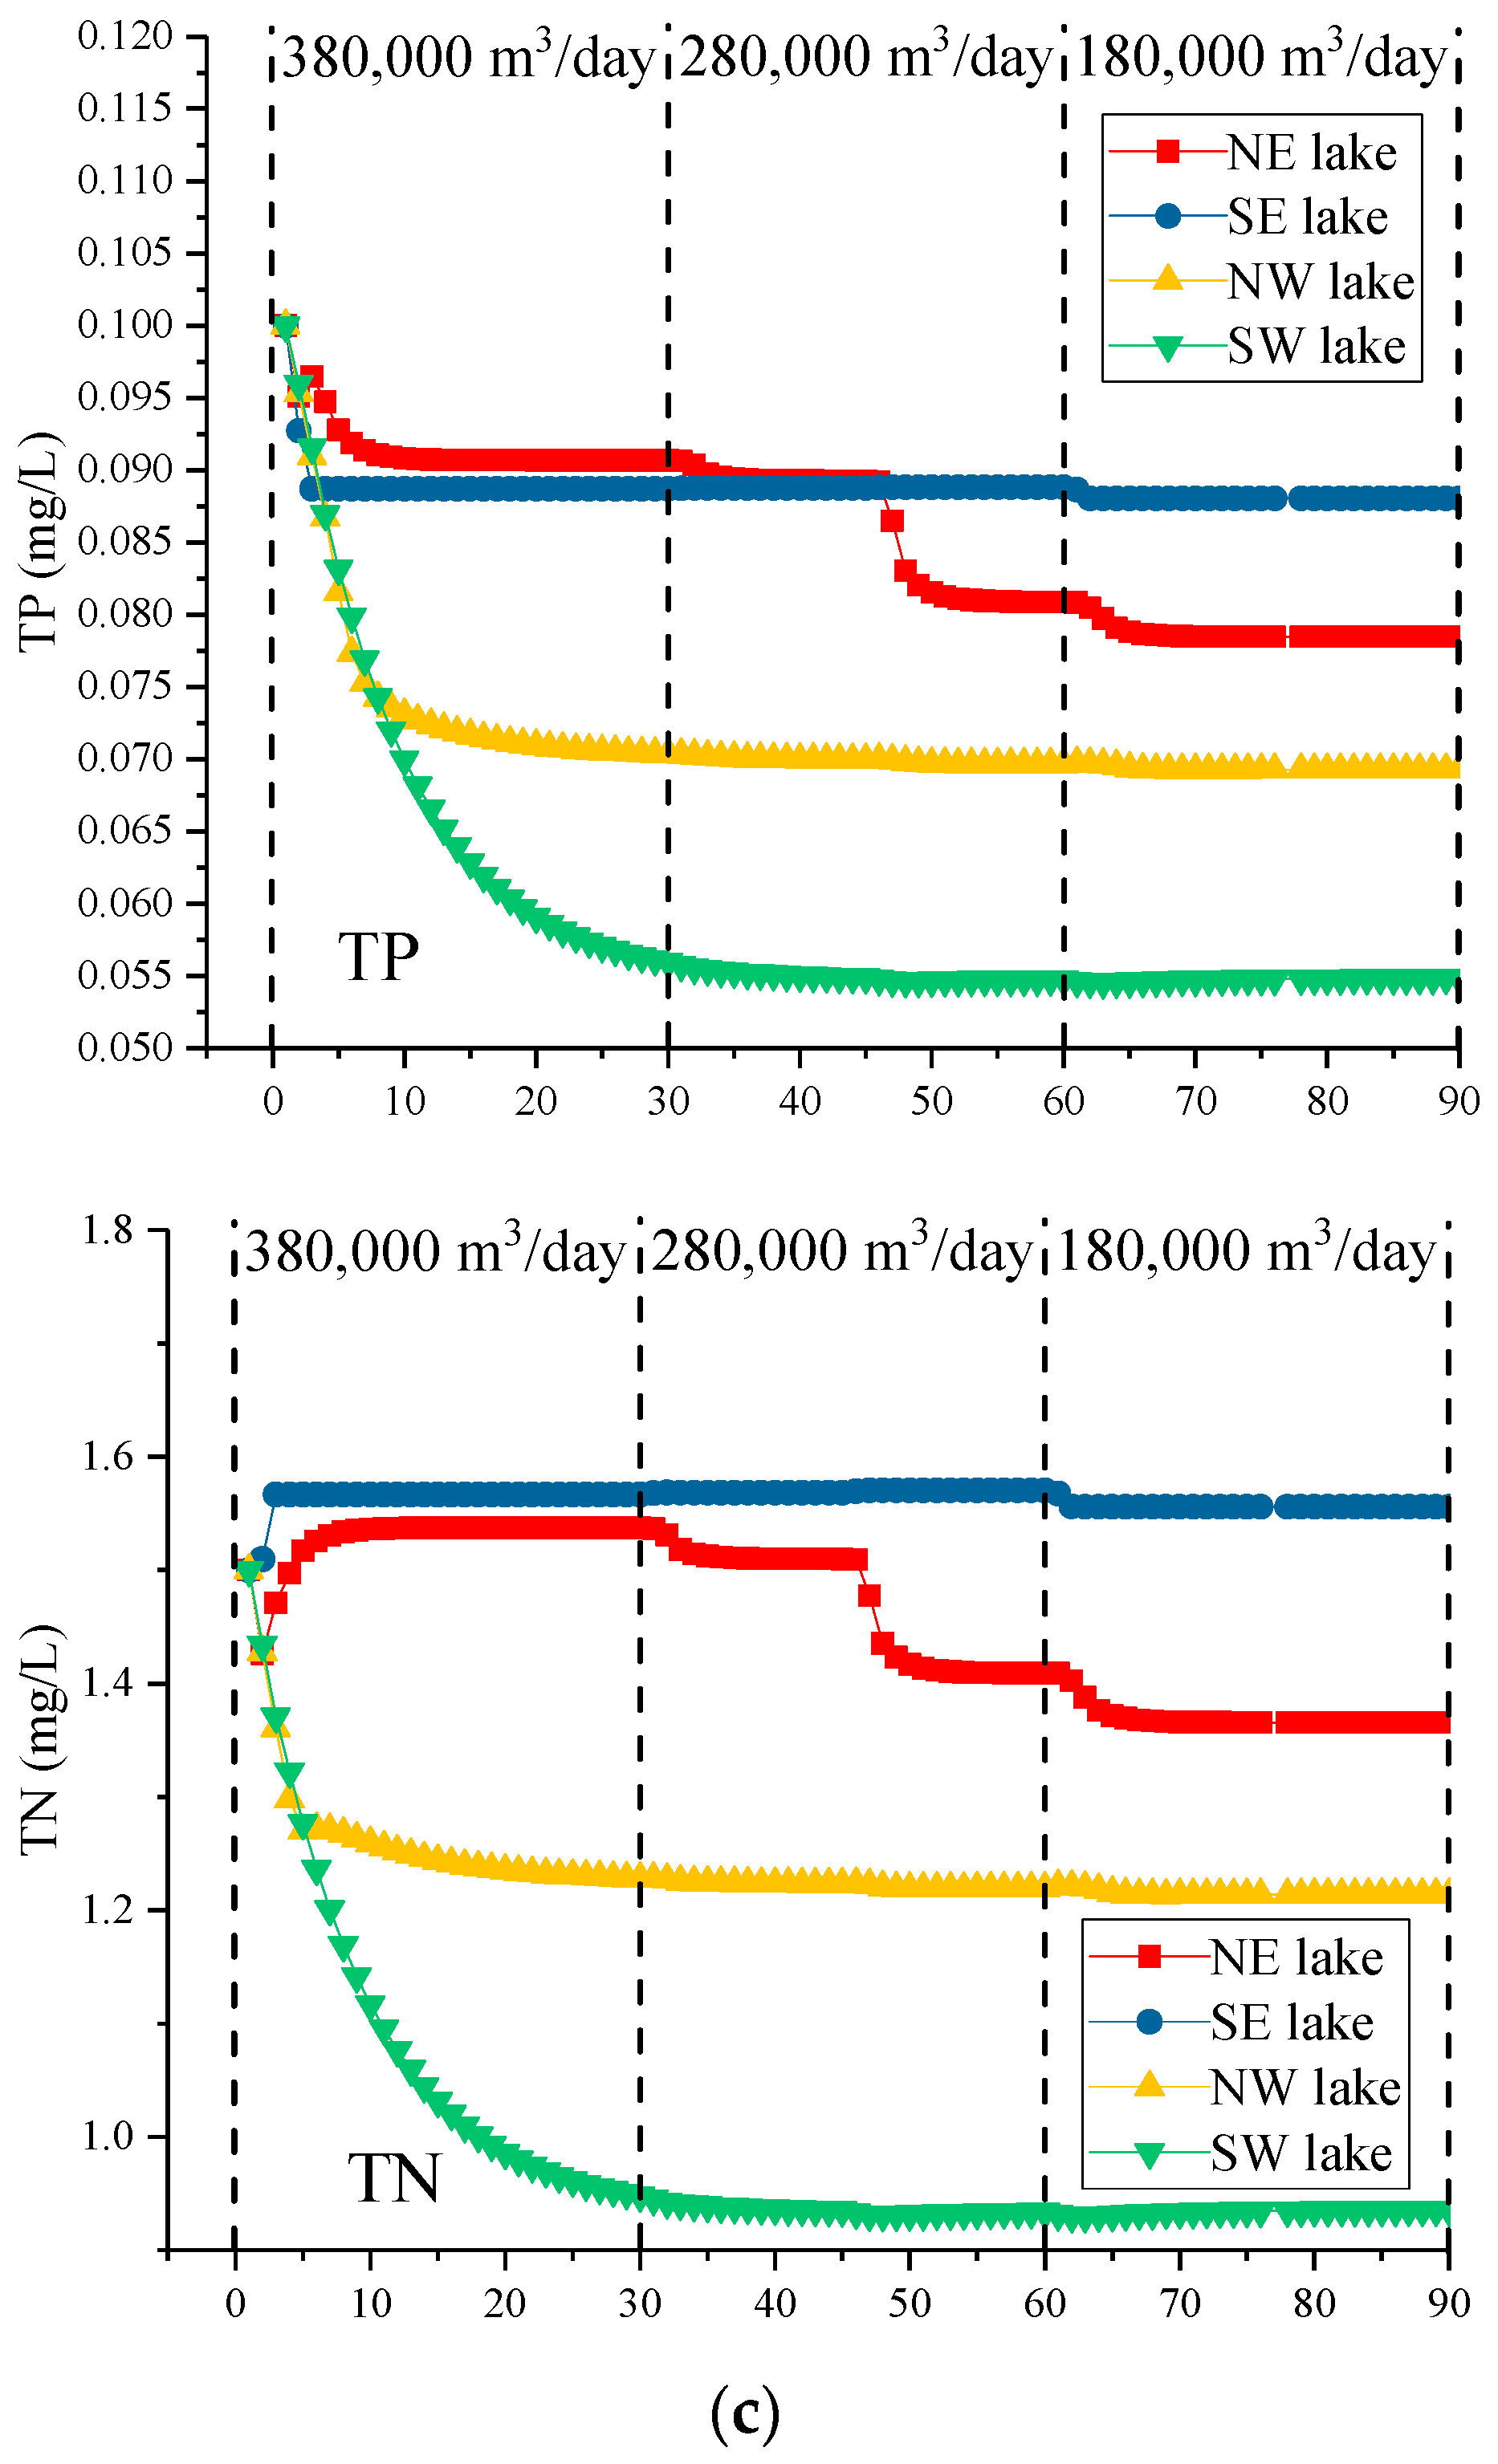
3.3.1. Water Diversion without Wind
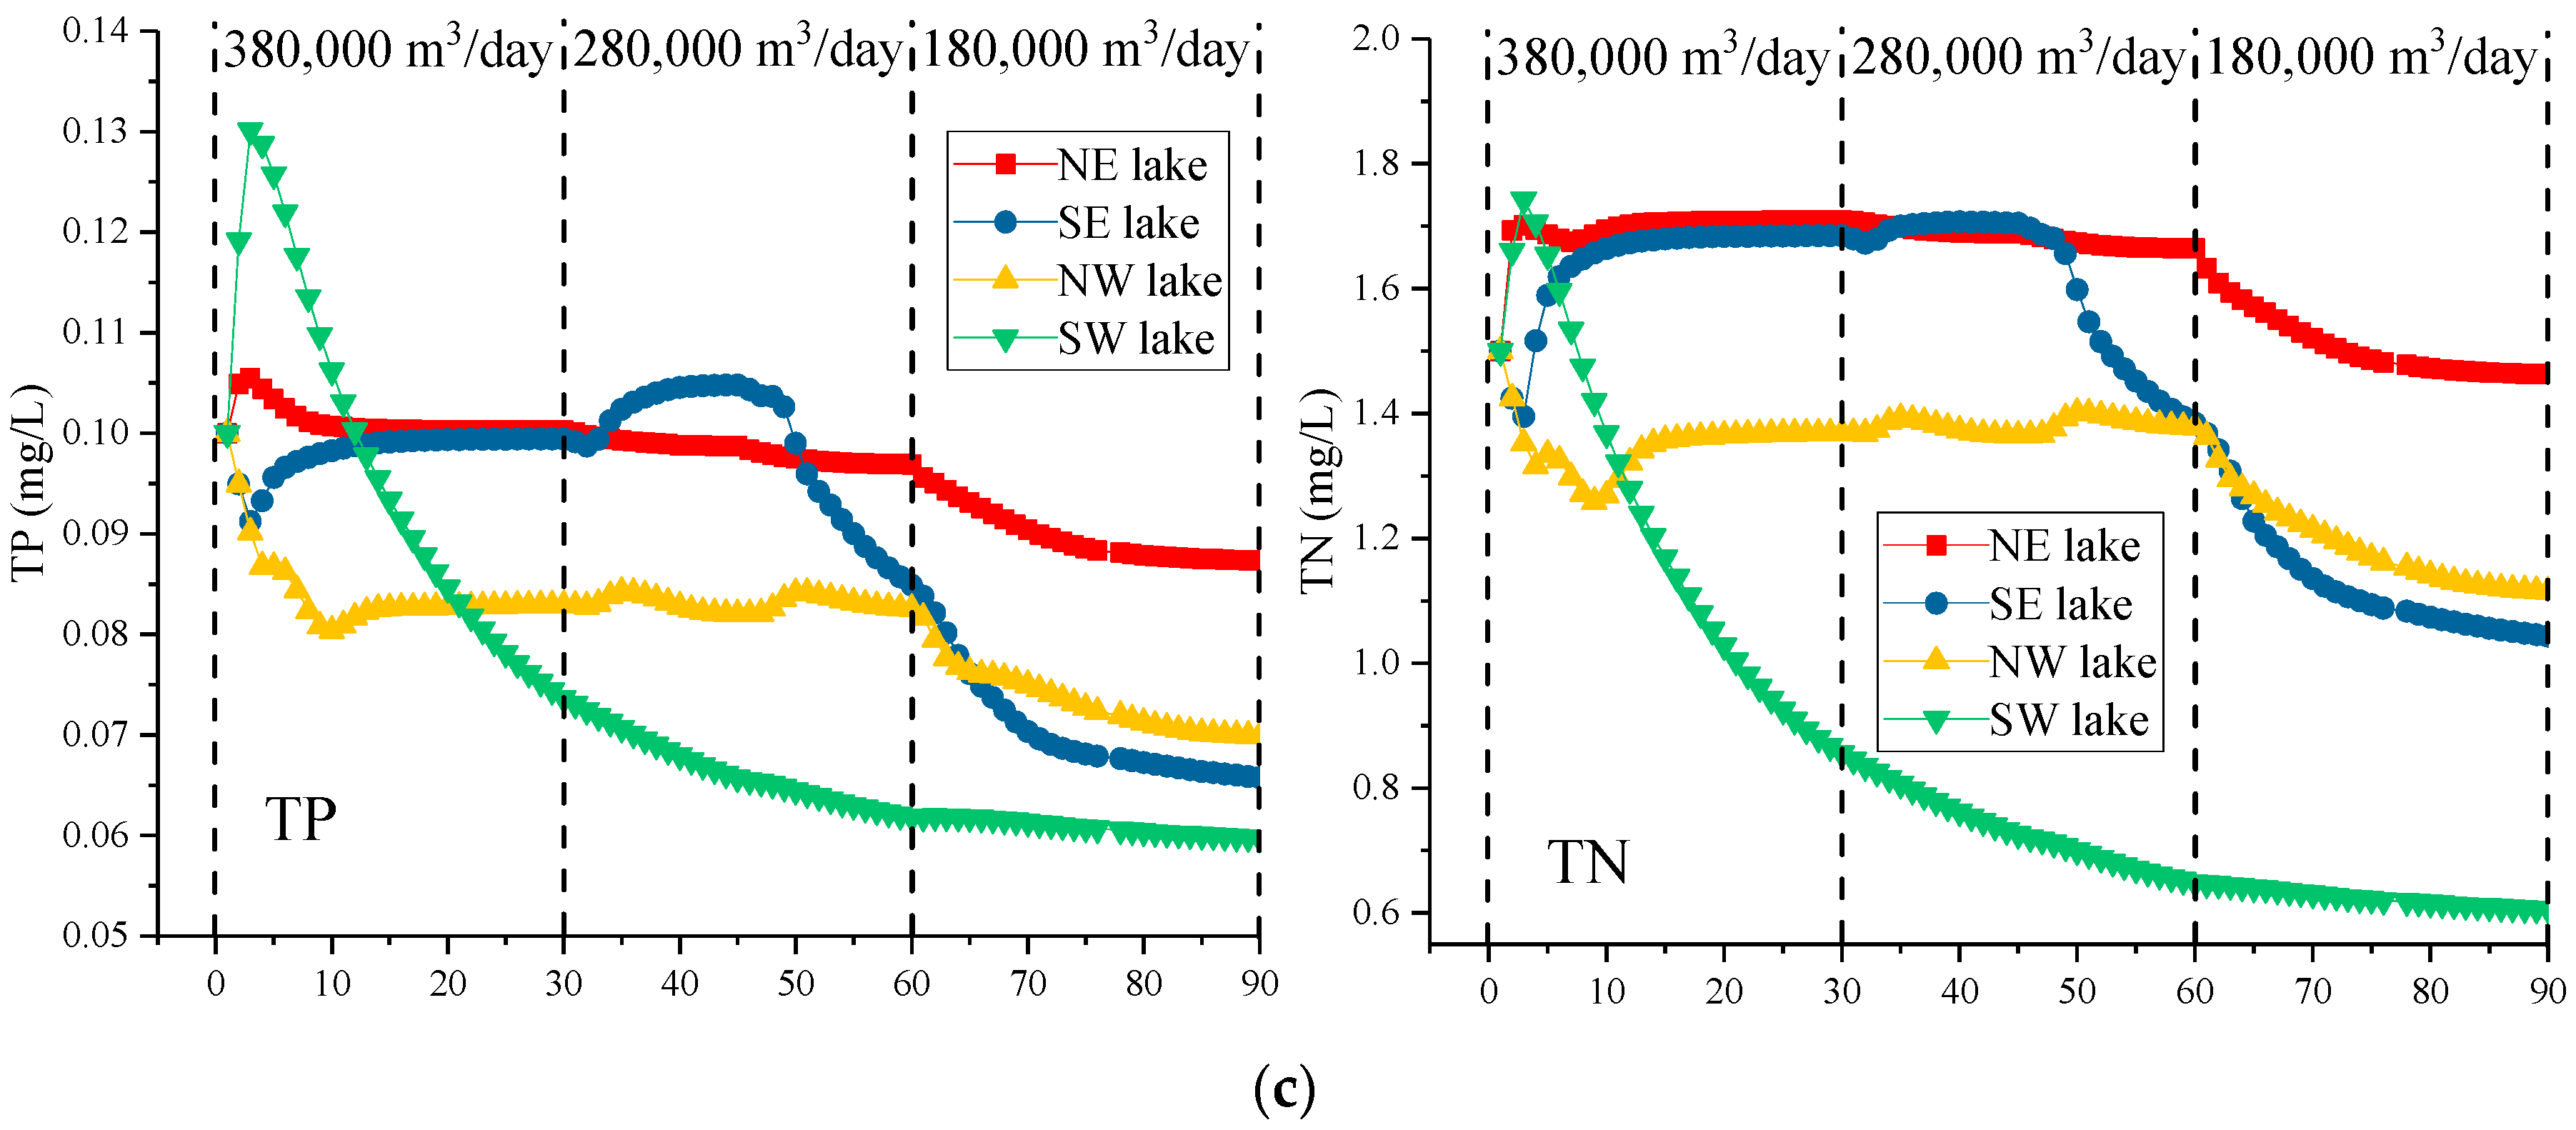
3.3.2. Water Diversion with Southeast Wind
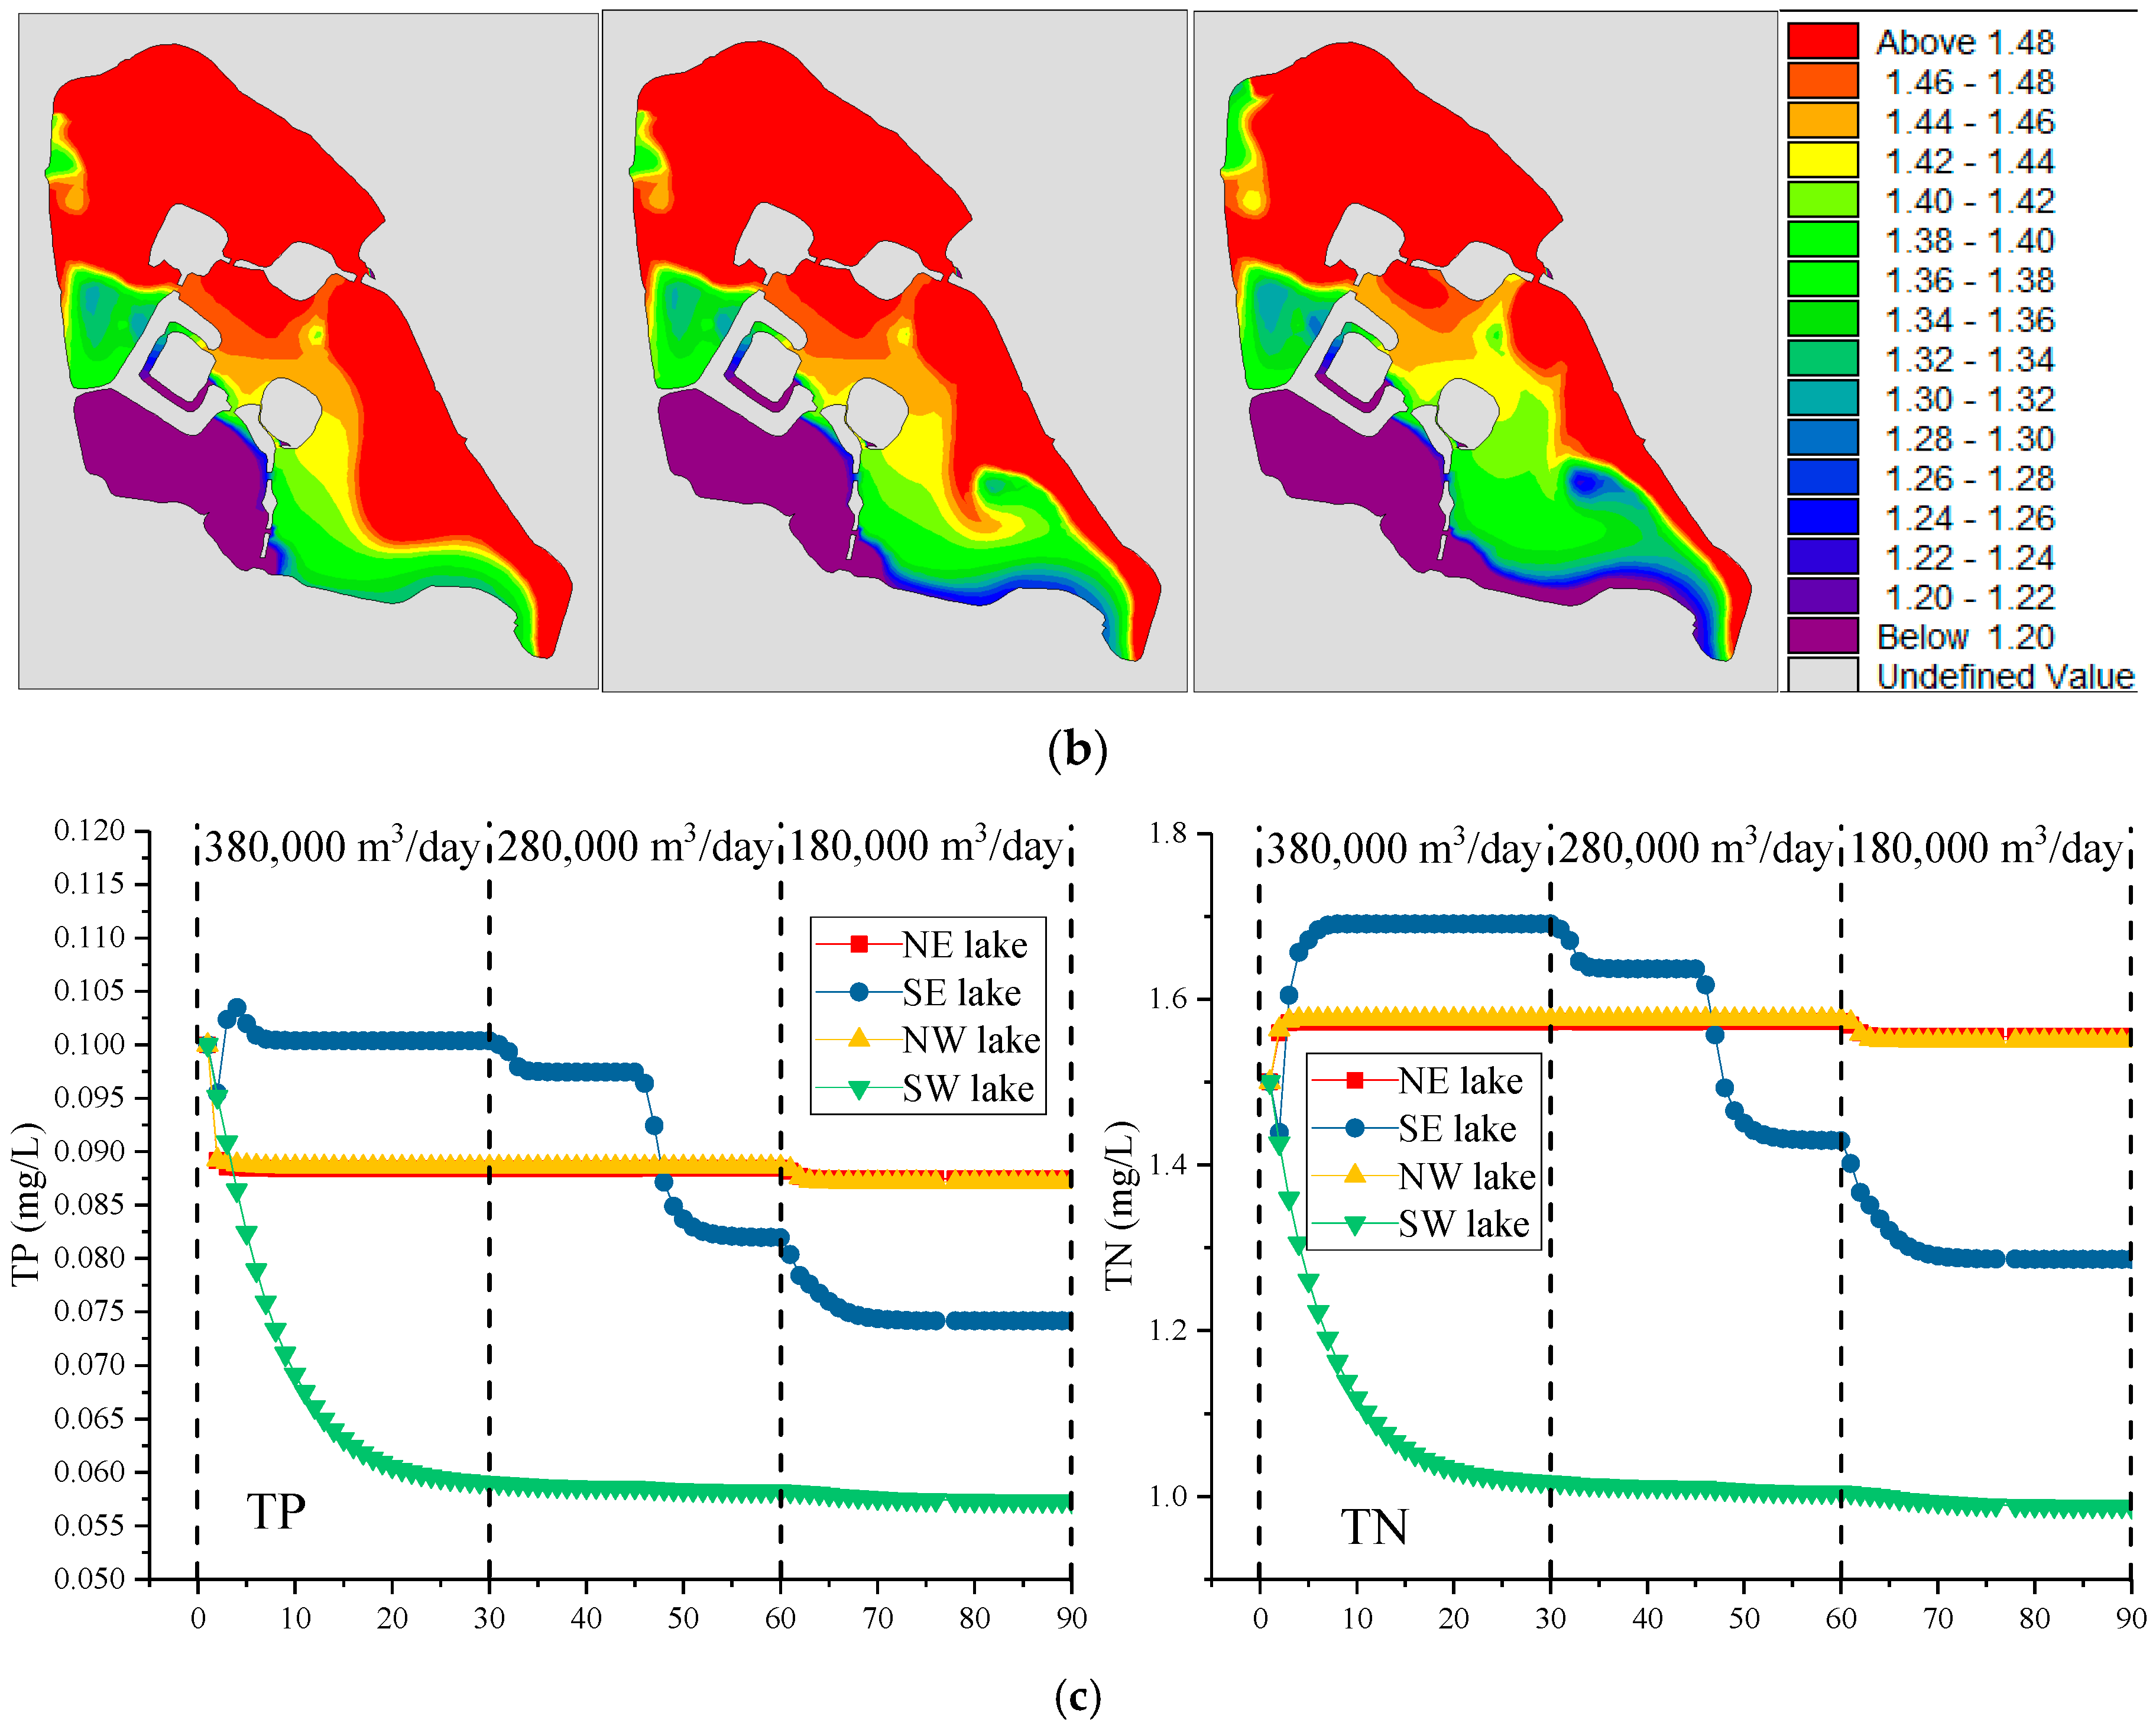
3.3.3. Water Diversion with Northwest Wind
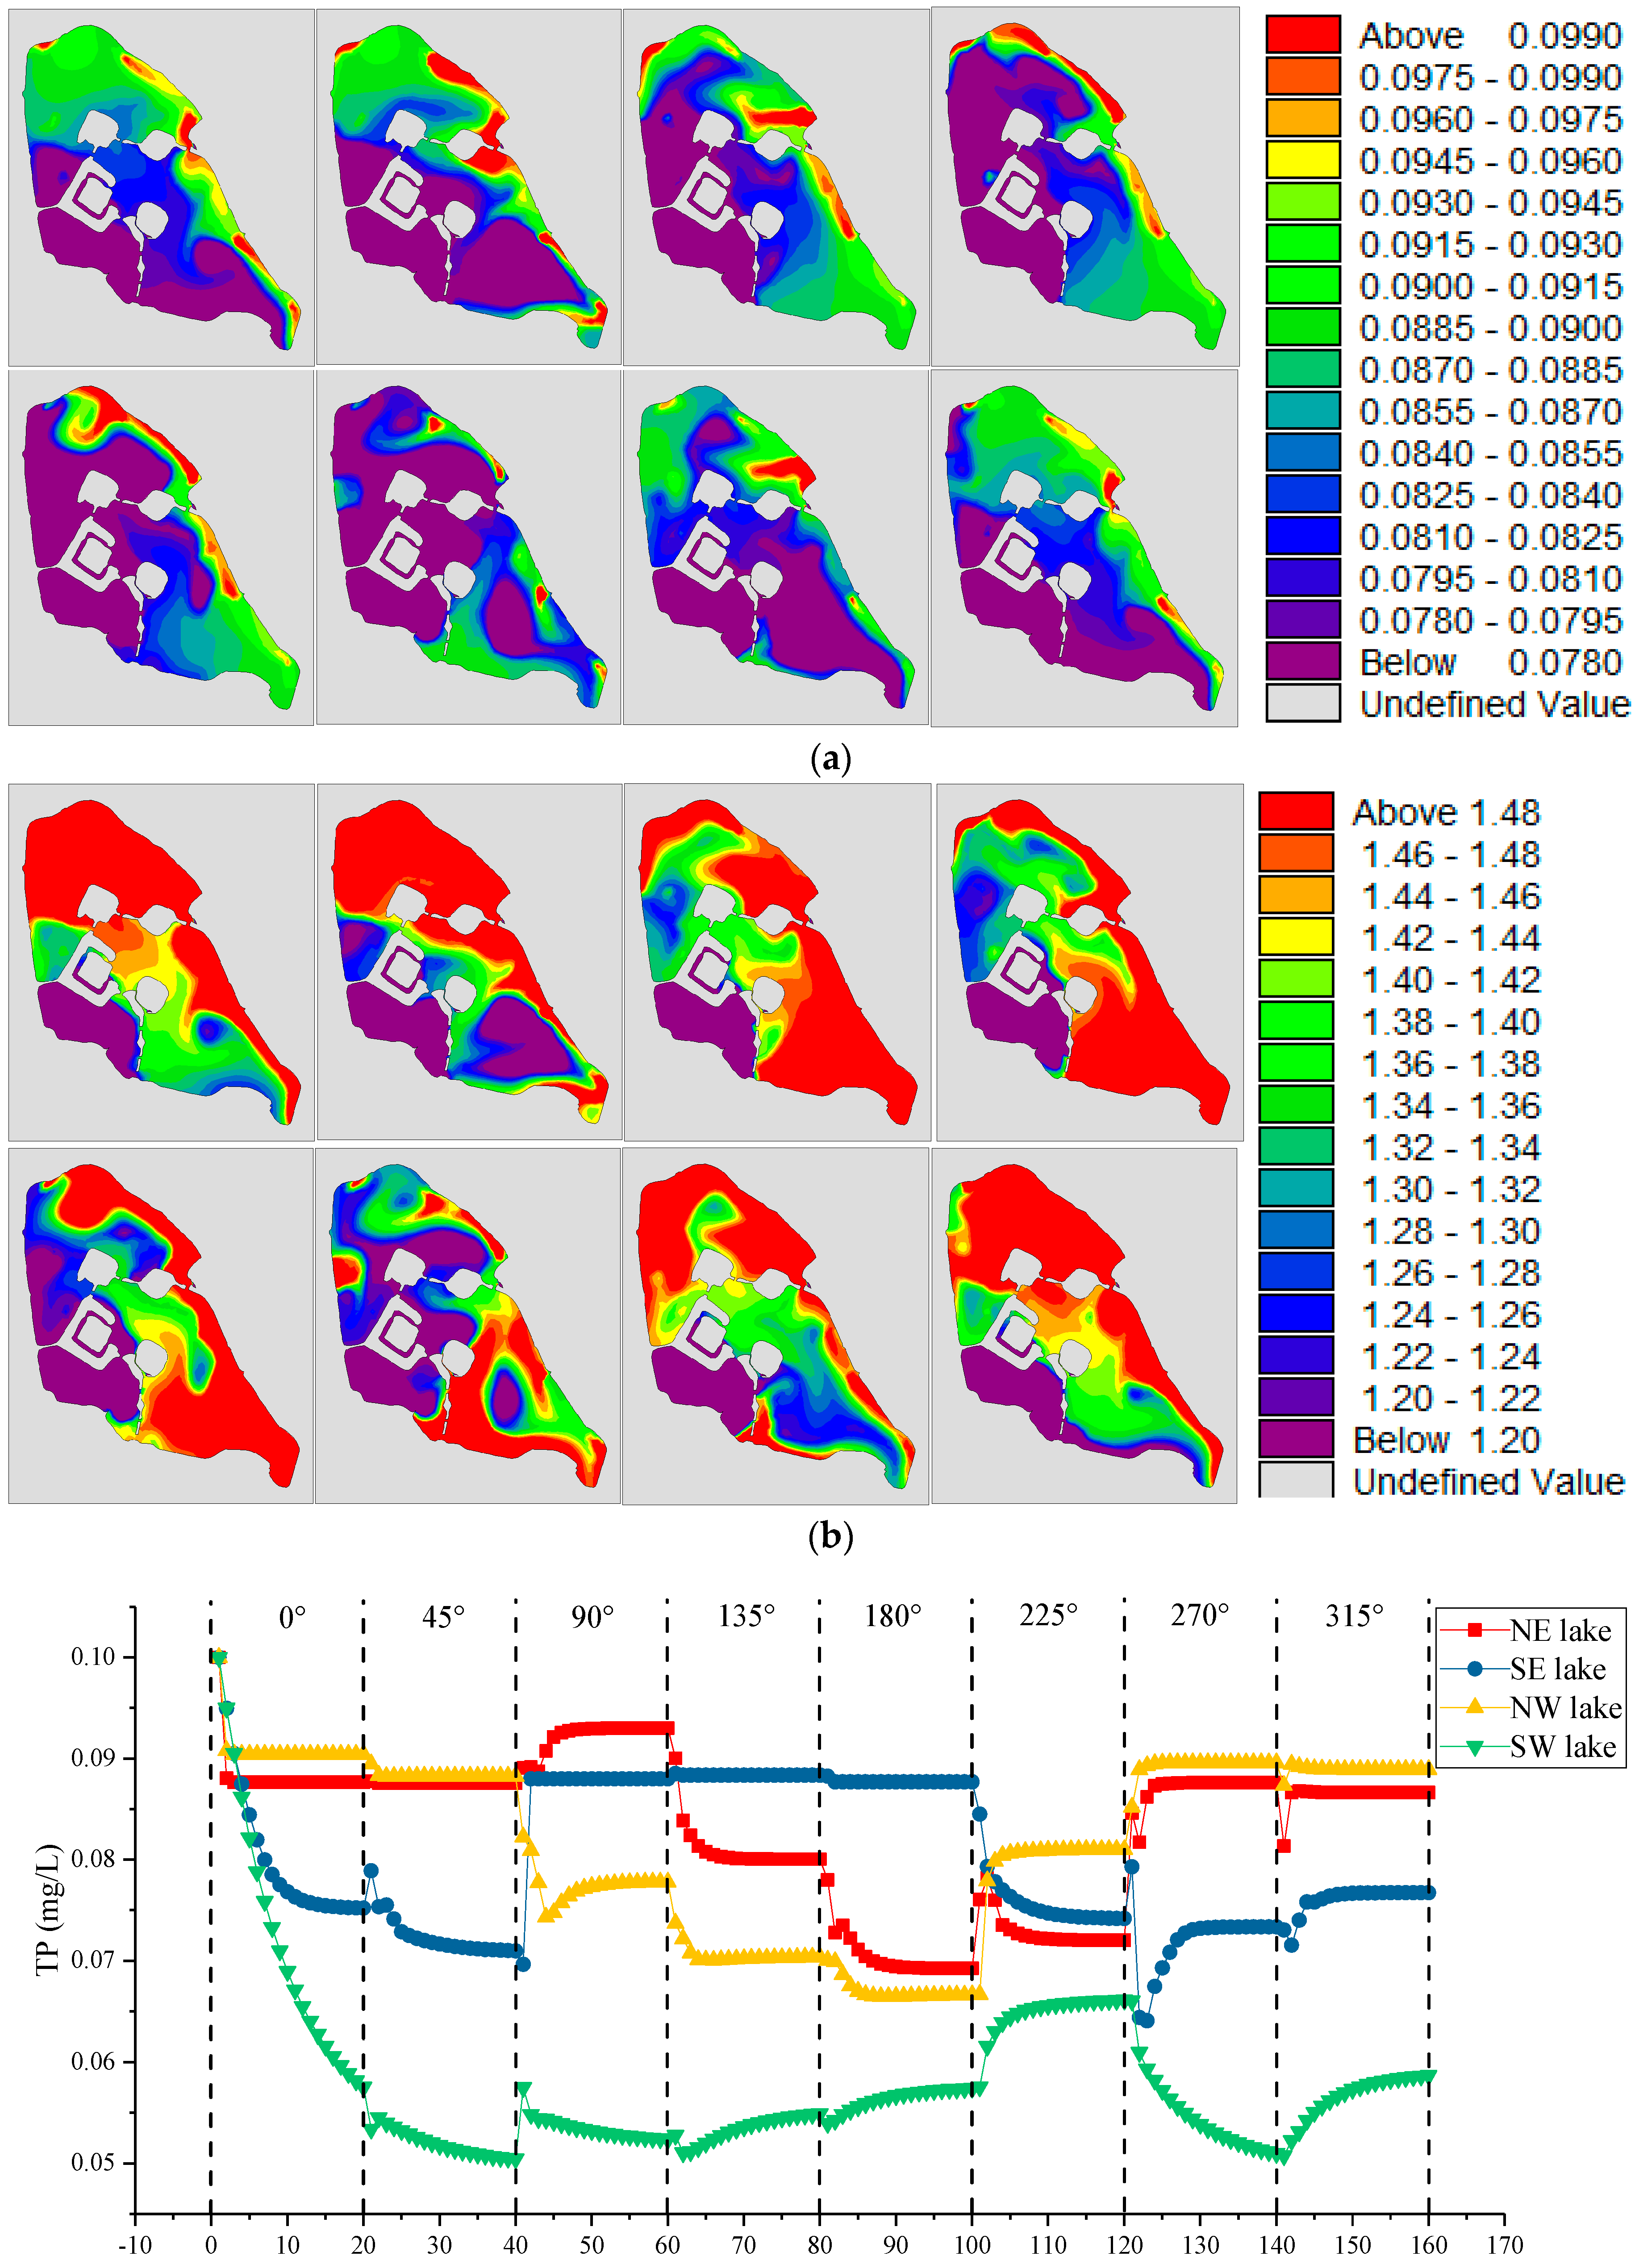
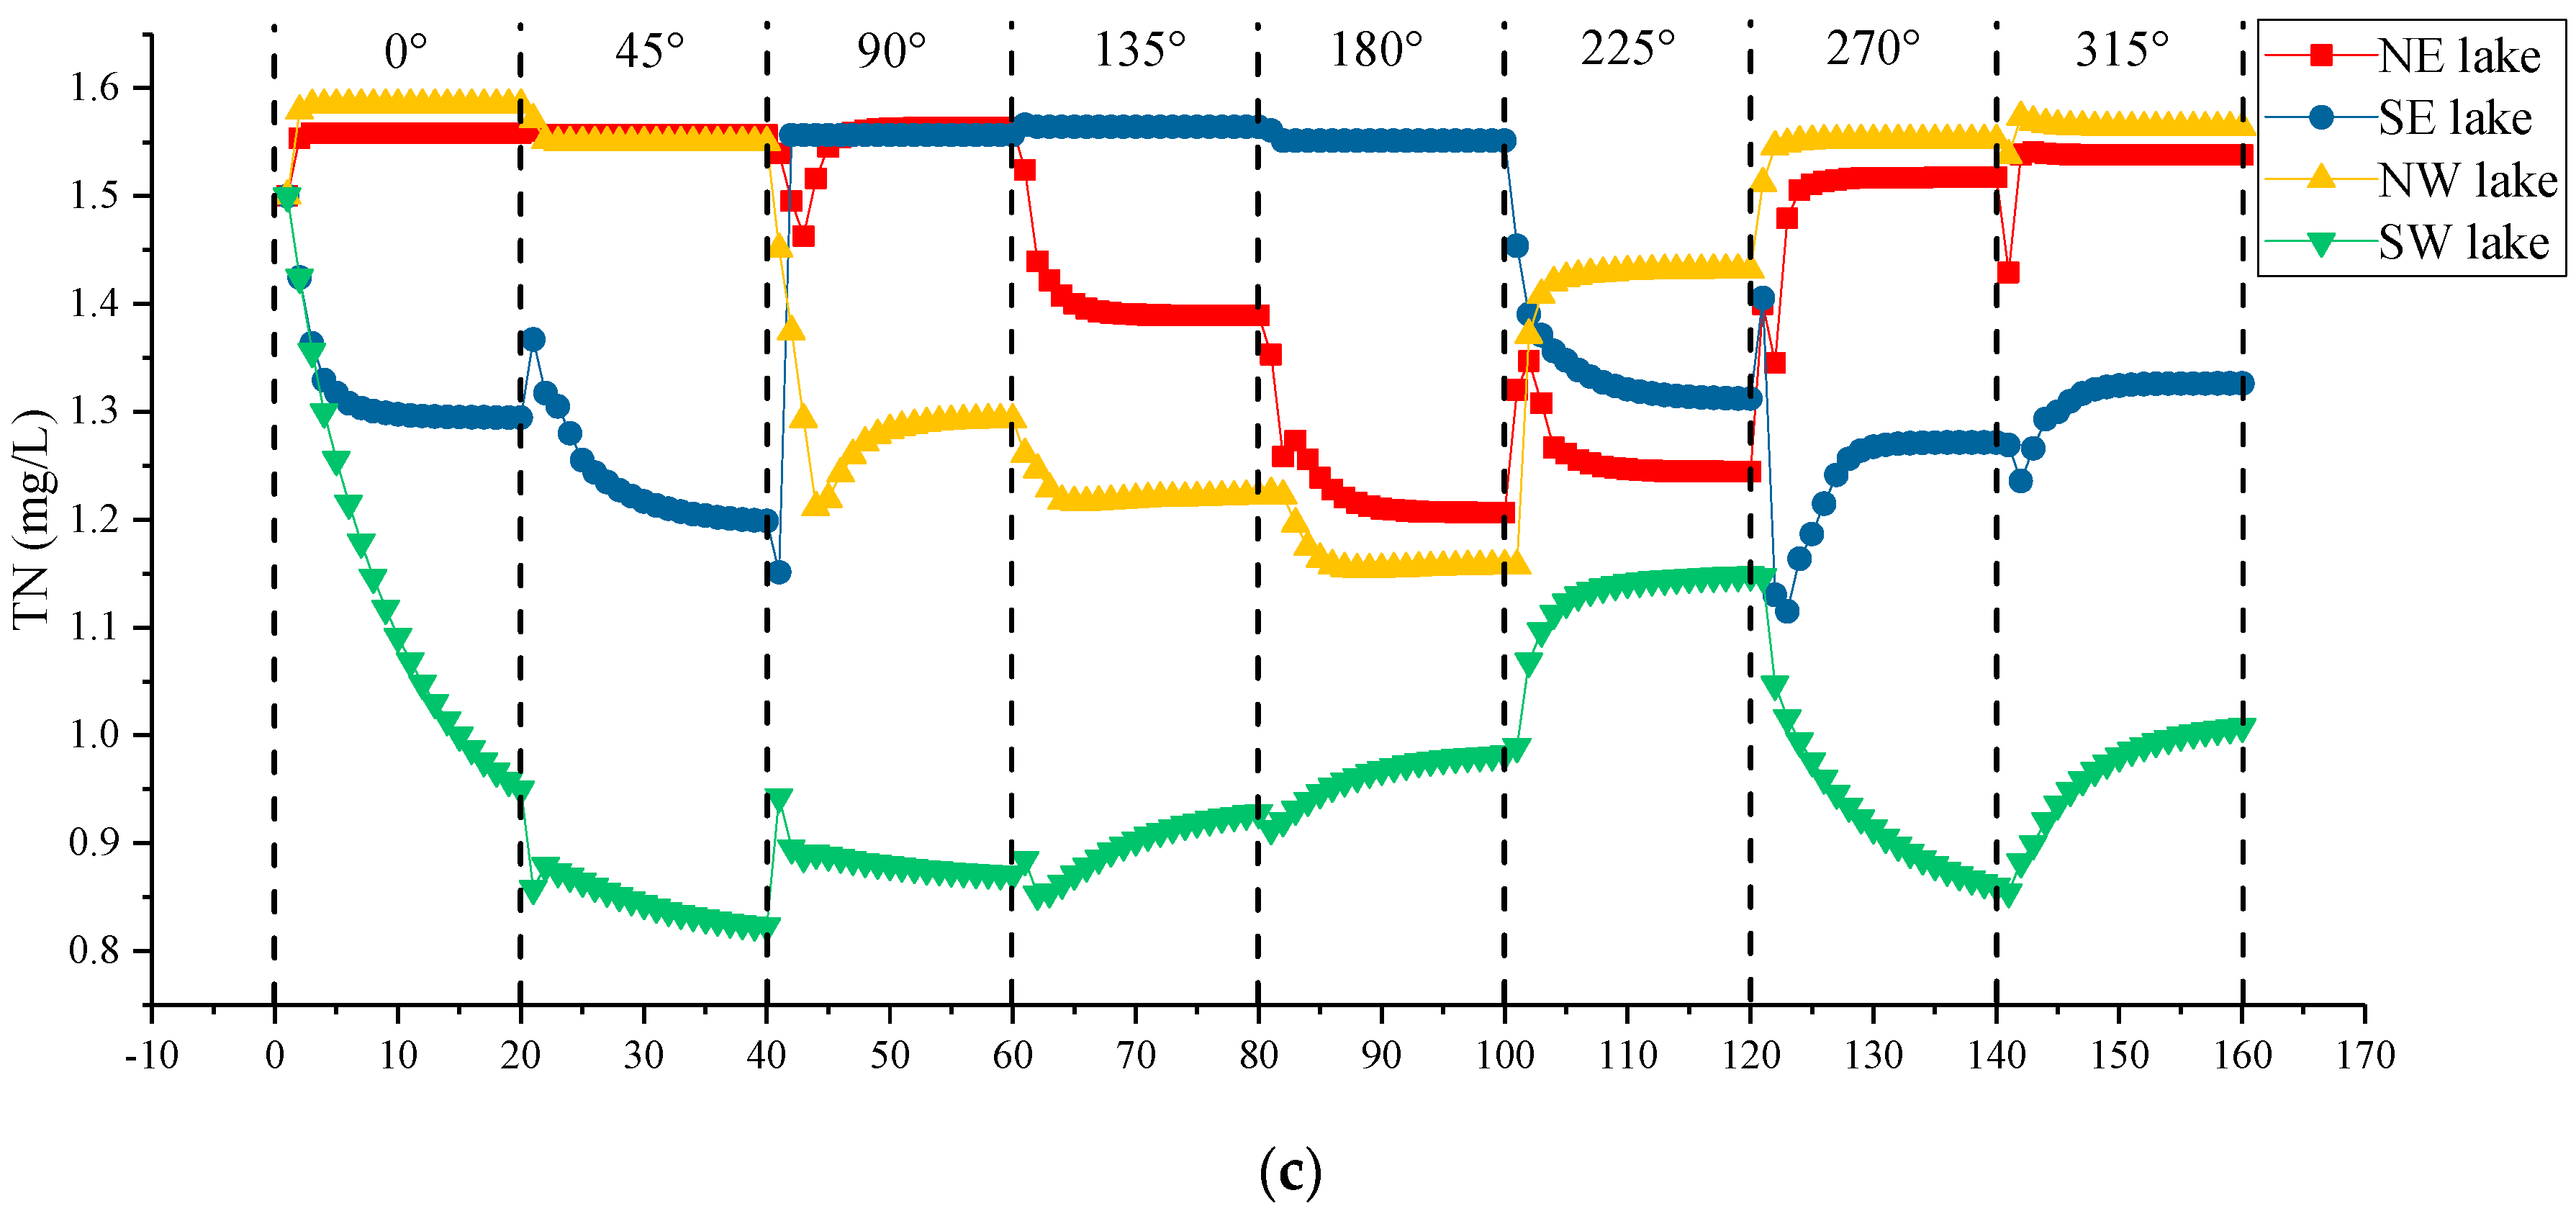
3.3.4. Water Diversion with Different Directions of Wind
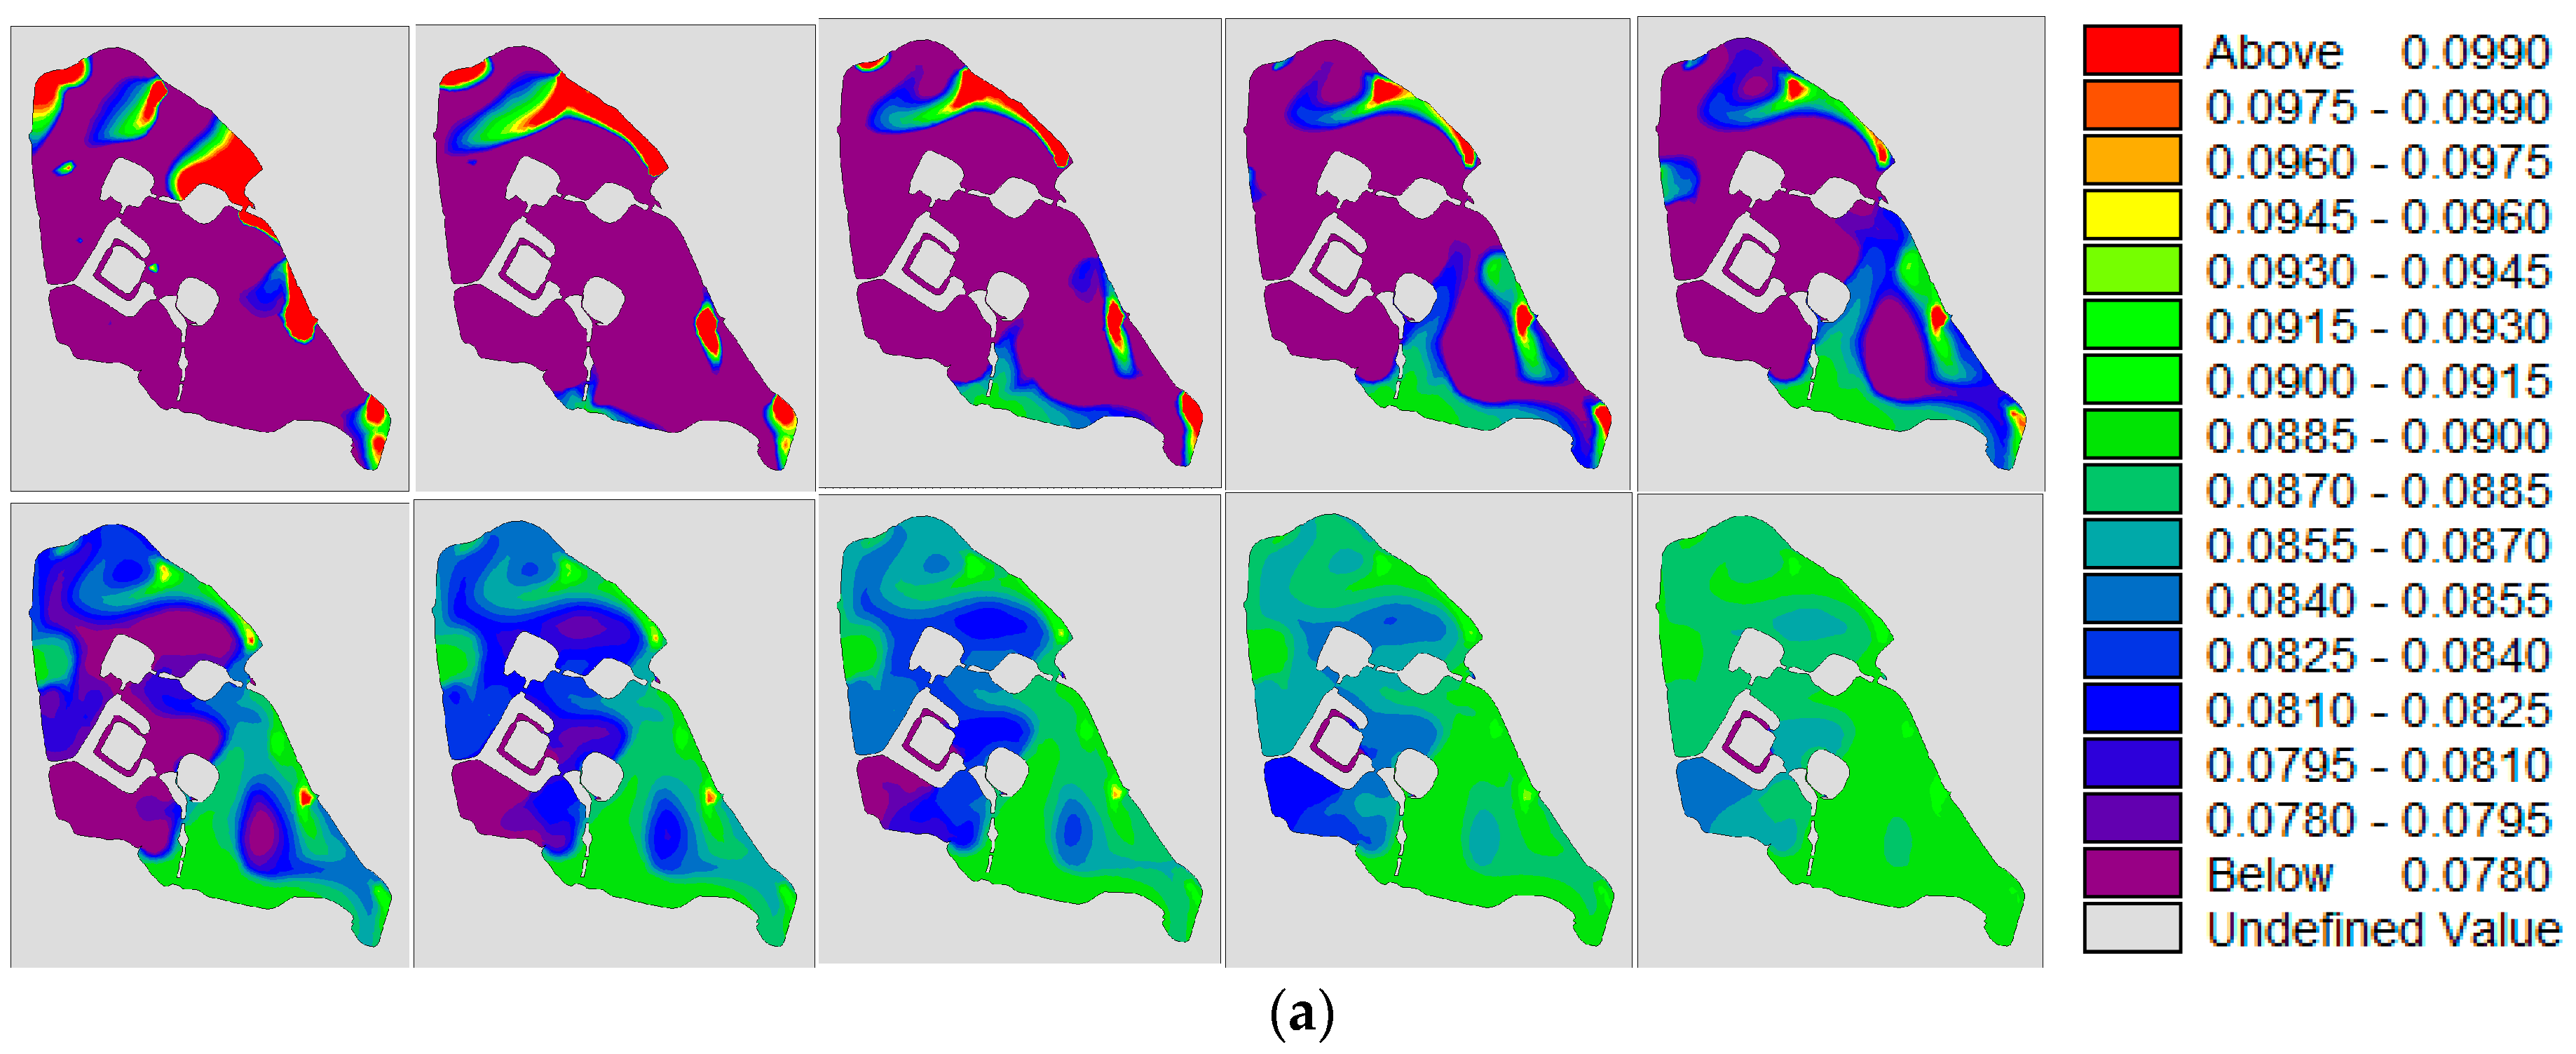
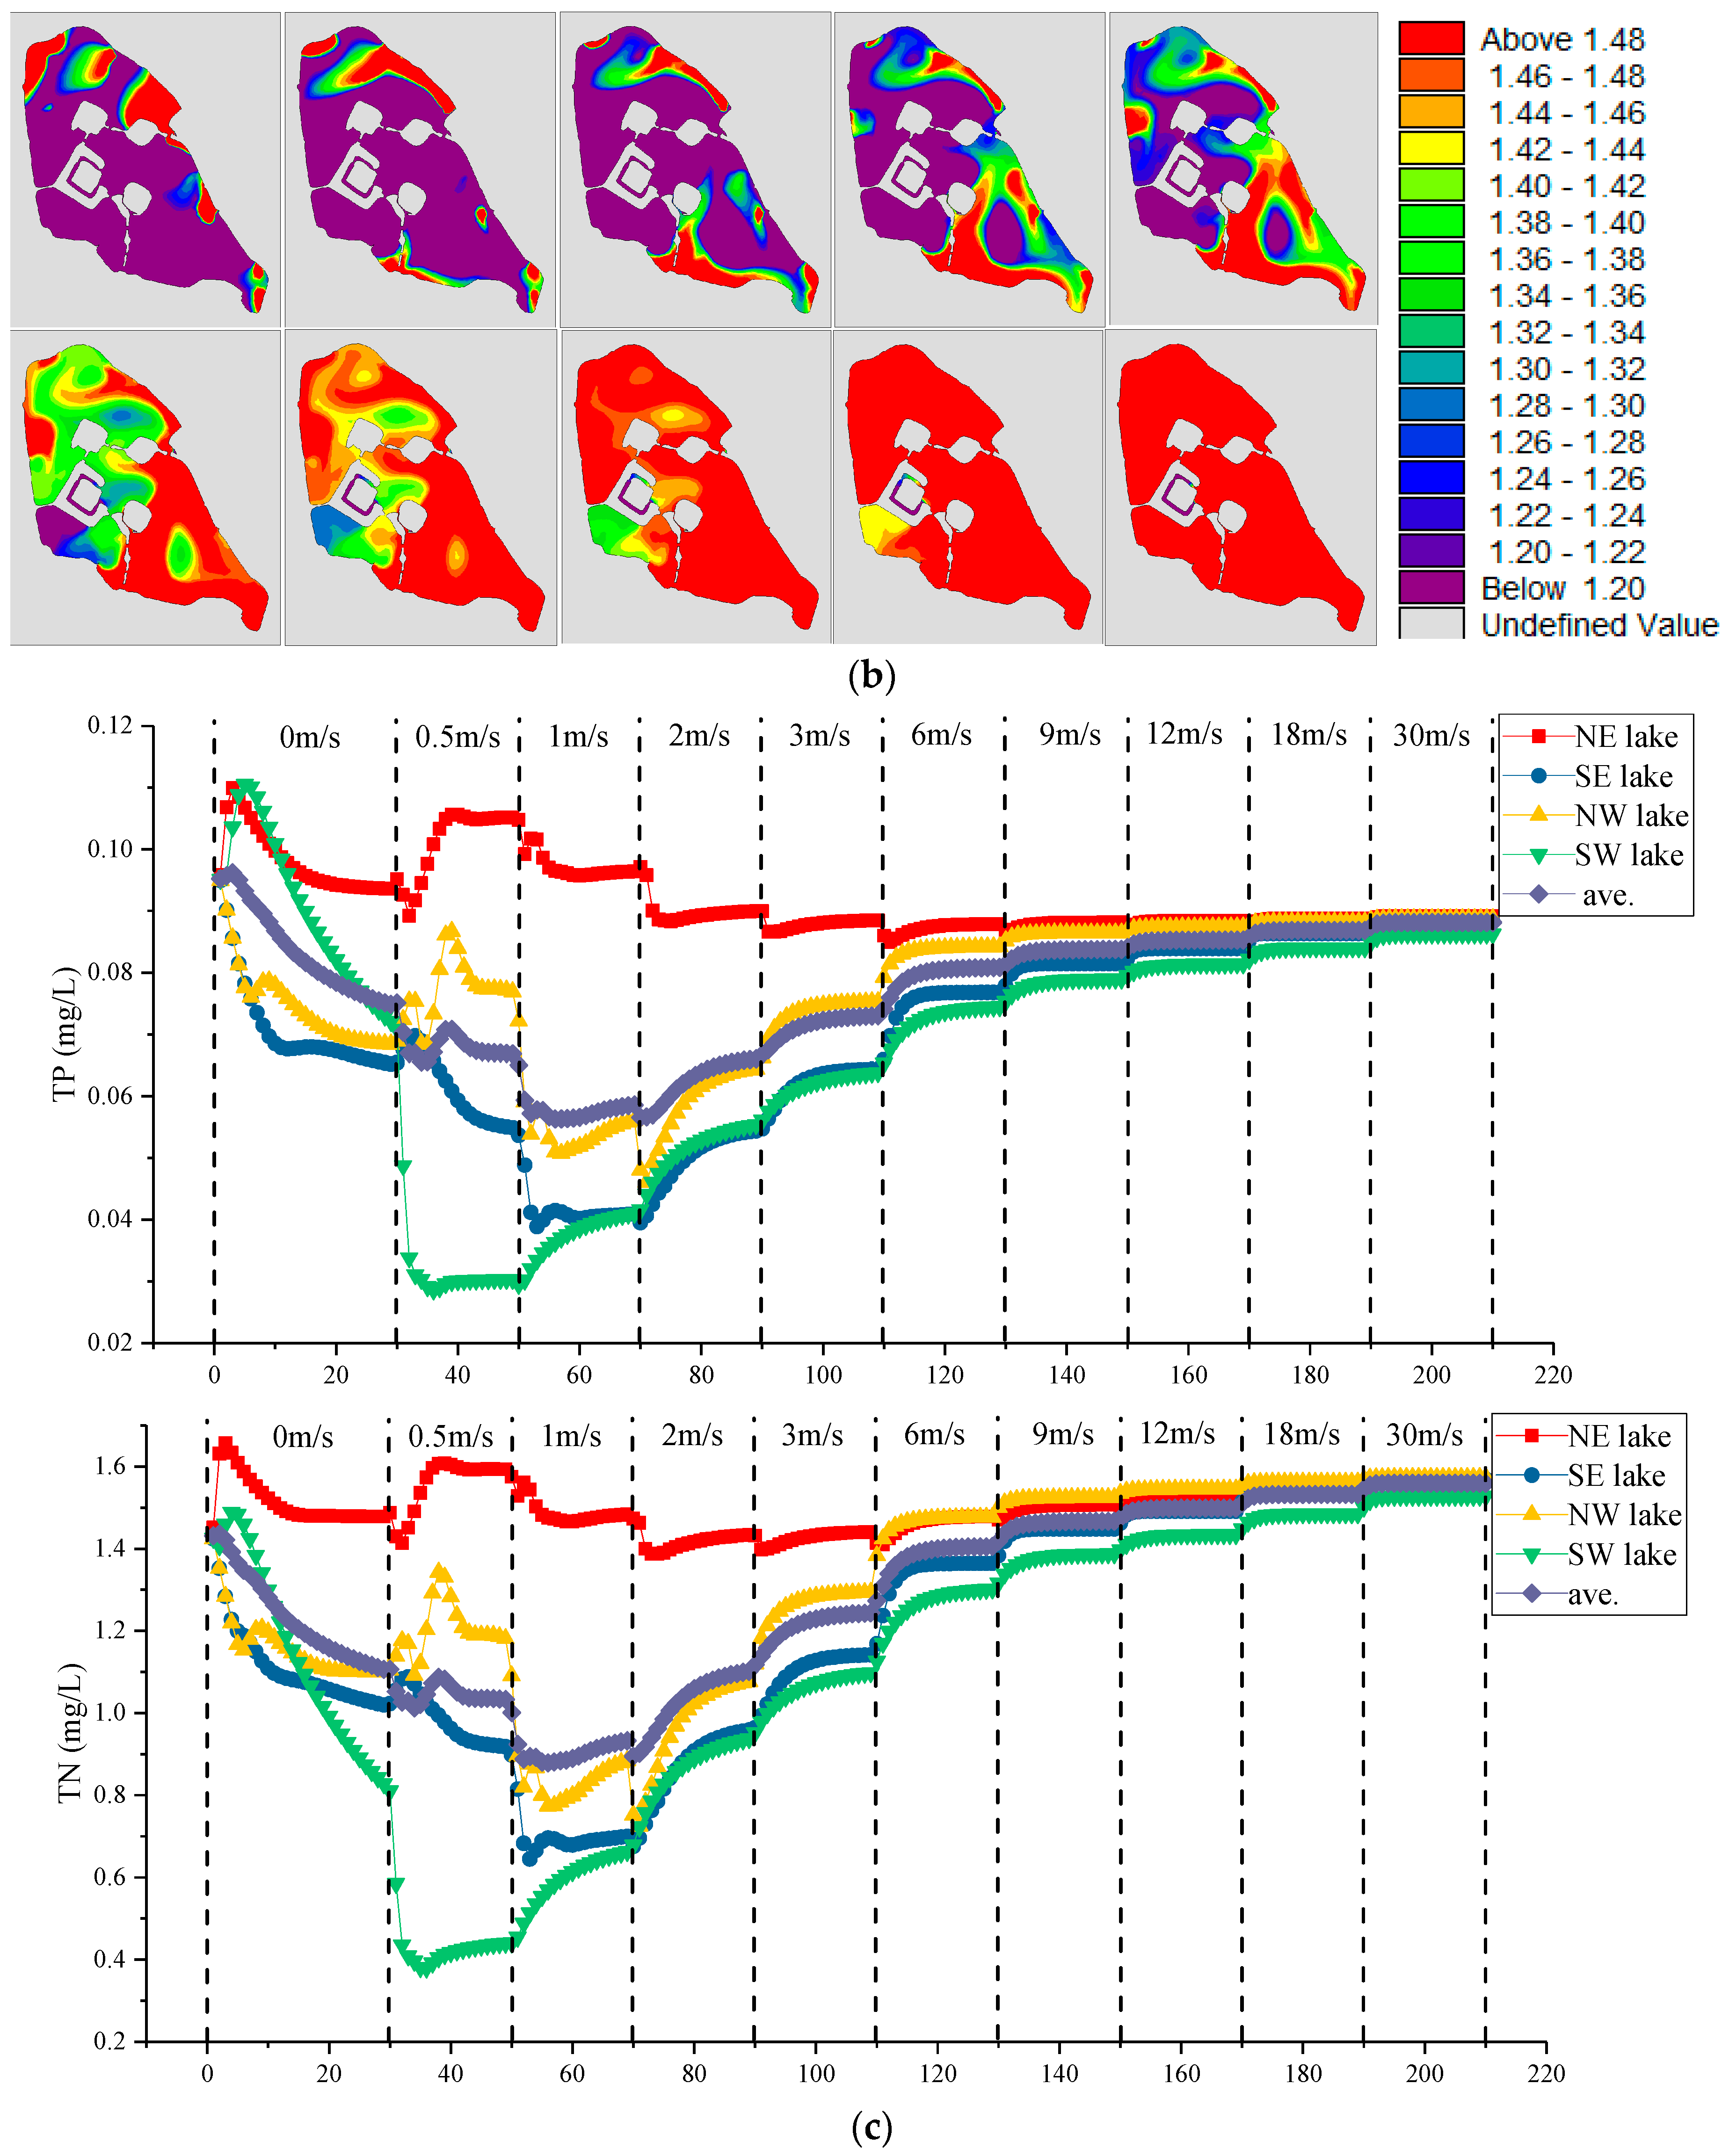
3.3.5. Water Diversion with Different Speed of Wind
3.4. Discussion
4. Conclusions
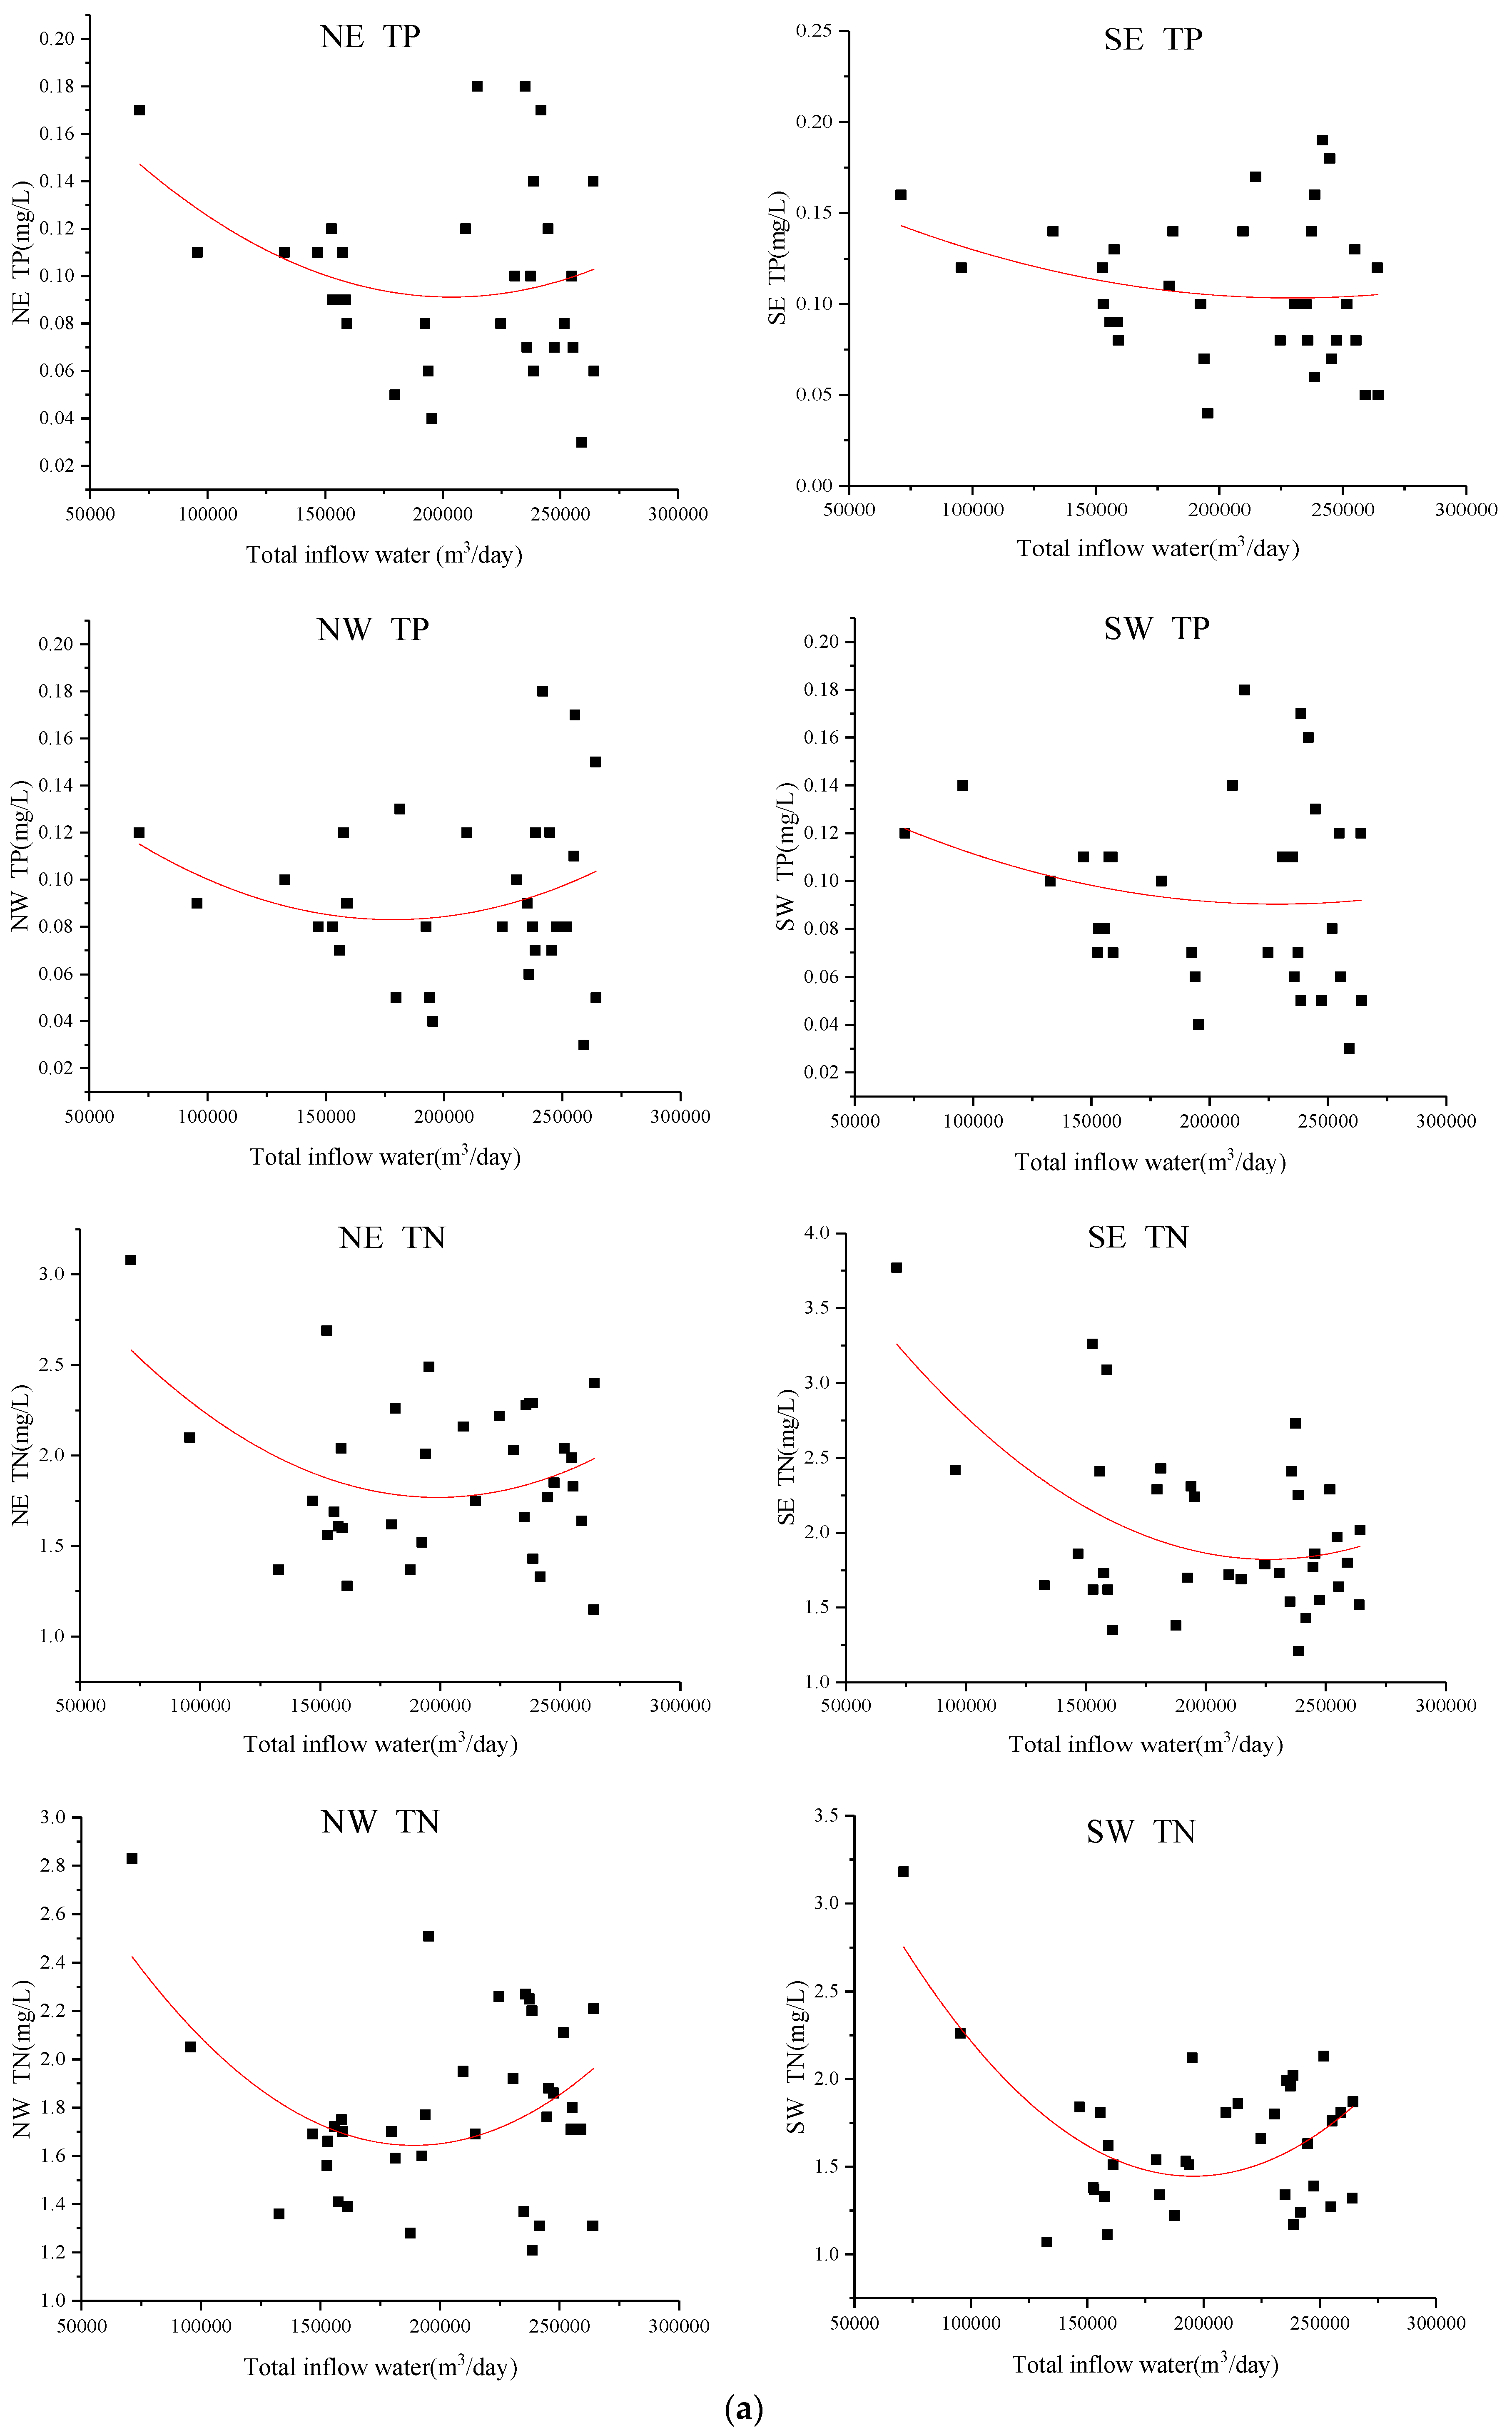
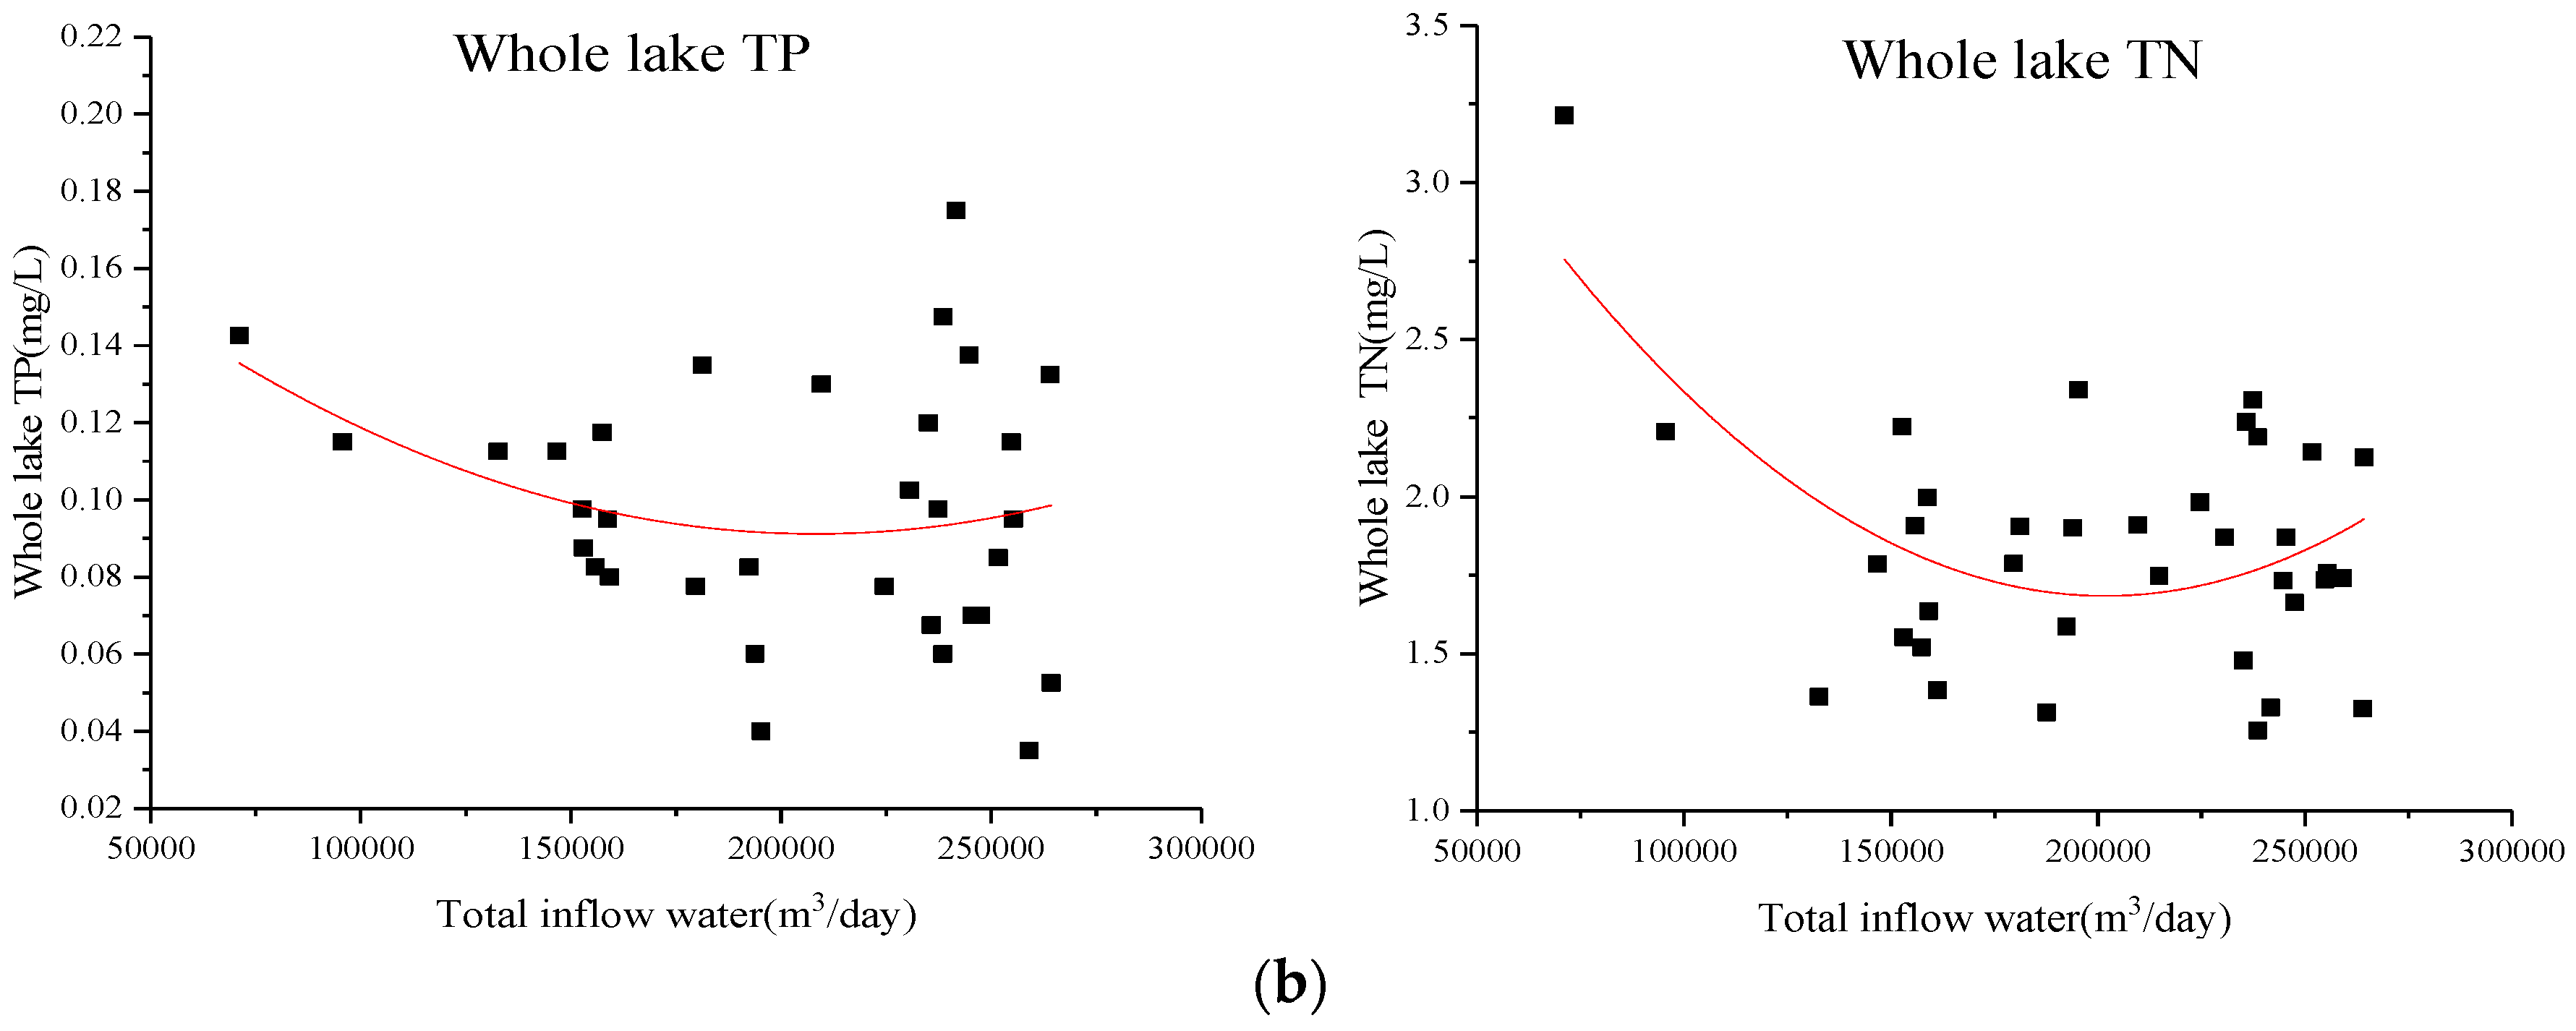
- (1)
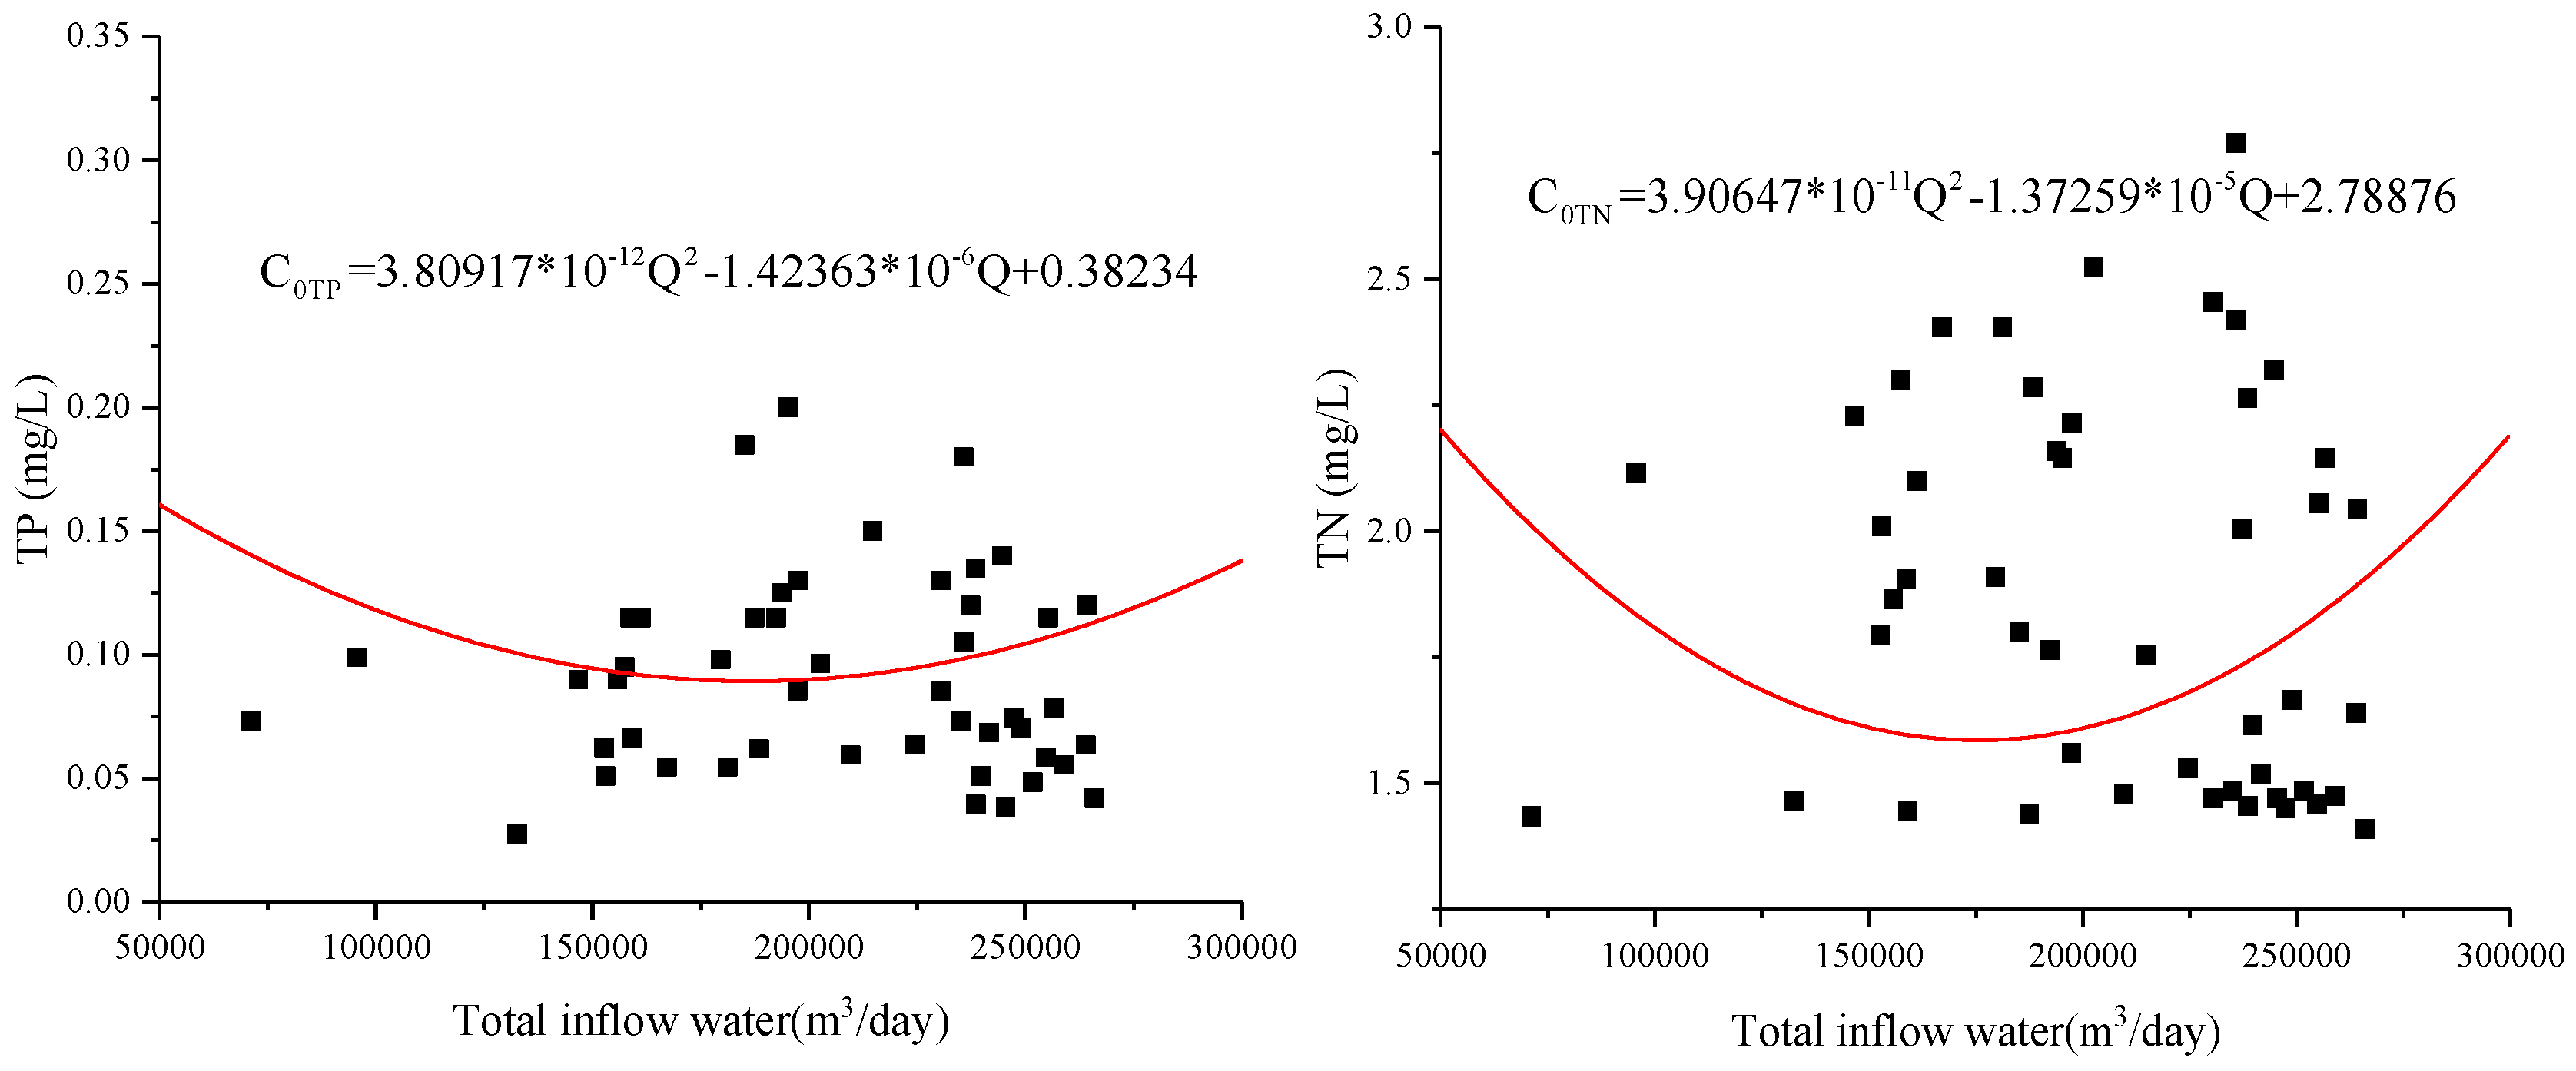
- From the curve of water quality and daily water inflow discharge in each district was fitted, it can be seen that water quality increased first and then decreased with increasing water inflow discharge in Xuanwu Lake. In general, when the water discharge is about 180,000 m3/day, the concentration of pollutants value was the lowest, and water quality of Xuanwu Lake was the best.
- (2)
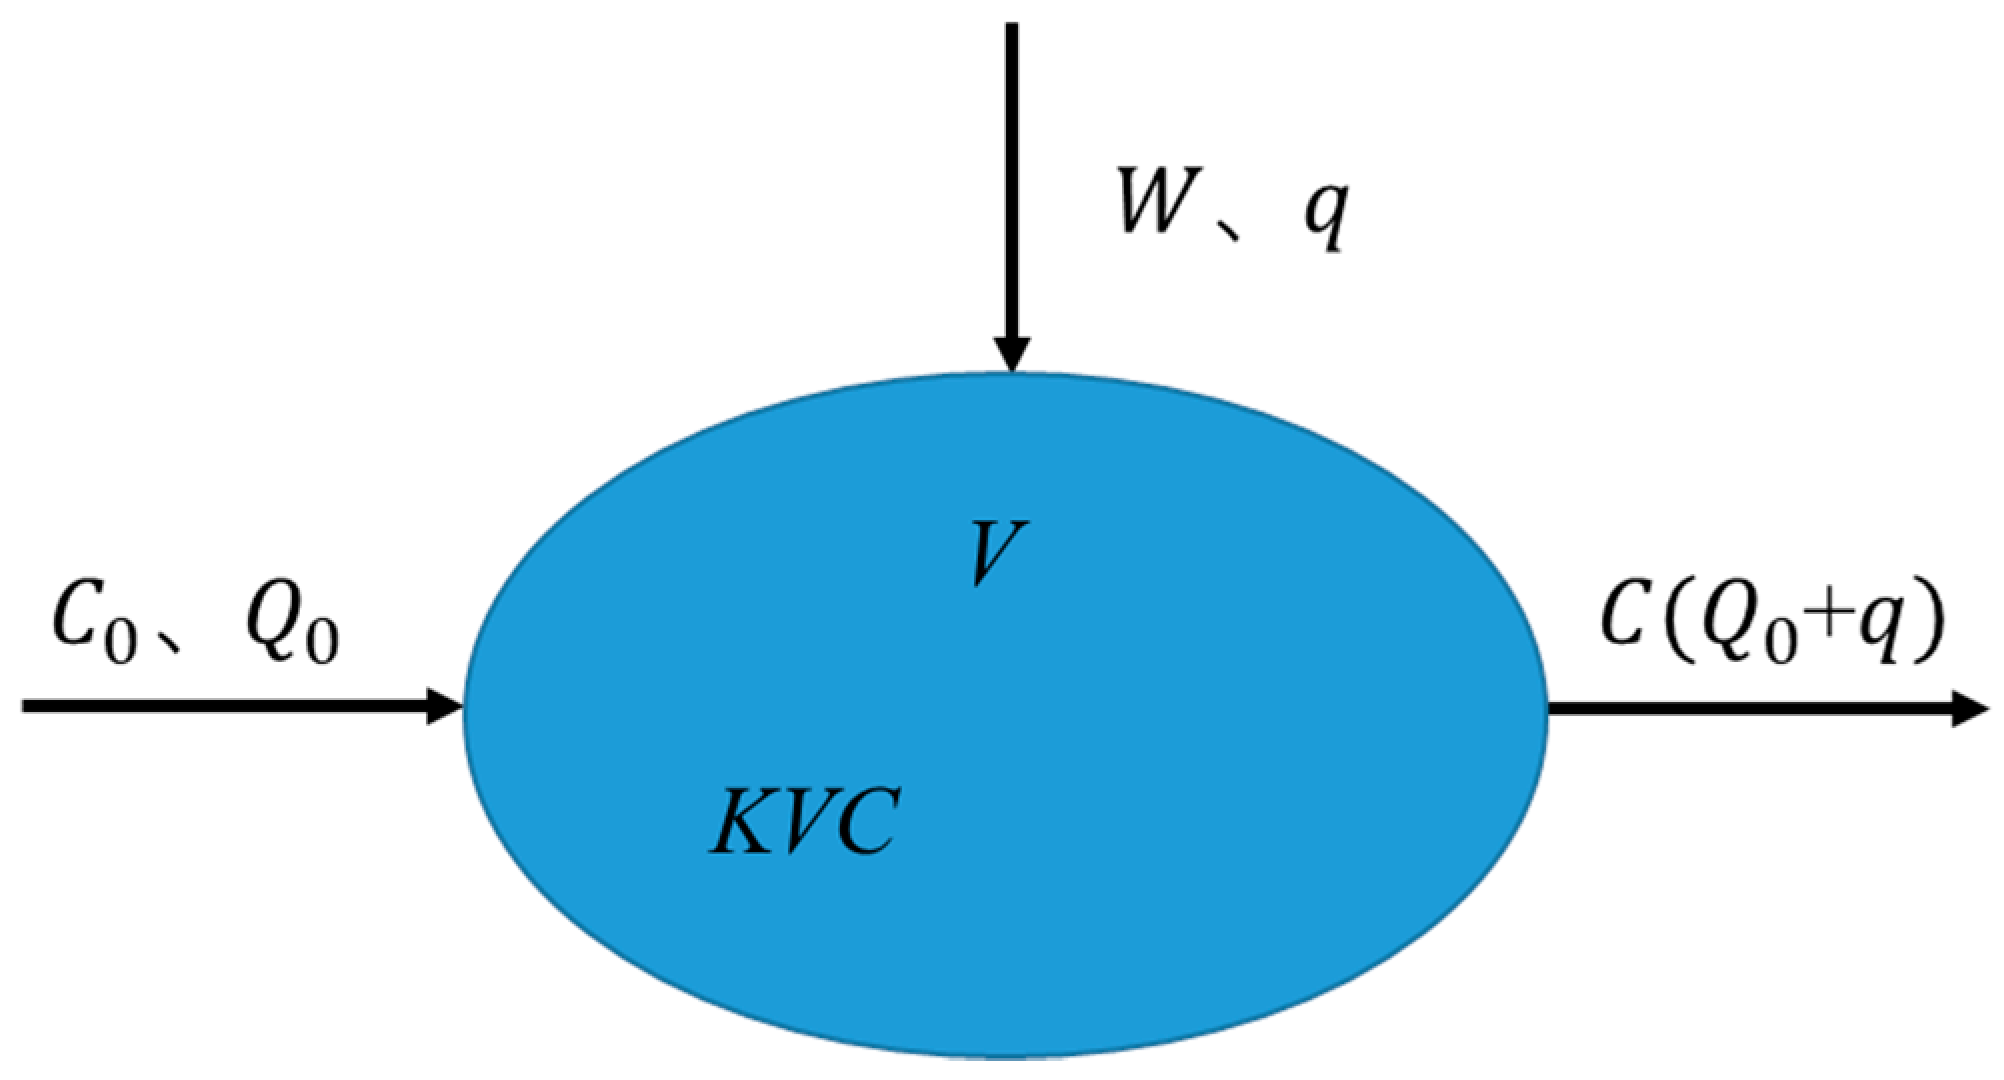
- For a research water body, when the internal water masses are evenly mixed, it can be assumed that the substances flowing into the system are completely dispersed to the entire system, and the entire water body can be considered as a complete system. The zero-dimensional model was used for Xuanwu Lake water quality analysis. Through theoretical analysis, the relationship between water quality and water diversion was established. We also found that the multiplication of the pollutant degradation coefficient (K) and the water residence time (T) is a constant (N), K · T = N. The water quality changed better first with the increase of inflow discharge, and then became worse, and the optimal water quality inflow discharge is also 180,000 m3/day. It shows that the regular analysis of the measured data of Xuanwu Lake is in accordance with the theoretical analysis, which verifies the accuracy of the conclusion.
- (3)
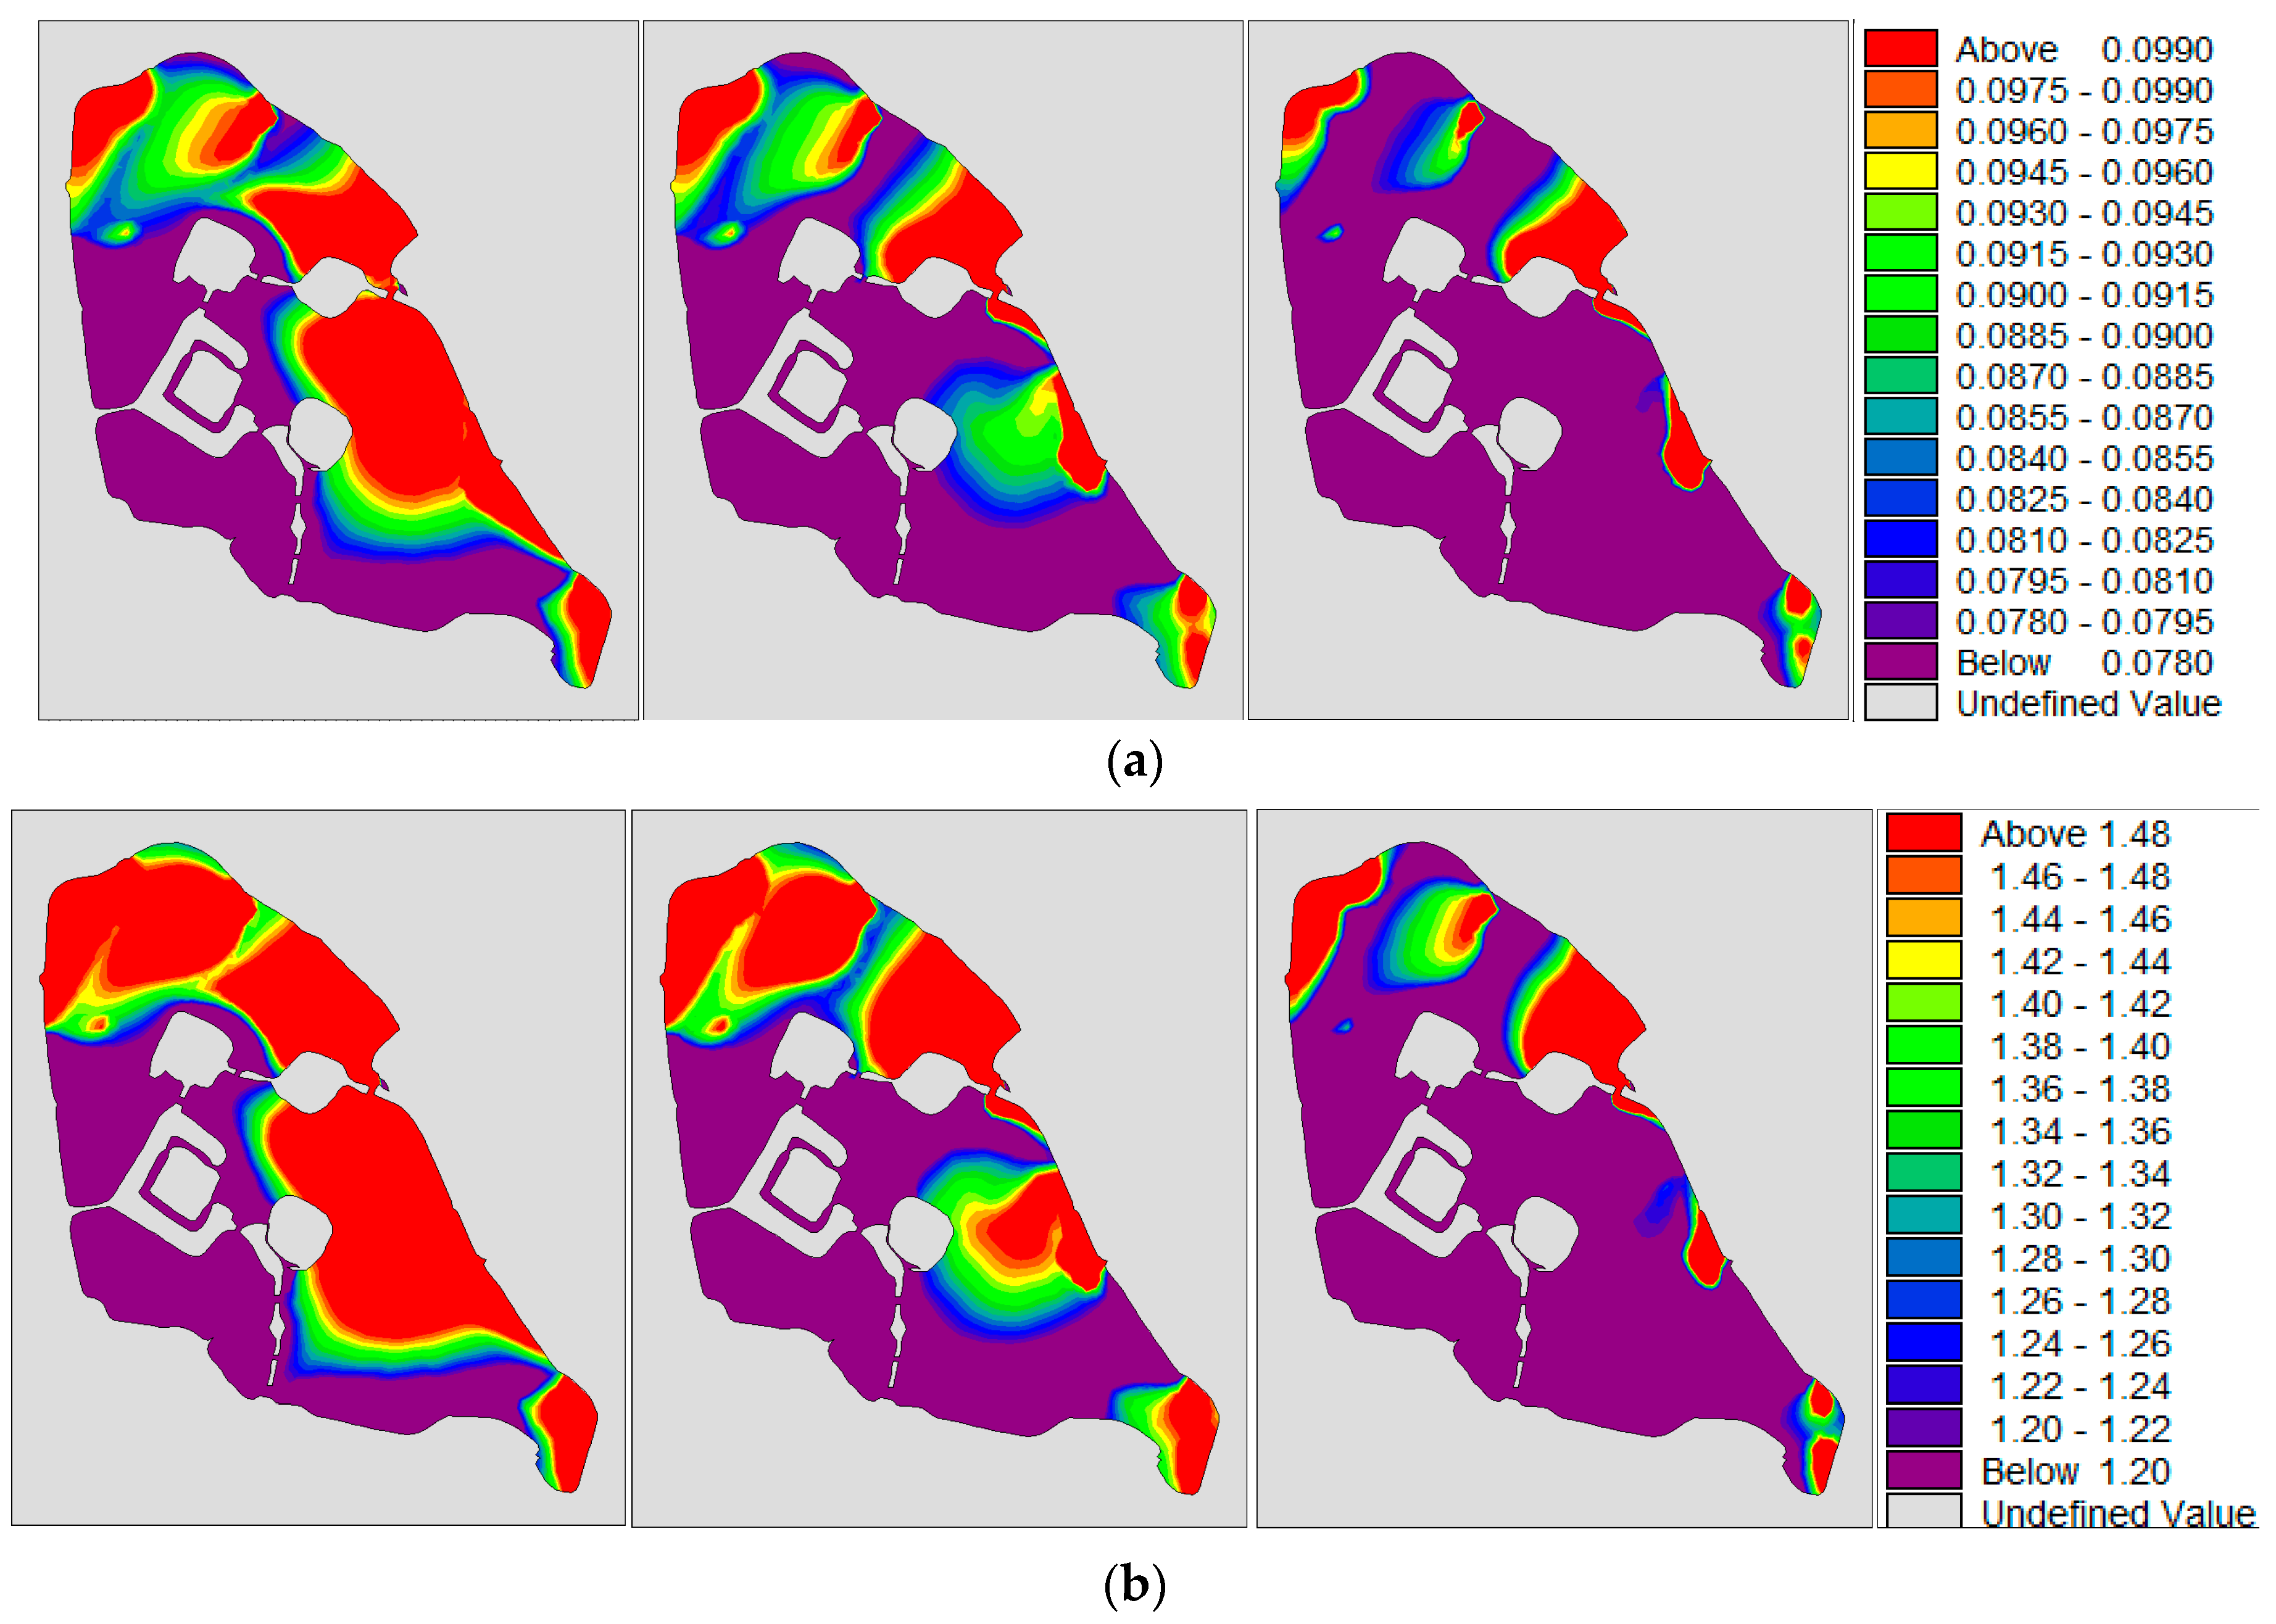
- By constructing a mathematical model of a two-dimensional water environment and setting up various programs, different inflow discharges, wind directions, wind speed, and pollutant emissions are considered. The gradual deterioration of water quality in Xuanwu Lake: ① inflow discharge: 180,000 m3/day > 280,000 m3/day > 350,000 m3/day; ② wind speed: 3 m/s > 0 m/s; ③ wind direction: NW wind > SE wind. Once again, it is proved that under the optimal inflow discharge, proper wind speed and proper wind direction may make the water quality of Xuanwu Lake better.
- (4)
- Through the calculation of eight winds directions at the optimal inflow discharge. Different wind directions result in different water quality concentrations and different concentration distribution fields. The concentration of water in each lake districts varies greatly. In general, the concentration of water quality in the NE district was the highest, and that in the SW district was the lowest. The relatively close concentration of water quality in the four lake districts was under the influence of the SW wind. In addition to the SW wind, the maximum concentration of other districts in other winds was about two-times the minimum concentration. Under the conditions of high-intensity human interference in urban complex and meteorological conditions, the proper wind direction is more uniform distribution of lake pollutants. It is beneficial to control the total amount of pollutants in the river where the outlets are located.
- (5)
- In the SW wind direction, judging from the average water concentration in the four districts, the concentration of pollutants in Xuanwu Lake first became smaller and then became larger as the wind speed increased, and eventually became constant. When the wind speed was 1 m/s, the quality of Xuanwu Lake was the best, the total phosphorus concentration was 0.06 mg/L, and the total nitrogen concentration was 0.95 mg/L. The concentration of total phosphorus without wind condition was basically the same as the concentration of water with a wind speed of 3 m/s. The water concentration of total nitrogen under no wind condition was basically the same as the water quality concentration at a wind speed of 2 m/s. When the wind speed was greater than 3 m/s, the wind will deteriorate the lake water quality. Compared to no wind condition, the maximum wind speed will increase the total phosphorus concentration in Xuanwu Lake by 15% and increase the total nitrogen concentration by 40%. As the wind speed increased, the concentration of pollutants in the lake was more evenly distributed. Under the condition of small wind speed, the scope of pollutant diffusion was small, making the monitoring point water quality not represent the entire lake. It is recommended to conduct water quality monitoring under large wind speed, or to increase monitoring points when the wind speed is small, so that the water quality monitoring results are more realistic.
Author Contributions
Acknowledgments
Conflicts of Interest
References
- Vollenweider, R.A. Possibilities and limits of elementary models concerning the budget of substances in lakes. Arch. Hydrobiol. 1969, 66, 1–36. [Google Scholar]
- Davies, B.R.; Thoms, M.; Meador, M. An assessment of the ecological impacts of inter-basin water transfers, and their threats to river basin integrity and conservation. Aquat. Conserv. 2010, 2, 325–349. [Google Scholar] [CrossRef]
- Wang, X.L. Famous water transfer project in river basin. Water Resour. Electr. Power 2004, 30, 1–25. [Google Scholar]
- Li, Y.; Tang, C.; Wang, C.; Anim, D.; Yu, Z.; Acharya, K. Improved Yangtze River Diversions: Are they helping to solve algal bloom problems in Lake Taihu, China? Ecol. Eng. 2013, 51, 104–116. [Google Scholar] [CrossRef]
- Liu, C.; Zheng, H. South-to-north Water Transfer Schemes for China. Int. J. Water Resour. Dev. 2002, 18, 453–471. [Google Scholar] [CrossRef]
- Feng, T.; Wang, C.; Hou, J.; Wang, P.; Liu, Y.; Dai, Q.; Yang, Y.; You, G. Effect of inter-basin water transfer on water quality in an urban lake: A combined water quality index algorithm and biophysical modelling approach. Ecol. Indic. 2017. [Google Scholar] [CrossRef]
- Cui, F.; Yuan, B.; Wang, Y. Constructed Wetland as an Alternative Solution to Maintain Urban Landscape Lake Water Quality: Trial of Xing-Qing Lake in Xi’an City. Procedia Environ. Sci. 2011, 10, 2525–2532. [Google Scholar] [CrossRef]
- Wu, Q.; Xia, X.; Li, X.; Mou, X. Impacts of meteorological variations on urban lake water quality: A sensitivity analysis for 12 urban lakes with different trophic states. Aquat. Sci. 2014, 76, 339–351. [Google Scholar] [CrossRef]
- Chen, Q.; Wei-Ping, H.U.; Zhang, J.N. Advances in research on the build-up and rainfall runoff wash-off of urban surface pollutants. Resour. Environ. Yangtze Basin 2009, 18, 992–996. [Google Scholar] [CrossRef]
- Wang, T. Numerical Simulation Research of Water Diversion to Improve Urban Lake Water Quality. Pioneer. Sci. Technol. Mon. 2014, 1, 195–196. [Google Scholar] [CrossRef]
- Mao, J.; Zhang, X.; Li, W. Assessment of water quality improvement by water transfer for Yundong Lake restoration from impoldering. J. Hydroelectr. Eng. 2012, 6, 166–171. [Google Scholar]
- Xiao, F.; Liu, J.L.; Yang, Z.F. Case study: Calculation of eco-environmental water demand of urban lake for six lakes of Beijing. Adv. Water Sci. 2004, 15, 781–786. [Google Scholar] [CrossRef]
- Li, Y.; Qiu, L.; Tang, C.Y.; Bu, M.; Tian, W.; Yu, Z.; Acharya, K. Uncertainty and sensitivity analysis of input conditions in large shallow lake hydrodynamic model. China Environ. Sci. 2014, 34, 410–416. [Google Scholar]
- Arhonditsis, G.B.; Brett, M.T. Eutrophication model for Lake Washington (USA): Part II—Model calibration and system dynamics analysis. Ecol. Model. 2005, 187, 179–200. [Google Scholar] [CrossRef]
- Li, K.; Zhang, L.; Li, Y.; Zhang, L.; Wang, X. A three-dimensional water quality model to evaluate the environmental capacity of nitrogen and phosphorus in Jiaozhou Bay, China. Estuar. Coast. Shelf Sci. 2014, 91, 306–316. [Google Scholar] [CrossRef]
- Xu, J.; Li, Y.; Huang, G. A Hybrid Interval-Robust Optimization Model for Water Quality Management. Environ. Eng. Sci. 2013, 30, 248–263. [Google Scholar] [CrossRef] [PubMed]
- Cerco, C.F.; Cole, T. Three-Dimensional Eutrophication Model of Chesapeake Bay. J. Environ. Eng. 1993, 119, 1006–1025. [Google Scholar] [CrossRef]
- Omlin, M.; Brun, R.; Reichert, P. Biogeochemical model of Lake Zürich: Sensitivity, identifiability and uncertainty analysis. Ecol. Modol. 2001, 141, 105–123. [Google Scholar] [CrossRef]
- Piermay, J.L. Long-term simulation of the eutrophication of the North Sea: Temporal development of nutrients, chlorophyll and primary production in comparison to observations. J. Sea Res. 1997, 38, 275–310. [Google Scholar] [CrossRef]
- Nobre, A.M.; Ferreira, J.G.; Newton, A.; Simas, T.; Lcely, J.; Neves, R. Management of coastal eutrophication: Integration of field data, ecosystem-scale simulations and screening models. J. Mar. Syst. 2005, 56, 375–390. [Google Scholar] [CrossRef]
- Scavia, D.; Powers, W.F.; Canale, R.P.; Moody, J.L. Comparison of first-order error analysis and Monte Carlo Simulation in time-dependent lake eutrophication models. Water Resour. Res. 1981, 17, 1051–1059. [Google Scholar] [CrossRef]
- Geng, J.; Jin, X.; Wang, Q.; Niu, X.; Wang, X.; Edwards, M.; Glindemann, D. Matrix bound phosphine formation and depletion in eutrophic lake sediment fermentation-simulation of different environmental factors. Anaerobe 2005, 11, 273. [Google Scholar] [CrossRef] [PubMed]
- Pang, M.; Song, W.; Zhang, P.; Shao, Y.; Li, L.; Pang, Y.; Wang, J.; Xu, Q. Research into the Eutrophication of an Artificial Playground Lake near the Yangtze River. Sustainability 2018, 10, 867. [Google Scholar] [CrossRef]
- Song, W.; Pang, Y.; Shi, X.; Xu, Q. Study on the Rectification of Forebay in Pumping Station. Math. Prob. Eng. 2018, 2018, 1–16. [Google Scholar] [CrossRef]
- Sagehashi, M.; Sakoda, A.; Suzuki, M. A mathematical model of a shallow and Eutrophic Lake (The Keszthely Basin, Lake Balaton) and simulation of restorative manipulations. Water Res. 2001, 35, 1675. [Google Scholar] [CrossRef]
- Madden, C.J.; Kemp, W.M. Ecosystem model of an estuarine submersed plant community: Calibration and simulation of eutrophication responses. Estuaries 1996, 19, 457–474. [Google Scholar] [CrossRef]
- Karim, M.R.; Sekine, M.; Ukita, M. Simulation of eutrophication and associated occurrence of hypoxic and anoxic condition in a coastal bay in Japan. Mar. Pollut. Bull. 2002, 45, 280–285. [Google Scholar] [CrossRef]
- Huang, Y.L.; Huang, G.H.; Liu, D.F.; Zhu, H.; Sun, W. Simulation-based inexact chance-constrained nonlinear programming for eutrophication management in the Xiangxi Bay of Three Gorges Reservoir. J. Environ. Manag. 2012, 108, 54. [Google Scholar] [CrossRef] [PubMed]
- Wang, H.; Zhang, Z.; Liang, D.; Du, H.; Pang, Y.; Hu, K.; Wang, J. Separation of wind’s influence on harmful cyanobacterial blooms. Water Res. 2016, 98, 280. [Google Scholar] [CrossRef] [PubMed]
- Wang, H.; Zhao, Y.; Liang, D.; Deng, Y.; Pang, Y. 30+ year evolution of Cu in the surface sediment of Lake Poyang, China. Chemosphere 2017, 168, 1604–1612. [Google Scholar] [CrossRef] [PubMed]
- Wang, J.; Pang, Y.; Li, Y.; Huang, Y.; Jia, J.; Zhang, P.; Kou, X. The regularity of wind-induced sediment resuspension in Meiliang Bay of Lake Taihu. Water Sci. Technol. 2014, 70, 167–174. [Google Scholar] [CrossRef] [PubMed]
- Marshall, H.G.; Burchardt, L. Phytoplankton composition within the tidal freshwater region of the James River, Virginia. Proc. Biol. Soc. Wash. 1998, 111, 720–730. [Google Scholar]
- Lung, W.S.; Paerl, H.W. Modeling blue-green algal blooms in the lower Neuse River. Water Res. 1988, 22, 895–905. [Google Scholar] [CrossRef]
- Steinberg, C.; Hartmann, H. Planktonic bloom forming cyanobacteria and the eutrophication of lakes and rivers. Freshw. Biol. 1988, 20, 279–287. [Google Scholar] [CrossRef]
- Eldridge, M.; Sieracki, M.E. Biological and hydrodynamic regulation of the microbial food web in a periodically mixed estuary. Limnol. Oceanogr. 1993, 38, 1666–1679. [Google Scholar] [CrossRef]
- Qin, B. Approaches to Mechanisms and Control of Eutrophication of Shallow Lakes in the Middle and Lower Reaches of the Yangze River. J. Lake Sci. 2002, 14, 193–202. [Google Scholar] [CrossRef]
- Qin, B.; Wang, X.; Tang, X.; Feng, S.; Zhang, Y. Drinking Water Crisis Caused by Eutrophication and Cyanobacterial Bloom in Lake Taihu: Cause and Measurement. Adv. Earth Sci. 2007, 22, 896–906. [Google Scholar] [CrossRef]
- Zhu, G. Eutrophic status and causing factors for a large, shallow and subtropical Lake Taihu, China. J. Lake Sci. 2008, 20, 21–26. [Google Scholar] [CrossRef]
- Liang, P.; Wang, X.; Ma, F. Effect of hydrodynamic conditions on water eutrophication: A review. J. Lake Sci. 2013, 25, 455–462. [Google Scholar] [CrossRef]
- Pu, P.; Wang, G.; Hu, C.; Hu, W.; Fan, C. Can We Control Lake Eutrophication by Dredging? J. Lake Sci. 2000, 12, 269–279. [Google Scholar] [CrossRef]
- Song, W.; Pang, Y. The Calculation of Water Environment Capacity of Qinhuai River Basin Based on the National Test of QB-CS Water Quality Standards. China Rural Water Hydropower 2017, 10, 80–84. [Google Scholar] [CrossRef]
- Conley, D.J.; Paerl, H.W.; Howarth, R.W.; Boesch, D.F.; Seitzinger, S.P.; Havens, K.E.; Lancelot, C.; Likens, G.E. Ecology. Controlling eutrophication: Nitrogen and phosphorus. Science 2009, 323, 1014. [Google Scholar] [CrossRef] [PubMed]
- Cloern, J.E. Our evolving conceptual model of the coastal eutrophication problem. Mar. Ecol. Prog. 2001, 210, 223–253. [Google Scholar] [CrossRef]
- Smith, V.H. Eutrophication of freshwater and coastal marine ecosystems a global problem. Environ. Sci. Pollut. Res. Int. 2003, 10, 126–139. [Google Scholar] [CrossRef] [PubMed]
- Dokulil, M.; Chen, W.; Cai, Q. Anthropogenic impacts to large lakes in China: The Tai Hu example. Aquat. Ecosyst. Health Manag. 2000, 3, 81–94. [Google Scholar] [CrossRef]
- Paerl, H.W.; Rd, F.R.; Moisander, P.H.; Dyble, J. Harmful freshwater algal blooms, with an emphasis on cyanobacteria. Sci. World J. 2001, 1, 76. [Google Scholar] [CrossRef] [PubMed]
- Smith, V.H. Low Nitrogen to Phosphorus Ratios Favor Dominance by Blue-Green Algae in Lake Phytoplankton. Science 1983, 221, 669. [Google Scholar] [CrossRef] [PubMed]
- Wang, H.; Pang, Y. Investigation of internal pollutant loading for a tide-influenced waterbody. Water Environ. Res. 2009, 81, 2437. [Google Scholar] [CrossRef]
- Wang, H.; Zhou, Y.; Pang, Y.; Wang, X. Fluctuation of Cadmium Load on a Tide-Influenced Waterfront Lake in the Middle-Lower Reaches of the Yangtze River. Clean Soil Air Water 2015, 42, 1402–1408. [Google Scholar] [CrossRef]
- Wang, H.; Zhou, Y.; Pang, Y.; Wang, X. Influence of dredging on sedimentary arsenic release for a tide-influenced waterfront body. J. Environ. Qual. 2014, 43, 1585–1592. [Google Scholar] [CrossRef] [PubMed]
- Wang, H.; Xia, K.; Zhou, Y.; Wu, M. Impact of Water-Sediment Exchange on Underwater Terrain Shaping Process for a Tide-Influenced Waterfront Lake. J. Hydrol. Eng. 2014, 20, 4014093. [Google Scholar] [CrossRef]
- Li, Y.; Wang, Y.; Anim, D.O.; Tang, C.; Du, W.; Ni, L.; Yu, Z.; Acharya, K. Flow characteristics in different densities of submerged flexible vegetation from an open-channel flume study of artificial plants. Geomorphology 2014, 204, 314–324. [Google Scholar] [CrossRef]
- Li, Y.; Tang, C.; Wang, C.; Tian, W.; Pan, B.; Hua, L.; Lau, J.; Yu, Z.; Acharya, K. Assessing and modeling impacts of different inter-basin water transfer routes on Lake Taihu and the Yangtze River, China. Ecol. Eng. 2013, 60, 399–413. [Google Scholar] [CrossRef]
- Chen, S.; Qu, F.; Ni, S.; Liu, Y. City land price distribution researching in GIS spatial analysis—A case study of Zhenjiang City. J. Nanjing Agr. Univ. 2005, 28, 119–122. [Google Scholar] [CrossRef]
- Liu, X.; Yao, Q.; Zha, Y. Study on Numerical Simulation and Scheme of Water Diversion in Lake Xuanwu. In Proceedings of the 20th National Symposium on Hydrodynamics, Taiyuan, China, 23 August 2007; pp. 858–865. [Google Scholar]
- Wang, Y.; Lixin, L.X.; Mingchang, L. A Retrospective Analysis of the Water-water-flow Pollutants On the Yangtze River Water Quality. J. Hydrol. 2011, 343, 43–55. [Google Scholar]
- Zhou, X.; Feng, Y.U.; Zhu, G.; Zhang, Y. Investigation and analysis of influent quality of wastewater treatment facilities in rural areas of Jiangsu province, China. Chin. J. Environ. Eng. 2017, 11, 1445–1449. [Google Scholar] [CrossRef]
- Duan, W.; He, B.; Chen, Y.; Zhou, S.; Wang, Y.; Nover, D.; Chen, W.; Yang, G. Identification of long-term trends and seasonality in high-frequency water quality data from the Yangtze River basin, China. PLoS ONE 2018, 13, e0188889. [Google Scholar] [CrossRef] [PubMed]
- Zhang, R.; Qian, X.; Yuan, X.; Ye, R.; Xia, B.; Wang, Y. Simulation of Water Environmental Capacity and Pollution Load Reduction Using QUAL2K for Water Environmental Management. Int. J. Environ. Res. Public Health 2012, 9, 4504–4521. [Google Scholar] [CrossRef] [PubMed]
- Yang, J.; Lei, K.; Khu, S.; Meng, W.; Qiao, F. Assessment of water environmental carrying capacity for sustainable development using a coupled system dynamics approach applied to the Tieling of the Liao River Basin, China. Environ. Earth Sci. 2015, 73, 5173–5183. [Google Scholar] [CrossRef]
- Xie, R.; Pang, Y.; Bao, K. Spatiotemporal distribution of water environmental capacity--a case study on the western areas of Taihu Lake in Jiangsu Province, China. Environ. Sci. Pollut. Res. 2014, 21, 5465–5473. [Google Scholar] [CrossRef] [PubMed]
- Yao, Y.J.; Yin, H.L.; Song, L.I. The computation approach for water environmental capacity in tidal river network. J. Hydrodyn. 2006, 18, 273–277. [Google Scholar] [CrossRef]
- Gong, C.S.; Yao, Q.; Zhao, D.H. Numerical simulation of wind-driven current in Xuanwu Lake. J. Hohai Univ. 2005, 33, 72–75. [Google Scholar] [CrossRef]


| Time | TP | TN | ||||||
|---|---|---|---|---|---|---|---|---|
| K (s−1) | Simulation (mg/L) | Measured (mg/L) | Error (%) | K (s−1) | Simulation (mg/L) | Measured (mg/L) | Error (%) | |
| 3 Jan. 2017 | 1.53 × 10⁻⁶ | 0.0811 | 0.0775 | 4.65 | 1.1 × 10⁻⁶ | 1.7385 | 1.7875 | 2.74 |
| 7 Feb. 2017 | 2.26 × 10⁻⁶ | 0.0608 | 0.0525 | 15.81 | 9.26 × 10⁻⁷ | 2.1463 | 2.125 | 1.00 |
| 1 Mar. 2017 | 1.53 × 10⁻⁶ | 0.0793 | 0.0775 | 2.39 | 9.74 × 10⁻⁷ | 2.1613 | 1.9825 | 9.02 |
| 6 Apr. 2017 | 1.35 × 10⁻⁶ | 0.0929 | 0.0875 | 6.14 | 1.27 × 10⁻⁶ | 1.5486 | 1.5525 | 0.25 |
| 4 May 2017 | 1.01 × 10⁻⁶ | 0.1269 | 0.1175 | 7.99 | 1.29 × 10⁻⁶ | 1.5589 | 1.52 | 2.56 |
| 2 Jun. 2017 | 6.77 × 10⁻⁷ | 0.1713 | 0.175 | 2.10 | 1.41 × 10⁻⁶ | 1.5040 | 1.3825 | 8.79 |
| 3 Jul. 2017 | 1.44 × 10⁻⁶ | 0.0988 | 0.0825 | 19.70 | 1.24 × 10⁻⁶ | 1.5623 | 1.5875 | 1.58 |
| 1 Aug. 2017 | 5.92 × 10⁻⁷ | 0.1805 | 0.2 | 9.74 | 1.47 × 10⁻⁶ | 1.5150 | 1.3125 | 15.43 |
| 4 Sep. 2017 | 6.58 × 10⁻⁷ | 0.1980 | 0.18 | 10.01 | 1.13 × 10⁻⁶ | 1.7373 | 1.7475 | 0.58 |
| 2 Oct. 2017 | 1.21 × 10⁻⁶ | 0.1125 | 0.0975 | 15.39 | 8.55 × 10⁻⁷ | 2.3060 | 2.3075 | 0.07 |
| 1 Nov. 2017 | 8.61 × 10⁻⁷ | 0.1141 | 0.1375 | 17.05 | 1.1 × 10⁻⁶ | 1.9879 | 1.7325 | 14.74 |
| 4 Dec. 2017 | 1.25 × 10⁻⁶ | 0.1113 | 0.095 | 17.20 | 1.1 × 10⁻⁶ | 1.9409 | 1.7575 | 10.44 |
| Wind Direction | Diversion Water (m3/day) | ③ Drainage Ditch | Wind Speed (km/h) |
|---|---|---|---|
| No wind | 350,000 | Open | - |
| 280,000 | Open | - | |
| 180,000 | Close | - | |
| Southeast (135°) | 350,000 | Open | 8 |
| 280,000 | Open | 8 | |
| 180,000 | Close | 8 | |
| Northwest (315°) | 350,000 | Open | 8 |
| 280,000 | Open | 8 | |
| 180,000 | Close | 8 |
© 2018 by the authors. Licensee MDPI, Basel, Switzerland. This article is an open access article distributed under the terms and conditions of the Creative Commons Attribution (CC BY) license (http://creativecommons.org/licenses/by/4.0/).
Share and Cite
Song, W.; Xu, Q.; Fu, X.; Zhang, P.; Pang, Y.; Song, D. Research on the Relationship between Water Diversion and Water Quality of Xuanwu Lake, China. Int. J. Environ. Res. Public Health 2018, 15, 1262. https://doi.org/10.3390/ijerph15061262
Song W, Xu Q, Fu X, Zhang P, Pang Y, Song D. Research on the Relationship between Water Diversion and Water Quality of Xuanwu Lake, China. International Journal of Environmental Research and Public Health. 2018; 15(6):1262. https://doi.org/10.3390/ijerph15061262
Chicago/Turabian StyleSong, Weiwei, Qing Xu, Xingqian Fu, Peng Zhang, Yong Pang, and Dahao Song. 2018. "Research on the Relationship between Water Diversion and Water Quality of Xuanwu Lake, China" International Journal of Environmental Research and Public Health 15, no. 6: 1262. https://doi.org/10.3390/ijerph15061262
APA StyleSong, W., Xu, Q., Fu, X., Zhang, P., Pang, Y., & Song, D. (2018). Research on the Relationship between Water Diversion and Water Quality of Xuanwu Lake, China. International Journal of Environmental Research and Public Health, 15(6), 1262. https://doi.org/10.3390/ijerph15061262