Trend of Age-Adjusted Rates of Pediatric Traumatic Brain Injury in U.S. Emergency Departments from 2006 to 2013


Abstract
1. Introduction
2. Materials and Methods
2.1. Data Sources
2.2. Definition of Pediatric TBI
2.3. Definition of Pediatric TBI Severity
2.4. Statistical Analysis
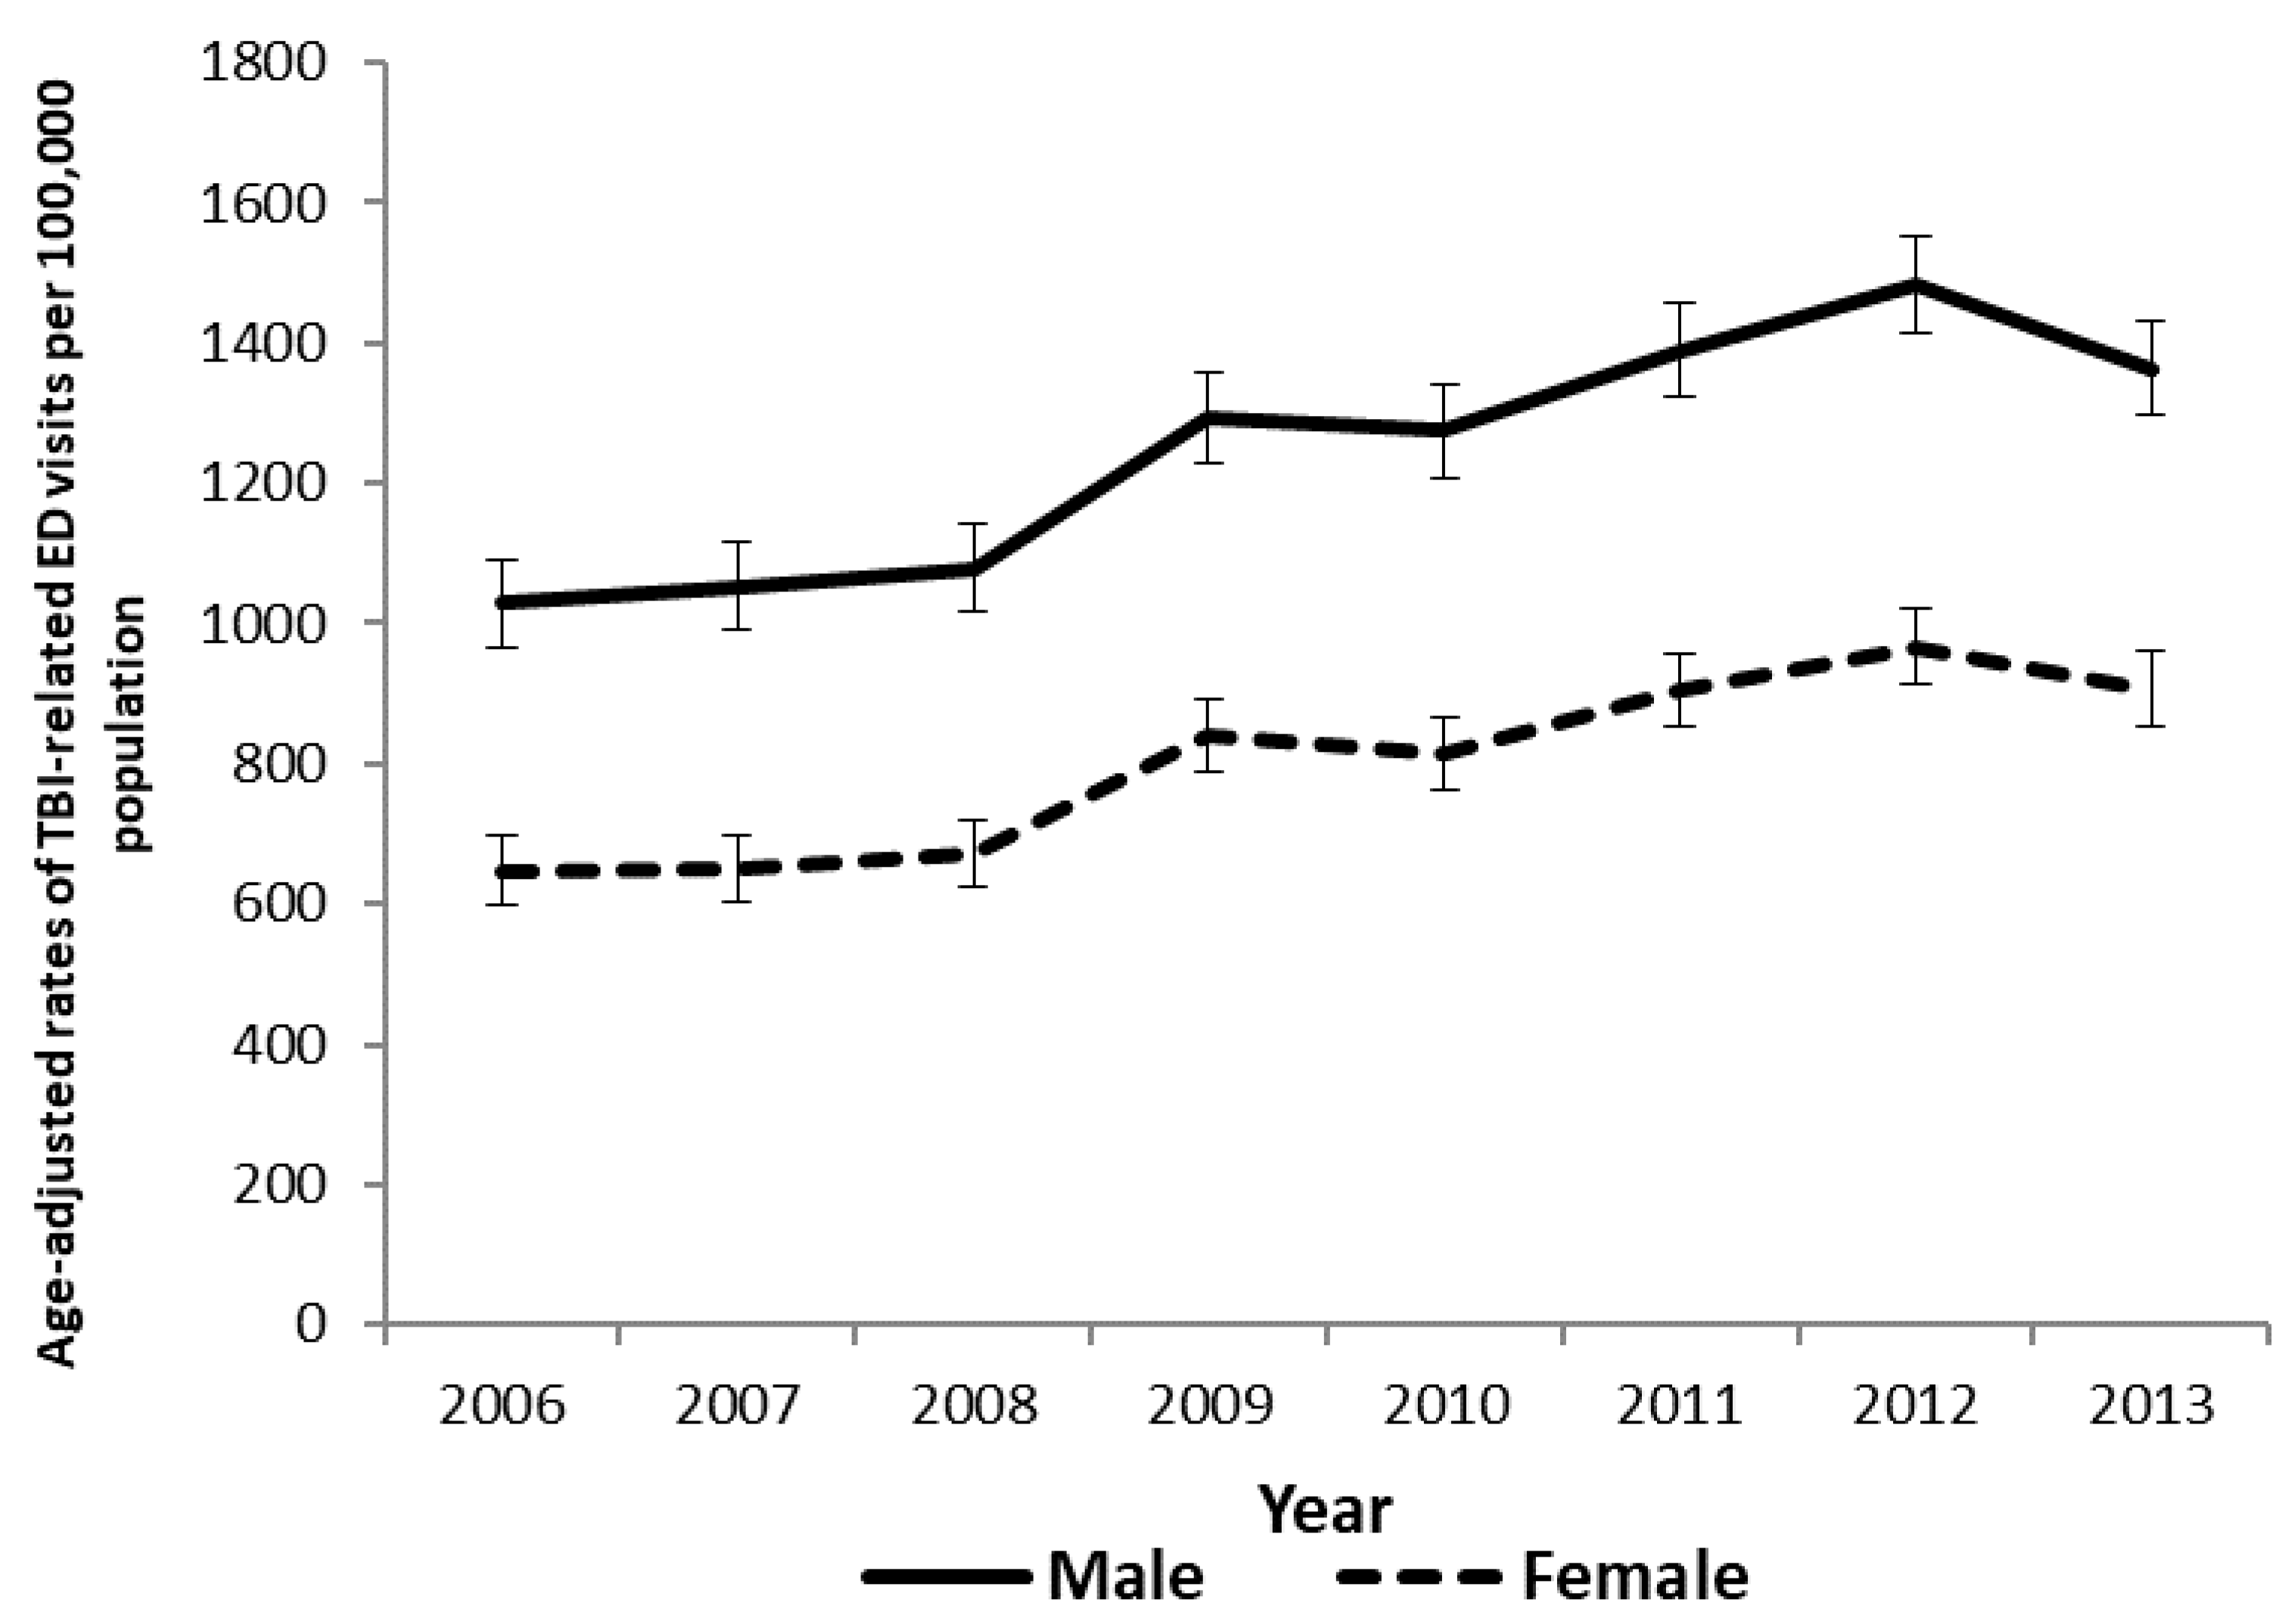
3. Results
4. Discussion
5. Conclusions
Author Contributions
Funding
Acknowledgments
Conflicts of Interest
References
- Centers for Disease Control and Prevention. Rates of Hospitalization Related to Traumatic Brain Injury—Nine States, 2003. Morb. Mortal. Wkly. Rep. 2007, 56, 167–170. [Google Scholar]
- Schneier, A.J.; Shields, B.J.; Hostetler, S.G.; Xiang, H.; Smith, G.A. Incidence of pediatric traumatic brain injury and associated hospital resource utilization in the United States. Pediatrics 2006, 118, 483–492. [Google Scholar] [CrossRef] [PubMed]
- Dewan, M.C.; Mummareddy, N.; Wellons, J.C., 3rd; Bonfield, C.M. Epidemiology of global pediatric traumatic brain injury: Qualitative review. World Neurosurg. 2016, 91, 497–509. [Google Scholar] [CrossRef] [PubMed]
- Thompson, M.C.; Wheeler, K.K.; Shi, J.; Smith, G.A.; Groner, J.I.; Haley, K.J.; Xiang, H. Surveillance of paediatric traumatic brain injuries using the NEISS: Choosing an appropriate case definition. Brain Inj. 2014, 28, 431–437. [Google Scholar] [CrossRef] [PubMed]
- Collins, C.L.; Yeates, K.O.; Pommering, T.L.; Andridge, R.; Coronado, V.G.; Gilchrist, J.; Comstock, R.D. Direct medical charges of pediatric traumatic brain injury in multiple clinical settings. Inj. Epidemiol. 2014, 1, 13. [Google Scholar] [CrossRef] [PubMed]
- Public Law 104–166. 104th Congress of United States of America. 1996. Available online: https://www.congress.gov/104/plaws/publ166/PLAW-104publ166.pdf (accessed on 1 June 2018).
- Traumatic Brain Injury Act Amendments of 2000. 106th Congress of United States of America. 2000. Available online: https://www.gpo.gov/fdsys/pkg/PLAW-106publ310/pdf/PLAW-106publ310.pdf (accessed on 1 June 2018).
- Traumatic Brain Injury Act of 2008. 110th Congress of United States of America. 2008. Available online: https://www.gpo.gov/fdsys/pkg/PLAW-110publ206/pdf/PLAW-110publ206.pdf (accessed on 1 June 2018).
- Centers for Disease Control and Prevention. Report to Congress on Traumatic Brain Injury in the United States: Epidemiology and Rehabilitation; National Center for Injury Prevention and Control; Division of Unintentional Injury Prevention: Atlanta, GA, USA, 2015.
- Chen, C.; Shi, J.; Stanley, R.M.; Sribnick, E.A.; Groner, J.I.; Xiang, H. US Trends of ED Visits for Pediatric Traumatic Brain Injuries: Implications for Clinical Trials. Int. J. Environ. Res. Public Health 2017, 14, 414. [Google Scholar] [CrossRef] [PubMed]
- Population and Housing Unit Estimates. The U.S. Census Bureau. Available online: https://www.census.gov/programs-surveys/popest.html (accessed on 1 June 2018).
- Coronado, V.G.; McGuire, L.C.; Sarmiento, K.; Bell, J.; Lionbarger, M.R.; Jones, C.D.; Geller, A.I.; Khoury, N.; Xu, L. Trends in Traumatic Brain Injury in the U.S. and the public health response: 1995–2009. J. Saf. Res. 2012, 43, 299–307. [Google Scholar] [CrossRef] [PubMed]
- Marin, J.R.; Weaver, M.D.; Yealy, D.M.; Mannix, R.C. Trends in visits for traumatic brain injury to emergency departments in the United States. JAMA 2014, 311, 1917–1919. [Google Scholar] [CrossRef] [PubMed]
- Zonfrillo, M.R.; Kim, K.H.; Arbogast, K.B. Emergency Department Visits and Head Computed Tomography Utilization for Concussion Patients from 2006 to 2011. Acad. Emerg. Med. 2015, 22, 872–877. [Google Scholar] [CrossRef] [PubMed]
- Overview of the Nationwide Emergency Department Sample (NEDS). Available online: http://www.hcup-us.ahrq.gov/nedsoverview.jsp (accessed on 31 May 2018).
- Bridged-Race Population Estimates 1990–2015. Centers for Disease Control and Prevention. Available online: https://wonder.cdc.gov/wonder/help/bridged-race.html (accessed on 1 June 2018).
- Marr, A.; Coronado, V.G. Central Nervous System Injury Surveillance Data Submission Standards—2002; Centers for Disease Control and Prevention, National Center for Injury Prevention and Control: Atlanta GA, USA, 2004.
- Matrix of E-Code Groupings. Available online: https://www.cdc.gov/injury/wisqars/ecode_matrix.html (accessed on 11 May 2018).
- Greene, N.H.; Kernic, M.A.; Vavilala, M.S.; Rivara, F.P. Validation of ICDPIC software injury severity scores using a large regional trauma registry. Inj. Prev. 2015, 21, 325–330. [Google Scholar] [CrossRef] [PubMed]
- Esteve, J.; Benhamou, E.; Raymond, L. Statistical Methods in Cancer Research. Volume IV. Descriptive Epidemiology; Scientific Publication No. 128; International Agency for Research on Cancer: Lyon, France, 1994; pp. 1–302. [Google Scholar]
- Hankey, B.F.; Ries, L.A.; Kosary, C.L.; Feuer, E.J.; Merrill, R.M.; Clegg, L.X.; Edwards, B.K. Partitioning linear trends in age-adjusted rates. Cancer Causes Control 2000, 11, 31–35. [Google Scholar] [CrossRef] [PubMed]
- Jensen, O.M.; Parkin, D.M.; MacLennan, R.; Muir, C.S.; Skeet, R.G. Cancer Registration: Principles and Methods; Scientific Publication No. 95; International Agency for Research on Cancer: Lyon, France, 1991; pp. 1–287. [Google Scholar]
- Ries, L.A.G.; Hankey, B.F.; Miller, B.A.; Clegg, L.; Edwards, B.K. SEER Cancer Statistics Review, 1973–1996; National Cancer Institute: Bethesda, MD, USA, 1999.
- Bazarian, J.J.; Veazie, P.; Mookerjee, S.; Lerner, E.B. Accuracy of mild traumatic brain injury case ascertainment using ICD-9 codes. Acad. Emerg. Med. 2006, 13, 31–38. [Google Scholar] [CrossRef] [PubMed]
- Thurman, D.J. The epidemiology of traumatic brain injury in children and youths: A review of research since 1990. J. Child Neurol. 2016, 31, 20–27. [Google Scholar] [CrossRef] [PubMed]
- Gibson, T.B.; Herring, S.A.; Kutcher, J.S.; Broglio, S.P. Analyzing the effect of state legislation on health care utilization for children with concussion. JAMA Pediatr. 2015, 169, 163–168. [Google Scholar] [CrossRef] [PubMed]
- Sosin, D.M.; Sniezek, J.E.; Thurman, D.J. Incidence of mild and moderate brain injury in the United States, 1991. Brain Inj. 1996, 10, 47–54. [Google Scholar] [PubMed]
- Dao, J. Brain Ailments in Veterans Likened to Those in Athletes. The New York Times. 12 May 2012. Available online: https://www.nytimes.com/2012/05/17/us/brain-disease-is-found-in-veterans-exposed-to-bombs.html (accessed on 1 June 2018).
- LaMotte, S. Could Veterans Have Concussion-Related CTE? CNN. 14 April 2015. Available online: https://www.cnn.com/2015/04/06/health/cte-blast-variant/index.html (accessed on 1 June 2018).
- NIH/National Institute of Neurological Disorders and Stroke. Worsening Outcomes in Service Members Five Years after Mild Blast-Induced Concussion: Research Suggests Need for New Treatment Strategies to Help Veterans Recover. 2017. Available online: https://www.sciencedaily.com/releases/2017/05/170510140746.htm (accessed on 1 June 2018).
- Smith, N.A.; Chounthirath, T.; Xiang, H. Soccer-Related Injuries Treated in Emergency Departments: 1990–2014. Pediatrics 2016, 138. [Google Scholar] [CrossRef] [PubMed]
- Rates of TBI-Related Hospitalizations by Age Group—United States, 2001–2010. Available online: https://www.cdc.gov/traumaticbraininjury/data/rates_hosp_byage.html (accessed on 16 May 2018).
- Beck, B.; Bray, J.E.; Cameron, P.A.; Cooper, D.J.; Gabbe, B.J. Trends in severe traumatic brain injury in Victoria, 2006–2014. Med. J. Aust. 2016, 204, 407. [Google Scholar] [CrossRef] [PubMed]
- Coronado, V.G.; Xu, L.; Basavaraju, S.V.; McGuire, L.C.; Wald, M.M.; Faul, M.D.; Guzman, B.R.; Hemphill, J.D. Surveillance for traumatic brain injury-related deaths—United States, 1997–2007. Morb. Mortal. Wkly. Rep. 2011, 60, 1–32. [Google Scholar]
- Hardman, J.M.; Manoukian, A. Pathology of head trauma. Neuroimaging Clin. N. Am. 2002, 12, 175–187. [Google Scholar] [CrossRef]
- Liu, B.C.; Ivers, R.; Norton, R.; Boufous, S.; Blows, S.; Lo, S.K. Helmets for preventing injury in motorcycle riders. Cochrane Database System. Rev. 2008, 23, CD004333. [Google Scholar] [CrossRef] [PubMed]
- Zink, B.J. Traumatic brain injury outcome: Concepts for emergency care. Ann. Emerg. Med. 2001, 37, 318–332. [Google Scholar] [CrossRef] [PubMed]
- Park, E.; Bell, J.D.; Baker, A.J. Traumatic brain injury: Can the consequences be stopped? Can. Med. Assoc. J. 2008, 178, 1163–1170. [Google Scholar] [CrossRef] [PubMed]
- Cook, A.; Weddle, J.; Baker, S.; Hosmer, D.; Glance, L.; Friedman, L.; Osler, T. A comparison of the Injury Severity Score and the Trauma Mortality Prediction Model. J. Trauma Acute Care Surg. 2014, 76, 47–53. [Google Scholar] [CrossRef] [PubMed]
- Kohn, M.A.; Hammel, J.M.; Bretz, S.W.; Stangby, A. Trauma team activation criteria as predictors of patient disposition from the emergency department. Acad. Emerg. Med. 2004, 11, 1–9. [Google Scholar] [CrossRef] [PubMed]


| Age | (Rate/100,000) | |||||||||||||||
|---|---|---|---|---|---|---|---|---|---|---|---|---|---|---|---|---|
| Male | Female | |||||||||||||||
| 2006 | 2007 | 2008 | 2009 | 2010 | 2011 | 2012 | 2013 | 2006 | 2007 | 2008 | 2009 | 2010 | 2011 | 2012 | 2013 | |
| 0 | 371.0 | 409.2 | 421.4 | 412.8 | 405.8 | 415.0 | 413.4 | 387.8 | 288.7 | 321.8 | 329.7 | 334.7 | 327.8 | 325.9 | 313.8 | 310.5 |
| 1 | 278.2 | 306.3 | 323.7 | 322.7 | 350.8 | 314.3 | 307.4 | 279.1 | 249.0 | 251.5 | 280.2 | 286.2 | 283.2 | 269.5 | 258.5 | 249.4 |
| 2 | 261.5 | 275.3 | 288.5 | 293.5 | 308.7 | 296.9 | 274.4 | 261.1 | 198.6 | 227.8 | 234.4 | 237.3 | 253.4 | 234.3 | 238.6 | 204.2 |
| 3 | 225.6 | 225.5 | 237.1 | 268.0 | 270.7 | 253.5 | 250.4 | 228.3 | 165.7 | 177.5 | 189.2 | 193.9 | 191.8 | 173.4 | 204.6 | 181.5 |
| 4 | 190.9 | 196.3 | 222.4 | 222.6 | 232.1 | 207.4 | 230.2 | 218.1 | 136.9 | 142.3 | 154.6 | 150.3 | 155.4 | 148.8 | 166.3 | 154.7 |
| 5 | 198.1 | 215.4 | 217.5 | 217.9 | 234.6 | 219.5 | 235.8 | 224.5 | 129.7 | 133.8 | 141.1 | 128.1 | 128.9 | 141.6 | 155.4 | 145.6 |
| 6 | 211.0 | 213.0 | 213.6 | 232.5 | 234.6 | 222.5 | 241.7 | 247.2 | 126.0 | 124.4 | 128.9 | 147.0 | 145.2 | 134.6 | 149.0 | 145.2 |
| 7 | 216.9 | 217.6 | 220.8 | 239.8 | 236.4 | 243.5 | 255.2 | 252.9 | 134.5 | 113.9 | 122.3 | 134.3 | 128.5 | 137.2 | 138.4 | 144.2 |
| 8 | 221.3 | 234.0 | 245.1 | 236.0 | 244.1 | 247.5 | 284.7 | 280.1 | 120.9 | 129.8 | 125.1 | 135.8 | 137.8 | 122.4 | 140.3 | 135.9 |
| 9 | 225.4 | 247.1 | 268.2 | 278.5 | 265.6 | 288.3 | 331.5 | 335.2 | 120.9 | 133.3 | 121.5 | 126.3 | 127.2 | 137.6 | 150.7 | 141.7 |
| 10 | 265.8 | 273.4 | 282.2 | 310.1 | 315.0 | 332.3 | 395.3 | 376.5 | 121.0 | 118.5 | 121.8 | 129.2 | 145.6 | 134.4 | 155.1 | 161.6 |
| 11 | 299.0 | 338.7 | 329.3 | 367.1 | 392.1 | 430.0 | 473.0 | 470.3 | 126.2 | 126.4 | 132.5 | 149.4 | 157.8 | 155.8 | 182.7 | 184.8 |
| 12 | 352.0 | 386.0 | 402.1 | 431.2 | 480.9 | 480.3 | 526.8 | 536.2 | 152.2 | 158.0 | 154.8 | 185.7 | 192.4 | 202.0 | 244.3 | 254.1 |
| 13 | 437.0 | 455.0 | 489.3 | 498.9 | 553.0 | 619.7 | 675.1 | 636.7 | 195.4 | 191.0 | 202.4 | 241.4 | 240.1 | 277.2 | 313.5 | 331.4 |
| 14 | 570.6 | 563.2 | 628.2 | 629.2 | 719.4 | 726.7 | 785.0 | 746.5 | 256.8 | 245.4 | 274.4 | 311.2 | 348.1 | 392.0 | 443.1 | 450.9 |
| 15 | 651.5 | 668.2 | 691.3 | 741.1 | 758.0 | 797.6 | 853.6 | 792.2 | 301.5 | 302.3 | 314.6 | 358.2 | 387.4 | 436.3 | 497.1 | 475.9 |
| 16 | 742.7 | 737.9 | 719.7 | 778.7 | 807.5 | 802.2 | 858.8 | 801.7 | 348.1 | 361.3 | 377.0 | 405.0 | 414.9 | 443.3 | 486.6 | 469.8 |
| 17 | 775.7 | 767.6 | 789.6 | 808.1 | 859.7 | 775.0 | 808.6 | 771.9 | 387.2 | 358.8 | 391.4 | 401.7 | 429.0 | 434.6 | 463.5 | 471.5 |
| TBI Types/Reason | (Rate/100,000) | Annual Percent Change | (95% CI) | p-Value | ||||||||
|---|---|---|---|---|---|---|---|---|---|---|---|---|
| 2006 | 2007 | 2008 | 2009 | 2010 | 2011 | 2012 | 2013 | |||||
| TBI type a: | ||||||||||||
| Intracranial injury of other and unspecified nature | 16.7 | 14.7 | 11.8 | 11.1 | 11.7 | 9.0 | 7.5 | 8.5 | −10.0 | −13.2 | −6.7 | 0.00 |
| Cerebral laceration and contusion | 7.1 | 7.7 | 6.2 | 6.1 | 5.8 | 5.1 | 4.7 | 4.3 | −7.7 | −9.6 | −5.7 | <0.0001 |
| Shaken infant syndrome | 0.8 | 1.0 | 0.8 | 0.5 | 0.6 | 0.7 | 0.6 | 0.7 | −5.2 | −11.6 | 1.7 | 0.11 |
| Multiple fractures involving skull or face with other bones | 0.6 | 0.6 | 0.5 | 0.7 | 0.5 | 0.5 | 0.5 | 0.4 | −4.7 | −10.3 | 1.3 | 0.10 |
| Other and unspecified intracranial hemorrhage following injury | 3.3 | 2.9 | 3.5 | 3.9 | 3.1 | 2.9 | 2.4 | 2.8 | −3.4 | −7.9 | 1.3 | 0.13 |
| Fracture of base of skull | 26.7 | 26.9 | 27.7 | 25.2 | 26.6 | 23.3 | 22.4 | 21.6 | −3.3 | −5.1 | −1.6 | 0.00 |
| Subarachnoid, subdural, and extradural hemorrhage, following injury | 11.6 | 11.1 | 12.2 | 11.3 | 10.8 | 10.2 | 9.8 | 10.5 | −2.3 | −4.0 | −0.5 | 0.02 |
| Fracture of vault of skull | 17.9 | 19.9 | 20.4 | 17.2 | 17.6 | 17.6 | 17.2 | 17.7 | −1.5 | −3.7 | 0.9 | 0.17 |
| Other and unqualified skull fractures | 8.4 | 8.1 | 8.4 | 8.2 | 9.1 | 8.6 | 8.4 | 8.2 | 0.3 | −1.2 | 1.7 | 0.69 |
| Concussion | 271.8 | 284.7 | 300.8 | 324.9 | 344.8 | 352.6 | 386.7 | 365.6 | 5.1 | 3.7 | 6.5 | <0.0001 |
| Head injury, unspecified | 664.9 | 675.0 | 686.5 | 884.7 | 844.0 | 959.7 | 1022.7 | 924.0 | 6.6 | 3.4 | 9.8 | 0.00 |
| Injury to optic chiasm | 0.0 | 0.1 | 0.0 | 0.0 | 0.1 | 0.1 | 0.2 | 0.2 | 21.2 | −13.1 | 68.9 | 0.21 |
| TBI injury mechanism: | ||||||||||||
| Motor Vehicle Trauma b | 93.4 | 89.2 | 82.3 | 82.4 | 84.4 | 78.2 | 81.3 | 75.1 | −2.5 | −3.7 | −1.3 | 0.00 |
| Other | 246.1 | 233.1 | 244.9 | 221.5 | 194.3 | 220.8 | 209.5 | 229.3 | −1.7 | −4.4 | 1.0 | 0.17 |
| Fall | 423.0 | 457.4 | 470.8 | 590.8 | 589.7 | 644.3 | 698.6 | 620.8 | 7.1 | 3.9 | 10.3 | 0.00 |
| Struck | 267.3 | 273.1 | 280.7 | 399.2 | 406.2 | 446.9 | 493.7 | 439.1 | 9.8 | 5.4 | 14.3 | 0.00 |
| TBI severity c: | ||||||||||||
| Severe | 60.1 | 61.6 | 61.6 | 56.2 | 56.6 | 51.6 | 48.5 | 49.1 | −3.6 | −5.0 | −2.3 | 0.00 |
| Not further specified (NFS) | 0.5 | 0.6 | 0.4 | 0.4 | 0.4 | 0.5 | 0.4 | 0.6 | −1.8 | −8.2 | 4.9 | 0.52 |
| Mild | 969.2 | 990.6 | 1016.7 | 1237.3 | 1217.6 | 1338.2 | 1434.2 | 1314.6 | 5.9 | 3.4 | 8.4 | 0.00 |
| TBI Type/Reason | (Rate/100,000) | APC | (95% CI) | p-Value | ||||||||
|---|---|---|---|---|---|---|---|---|---|---|---|---|
| 2006 | 2007 | 2008 | 2009 | 2010 | 2011 | 2012 | 2013 | |||||
| TBI type a: | ||||||||||||
| Intracranial injury of other and unspecified nature | 10.4 | 9.0 | 7.5 | 6.6 | 7.0 | 5.1 | 5.0 | 5.7 | −9.3 | −13.0 | −5.5 | 0.00 |
| Cerebral laceration and contusion | 3.7 | 4.3 | 3.3 | 3.2 | 3.0 | 2.3 | 2.4 | 2.6 | −7.5 | −11.1 | −3.7 | 0.00 |
| Shaken infant syndrome | 0.6 | 0.7 | 0.6 | 0.6 | 0.7 | 0.4 | 0.4 | 0.4 | −6.8 | −11.7 | −1.7 | 0.02 |
| Multiple fractures involving skull or face with other bones | 0.2 | 0.4 | 0.3 | 0.3 | 0.2 | 0.2 | 0.3 | 0.2 | −5.7 | −14.2 | 3.5 | 0.17 |
| Other and unspecified intracranial hemorrhage following injury | 1.8 | 1.9 | 1.8 | 1.8 | 1.5 | 1.9 | 1.2 | 1.5 | −4.0 | −8.3 | 0.4 | 0.07 |
| Fracture of base of skull | 6.7 | 6.0 | 6.4 | 5.8 | 5.5 | 5.3 | 6.0 | 5.4 | −2.5 | −4.5 | −0.4 | 0.03 |
| Subarachnoid, subdural, and extradural hemorrhage, following injury | 12.2 | 13.3 | 13.7 | 12.5 | 12.8 | 10.6 | 11.0 | 11.5 | −2.5 | −5.1 | 0.2 | 0.07 |
| Fracture of vault of skull | 10.0 | 12.1 | 13.0 | 10.6 | 11.4 | 11.0 | 11.1 | 10.7 | −0.4 | −3.6 | 2.9 | 0.76 |
| Injury to optic pathways | 4.8 | 5.7 | 5.0 | 5.1 | 4.6 | 5.4 | 5.5 | 4.7 | −0.1 | −3.2 | 3.0 | 0.92 |
| Concussion | 148.3 | 148.5 | 160.1 | 179.8 | 187.5 | 198.1 | 219.9 | 215.3 | 6.5 | 5.1 | 7.8 | <0.0001 |
| Head injury, unspecified | 449.0 | 448.9 | 461.2 | 612.5 | 580.2 | 664.2 | 702.9 | 648.5 | 7.2 | 3.9 | 10.7 | 0.00 |
| Injury to optic chiasm | 0.0 | 0.1 | 0.1 | 0.1 | 0.1 | 0.1 | 0.1 | 0.1 | 13.6 | −2.1 | 31.7 | 0.08 |
| TBI injury mechanism: | ||||||||||||
| Motor Vehicle Trauma b | 85.6 | 77.9 | 70.9 | 75.3 | 77.5 | 77.4 | 78.3 | 74.8 | −0.7 | −2.7 | 1.3 | 0.41 |
| Other | 126.7 | 119.5 | 126.1 | 124.2 | 104.1 | 122.7 | 117.4 | 133.9 | 0.0 | −2.9 | 3.1 | 0.97 |
| Fall | 309.8 | 325.0 | 338.6 | 437.6 | 434.9 | 478.8 | 512.5 | 465.8 | 7.6 | 4.3 | 11.0 | 0.00 |
| Struck | 125.6 | 128.4 | 137.4 | 201.7 | 198.0 | 225.7 | 257.6 | 232.0 | 11.6 | 7.1 | 16.4 | 0.00 |
| TBI severity c: | ||||||||||||
| Not further specified (NFS) | 0.4 | 0.5 | 0.3 | 0.4 | 0.4 | 0.3 | 0.3 | 0.3 | −3.5 | −7.9 | 1.1 | 0.11 |
| Severe | 30.6 | 31.9 | 32.1 | 28.8 | 28.5 | 25.2 | 26.2 | 26.2 | −3.3 | −5.1 | −1.5 | 0.00 |
| Mild | 616.7 | 618.3 | 640.5 | 809.6 | 785.6 | 879.1 | 939.3 | 880.1 | 6.8 | 4.0 | 9.6 | 0.00 |
© 2018 by the authors. Licensee MDPI, Basel, Switzerland. This article is an open access article distributed under the terms and conditions of the Creative Commons Attribution (CC BY) license (http://creativecommons.org/licenses/by/4.0/).
Share and Cite
Chen, C.; Peng, J.; Sribnick, E.A.; Zhu, M.; Xiang, H. Trend of Age-Adjusted Rates of Pediatric Traumatic Brain Injury in U.S. Emergency Departments from 2006 to 2013. Int. J. Environ. Res. Public Health 2018, 15, 1171. https://doi.org/10.3390/ijerph15061171
Chen C, Peng J, Sribnick EA, Zhu M, Xiang H. Trend of Age-Adjusted Rates of Pediatric Traumatic Brain Injury in U.S. Emergency Departments from 2006 to 2013. International Journal of Environmental Research and Public Health. 2018; 15(6):1171. https://doi.org/10.3390/ijerph15061171
Chicago/Turabian StyleChen, Cheng, Jin Peng, Eric A. Sribnick, Motao Zhu, and Henry Xiang. 2018. "Trend of Age-Adjusted Rates of Pediatric Traumatic Brain Injury in U.S. Emergency Departments from 2006 to 2013" International Journal of Environmental Research and Public Health 15, no. 6: 1171. https://doi.org/10.3390/ijerph15061171
APA StyleChen, C., Peng, J., Sribnick, E. A., Zhu, M., & Xiang, H. (2018). Trend of Age-Adjusted Rates of Pediatric Traumatic Brain Injury in U.S. Emergency Departments from 2006 to 2013. International Journal of Environmental Research and Public Health, 15(6), 1171. https://doi.org/10.3390/ijerph15061171