Article

Mosses Are Better than Leaves of Vascular Plants in Monitoring Atmospheric Heavy Metal Pollution in Urban Areas

Key Laboratory of Arable Land Conservation (Middle and Lower Reaches of Yangtze River), Ministry of Agriculture, College of Resources and Environment, Huazhong Agricultural University, Wuhan 430070, China
*
Author to whom correspondence should be addressed.
Int. J. Environ. Res. Public Health 2018, 15(6), 1105; https://doi.org/10.3390/ijerph15061105
Submission received: 2 April 2018 / Revised: 25 May 2018 / Accepted: 25 May 2018 / Published: 29 May 2018
(This article belongs to the Section Environmental Health)

Abstract

:
Mosses and leaves of vascular plants have been used as bioindicators of environmental contamination by heavy metals originating from various sources. This study aims to compare the metal accumulation capabilities of mosses and vascular species in urban areas and quantify the suitability of different taxa for monitoring airborne heavy metals. One pleurocarpous feather moss species, Haplocladium angustifolium, and two evergreen tree species, Cinnamomum bodinieri Osmanthus fragrans, and substrate soil were sampled in the urban area of different land use types in Wuhan City in China. The concentrations of Ag, As, Cd, Co, Cr, Cu, Mn, Mo, Ni, V, Pb, and Zn in these samples were analyzed by inductively coupled plasma mass spectrometry. The differences of heavy metals concentration in the three species showed that the moss species was considerably more capable of accumulating heavy metals than tree leaves (3 times to 51 times). The accumulated concentration of heavy metals in the moss species depended on the metal species and land use type. The enrichment factors of metals for plants and the correlations of metals in plants with corresponding metals in soil reflected that the accumulated metals in plants stemmed mostly from atmospheric deposition, rather than the substrate soil. Anthropogenic factors, such as traffic emissions from automobile transportation and manufacturing industries, were primarily responsible for the variations in metal pollutants in the atmosphere and subsequently influenced the metal accumulation in the mosses. This study elucidated that the moss species H. angustifolium is relatively more suitable than tree leaves of C. bodinieri and O. fragrans in monitoring heavy metal pollution in urban areas, and currently Wuhan is at a lower contamination level of atmospheric heavy metals than some other cities in China.

1. Introduction

Air pollution, which is a consequence of urbanization and industrialization, together with the rapid growth of motorized transportation and population, is one of the most serious threats to the environment and human health in the world, especially in urban areas; moreover, atmospheric heavy metals (e.g., Cr, Cu, Zn, Cd, and Pb) are considered an important group of air pollutants [1,2,3,4,5]. Monitoring and management of air pollution have been conducted for a long time and remain prevalent [6]. At present, the main tools used in assessing air pollution in urban areas include chemical monitoring and biomonitoring. Chemical monitoring is an active technique and can provide information about the levels of different pollutants in the atmosphere. This technique usually requires deploying large numbers of deposition collectors with long-term and short-time intervals of routine sample collection; thus, it is expensive, incapable of detecting extremely heavy metals, and difficult to use for collecting long-time accumulation due to capacity limitation [7]. Biomonitoring methods combined with chemical analyses have been extensively researched and applied in recent years [8,9,10].
Various biological matrices have been used in biomonitoring to assess air quality and atmospheric elements, such as soil crust [11], lichens [1,12,13,14,15], bryophytes [16,17,18,19,20,21,22], tree barks and leaves [10,23,24,25]. Of all these biological groups, lichens and bryophytes (mosses) are more frequently used than the other groups to detect atmospheric metal deposition in terrestrial ecosystems, and they are especially recommended for use in large-scale surveys due to their special morphological structures, accumulation mechanisms, and ecophysiology [7,26]. Mosses and lichens have no cuticle layer and no real roots. They can absorb nutrients, pollutants, and moisture directly from the ambient air and retain them. The analysis of metal content in mosses or lichens reflects the atmospheric metal deposition. These cryptogams are distributed widely throughout the world, and their morphologies do not vary with the seasons; thus, using them has the advantages of low cost and easy application throughout the year; that is, biomonitoring allows simultaneous monitoring and sampling at multiple sites [7,19]. Nevertheless, in comparison with lichens, mosses are more geographically extensive in their distribution, more commonly occur in urban areas, and are more convenient to use by employing passive and active accumulators [17,27]. Mosses act as bioindicators and bioaccumulators of metal deposition in the environment, often by considering the diversity and development of naturally growing bryophytes and moss bags, and have been extensively employed over the past decades in the studies of atmospheric contamination, especially by heavy metals [28,29,30,31]. Mosses, particularly the pleurocarpous feather species, are considered suitable biomonitors for assessing the long-term accumulation of deposited airborne metals because of the aforementioned morphologies, their high cationic exchange capacity, and high surface-to-volume or -weight ratio, which favours the accumulation of pollutants [31]. Vascular plants (trees) are not better indicators for air pollution monitoring than mosses or lichens; however, they are the major plant types found in urban areas with high degrees of pollution, where mosses are rarely distributed; thus, trees have been introduced to monitor heavy metal pollution in recent years [32]. The tree species used as biomonitors for air and soil pollution are diverse along different counties, and most of them are evergreen trees, including needles and broadleaves [9,23,33,34]. Only a few studies have reported the biomonitoring of airborne heavy metal by mosses and trees simultaneously, and tree barks are widely applied [35,36,37].
Wuhan, a city recognized as the political, economic, financial, cultural, educational, and major transportation center in Central China, is located at latitude 29°58′–31°22′ N and longitude 113°41′–115°05′ E, east of the Jianghan Plain, and is at the confluence of the Han River and Yangtze River along the middle reaches of the latter. This city is characterized by a subtropical humid monsoon climate with distinct seasonal divisions. The mean monthly air temperature is from 3 to 28.8 °C, with January being the coldest month. The annual precipitation is from 1100 to 1300 mm, half of which occurs between May and July. The wind speed in the city is not strong, with annual mean wind velocity approximately 1.8 m s−1 and no obvious variations among months (http://www.weather.com.cn/). As a major transportation hub, dozens of railways, roads, and expressways pass through Wuhan. The heavy industries, including steel works, are also in development. Chemical monitoring is set in several positions in the city, which provides real-time air quality measurements, including the levels of different pollutants in the atmosphere (e.g., PM10, SO2, NO2, CO, and O3; data available at http://hbj.wuhan.gov.cn/). To date, the use of mosses as bioindicators for the study of the dynamics of atmosphere pollution in China has been proven in several studies [21,27,38]. However, whether mosses or vascular species are more applicable in monitoring air pollution has not been determined, especially in rapid-urbanization cities, such as Wuhan. Thus, the aims of this study are (1) to test whether the metal accumulation capabilities are different in mosses and vascular species in the urban area of Wuhan where different eco-functional uses are covered; and (2) to quantify the suitability of moss or tree leaves for monitoring airborne heavy metal pollution.

2. Materials and Methods

2.1. Sample Collection

The study was conducted in the urban area of Wuhan City, Hubei Province, China. Nine sampling sites with different land uses in March 2017 were set in the urban area. These land use types were decided according to the Wuhan urban function zonation (http://gtghj.wuhan.gov.cn/), and included industry, main roadside, university campus, and residential area, which represented different urban eco-functional regions and human activities that would influence the atmospheric pollution. The detailed information of the nine sampling sites is provided in Figure 1 and Table 1.
A moss species (Haplocladium angustifolium) and two vascular species (Cinnamomum bodinieri and Osmanthus fragrans) were used as indicator species. The H. angustifolium is the most dominant moss species in Wuhan [39], with creeping main stems and pinnate branching systems. The two vascular species are evergreen broadleaved trees, and are planted as decorative and street trees in the urban area of Wuhan. All three species are widely distributed and easy to collect in the city.
In the open and green vegetated area of each sampling site, three replicates of H. angustifolium grow in the ground; nearby, C. bodinieri, O. fragrans and surface soil (with a depth of 0–5 cm) were collected. For tree species, five leaves in the middle parts of the branches (approximately 2 or 3 years old) from each side (i.e., west, east, south, and north) of a tree were collected and mixed as one sample, three replicates were sampled on three trees. All sampled materials were picked up with a plastic shovel and stored in plastic bags to avoid manual contamination, and then taken back to laboratory for further analysis.

2.2. Sample Preparation and Chemical Analysis

Dead material, soil particles, and litter were manually removed for the moss samples. The green or greenish-brown parts of mosses and tree leaves were then cleaned from dust particles with deionized water. These plant and soil samples were dried to a constant weight in a thermostatic drying machine for 48 h at 40 °C. The plant samples were then ground into fine powder in a mill. The soil samples were homogenized with a mortar and pestle after the coarse material was removed using a 2 mm sieve. All these powder samples were kept in clean, dry paper bags. The use of metal equipment was avoided during the operation process to avoid affecting the results of the experimental measurements. Approximately 0.5 g of each plant sample was transferred into a digestion tube and cold digested with 10 mL of mixed acid (HNO3:H2O2 = 4:1), and 0.25 g of each soil sample was digested with 10 mL of mixed acid (HNO3:HCl:HF = 3:1:1) for 30 min and then moved to a microwave oven (Mars 6, CEM, Matthews, NC, USA) for enhanced digestion until transparent solutions were obtained. Here we used different mixed acid for digesting plants and soil because there were large amounts of silicate contained in the soil samples that could not be digested completely in mixed acid of HNO3 and H2O2, but could easily be digested in HF.
After cooling, the plant and soil digests were transferred to a 50 mL volumetric flask. The plant was then filled with deionized water to 25 mL and soil to 50 mL. The presence and concentrations of heavy metals (i.e., Ag, As, Cd, Co, Cr, Cu, Mn, Mo, Ni, Pb, V, and Zn) were determined by inductively coupled plasma mass spectrometry (ICP-MS, Flexar LC-NexION 350X, PerkinElmer, Shelton, CT, USA). The concentration of each element in the moss sample was corrected by subtracting blank values. A blank and a plant standard GBW07603 (GSW-2, IGGE, Langfang, China) or a soil standard GBW07403 (GSS-3, IGGE, Langfang, China) were analyzed to check the accuracy and precision of each metal analysis. The recovery percentages of heavy metals were >85% for quantitative analysis. Three replicate measurements per plant and soil sample were performed.

2.3. Data Analyses

Concentration values were given as minimum, maximum, mean, and standard deviation (SD). The statistical significance of concentration differences among materials was determined by one-way ANOVA.
Enrichment factors (EF), which determines an element potentially available to an organism from soil, and also evaluates the contribution made by sources other than soil, were calculated for each metal M in different plant biomonitors following Equation (1) using Al as the normalizing element and the soil as the reference [40]:
EF = ( M Al ) plant ( M Al ) Soil
where M is the concentration of the metal in three plant species under analysis and Al is the concentration of the reference metal chosen, which was determined by ICP-MS. EF ≤ 1 indicates that there is no enrichment of the metal in any of the biomonitors, and values of greater than 1 indicate that there is enrichment of metal M relative to its level in the soil.
The contamination factor (CF) was employed to determine the contamination level of each metal in the study area according to Equation (2):
CF = Cplant/Cbackground
where Cplant is the concentration of the metal in the plant sample in a sample site, Cbackground corresponds the plant samples from clean site (uncontaminated or very slightly contaminated). The scale for interpretation of results would consist of various categories according to the CF values: C1 (CF < 1), none contaminated; C2 (CF: 1 to 2), suspected; C3 (CF: 2 to 3.5), slightly contaminated; C4 (CF: 3.5 and 8), moderated contaminated; C5 (CF: 8 to 27), serious contaminated; C6 (CF > 27), extreme contaminated [40].
Multiple comparisons were performed to determine whether any differences existed between the averages of the materials and sites assumed as polluted and the control region. Pearson’s correlation coefficients (r) were calculated to establish the possible correlations between metal concentrations in mosses and soils and among different metals in mosses. Factor analysis with the principal component factoring method based on eigenvalue was employed as an extension of the correlation analysis to clarify the links among metals that tended to have similar origins at the sampling sites and infer possible sources of heavy metals. Dataset was transformed to normal distribution before parametric statistics analyses. All the statistical analyses were performed using the R software.

3. Results and Discussion

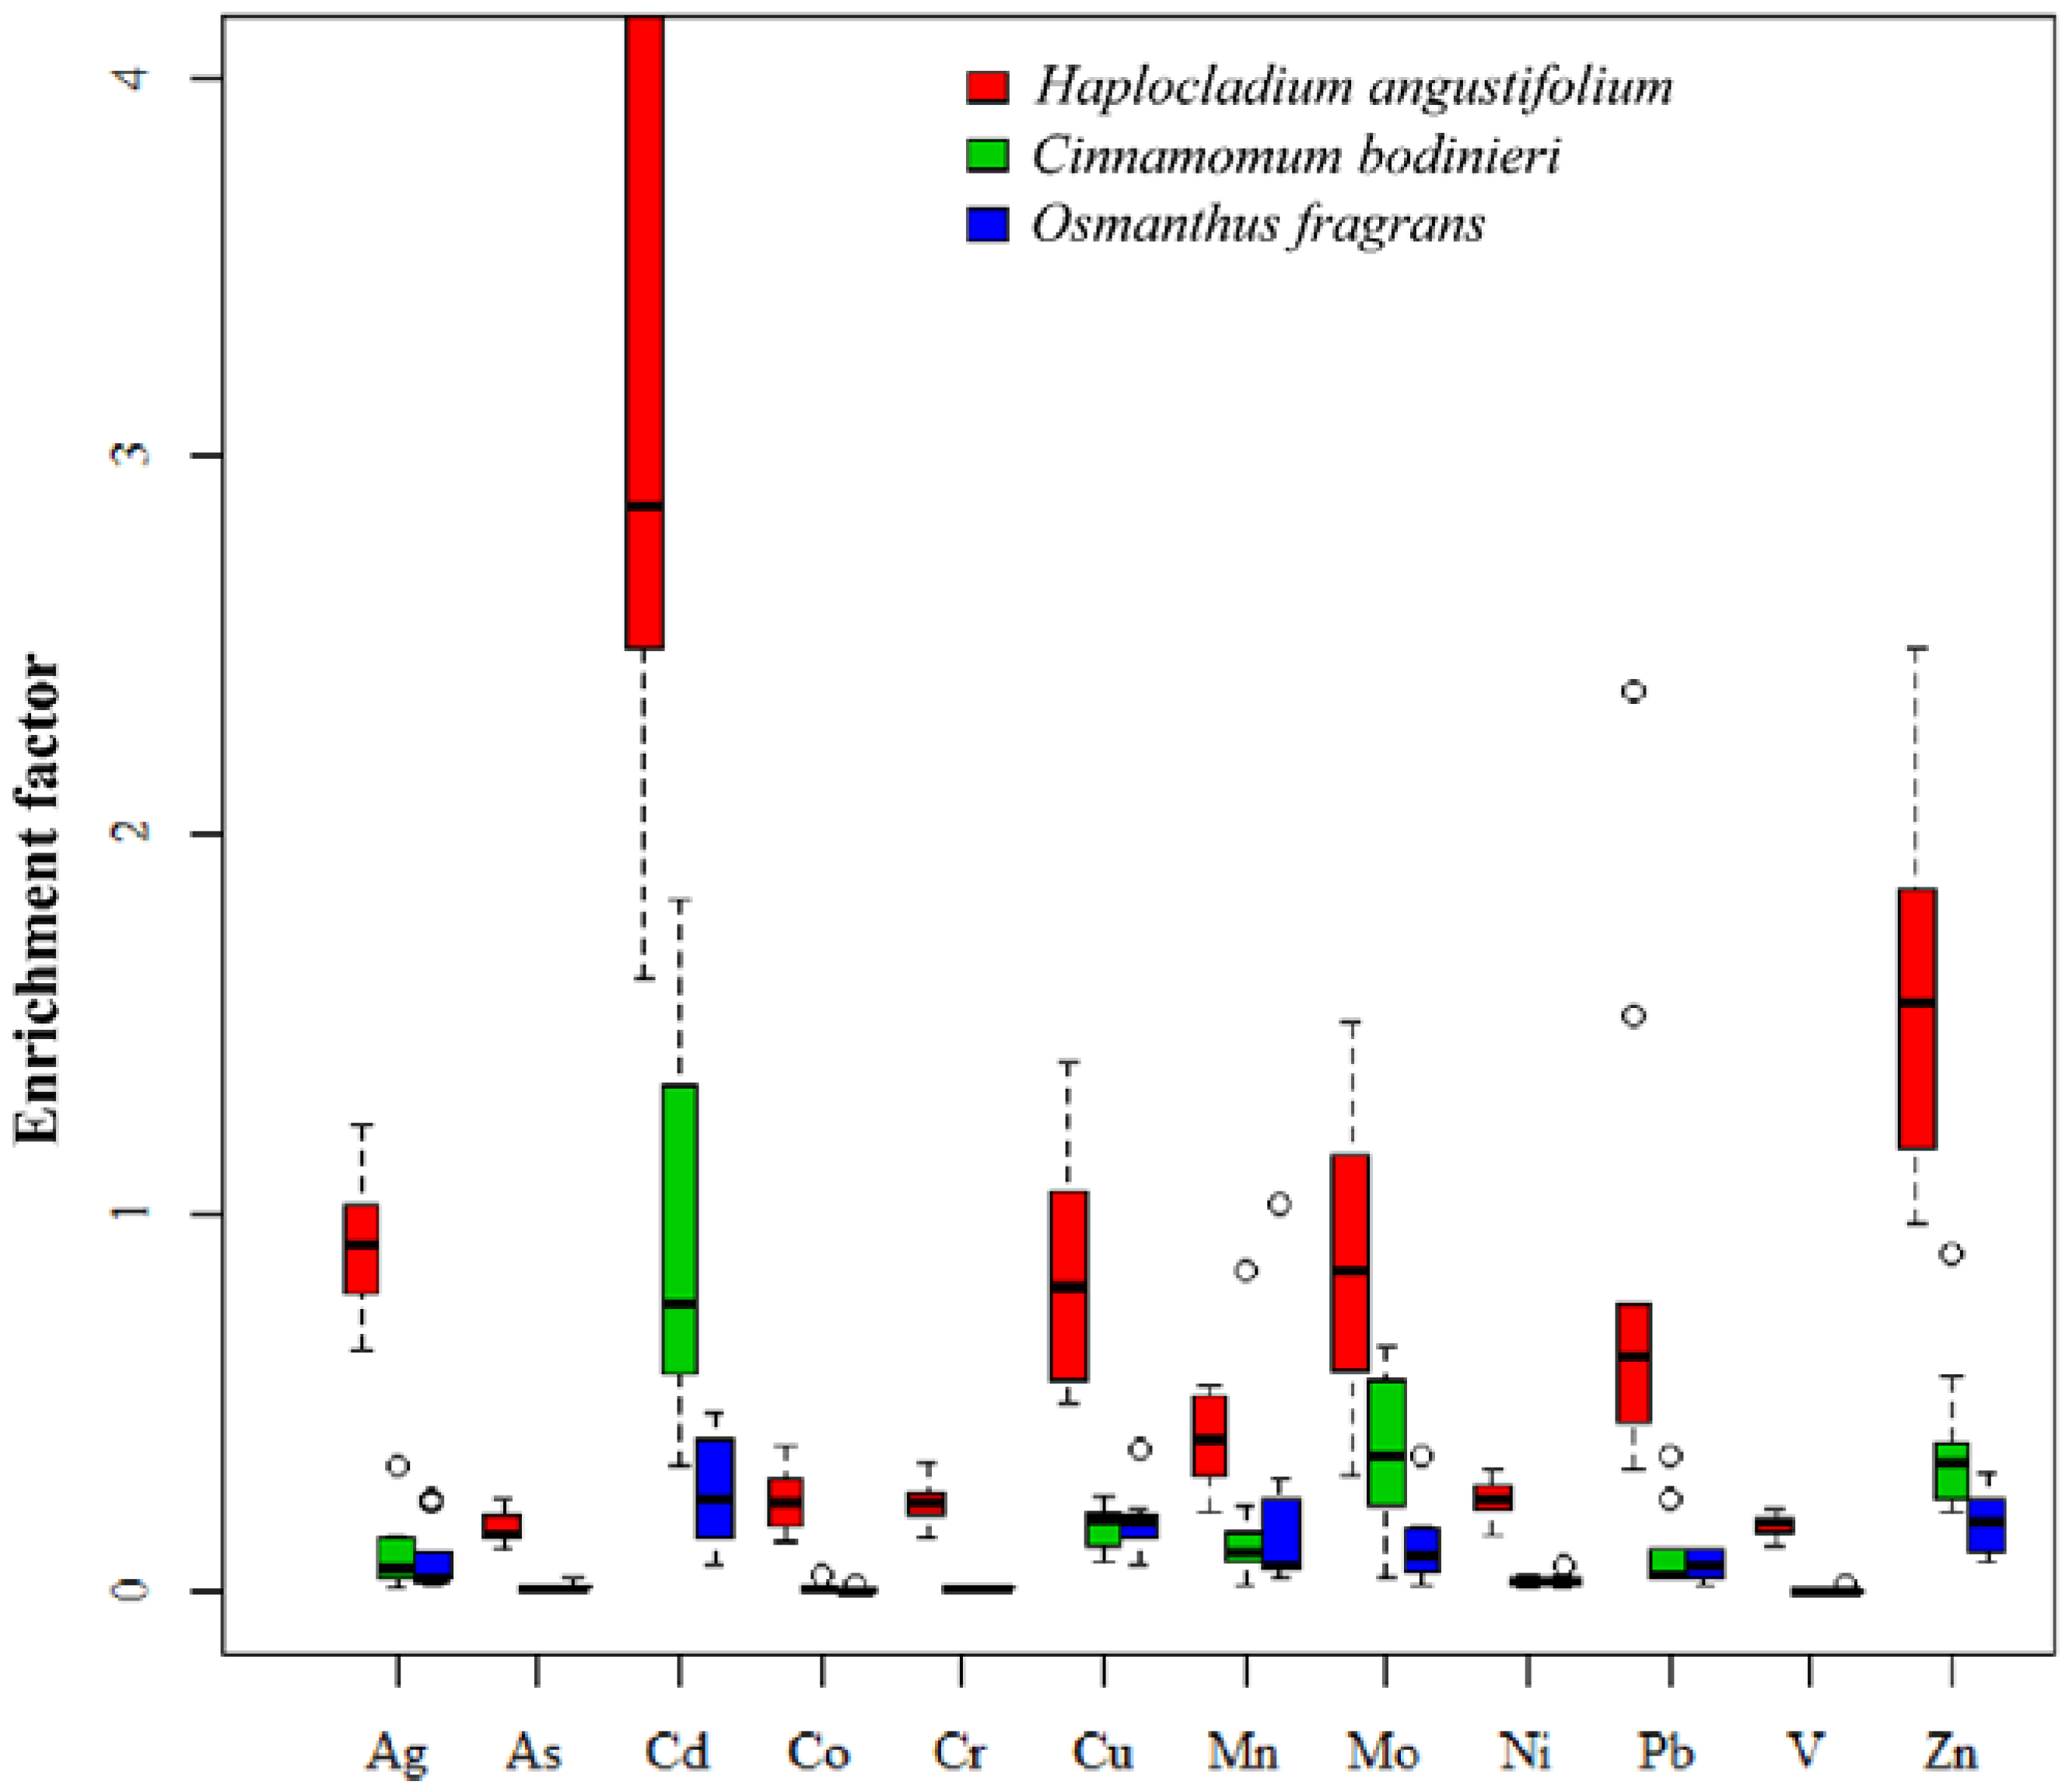
3.1. Comparisons of Trace Element Concentrations in Moss with That in Leaves of Vascular Species

The ranges of metal concentrations in the moss species H. angustifolium and in the leaves of the vascular species C. bodinieri and O. fragrans are displayed in Table 2. The metal concentrations in moss and vascular species differed significantly (p < 0.05) and varied at different sampling sites because the minimum, maximum, and SD values varied considerably (e.g., Mn (range: 127–700 μg g−1, SD: 189 μg g−1). The metal concentrations in mosses were as follows: Mo > Mn > Zn > Pb > Cu > V > Cr > Ni > Co > As > Cd > Ag, with the mean values of Mo, Mn, and Zn being higher than 100 μg g−1 and those of Cd and Ag less than 1 μg g−1. Of the vascular plants, the interspecies differences in heavy metal concentrations were generally insignificant. The metal concentrations in C. bodinieri were as follows: Mn > Mo > Zn > Cu > Pb > V > Cr > Ni > As > Co > Cd > Ag, with only Mn exceeding 100 μg g−1 and most metals being less than 1 μg g−1. The metal concentrations in O. fragrans were as follows: Mo > Mn > Zn > Cu > Pb > V > Ni > Cr > Co > As > Cd > Ag, with Mo and Mn being higher than 100 μg g−1 and most metals being less than 1 μg g−1. All of these metals in leaves of the two tree species were much lower than those in soil samples. Even for H. angustifolium, only the concentration of Ag, Cd, and Zn were higher than those in soil, and the concentration of Cu, Mo and Pb were similar in both H. angustifolium and soil samples (Table 2).
The accumulation capabilities of metals by mosses were stronger than those by tree leaves. Table 3 indicates that mosses accumulated heavy metals 4 times to 51 times more than C. bodinieri and 3 times to 18 times more than O. fragrans. The obviously higher metal concentrations in the moss species than those in both tree leaves observed in this study indicated the metal accumulation capabilities of mosses. A similar trend has been reported in Harjavalta in Finland, where the heavy metal (i.e., Fe, Zn, Cu, Ni, Cd, and Pb) concentrations were ordered as bryophytes > lichens > vascular plants, with the exception of Mn, which followed the order: vascular plants > bryophytes > lichens [37]. Mn concentration was also not consistently higher in mosses than in vascular plants from all sampling sites in our study, that is, the Mn concentrations in C. bodinieri and O. fragrans from the HZ were higher than those in mosses (Table S1). High mean concentrations of the metals Mn, Zn, Pb, and Cu were also found in moss samples in Istanbul and the Sivas–Tokat motorway in Turkey [20,41] and Kosovo [29]. Of different vascular plants, needle-leaved trees were used more than broad-leaved trees, and pine tree barks were considered more suitable than needles for biomonitoring purposes [42,43], possibly due to their long-time exposure to air pollution.
EFs of all metals in H. angustifolium were much higher than those in the two vascular plants, and EFs of Cd, Zn Cu and Mo were highly varied among sampling sites (Figure 2). EFs of H. angustifolium showed that the moss species was particularly capable of accumulating Cd, Zn, and Ag, with their EFs being higher than 1. However, the EFs of most metals in the three plants were lower than 1. This can be explained with regard to several aspects, one was that the plant species were incapable of accumulating such metals; secondly, mineral particles trapped by the moss species and tree leaves maybe incompletely solubilized in the case of the digestion method for plants was different from that for soil; and thirdly, these heavy metals were possibly absorbed from sources other than soil. Whether the metals were absorbed from soil or other sources can be roughly determined by the correlation analyses of metals accumulation between plants and soil (Table S2). Vascular plants can uptake metals by roots from soil, absorb atmospheric depositions, and restrict the uptake of toxic elements [37]. Therefore, the heavy metal accumulation of vascular plants was considerably more complicated than that of mosses. Considerable differences in toxic element limits even exist between vascular plant species and ecotypes [44]. Zn and Cu are essential elements to higher plants and are involved in several metabolic processes; thus, they are the least toxic and are often present in higher concentrations [44]. The concentration levels of other toxic elements (i.e., Ag, As, Cd, Cr, and Pb) in the mosses and tree leaves did not exceed those reported as possibly toxic to cultivated soils and plants [45]. Generally, mosses are much more resistant to high levels of toxic elements than vascular plants [31,44].

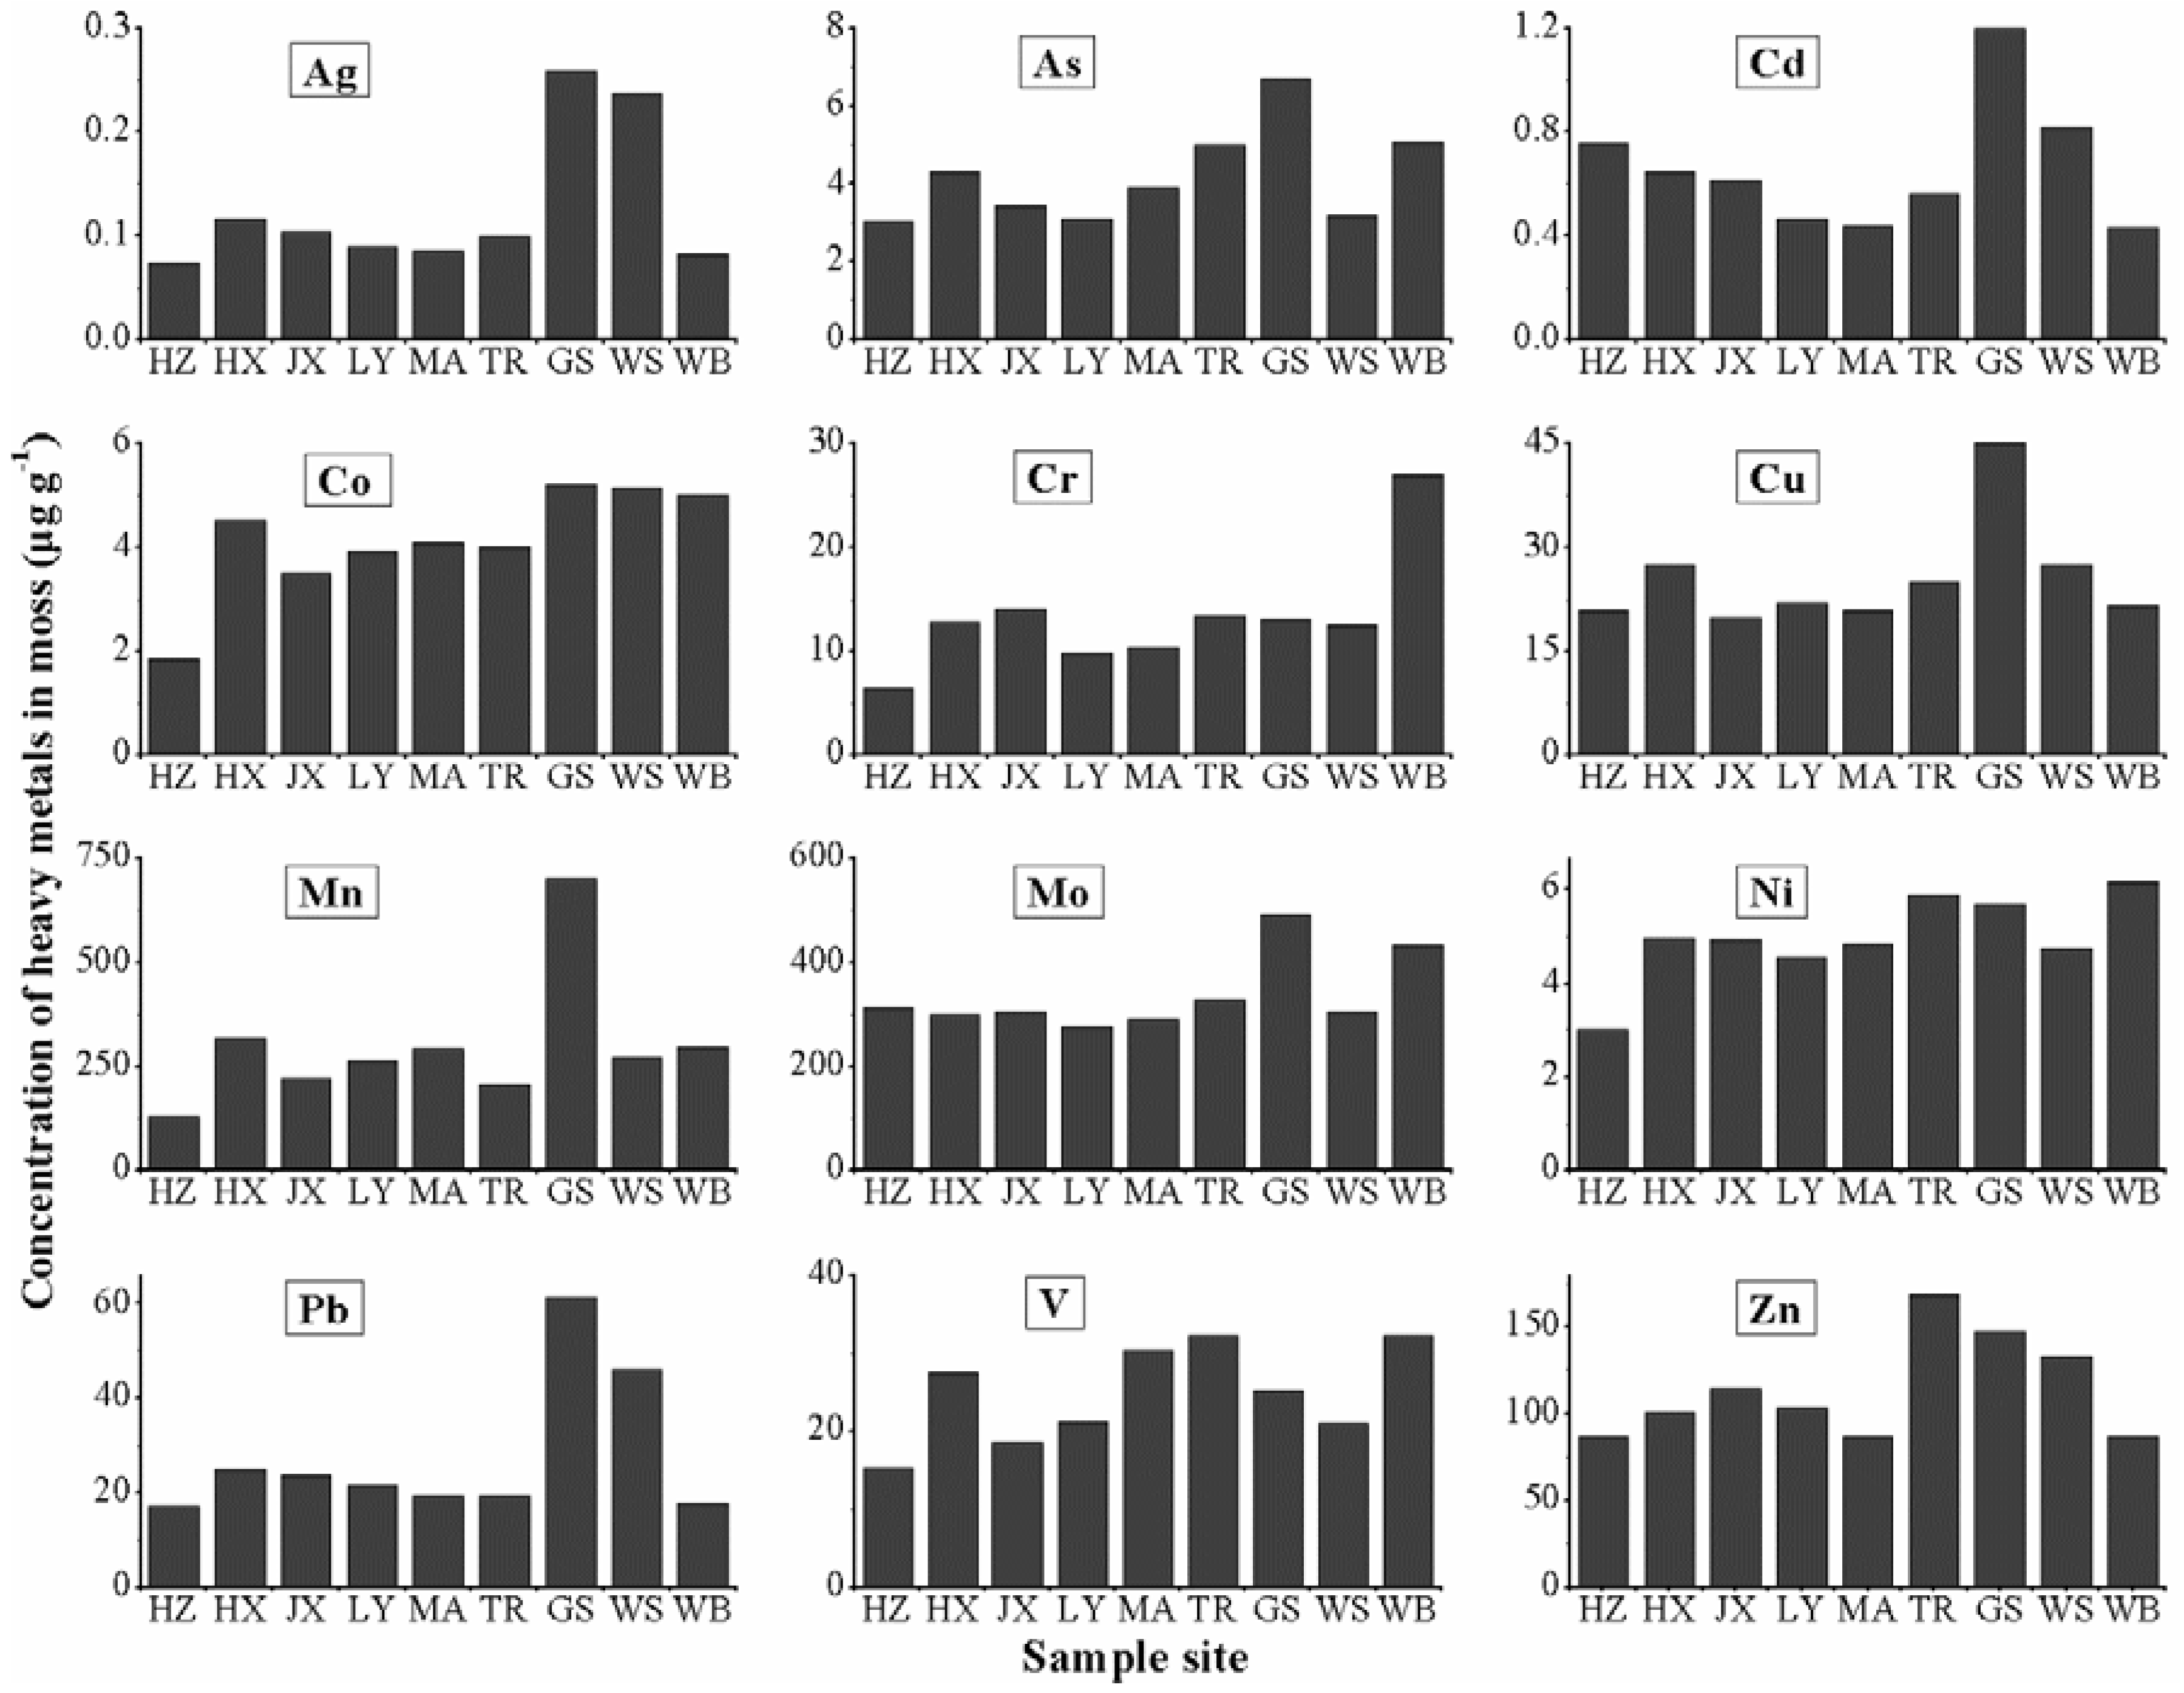
3.2. Differentiation of Metal Accumulation in Moss Species H. angustifolium

The heavy metal accumulation in the moss species H. angustifolium was much higher than that of tree leaves and close to that of soil, and the EFs of tree leaves were generally much lower than 1. Therefore, H. angustifolium was more suitable to monitoring the atmospheric heavy metals in the studied city. Meanwhile, varied metals in the moss species showed different concentrations at different sampling sites. The concentrations of 12 metals in moss samples at each site were obtained to characterize the distribution differences, and they are displayed in Figure 3. The results showed that GS had the highest concentration of most metals, including Ag, As, Cd, Co, Cu, Mn, Mo, Pb, and Zn; TR possessed relatively higher Ni, V, and Zn; WB had high Co, Cr, Ni, and V; and WS had relatively higher Ag, Co, Pb, and Zn. In contrast, HZ was the location with the lowest heavy metal accumulation. TR and GS are main roads or road intersections, where heavy traffic occurs all year long. WB and WS are industrial works in Wuhan. The lower content of heavy metals in the atmosphere than that from automobile transportation may result from the policies of energy saving and emission reduction in recent years. HZ is a university campus located in the far south of the city center with minimal anthropogenic emission, and is surrounded on three sides by clear lakes and backed by green hills with high vegetation cover; thus, HZ is minorly polluted by heavy metals.
Pearson’s correlation analyses were conducted to illustrate the relationships between the same metals in moss species and soil, and the relationships of various metals in the moss species. The results showed that except for the concentrations of Mn and Co in moss species, which were highly significantly correlated with those in soil (Table 4, p < 0.05), other metals in the moss species had no significant relations with those in soil. These results proved that the accumulated metals in H. angustifolium were mostly not from soil but from the atmosphere. However, Galuszka [42] explained that although mosses do not take up substances directly from soil, soil particulates may strongly influence the chemical composition of mosses by blowing wind and deposition on moss surfaces and then partly dissolve by precipitation, thereby enriching mosses in some elements. Some of the analyzed metals in the moss samples were associated with one another; for example, Ag, Cd, Cu, and Pb had correlation coefficients higher than 0.65, so did Cr, Ni and V (Table 5, p < 0.05). The significantly positive correlations between the concentrations of Cd and Pb in mosses have been found in most European countries [29,46]. Significantly positive correlations among Cd, Cu, and Pb were also in agreement with some investigations in China [21,47]. These results indicated that these heavy metals often appear simultaneously and might come from the same pollution sources.
To further analyze the correlation results of metals, factor analysis was executed. Two main factors were extracted and accounted for 80.1% of the total variance of data from the nine sampling sites (Table 6). Factor 1 mainly comprised the metals of Cu, Mn, Pb, As, Ag, and Mo and represented 54.2% of the total variance. The association of these metals with the first factor was likely to be the result of anthropogenic activities, including automobile transportation and industrial emissions [29,48]. Factor 2 explained 25.9% of the total variance and was mainly influenced by high loadings of V, Cr, and Ni. This association was likely to be related to manufacturing industries and heat production [49], such as coal-fired boiler works.

3.3. Atmospheric Heavy Metal Pollution Assessing by CF

As the moss species was more suitable to monitoring the atmospheric heavy metals in the studied city, we took the metal concentration in moss samples in different sampling sites to calculate CF, called CFmoss. For CFbackground, the concentration of same metal in moss sample from the sampling site HZ was used, since this site was relatively much cleaner than other sites and was very slightly contaminated by heavy metals, as we mentioned above. As shown in Table 7, none of the 12 metals have yet reached moderate contamination, indicating an overall low contamination level of atmospheric heavy metals in the city. However, the CF values in some sampling sites, e.g., Cr in WB, Mn in GS and Pb in GS, were higher than 3.5, which means that these sites experienced moderate contamination. The contamination categories determined by moss monitoring in the study was somehow close to the European cities Galicia [40] and Kosovo [29], but lower than some other cities in China, such as Taizhou [28] and Wuxi [21]. This is probably associated with the land use and land cover differences. For example, main industries such as electrical, chemical, pharmaceutical, textile have resulted in high levels of environmental pollution in Taizhou [21]. Although Wuhan is a major transportation center and industries are developing, it is also called “the city of the hundred lakes”, and 40% of the territory is covered by wetlands.

4. Conclusions

The concentrations of heavy metals in the moss species H. angustifolium were significantly higher than those in the leaves of vascular species C. bodinieri and O. fragrans, and the EFs performed similarly. Soil substrate exerted a minimal effect on the heavy metal concentrations in the H. angustifolium, which indicated that the heavy metals in the mosses were mainly derived from atmospheric deposition. These results indicated that the moss species was more suitable than the tree leaves for monitoring atmospheric heavy metals. Among the 12 studied heavy metals, Mn, Mo, Zn, Cu, and Pb were the metals with the highest concentrations in all the materials analyzed in this study, which implied that the air was most polluted by these metals. The accumulation concentrations of heavy metals in mosses were metal specific and spatially differed, thereby reflecting the local variations in heavy metal deposition. The high concentrations of metals in the sites near main roads and industrial works indicated that anthropogenic factors, such as traffic emission from automobile transportation and manufacturing industries, were primarily responsible for the variations in metal pollutants in the atmosphere. CF values indicated an overall low contamination level of atmospheric heavy metals in Wuhan.

Supplementary Materials

The following are available online at https://www.mdpi.com/1660-4601/15/6/1105/s1, Table S1: Element concentrations (μg g−1) of three replicates in moss, tree leaves and soil in nine sampling sites, Table S2: Pearson’s correlations of metals accumulation between plants and soil based on nine sampling sites.

Author Contributions

Y.J. and Y.W. conceived and designed the experiments. M.F. and J.Z. performed the experiments and analyzed the data. Y.J. and R.H. wrote the paper.

Funding

Natural Science Foundation of Hubei Province: 2016CFB556.

Acknowledgments

This work was supported by The Natural Science Foundation of Hubei Province (No. 2016CFB556) and The National Key Research and Development Program of China (2017YFD0202000).

Conflicts of Interest

The authors declare no conflict of interest.

References

  1. Ng, O.H.; Tan, B.C.; Obbard, J.P. Lichens as bioindicators of atmospheric heavy metal pollution in Singapore. Environ. Monit. Assess. 2006, 123, 63–74. [Google Scholar] [CrossRef] [PubMed]
  2. Kampa, M.; Castanas, E. Human health effects of air pollution. Environ. Pollut. 2008, 151, 362–367. [Google Scholar] [CrossRef] [PubMed]
  3. Rai, P.K. Impacts of particulate matter pollution on plants: Implications for environmental biomonitoring. Ecotoxicol. Environ. Saf. 2016, 129, 120–136. [Google Scholar] [CrossRef] [PubMed]
  4. Nagajyoti, P.C.; Lee, K.D.; Sreekanth, T.V.M. Heavy metals, occurrence and toxicity for plants: A review. Environ. Chem. Lett. 2010, 8, 199–216. [Google Scholar] [CrossRef]
  5. Li, Y.X.; Wang, Y.; Rui, X.; Li, Y.X.; Li, Y.; Wang, H.Z.; Zuo, J.; Tong, Y.D. Sources of atmospheric pollution: A bibliometric analysis. Scientometrics 2017, 112, 1025–1045. [Google Scholar] [CrossRef]
  6. Ram, S.S.; Majumder, S.; Chaudhuri, P.; Chanda, S.; Santra, S.C.; Chakraborty, A.; Sudarshan, M. A review on air pollution monitoring and management using plants with special reference to foliar dust adsorption and physiological stress responses. Crit. Rev. Environ. Sci. Technol. 2015, 45, 2489–2522. [Google Scholar] [CrossRef]
  7. Harmens, H.; Norris, D.A.; Koerber, G.R.; Buse, A.; Steinnes, E.; Ruhling, A. Temporal trends in the concentration of arsenic, chromium, copper, iron, nickel, vanadium and zinc in mosses across Europe. Atmos. Environ. 2007, 41, 6673–6687. [Google Scholar] [CrossRef] [Green Version]
  8. Stankovic, S.; Kalaba, P.; Stankovic, A.R. Biota as toxic metal indicators. Environ. Chem. Lett. 2014, 12, 63–84. [Google Scholar] [CrossRef]
  9. Ayodele, J.T.; Ahmed, A. Monitoring air pollution in Kano municipality by chemical analysis of Scots Pine (Pinus sylvestris L.) needles for sulphur content. Environmentalist 2001, 21, 145–151. [Google Scholar] [CrossRef]
  10. Brignole, D.; Drava, G.; Minganti, V.; Giordani, P.; Samson, R.; Vieira, J.; Pinho, P.; Branquinho, C. Chemical and magnetic analyses on tree bark as an effective tool for biomonitoring: A case study in Lisbon (Portugal). Chemosphere 2018, 195, 508–514. [Google Scholar] [CrossRef] [PubMed]
  11. Wojtun, B.; Samecka-Cymerman, A.; Kolon, K.; Kempers, A.J.; Skrzypek, G. Metals in some dominant vascular plants, mosses, lichens, algae, and the biological soil crust in various types of terrestrial tundra, SW Spitsbergen, Norway. Polar Biol. 2013, 36, 1799–1809. [Google Scholar] [CrossRef]
  12. Paoli, L.; Munzi, S.; Guttova, A.; Senko, D.; Sardella, G.; Loppi, S. Lichens as suitable indicators of the biological effects of atmospheric pollutants around a municipal solid waste incinerator (S Italy). Ecol. Indic. 2015, 52, 362–370. [Google Scholar] [CrossRef]
  13. Aprile, G.G.; Di Salvatore, M.; Carratu, G.; Mingo, A.; Carafa, A.M. Comparison of the suitability of two lichen species and one higher plant for monitoring airborne heavy metals. Environ. Monit. Assess. 2010, 162, 291–299. [Google Scholar] [CrossRef] [PubMed]
  14. Naeth, M.A.; Wilkinson, S.R. Lichens as biomonitors of air quality around a diamond mine, Northwest Territories, Canada. J. Environ. Qual. 2008, 37, 1675–1684. [Google Scholar] [CrossRef] [PubMed]
  15. Scerbo, R.; Ristori, T.; Possenti, L.; Lampugnani, L.; Barale, R.; Barghigiani, C. Lichen (Xanthoria parietina) biomonitoring of trace element contamination and air quality assessment in Pisa Province (Tuscany, Italy). Sci. Total Environ. 2002, 286, 27–40. [Google Scholar] [CrossRef]
  16. Coskun, M.; Steinnes, E.; Coskun, M.; Cayir, A. Comparison of epigeic moss (Hypnum cupressiforme) and lichen (Cladonia rangiformis) as biomonitor species of atmospheric metal deposition. Bull. Environ. Contam. Toxicol. 2009, 82, 1–5. [Google Scholar] [CrossRef] [PubMed]
  17. Pesch, R.; Schroeder, W. Mosses as bioindicators for metal accumulation: Statistical aggregation of measurement data to exposure indices. Ecol. Indic. 2006, 6, 137–152. [Google Scholar] [CrossRef]
  18. Pata, I.M.C.; Balan, C.D.; Pata, S.M.; Macoveanu, M. Passive biomonitoring of atmospheric pollution with heavy metals using native Epigeic moss. Environ. Eng. Manag. J. 2009, 8, 1281–1286. [Google Scholar]
  19. Bargagli, R.; Monaci, F.; Borghini, F.; Bravi, F.; Agnorelli, C. Mosses and lichens as biomonitors of trace metals. A comparison study on Hypnum cupressiforme and Parmelia caperata in a former mining district in Italy. Environ. Pollut. 2002, 116, 279–287. [Google Scholar] [CrossRef]
  20. Icel, Y.; Cobanoglu, G. Biomonitoring of atmospheric heavy metal pollution using lichens and mosses in the city of Istanbul, Turkey. Fresen. Environ. Bull. 2009, 18, 2066–2071. [Google Scholar]
  21. Zhou, X.L.; Chen, Q.; Liu, C.; Fang, Y.M. Using moss to assess airborne heavy metal pollution in Taizhou, China. Int. J. Environ. Res. Public Health 2017, 14, 430. [Google Scholar] [CrossRef] [PubMed]
  22. Wang, S.Q.; Zhang, Z.H.; Wang, Z.H. Bryophyte communities as biomonitors of environmental factors in the Goujiang karst bauxite, southwestern China. Sci. Total Environ. 2015, 538, 270–278. [Google Scholar] [CrossRef] [PubMed]
  23. Dogan, Y.; Ugulu, I.; Baslar, S. Turkish red pine as a biomonitor: A comparative study of the accumulation of trace elements in the needles and bark. Ekoloji 2010, 19, 88–96. [Google Scholar] [CrossRef]
  24. Sun, F.F.; Wen, D.Z.; Kuang, Y.W.; Li, J.O.; Li, J.L.; Zuo, W.D. Concentrations of heavy metals and polycyclic aromatic hydrocarbons in needles of Masson pine (Pinus massoniana L.) growing nearby different industrial sources. J. Environ. Sci. China 2010, 22, 1006–1013. [Google Scholar] [CrossRef]
  25. Samecka-Cymerman, A.; Kolon, K.; Kempers, A.J. A preliminary investigation in using Pohlia nutans and Larix decidua as biomonitors of air pollution by the coke industry in Walbrzych (SW Poland). Pol. J. Environ. Stud. 2008, 17, 121–128. [Google Scholar]
  26. Szczepaniak, K.; Biziuk, M. Aspects of the biomonitoring studies using mosses and lichens as indicators of metal pollution. Environ. Res. 2003, 93, 221–230. [Google Scholar] [CrossRef]
  27. Sun, S.Q.; Wang, D.Y.; He, M.; Zhang, C. Monitoring of atmospheric heavy metal deposition in Chongqing, China—Based on moss bag technique. Environ. Monit. Assess. 2009, 148, 1–9. [Google Scholar] [CrossRef] [PubMed]
  28. Yan, Y.; Zhang, Q.; Wang, G.G.; Fang, Y.M. Atmospheric deposition of heavy metals in Wuxi, China: estimation based on native moss analysis. Environ. Monit. Assess. 2016, 188, 360. [Google Scholar] [CrossRef] [PubMed]
  29. Maxhuni, A.; Lazo, P.; Kane, S.; Qarri, F.; Marku, E.; Harmens, H. First survey of atmospheric heavy metal deposition in Kosovo using moss biomonitoring. Environ. Sci. Pollut. Res. 2016, 23, 744–755. [Google Scholar] [CrossRef] [PubMed] [Green Version]
  30. Rasmussen, L. Epiphytic bryophytes as indicators of changes in background levels of airborne metals from 1951–1975. Environ. Pollut. 1977, 14, 37–45. [Google Scholar] [CrossRef]
  31. Tyler, G. Bryophytes and heavy metals: A literature review. Bot. J. Linn. Soc. 1990, 104, 231–253. [Google Scholar] [CrossRef]
  32. Sawidis, T.; Marnasidis, A.; Zachariadis, G.; Stratis, J. A study of air pollution with heavy metals in Thessaloniki City (Greece) using trees as biological indicators. Arch. Environ. Contam. Toxicol. 1995, 28, 118–124. [Google Scholar] [CrossRef]
  33. Sawidis, T.; Krystallidis, P.; Veros, D.; Chettri, M. A study of air pollution with heavy metals in Athens City and Attica basin using evergreen trees as biological indicators. Biol. Trace Elem. Res. 2012, 148, 396–408. [Google Scholar] [CrossRef] [PubMed]
  34. Dongarra, G.; Sabatino, G.; Triscari, M.; Varrica, D. The effects of anthropogenic particulate emissions on roadway dust and Nerium oleander leaves in Messina (Sicily, Italy). J. Environ. Monit. 2003, 5, 766–773. [Google Scholar] [CrossRef] [PubMed]
  35. Piraga, D.; Tabors, G.; Nikodemus, O.; Zigure, Z.; Brumelis, G. Current content of selected pollutants in moss, humus, soil and bark and long-term radial growth of pine trees in the Mezaparks forest in Riga. Environ. Sci. Pollut. Res. 2017, 24, 11964–11977. [Google Scholar] [CrossRef] [PubMed]
  36. Tsikritzis, L.I.; Ganatsios, S.S.; Duliu, O.G.; Sawidis, T.D. Natural and artificial radionuclides distribution in some lichens, mosses, and trees in the vicinity of lignite power plants from West Macedonia, Greece. J. Trace Microprobe Tech. 2003, 21, 543–554. [Google Scholar] [CrossRef]
  37. Salemaa, M.; Derome, J.; Helmisaari, H.S.; Nieminen, T.; Vanha-Majamaa, I. Element accumulation in boreal bryophytes, lichens and vascular plants exposed to heavy metal and sulfur deposition in Finland. Sci. Total Environ. 2004, 324, 141–160. [Google Scholar] [CrossRef] [PubMed]
  38. Cao, T.; Wang, M.; An, L.; Yu, Y.H.; Lou, Y.X.; Guo, S.L.; Zuo, B.R.; Liu, Y.; Wu, J.M.; Cao, Y.; et al. Air quality for metals and sulfur in Shanghai, China, determined with moss bags. Environ. Pollut. 2009, 157, 1270–1278. [Google Scholar] [CrossRef] [PubMed]
  39. Fan, M.; Wu, Y.; Hu, R.; Jiang, Y. Diversity and distribution of bryophytes and their relationship with environmental factors in Wuhan. Plant Sci. J. 2017, 35, 825–834. [Google Scholar]
  40. Fernández, J.A.; Carballeira, A. A comparison of indigenous mosses and topsoils for use in monitoring atmospheric heavy metal deposition in Galicia (northwest Spain). Environ. Pollut. 2001, 114, 431–441. [Google Scholar]
  41. Mendil, D.; Celik, F.; Tuzen, M.; Soylak, M. Assessment of trace metal levels in some moss and lichen samples collected from near the motorway in Turkey. J. Hazard. Mater. 2009, 166, 1344–1350. [Google Scholar] [CrossRef] [PubMed]
  42. Galuszka, A. The chemistry of soils, rocks and plant bioindicators in three ecosystems of the Holy Cross Mountains, Poland. Environ. Monit. Assess. 2005, 110, 55–70. [Google Scholar] [CrossRef] [PubMed]
  43. Sawidis, T.; Breuste, J.; Mitrovic, M.; Pavlovic, P.; Tsigaridas, K. Trees as bioindicator of heavy metal pollution in three European cities. Environ. Pollut. 2011, 159, 3560–3570. [Google Scholar] [CrossRef] [PubMed]
  44. Påhlsson, A.-M.B. Toxicity of heavy metals (Zn, Cu, Cd, Pb) to vascular plants. A literature review. Water Air Soil Pollut. 1989, 47, 287–319. [Google Scholar]
  45. Gough, L.P.; Shacklette, H.T.; Case, A.A. Element concentrations toxic to plants, animals, and man. Geol. Surv. Bull. 1979, 1466, 1–80. [Google Scholar]
  46. Harmens, H.; Ilyin, I.; Mills, G.; Aboal, J.R.; Alber, R.; Blum, O.; Coskun, M.; De Temmerman, L.; Fernandez, J.A.; Figueira, R.; et al. Country-specific correlations across Europe between modelled atmospheric cadmium and lead deposition and concentrations in mosses. Environ. Pollut. 2012, 166, 1–9. [Google Scholar] [CrossRef] [PubMed] [Green Version]
  47. Liu, C.; Zhou, P.; Fang, Y.M. Monitoring Airborne Heavy Metal Using Mosses in the City of Xuzhou, China. Bull. Environ. Contam. Toxicol. 2016, 96, 638–644. [Google Scholar] [CrossRef] [PubMed]
  48. Han, Y.M.; Du, P.X.; Cao, J.J.; Posmentier, E.S. Multivariate analysis of heavy metal contamination in urban dusts of Xi’an, Central China. Sci. Total Environ. 2006, 355, 176–186. [Google Scholar]
  49. Harmens, H.; Norris, D.A.; Koerber, G.R.; Buse, A.; Steinnes, E.; Ruhling, A. Temporal trends (1990–2000) in the concentration of cadmium, lead and mercury in mosses across Europe. Environ. Pollut. 2008, 151, 368–376. [Google Scholar] [CrossRef] [PubMed] [Green Version]
Figure 1. Map of the study area with sampling sites in the urban area of Wuhan.
Ijerph 15 01105 g001
Figure 2. Boxplot of enrichment factors of different heavy metals in three plant samples (n = 9) using Al and soil normalization. Circles in the figure indicate the values are outliers.
Ijerph 15 01105 g002
Figure 3. Concentrations of heavy metals in moss species H. angustifolium at nine sampling sites in Wuhan.
Ijerph 15 01105 g003
Table 1. Sample locations and general characteristics.
Site No.Location (Abbreviation)Function and Land Use DescriptionLongitude/ELatitude/NAltitude (m)
1Huazhong Agricultural University (HZ)Education, University campus114°21.682′30°28.625′60
2Hongxiang (HX)Residential land, residential area114°23.588′30°29.285′58
3Jinxiu (JX)Residential land, residential area114°23.223′30°27.859′48
4Luoyan (LY)Scenic spot, park nearby East Lake114°26.633′30°33.678′33
5Ma’anshan Park (MA)Scenic spot, park nearby East Lake114°27.139′30°30.644′41
6Third Ring Road (TR)Transportation, roadside of urban expressway114°24.093′30°27.729′63
7Guanshan Overpass (GS)Transportation, roadside of urban overpass114°24.439′30°27.805′59
8Wuhan Steel Works (WS)Industry, manufacturing industry of iron and steel114°26.638′30°37.481′38
9Wuhan Boiler Works (WB)Industry, manufacturing industry of boilers114°27.456′30°27.748′39
Table 2. Descriptive statistics of element concentrations (μg g−1) in moss, tree leaves and soil.
SampleValue (μg g−1)AgAsCdCoCrCuMnMoNiPbVZn
H. angustifoliumMinimum0.0743.040.4331.856.3719.91272772.9917.315.386.4
Maximum0.2586.691.205.2227.044.97004916.1761.332.2169
Mean0.1274.200.6604.1413.325.63003384.9728.024.8114
SD0.0731.330.271.176.678.9418979.21.0516.66.3931.1
Diffaaaaaaaaaaaa
C. bodinieriMinimum0.0040.1560.0250.0470.2773.5439.317.70.326 1.1790.3068.47
Maximum0.0210.8710.0920.3451.297.4139375.70.864 3.7382.55316.9
Mean0.0080.3170.0500.1080.5795.2312041.10.5492.3610.73513.4
SD0.0060.2220.0230.0910.3391.3512217.90.1850.9400.6953.32
Diffbbbbbbbbbbbb
O. fragransMinimum0.0020.1110.0900.1200.3573.9613.542.90.3161.520.36917.5
Maximum0.0180.3180.3580.3300.7597.172232510.97610.60.83040.9
Mean0.0090.1960.1820.2240.5385.141071440.5623.590.57527.1
SD0.0050.0790.1010.0570.1301.0475.071.40.2023.090.1377.57
Diffbbcbbbbcbbbb
SoilMinimum0.06421.50.11312.542.425.138632916.428.010255.9
Maximum0.21723.80.30119.054.732.0103554921.241.413881.6
Mean0.10722.70.18516.449.328.066738718.432.712467.8
SD0.0470.8760.0562.143.562.54190741.434.5110.99.69
Diffaccccacacacc
Note: SD: standard deviation; Different letters of a, b and c in Diff in the same column indicate significant differences at p < 0.05 among materials.
Table 3. Ratios (mean ± SD) of heavy metals concentration in moss to those in tree leaves.
MetalH. angustifolium/C. bodinieriH. angustifolium/O. fragrans
Ag19.8 ± 9.7946.0 ± 18.6
As17.4 ± 9.8925.0 ± 11.8
Cd15.3 ± 7.765.05 ± 3.57
Co51.3 ± 25.220.0 ± 7.25
Cr29.9 ± 21.327.8 ± 14.8
Cu5.17 ± 1.975.27 ± 1.18
Mn4.08 ± 2.186.54 ± 5.92
Mo10.4 ± 6.623.30 ± 2.20
Ni10.3 ± 4.7510.7 ± 4.05
Pb13.6 ± 8.5812.3 ± 10.4
V48.5 ± 28.148.3 ± 19.9
Zn9.38 ± 4.944.78 ± 1.35
Table 4. Pearson’s correlations of metals accumulation between soil and moss based on nine sampling sites.
MetalAgAsCdCoCrCuMnMoNiPbVZn
Coefficient (r)0.332−0.5670.3840.7070.1680.0400.9410.1010.218−0.190−0.016−0.042
p0.3840.1120.3070.0330.6650.9190.0000.7970.5730.6240.9670.916
Table 5. Coefficients of Pearson’s correlation among accumulated metals in moss based on nine sampling sites.
MetalAgAsCdCoCrCuMnMoNiPbV
As0.340
Cd0.753 *0.218
Co0.5780.536−0.048
Cr0.2170.591−0.2310.778 *
Cu0.842 **0.6420.767 *0.4710.153
Mn0.6590.6650.2200.848 **0.5510.700 *
Mo0.3810.811 **0.3990.3200.5000.6100.525
Ni0.3510.721 *−0.1620.890 **0.897 **0.3530.715 *0.456
Pb0.983 **0.3020.774 *0.5240.1480.843 **0.680 *0.3900.282
V0.0640.714 *−0.3730.727 *0.700 **0.2250.5510.3240.835 **−0.034
Zn0.674 *0.4020.5370.3950.2030.6340.3140.2550.4570.6100.190
Note: * p < 0.05 level; ** p < 0.01 level.
Table 6. Factor analysis of metals in moss samples.
MetalFactor 1Factor 2
Ag0.818−0.440
As0.8540.310
Cd0.712−0.659
Co0.7540.381
Cr0.3100.804
Cu0.924−0.312
Mn0.912−0.095
Mo0.8110.178
Ni0.6340.724
Pb0.855−0.461
V0.3230.834
Zn0.593−0.127
Variance (%)54.225.9
Table 7. The contamination factor (CF) and different categories of contamination (as defined by the mean CF) for each of the heavy metal studied in Wuhan.
MetalAgAsCdCoCrCuMnMoNiPbVZn
HZ1.001.001.001.001.001.001.002.471.001.001.001.00
HX1.581.430.853.542.001.312.492.351.661.441.801.17
JX1.401.140.811.892.220.951.742.411.641.381.211.32
LY1.201.020.622.131.551.052.092.181.521.261.391.19
MA1.151.280.582.211.641.002.292.291.611.131.981.01
TR1.331.650.742.172.101.191.622.581.961.132.111.95
GS3.472.201.582.832.052.145.513.861.903.551.641.70
WS3.191.041.082.791.961.312.132.411.582.661.371.54
WB1.111.670.572.714.241.032.333.402.061.042.111.00
Mean CF3.472.201.583.544.242.145.513.862.063.552.111.95
CategoryC2C2C1C3C3C2C3C2C2C2C2C2

