Dietary Differences in Male Workers among Smaller Occupational Groups within Large Occupational Categories: Findings from the Japan Environment and Children’s Study (JECS)

Abstract
1. Introduction
2. Materials and Methods
2.1. Study Design
2.2. Ethical Statement
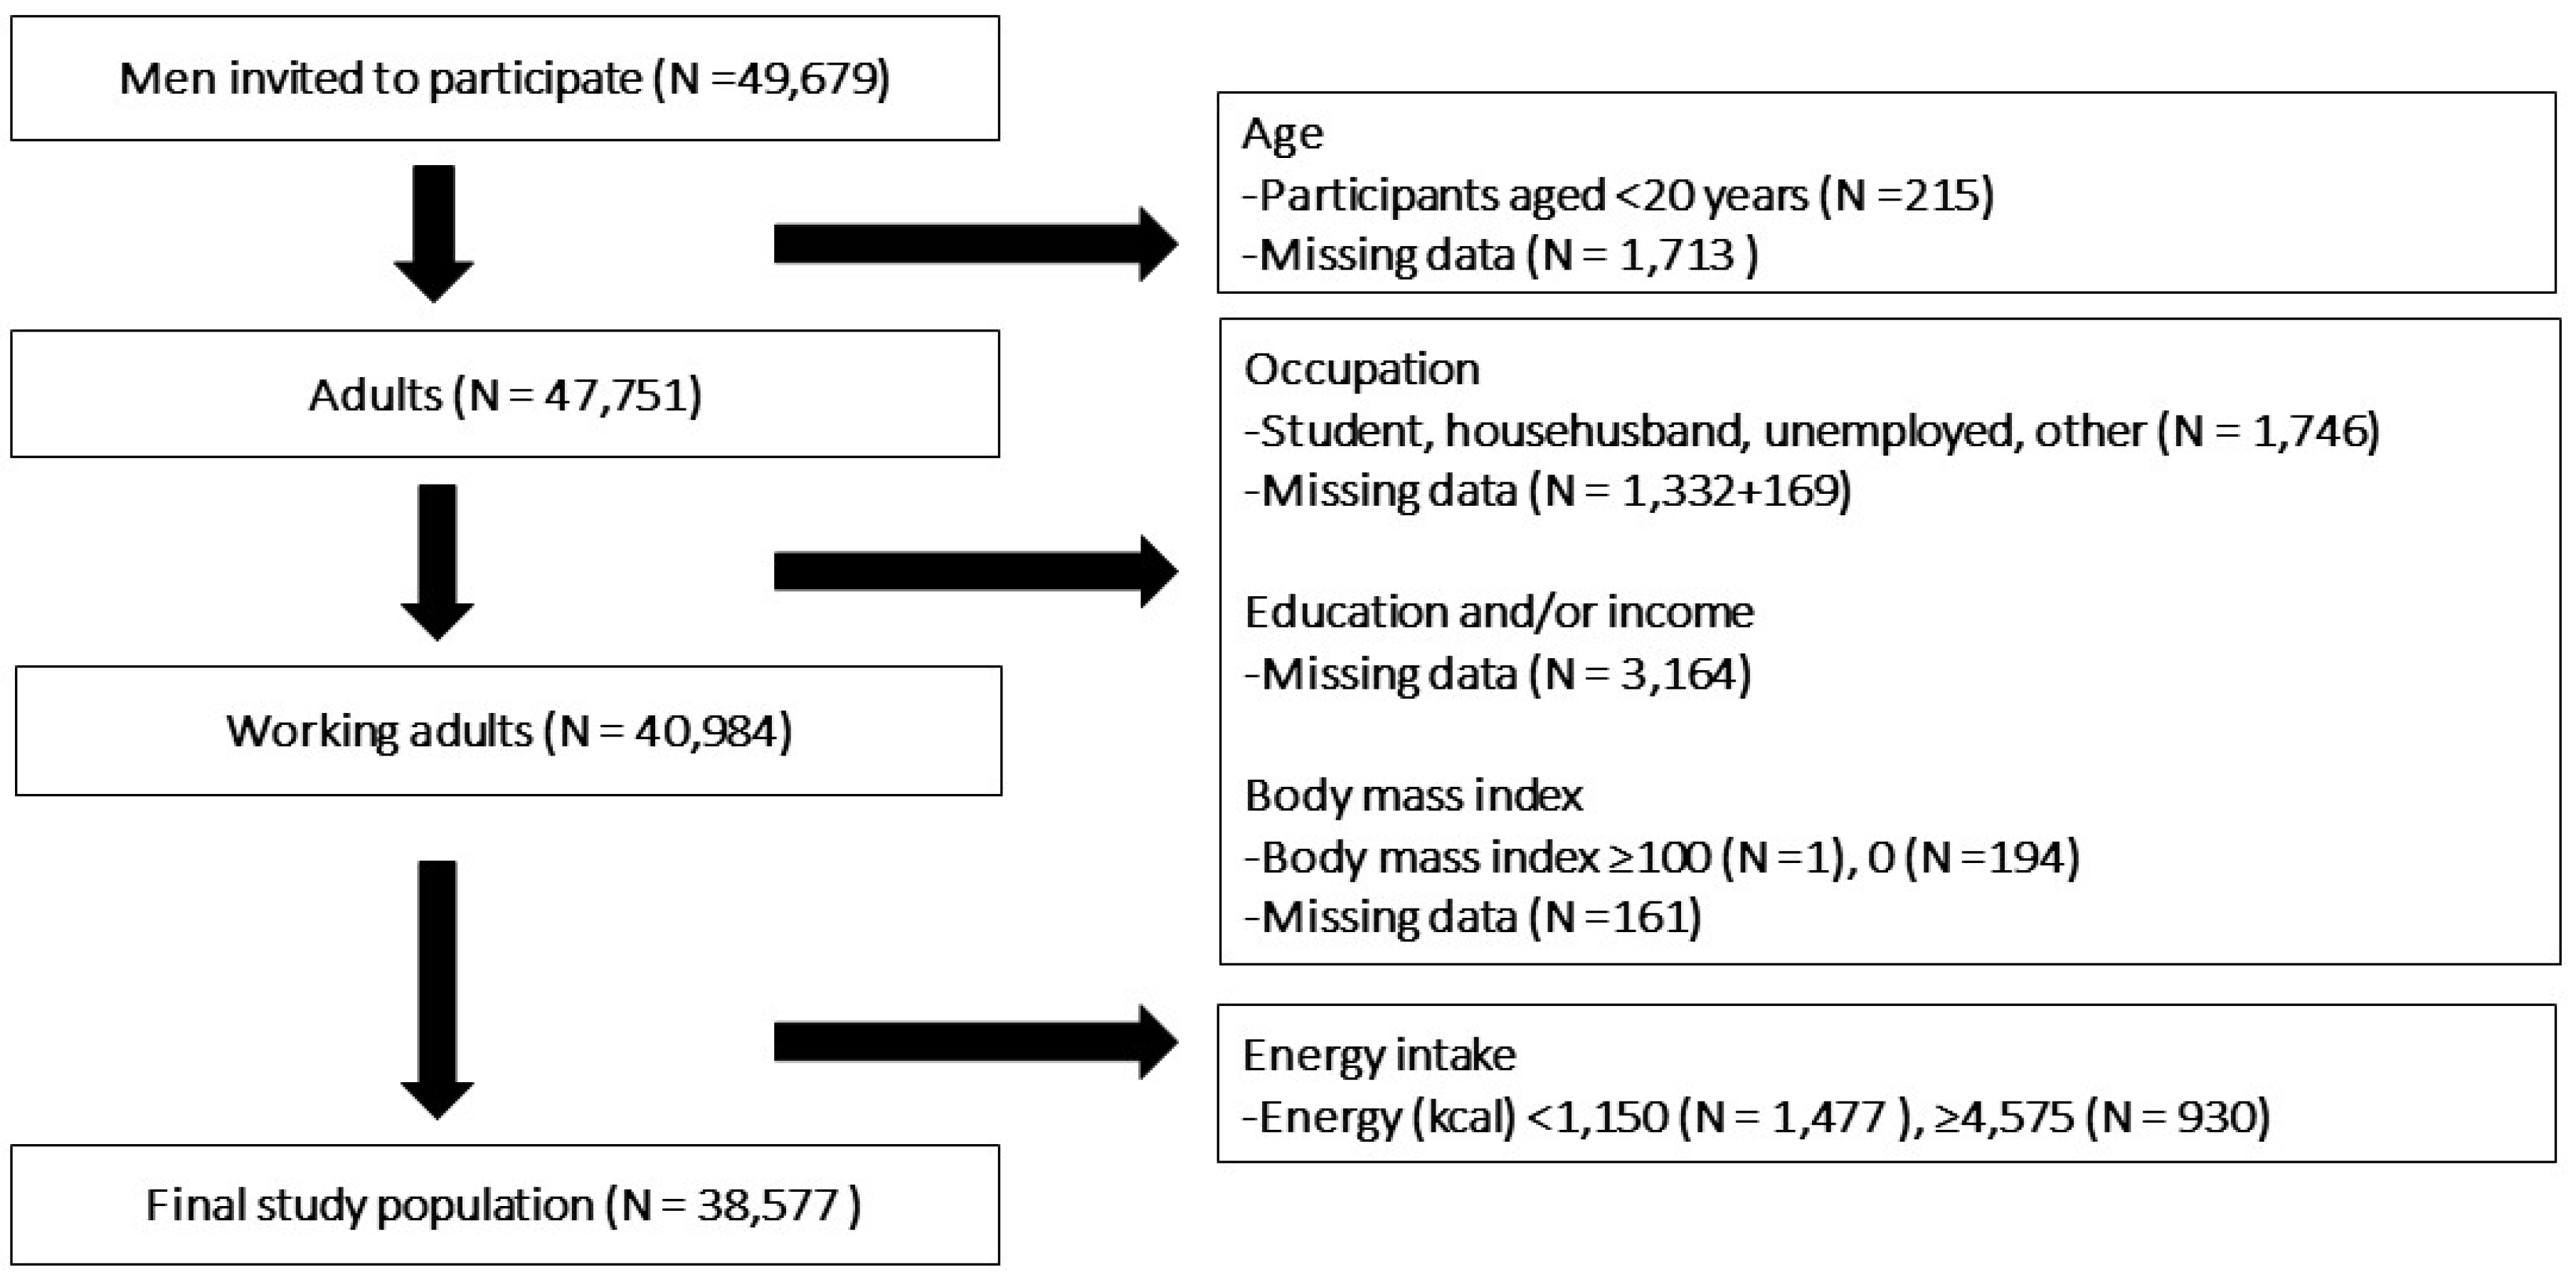
2.3. Study Sample
2.4. Dietary Intake
2.5. Socioeconomic Factors
2.6. Statistical Analysis
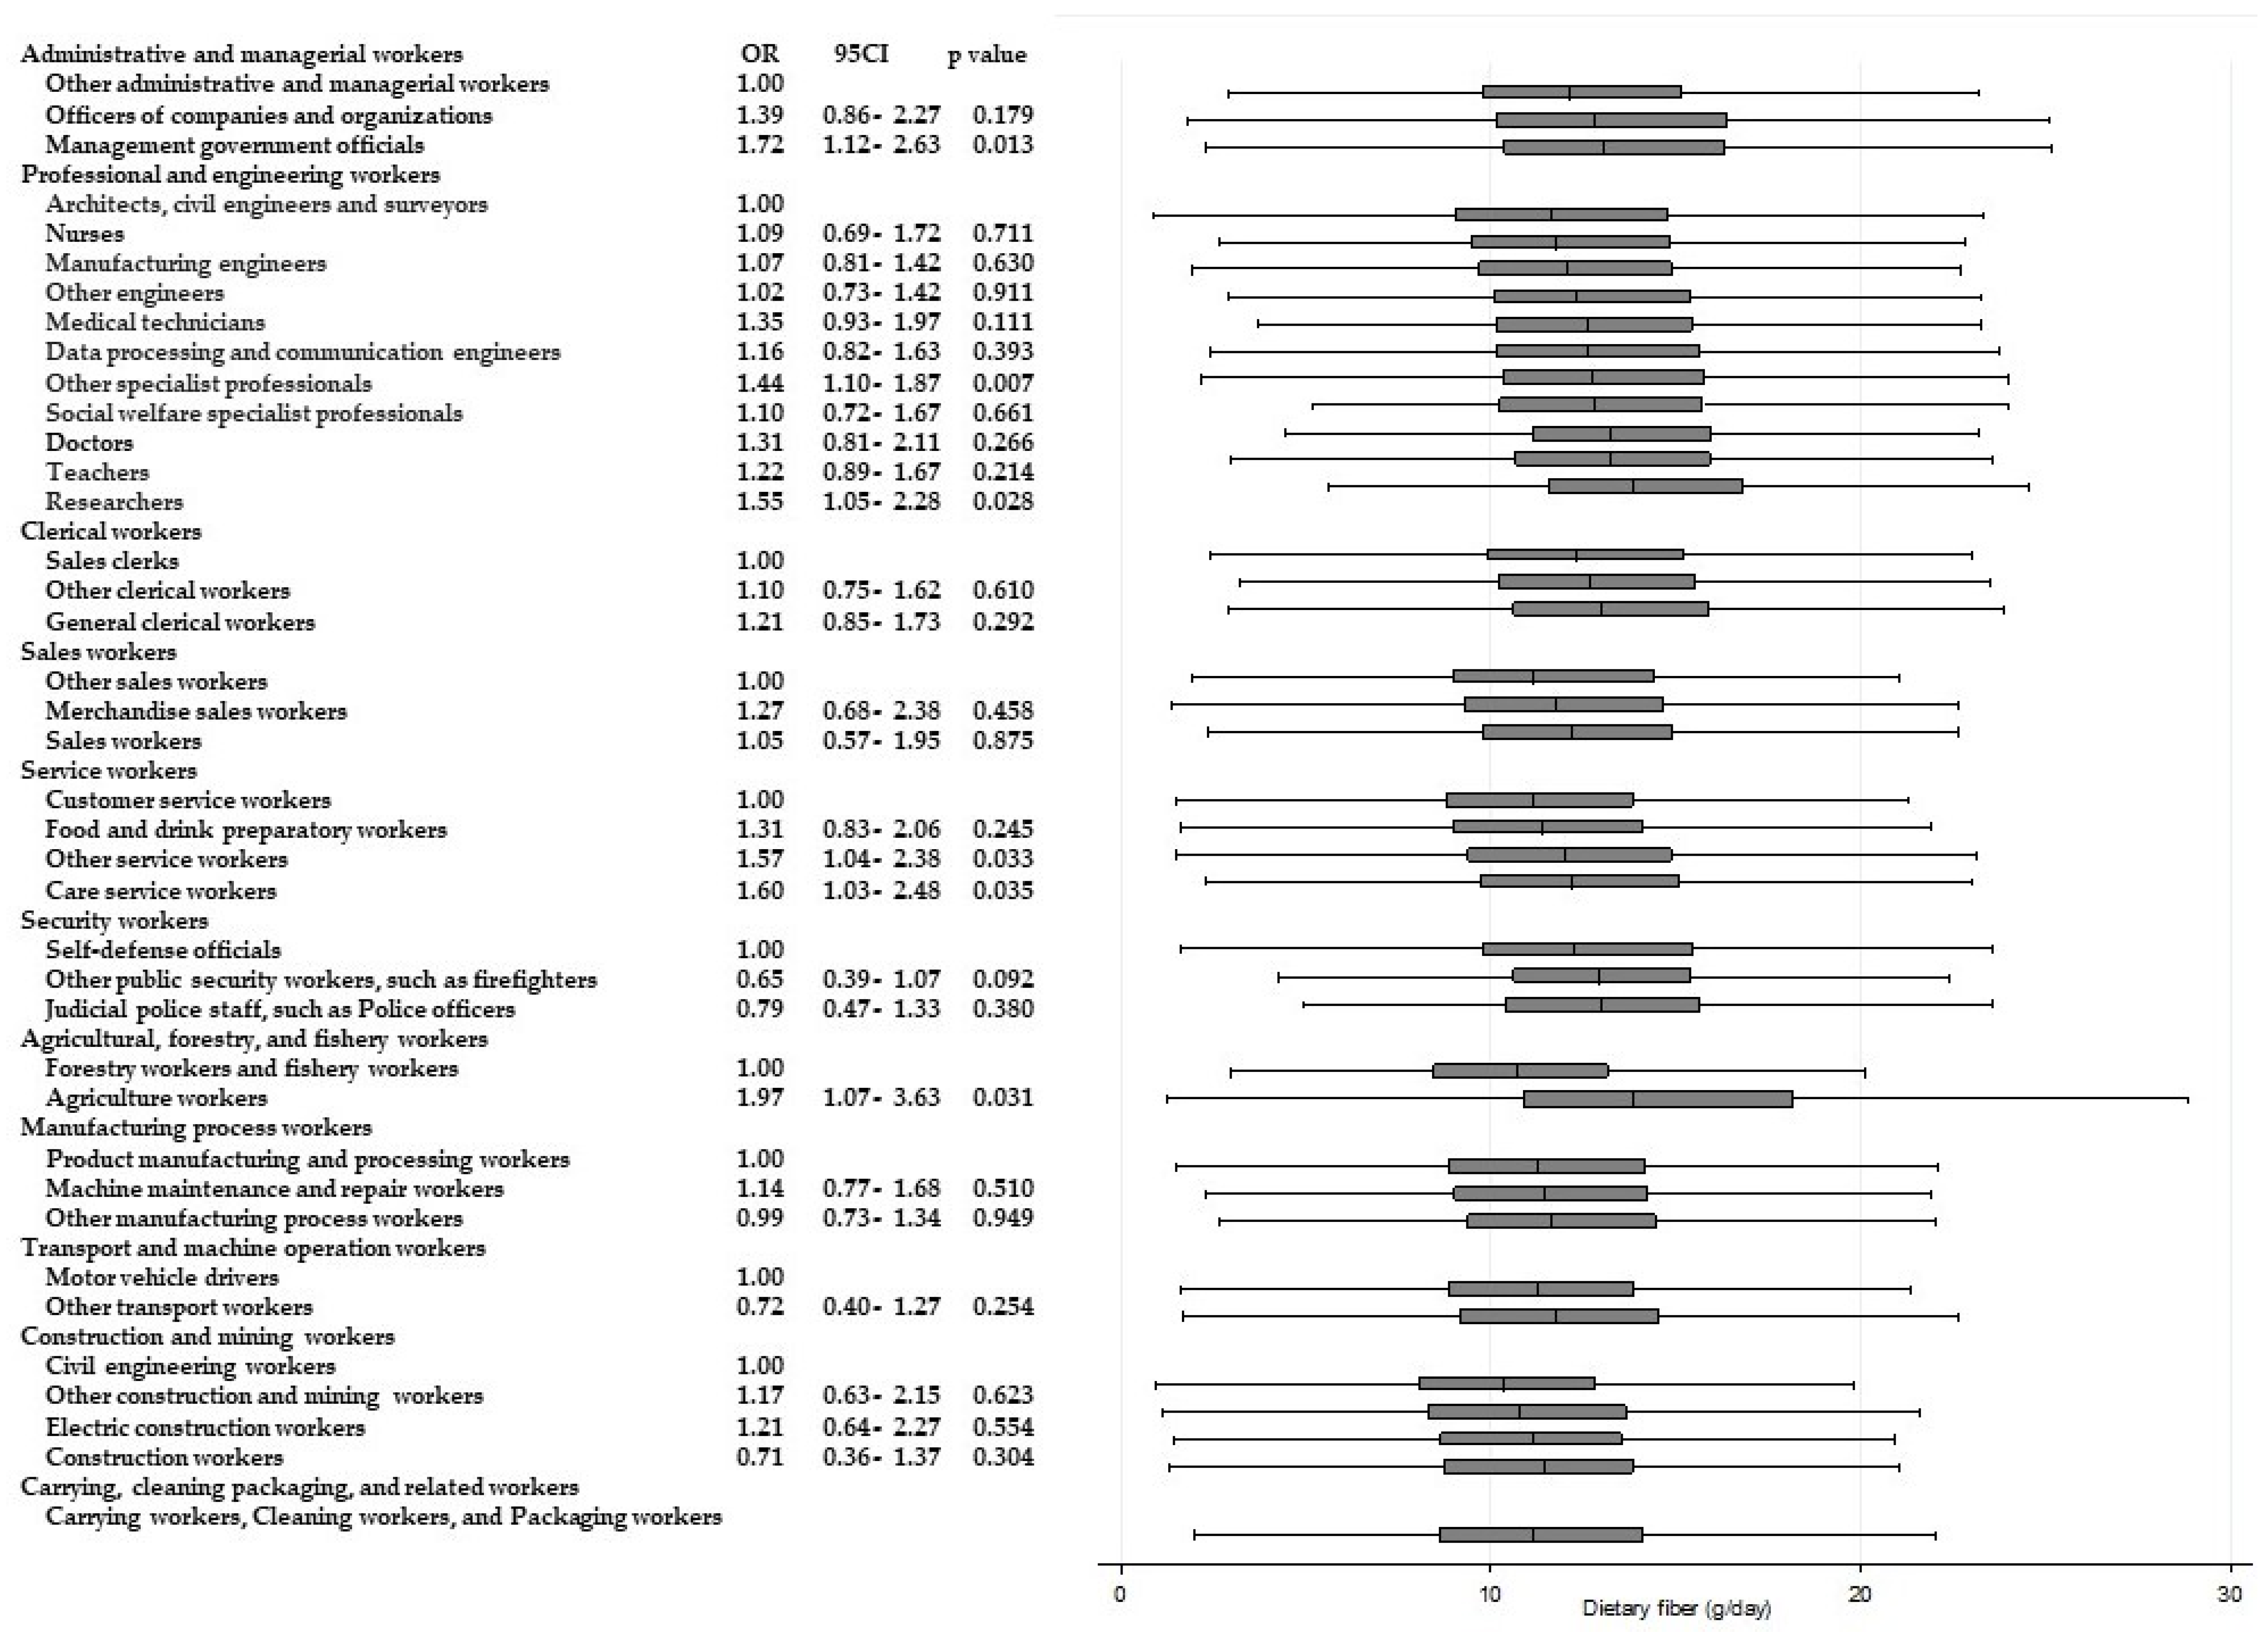
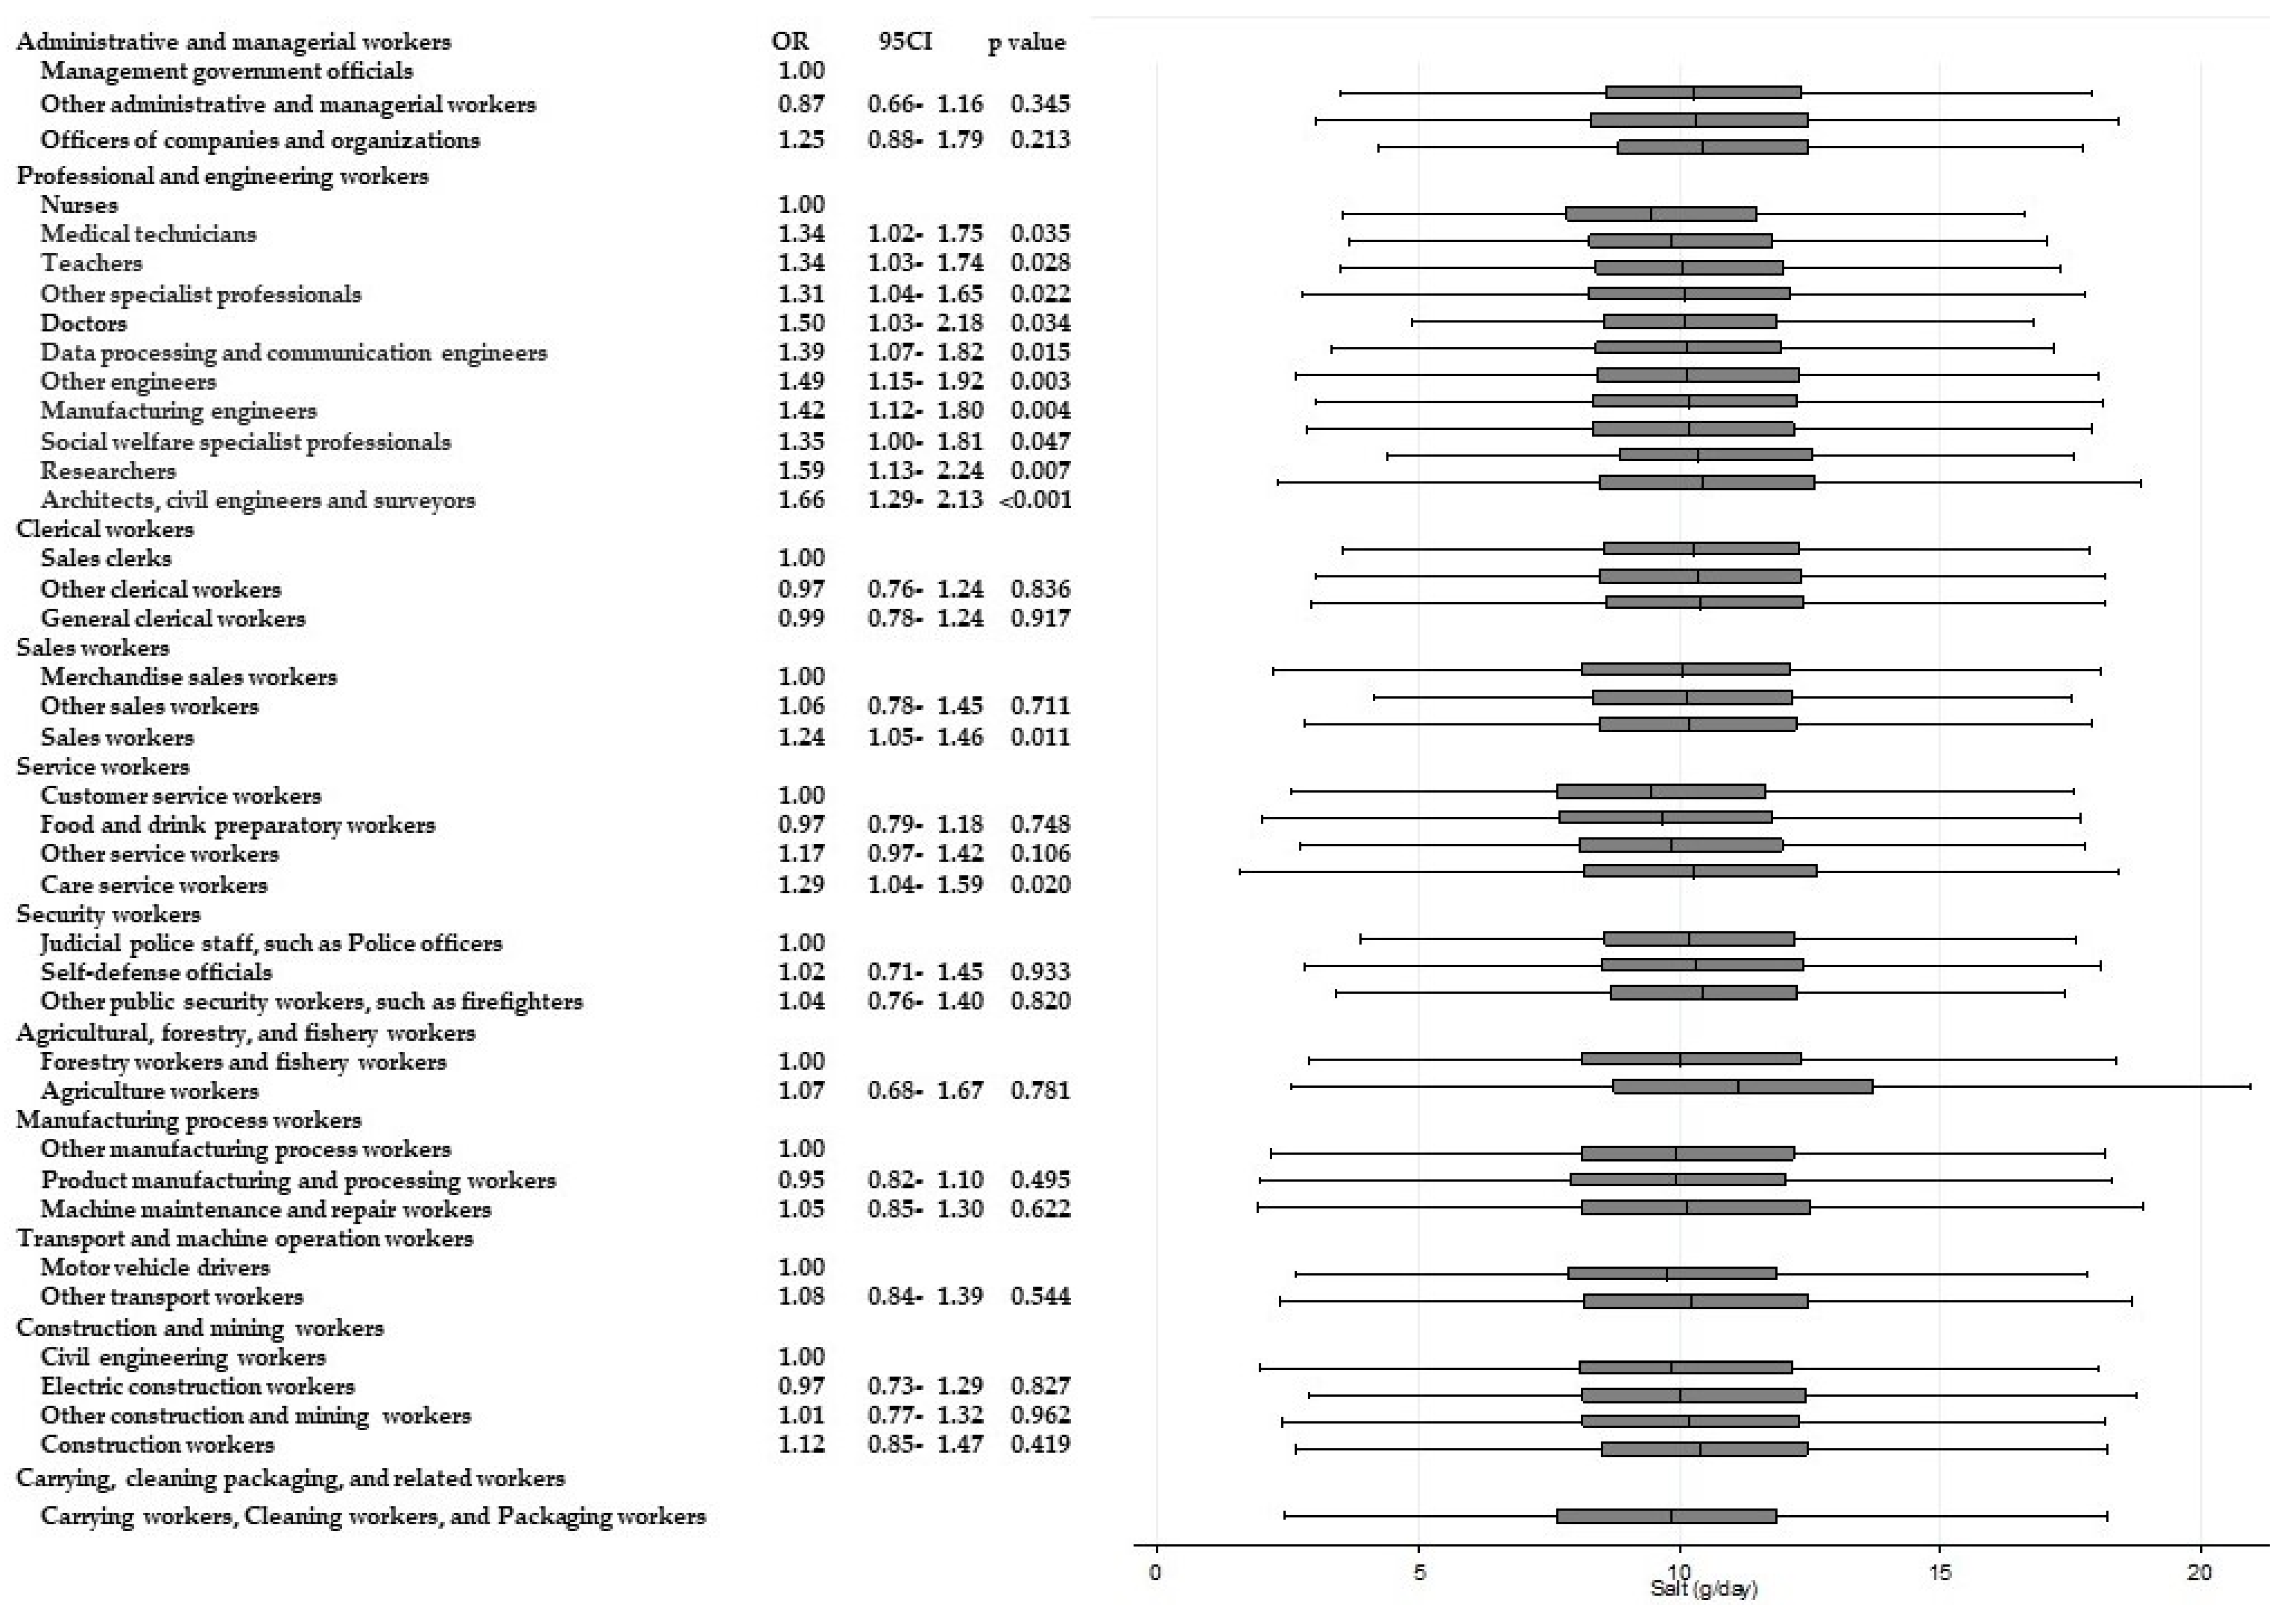
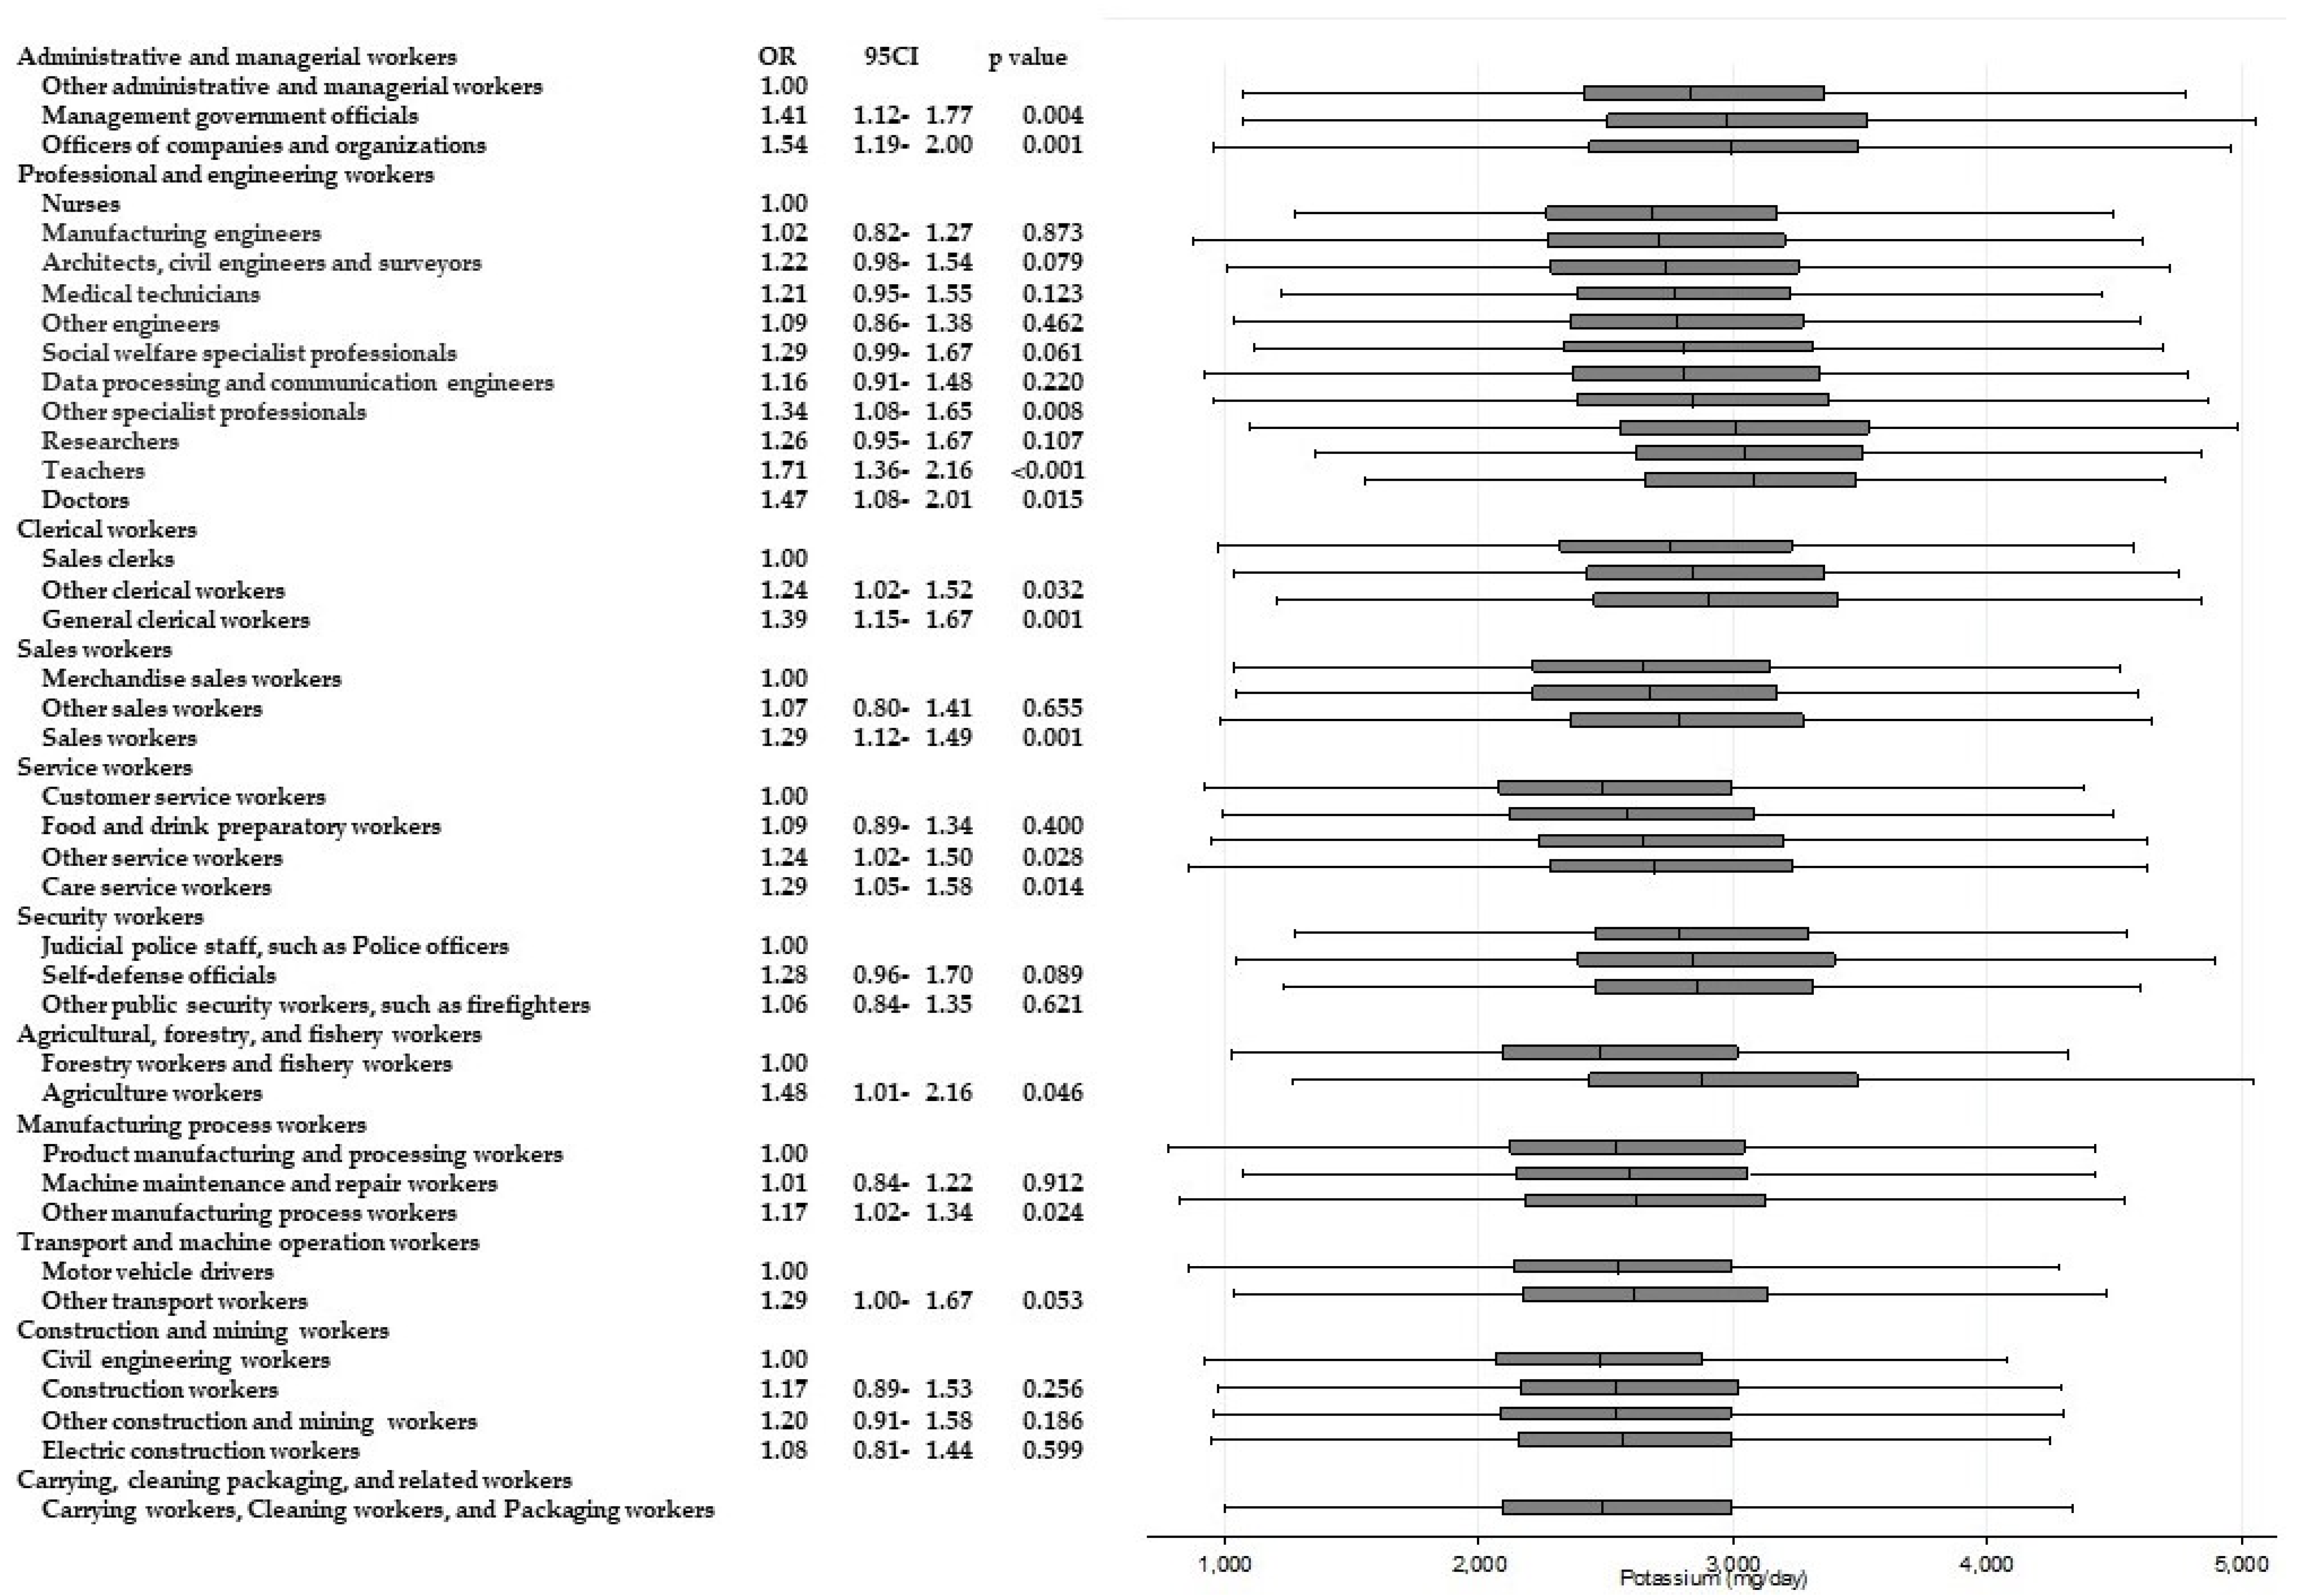
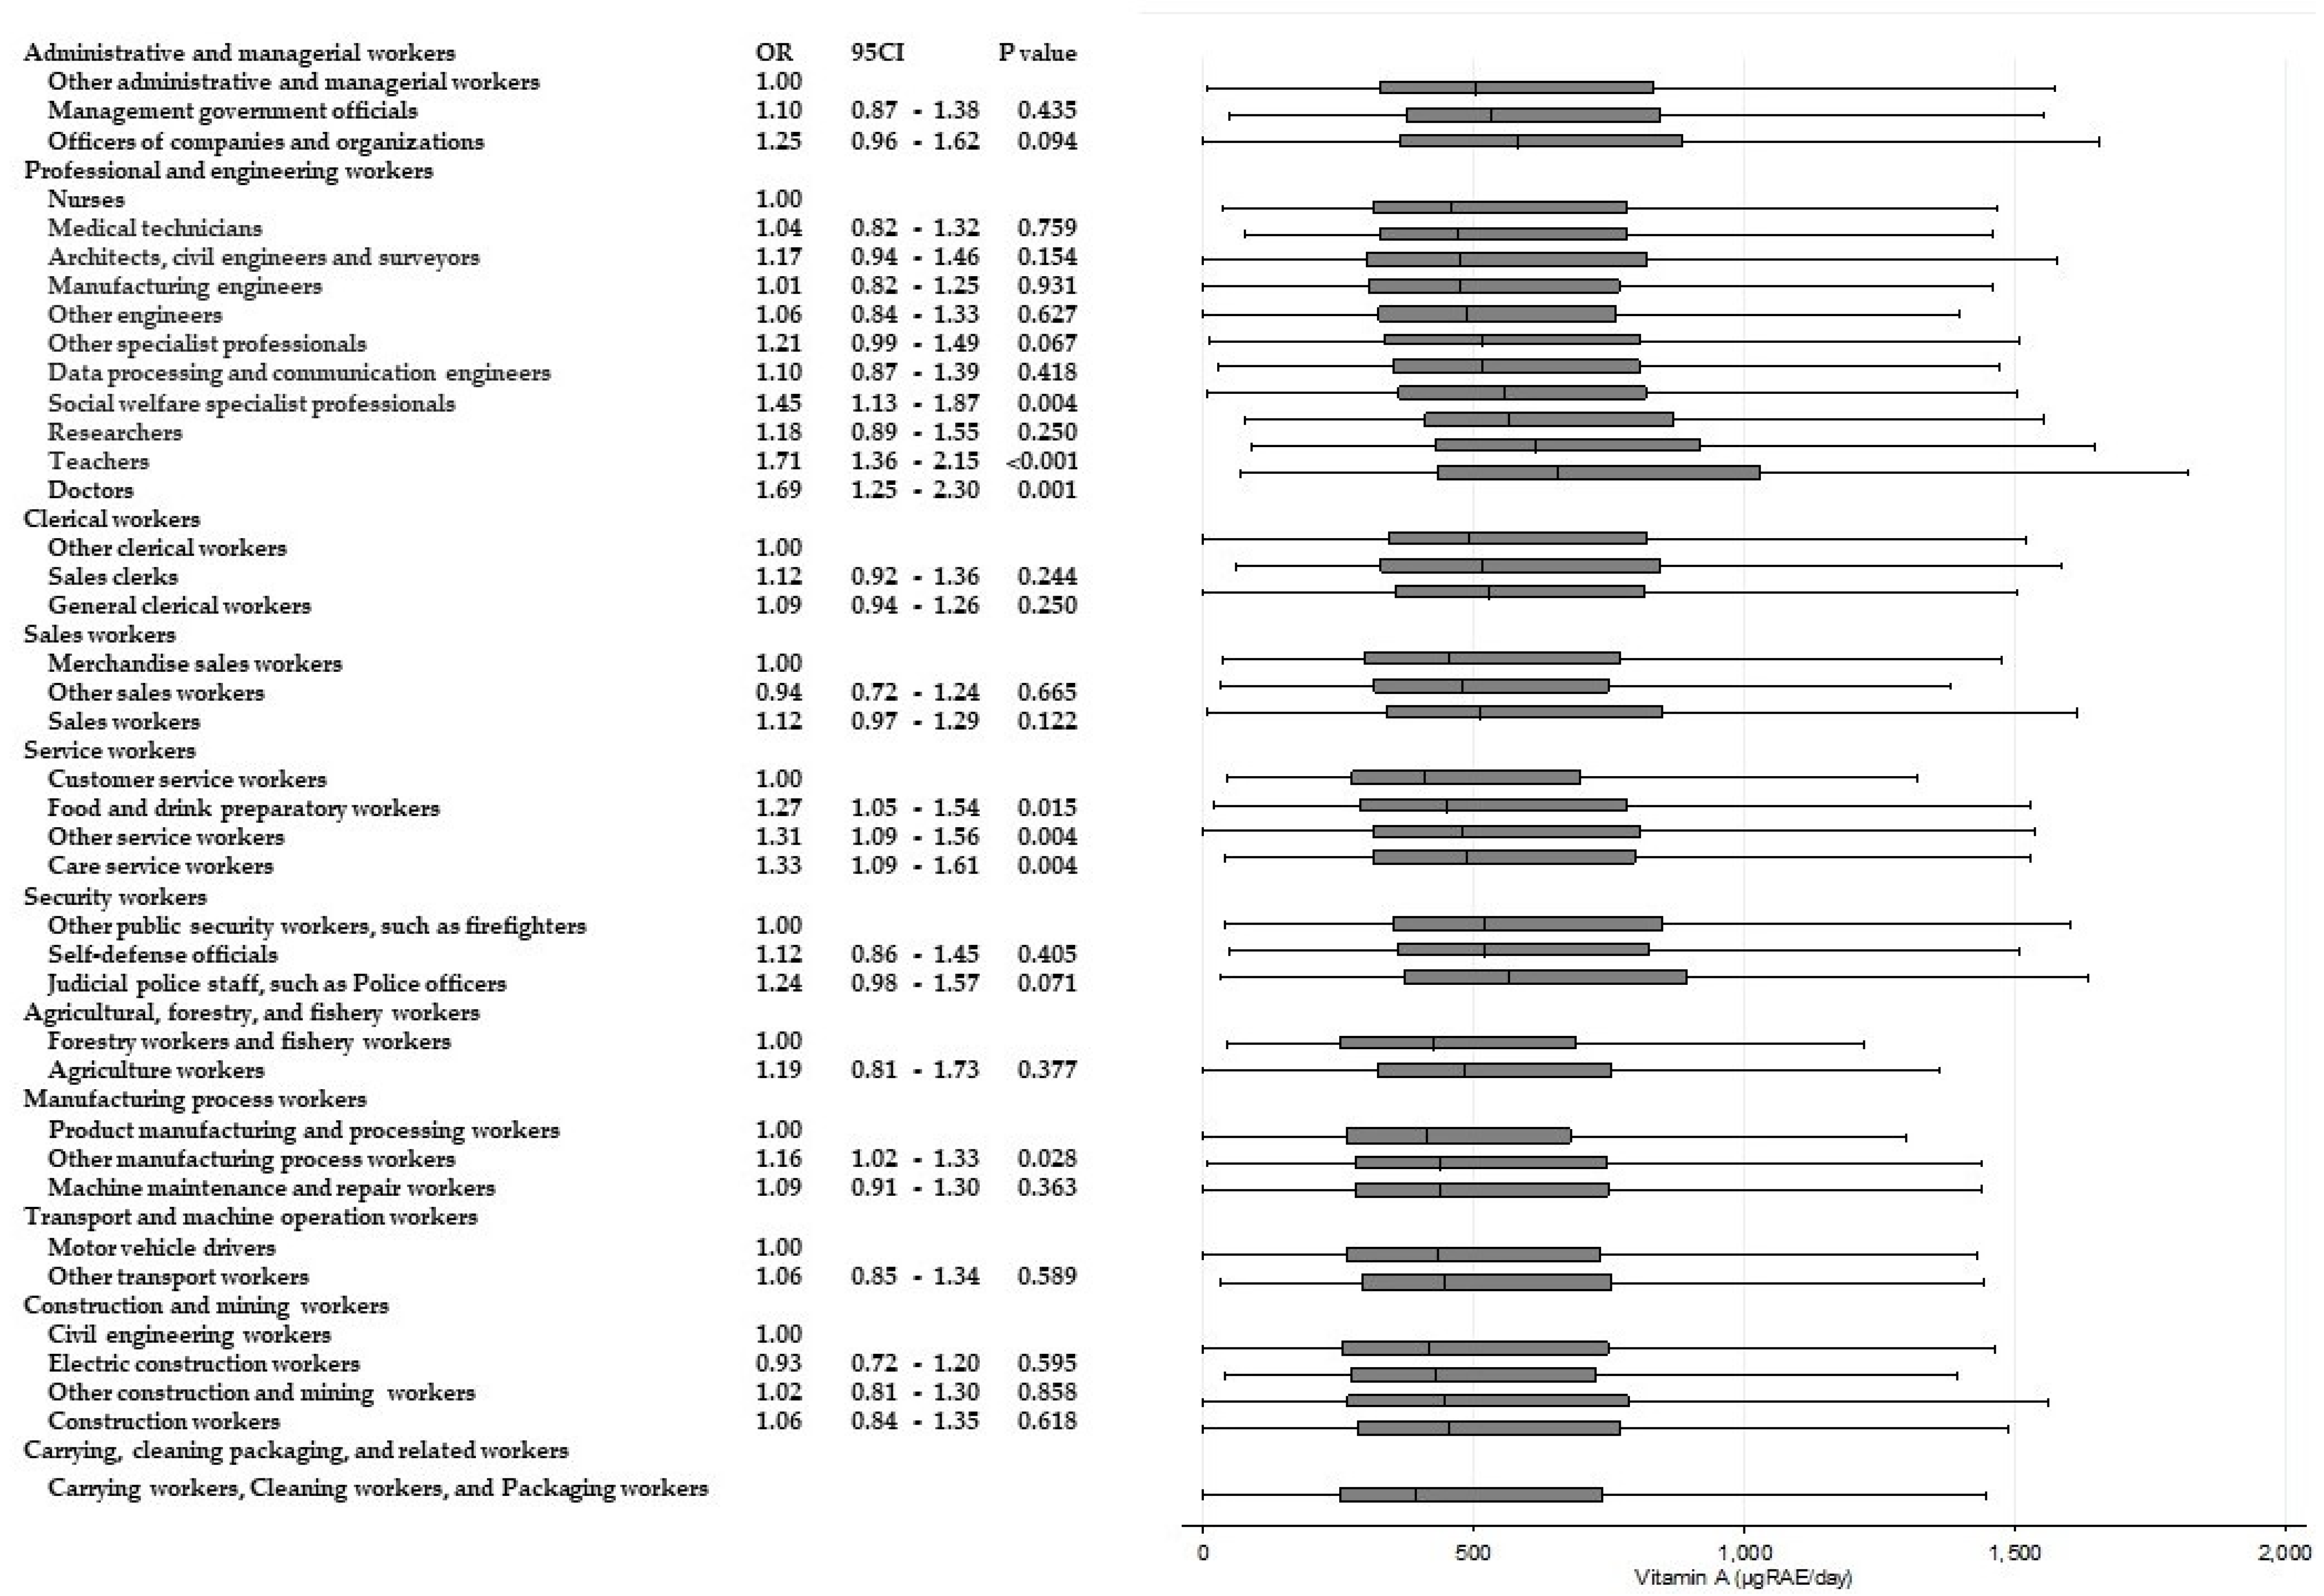
3. Results
4. Discussion
5. Limitations
6. Conclusions
Author Contributions
Funding
Acknowledgments
Conflicts of Interest
References
- Estruch, R.; Ros, E.; Salas-Salvado, J.; Covas, M.I.; Corella, D.; Aros, F.; Gomez-Gracia, E.; Ruiz-Gutierrez, V.; Fiol, M.; Lapetra, J.; et al. Primary prevention of cardiovascular disease with a Mediterranean diet. N. Engl. J. Med. 2013, 368, 1279–1290. [Google Scholar] [CrossRef] [PubMed]
- Du, H.; Li, L.; Bennett, D.; Guo, Y.; Key, T.J.; Bian, Z.; Sherliker, P.; Gao, H.; Chen, Y.; Yang, L.; et al. Fresh Fruit Consumption and Major Cardiovascular Disease in China. N. Engl. J. Med. 2016, 374, 1332–1343. [Google Scholar] [CrossRef] [PubMed]
- Kwok, C.S.; Boekholdt, S.M.; Lentjes, M.A.; Loke, Y.K.; Luben, R.N.; Yeong, J.K.; Wareham, N.J.; Myint, P.K.; Khaw, K.T. Habitual chocolate consumption and risk of cardiovascular disease among healthy men and women. Heart 2015, 101, 1279–1287. [Google Scholar] [CrossRef] [PubMed]
- Aune, D.; Keum, N.; Giovannucci, E.; Fadnes, L.T.; Boffetta, P.; Greenwood, D.C.; Tonstad, S.; Vatten, L.J.; Riboli, E.; Norat, T. Whole grain consumption and risk of cardiovascular disease, cancer, and all cause and cause specific mortality: Systematic review and dose-response meta-analysis of prospective studies. BMJ 2016, 353, i2716. [Google Scholar] [CrossRef] [PubMed]
- Mozaffarian, D. Dietary and Policy Priorities for Cardiovascular Disease, Diabetes, and Obesity: A Comprehensive Review. Circulation 2016, 133, 187–225. [Google Scholar] [CrossRef] [PubMed]
- Geaney, F.; Kelly, C.; Greiner, B.A.; Harrington, J.M.; Perry, I.J.; Beirne, P. The effectiveness of workplace dietary modification interventions: A systematic review. Prev. Med. 2013, 57, 438–447. [Google Scholar] [CrossRef] [PubMed]
- Lin, W.; Hang, C.M.; Yang, H.C.; Hung, M.H. 2005–2008 Nutrition and Health Survey in Taiwan: The nutrition knowledge, attitude and behavior of 19–64 year old adults. Asia Pac. J. Clin. Nutr. 2011, 20, 309–318. [Google Scholar] [PubMed]
- OECD Labour Force Participation Rate (Indicator). Available online: https://data.oecd.org/emp/labour-force-participation-rate.htm (accessed on 19 April 2017).
- Statistics Bureau, Ministry of Internal Affairs and Communications. Employment Status Survey, 2012 Survey, Summary of the Results. Available online: http://www.stat.go.jp/english/data/shugyou/index.htm (accessed on 7 December 2017).
- Si Hassen, W.; Castetbon, K.; Cardon, P.; Enaux, C.; Nicolaou, M.; Lien, N.; Terragni, L.; Holdsworth, M.; Stronks, K.; Hercberg, S.; et al. Socioeconomic Indicators Are Independently Associated with Nutrient Intake in French Adults: A DEDIPAC Study. Nutrients 2016, 8, 158. [Google Scholar] [CrossRef] [PubMed]
- Mishra, G.; Ball, K.; Patterson, A.; Brown, W.; Hodge, A.; Dobson, A. Socio-demographic inequalities in the diets of mid-aged Australian women. Eur. J. Clin. Nutr. 2005, 59, 185–195. [Google Scholar] [CrossRef] [PubMed]
- Kachan, D.; Lewis, J.E.; Davila, E.P.; Arheart, K.L.; LeBlanc, W.G.; Fleming, L.E.; Caban-Martinez, A.J.; Lee, D.J. Nutrient intake and adherence to dietary recommendations among US workers. J. Occup. Environ. Med. 2012, 54, 101–105. [Google Scholar] [CrossRef] [PubMed]
- Raberg Kjollesdal, M.K.; Holmboe-Ottesen, G.; Wandel, M. Associations between food patterns, socioeconomic position and working situation among adult, working women and men in Oslo. Eur. J. Clin. Nutr. 2010, 64, 1150–1157. [Google Scholar] [CrossRef] [PubMed][Green Version]
- Fukuda, Y.; Nakamura, K.; Takano, T. Accumulation of health risk behaviours is associated with lower socioeconomic status and women’s urban residence: A multilevel analysis in Japan. BMC Public Health 2005, 5, 53. [Google Scholar] [CrossRef] [PubMed]
- Mejean, C.; Si Hassen, W.; Lecossais, C.; Alles, B.; Peneau, S.; Hercberg, S.; Castetbon, K. Socio-economic indicators are independently associated with intake of animal foods in French adults. Public Health Nutr. 2016, 19, 3146–3157. [Google Scholar] [CrossRef] [PubMed]
- Boylan, S.; Lallukka, T.; Lahelma, E.; Pikhart, H.; Malyutina, S.; Pajak, A.; Kubinova, R.; Bragina, O.; Stepaniak, U.; Gillis-Januszewska, A.; et al. Socio-economic circumstances and food habits in Eastern, Central and Western European populations. Public Health Nutr. 2011, 14, 678–687. [Google Scholar] [CrossRef] [PubMed]
- Tsiga, E.; Panagopoulou, E.; Niakas, D. Health promotion across occupational groups: One size does not fit all. Occup. Med. 2015, 65, 552–557. [Google Scholar] [CrossRef] [PubMed]
- Communications, Ministry of Internal Affairs and Communications. Japan Standard Occupational Classification (Rev. 5 December 2009) General Principles for the Japan Standard Occupational Classification. Available online: http://www.soumu.go.jp/english/dgpp_ss/seido/shokgyou/co09-2.htm (accessed on 14 June 2017).
- Communications, Ministry of Internal Affairs and Communications. Japan Standard Occupational Classification (Rev. 5 December 2009) Structure and Explanatory Notes. Available online: http://www.soumu.go.jp/english/dgpp_ss/seido/shokgyou/co09-4.htm (accessed on 14 June 2017).
- Kawamoto, T.; Nitta, H.; Murata, K.; Toda, E.; Tsukamoto, N.; Hasegawa, M.; Yamagata, Z.; Kayama, F.; Kishi, R.; Ohya, Y.; et al. Rationale and study design of the Japan environment and children’s study (JECS). BMC Public Health 2014, 14, 25. [Google Scholar] [CrossRef] [PubMed]
- Michikawa, T.; Nitta, H.; Nakayama, S.F.; Ono, M.; Yonemoto, J.; Tamura, K.; Suda, E.; Ito, H.; Takeuchi, A.; Kawamoto, T. The Japan Environment and Children’s Study (JECS): A Preliminary Report on Selected Characteristics of Approximately 10,000 Pregnant Women Recruited during the First Year of the Study. J. Epidemiol. 2015, 25, 452–458. [Google Scholar] [CrossRef] [PubMed]
- Michikawa, T.N.H.; Nakayama, F.S.; Yamazaki, S.; Isobe, T.; Tamura, K.; Suda, E.; Ono, M.; Yonemoto, J.; Iwai-Shimada, M.; Kobayashi, Y.; et al. Baseline profile of participants in the Japan Environment and Children’s Study (JECS). J. Epidemiol. 2018, 28, 99–104. [Google Scholar] [CrossRef] [PubMed]
- Kobayashi, S.; Asakura, K.; Suga, H.; Sasaki, S. Living status and frequency of eating out-of-home foods in relation to nutritional adequacy in 4017 Japanese female dietetic students aged 18–20 years: A multicenter cross-sectional study. J. Epidemiol. 2017, 27, 287–293. [Google Scholar] [CrossRef] [PubMed]
- Ministry of Health, Labour and Welfare. Overview of Dietary Reference Intakes for Japanese. Available online: http://www.mhlw.go.jp/file/06-Seisakujouhou-10900000-Kenkoukyoku/Overview.pdf (accessed on 31 May 2017).
- Yokoyama, Y.; Takachi, R.; Ishihara, J.; Ishii, Y.; Sasazuki, S.; Sawada, N.; Shinozawa, Y.; Tanaka, J.; Kato, E.; Kitamura, K.; et al. Validity of Short and Long Self-Administered Food Frequency Questionnaires in Ranking Dietary Intake in Middle-Aged and Elderly Japanese in the Japan Public Health Center-Based Prospective Study for the Next Generation (JPHC-NEXT) Protocol Area. J. Epidemiol. 2016, 26, 420–432. [Google Scholar] [CrossRef] [PubMed]
- Escoto, K.H.; Laska, M.N.; Larson, N.; Neumark-Sztainer, D.; Hannan, P.J. Work hours and perceived time barriers to healthful eating among young adults. Am. J. Health Behav. 2012, 36, 786–796. [Google Scholar] [CrossRef] [PubMed]
- Hemio, K.; Puttonen, S.; Viitasalo, K.; Harma, M.; Peltonen, M.; Lindstrom, J. Food and nutrient intake among workers with different shift systems. Occup. Environ. Med. 2015, 72, 513–520. [Google Scholar] [CrossRef] [PubMed]
- Han, K.; Choi-Kwon, S.; Kim, K.S. Poor dietary behaviors among hospital nurses in Seoul, South Korea. Appl. Nurs. Res. 2016, 30, 38–44. [Google Scholar] [CrossRef] [PubMed]
- Ramin, C.; Devore, E.E.; Wang, W.; Pierre-Paul, J.; Wegrzyn, L.R.; Schernhammer, E.S. Night shift work at specific age ranges and chronic disease risk factors. Occup. Environ. Med. 2015, 72, 100–107. [Google Scholar] [CrossRef] [PubMed]
- Almajwal, A.M. Stress, shift duty, and eating behavior among nurses in Central Saudi Arabia. Saudi Med. J. 2016, 37, 191–198. [Google Scholar] [CrossRef] [PubMed]
- Nicholls, R.; Perry, L.; Duffield, C.; Gallagher, R.; Pierce, H. Barriers and facilitators to healthy eating for nurses in the workplace: An integrative review. J. Adv. Nurs. 2017, 73, 1051–1065. [Google Scholar] [CrossRef] [PubMed]
- Raulio, S.; Roos, E.; Prattala, R. School and workplace meals promote healthy food habits. Public Health Nutr. 2010, 13, 987–992. [Google Scholar] [CrossRef] [PubMed]
- Almeida, F.A.; Wall, S.S.; You, W.; Harden, S.M.; Hill, J.L.; Krippendorf, B.E.; Estabrooks, P.A. The association between worksite physical environment and employee nutrition, and physical activity behavior and weight status. J. Occup. Environ. Med. 2014, 56, 779–784. [Google Scholar] [CrossRef] [PubMed]
- Roos, E.; Sarlio-Lahteenkorva, S.; Lallukka, T. Having lunch at a staff canteen is associated with recommended food habits. Public Health Nutr. 2004, 7, 53–61. [Google Scholar] [CrossRef] [PubMed]
- Kjollesdal, M.R.; Holmboe-Ottesen, G.; Wandel, M. Frequent use of staff canteens is associated with unhealthy dietary habits and obesity in a Norwegian adult population. Public Health Nutr. 2011, 14, 133–141. [Google Scholar] [CrossRef] [PubMed]
- Asakura, K.; Sasaki, S. School lunches in Japan: Their contribution to healthier nutrient intake among elementary-school and junior high-school children. Public Health Nutr. 2017, 20, 1523–1533. [Google Scholar] [CrossRef] [PubMed]
- Umezawa, A.; Miwa, T.; Shibui, E.; Namikawa, T.; Tanaka, N.; Ishikawa, M. Total Vegetable Intake and Homegrown Vegetable Intake in the Rural Area Residents of Hokkaido. Jpn. J. Nutr. Diet. 2012, 70, 283–293. [Google Scholar] [CrossRef][Green Version]
- Sato, K. The influence an agricultural experience on eating habits in university student’s from an elementary school. J. Jpn. Mibyou Syst. Assoc. 2015, 21, 7–14. [Google Scholar]


| Occupation | N | % |
|---|---|---|
| Administrative and managerial workers | ||
| Management government officials | 603 | 1.56 |
| Officers of companies and organizations | 387 | 1.00 |
| Other administrative and managerial workers | 687 | 1.78 |
| Professional and engineering workers | ||
| Researchers a | 489 | 1.27 |
| Manufacturing engineers | 2332 | 6.03 |
| Architects, civil engineers, and surveyors | 1608 | 4.16 |
| Data processing and communication engineers | 897 | 2.32 |
| Other engineers | 1115 | 2.88 |
| Doctors b | 389 | 1.01 |
| Nurses | 488 | 1.26 |
| Medical technicians c | 718 | 1.86 |
| Social welfare specialist professionals | 543 | 1.40 |
| Teachers d | 1238 | 3.20 |
| Other specialist professionals | 2490 | 6.44 |
| Clerical workers | ||
| General clerical workers | 1923 | 4.97 |
| Sales clerks | 660 | 1.71 |
| Other clerical workers | 1233 | 3.19 |
| Sales workers | ||
| Merchandise sales workers | 1379 | 3.57 |
| Sales workers | 2654 | 6.87 |
| Other sales workers | 274 | 0.71 |
| Service workers | ||
| Care service workers | 943 | 2.44 |
| Food and drink preparatory workers | 973 | 2.52 |
| Customer service workers | 993 | 2.57 |
| Other service workers | 1310 | 3.39 |
| Security workers | ||
| Self-defense officials | 461 | 1.19 |
| Judicial police staff, such as police officers | 616 | 1.59 |
| Other public security workers, such as firefighters | 648 | 1.68 |
| Agricultural, forestry, and fishery workers | ||
| Agriculture workers | 401 | 1.04 |
| Forestry workers and fishery workers | 255 | 0.66 |
| Manufacturing process workers | ||
| Product manufacturing and processing workers | 2897 | 7.49 |
| Machine maintenance and repair workers | 722 | 1.87 |
| Other manufacturing process workers | 1591 | 4.12 |
| Transport and machine operation workers | ||
| Motor vehicle drivers | 1090 | 2.82 |
| Other transport workers | 536 | 1.39 |
| Construction and mining workers | ||
| Construction workers | 754 | 1.95 |
| Electric construction workers | 585 | 1.51 |
| Civil engineering workers | 539 | 1.39 |
| Other construction and mining workers | 700 | 1.81 |
| Carrying, cleaning packaging, and related workers | ||
| Carrying workers, cleaning workers, and packaging workers | 535 | 1.38 |
| N | % | |
|---|---|---|
| Educational level | ||
| Junior high school | 1865 | 4.8 |
| High school | 13,632 | 35.0 |
| Higher professional school | 805 | 2.0 |
| Professional school | 7539 | 20.0 |
| Junior college | 837 | 2.0 |
| University | 11,935 | 31.0 |
| Graduate school | 2043 | 5.3 |
| Household income | ||
| <2 million yen | 1541 | 4.0 |
| 2.0–3.9 million yen | 12,908 | 33.4 |
| 4.0–5.9 million yen | 13,280 | 34.4 |
| 6.0–7.9 million yen | 6522 | 16.9 |
| 8.0–9.9 million yen | 2735 | 7.1 |
| 10–11.9 million yen | 988 | 2.6 |
| 12–14.9 million yen | 366 | 1.0 |
| 15–19.9 million yen | 215 | 0.6 |
| ≥20 million yen | 101 | 0.3 |
| Adherence to recommendations | ||
| Protein 13–20% energy/day a | 14,705 | 38.0 |
| Fatty acid 20–30% energy/day a | 21,130 | 55.0 |
| Carbohydrate 50–65% energy/day a | 23,764 | 61.0 |
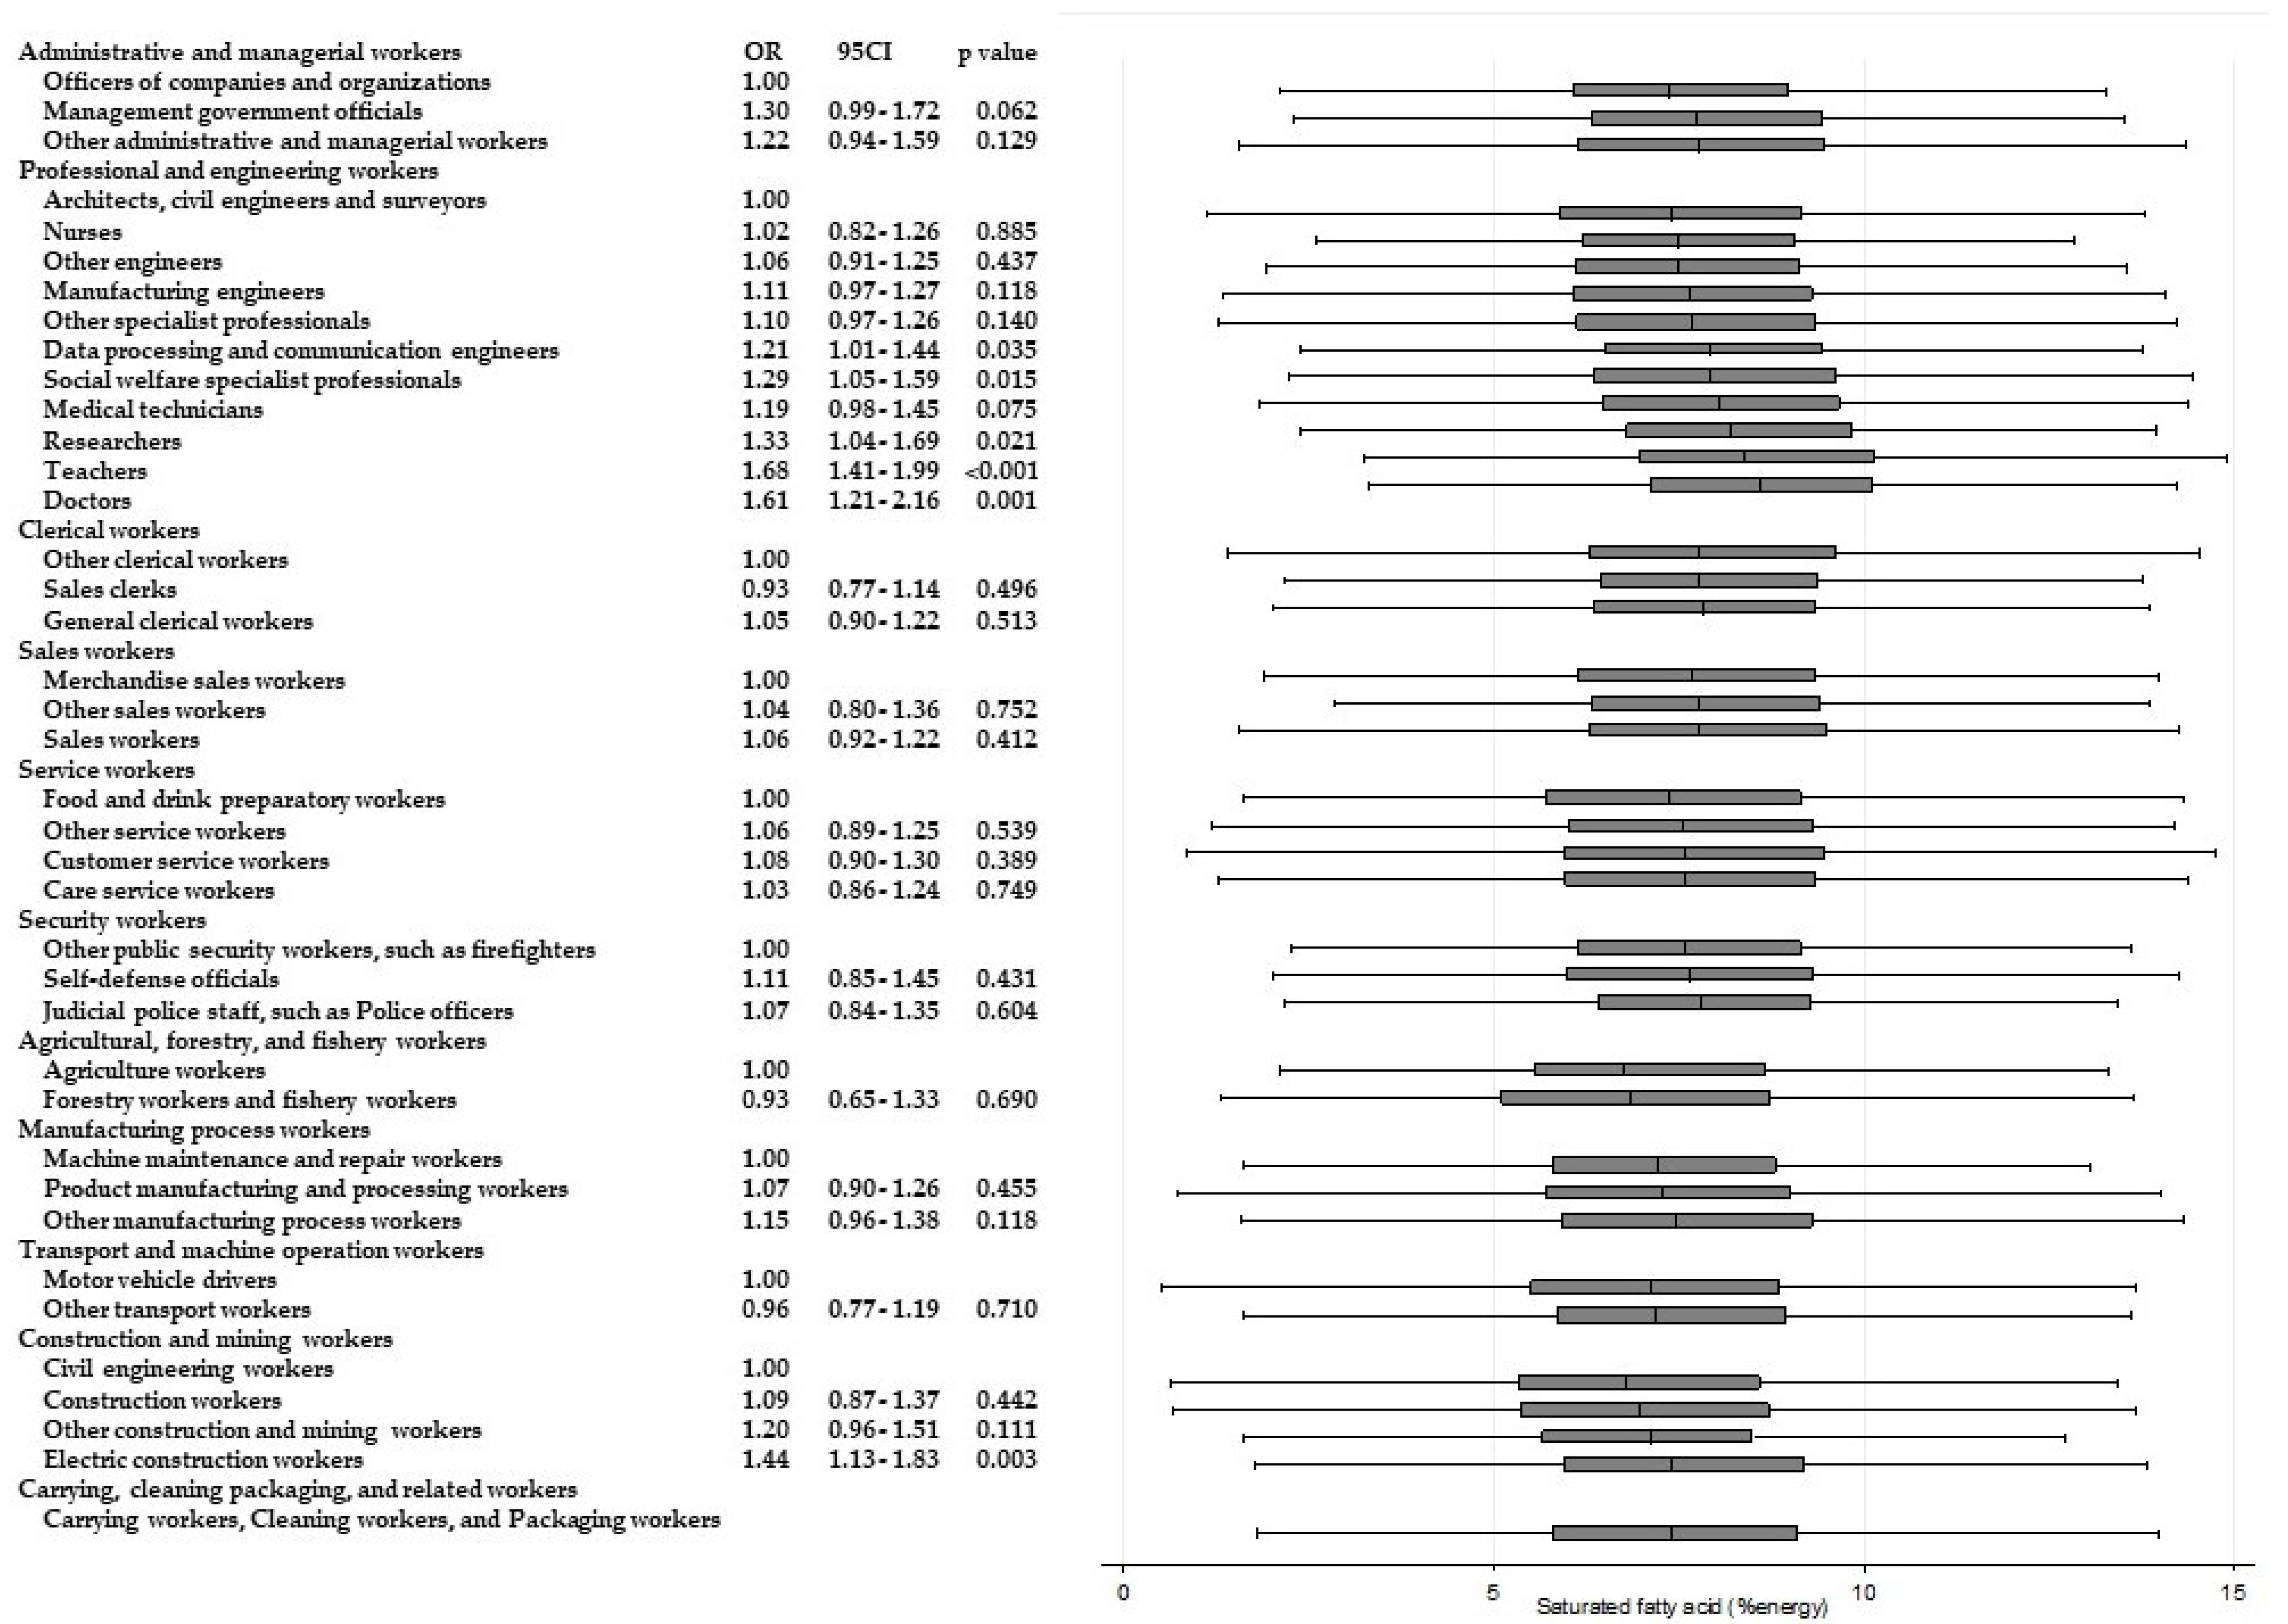
| Saturated fatty acid ≤7 g/day a | 15,451 | 40.0 |
| Dietary fiber ≥20 g/day a | 2349 | 6.1 |
| Salt <8 g/day a | 8389 | 21.7 |
| Potassium ≥3000 mg/day a | 13,639 | 35.3 |
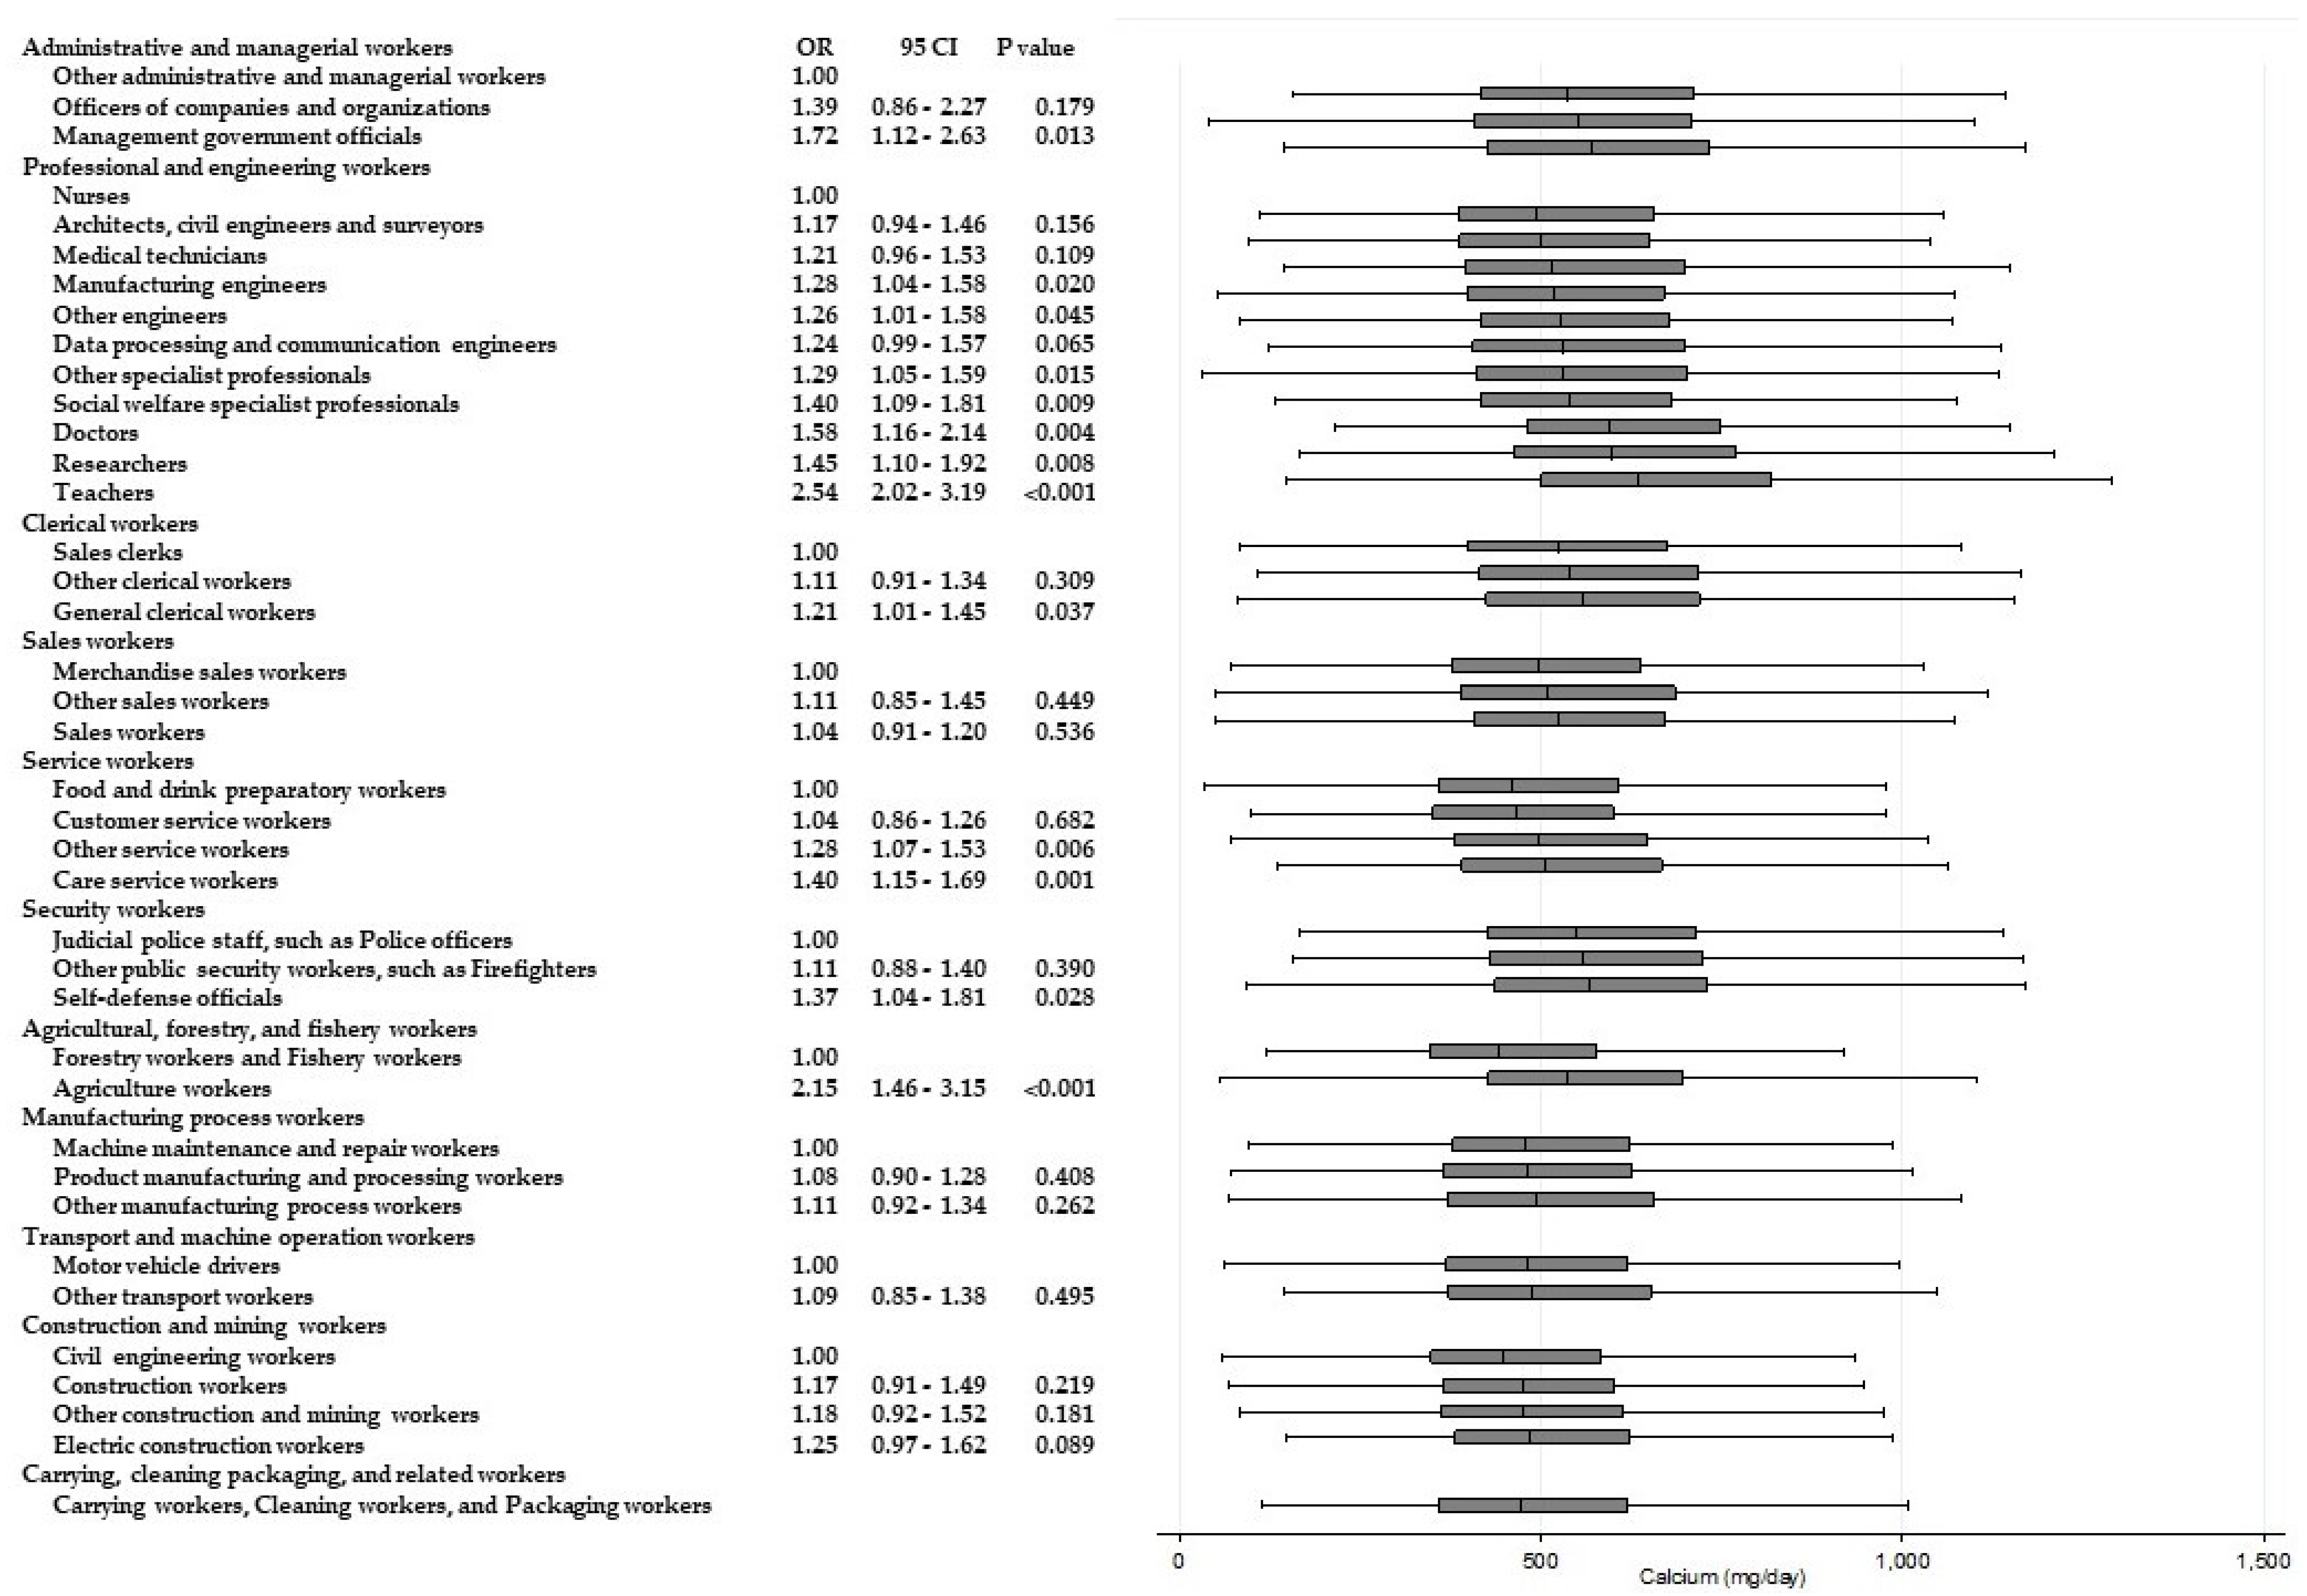
| Calcium ≥550 mg/day b | 16,711 | 43.2 |
| Vitamin A ≥600 mg/day b | 14,744 | 38.1 |
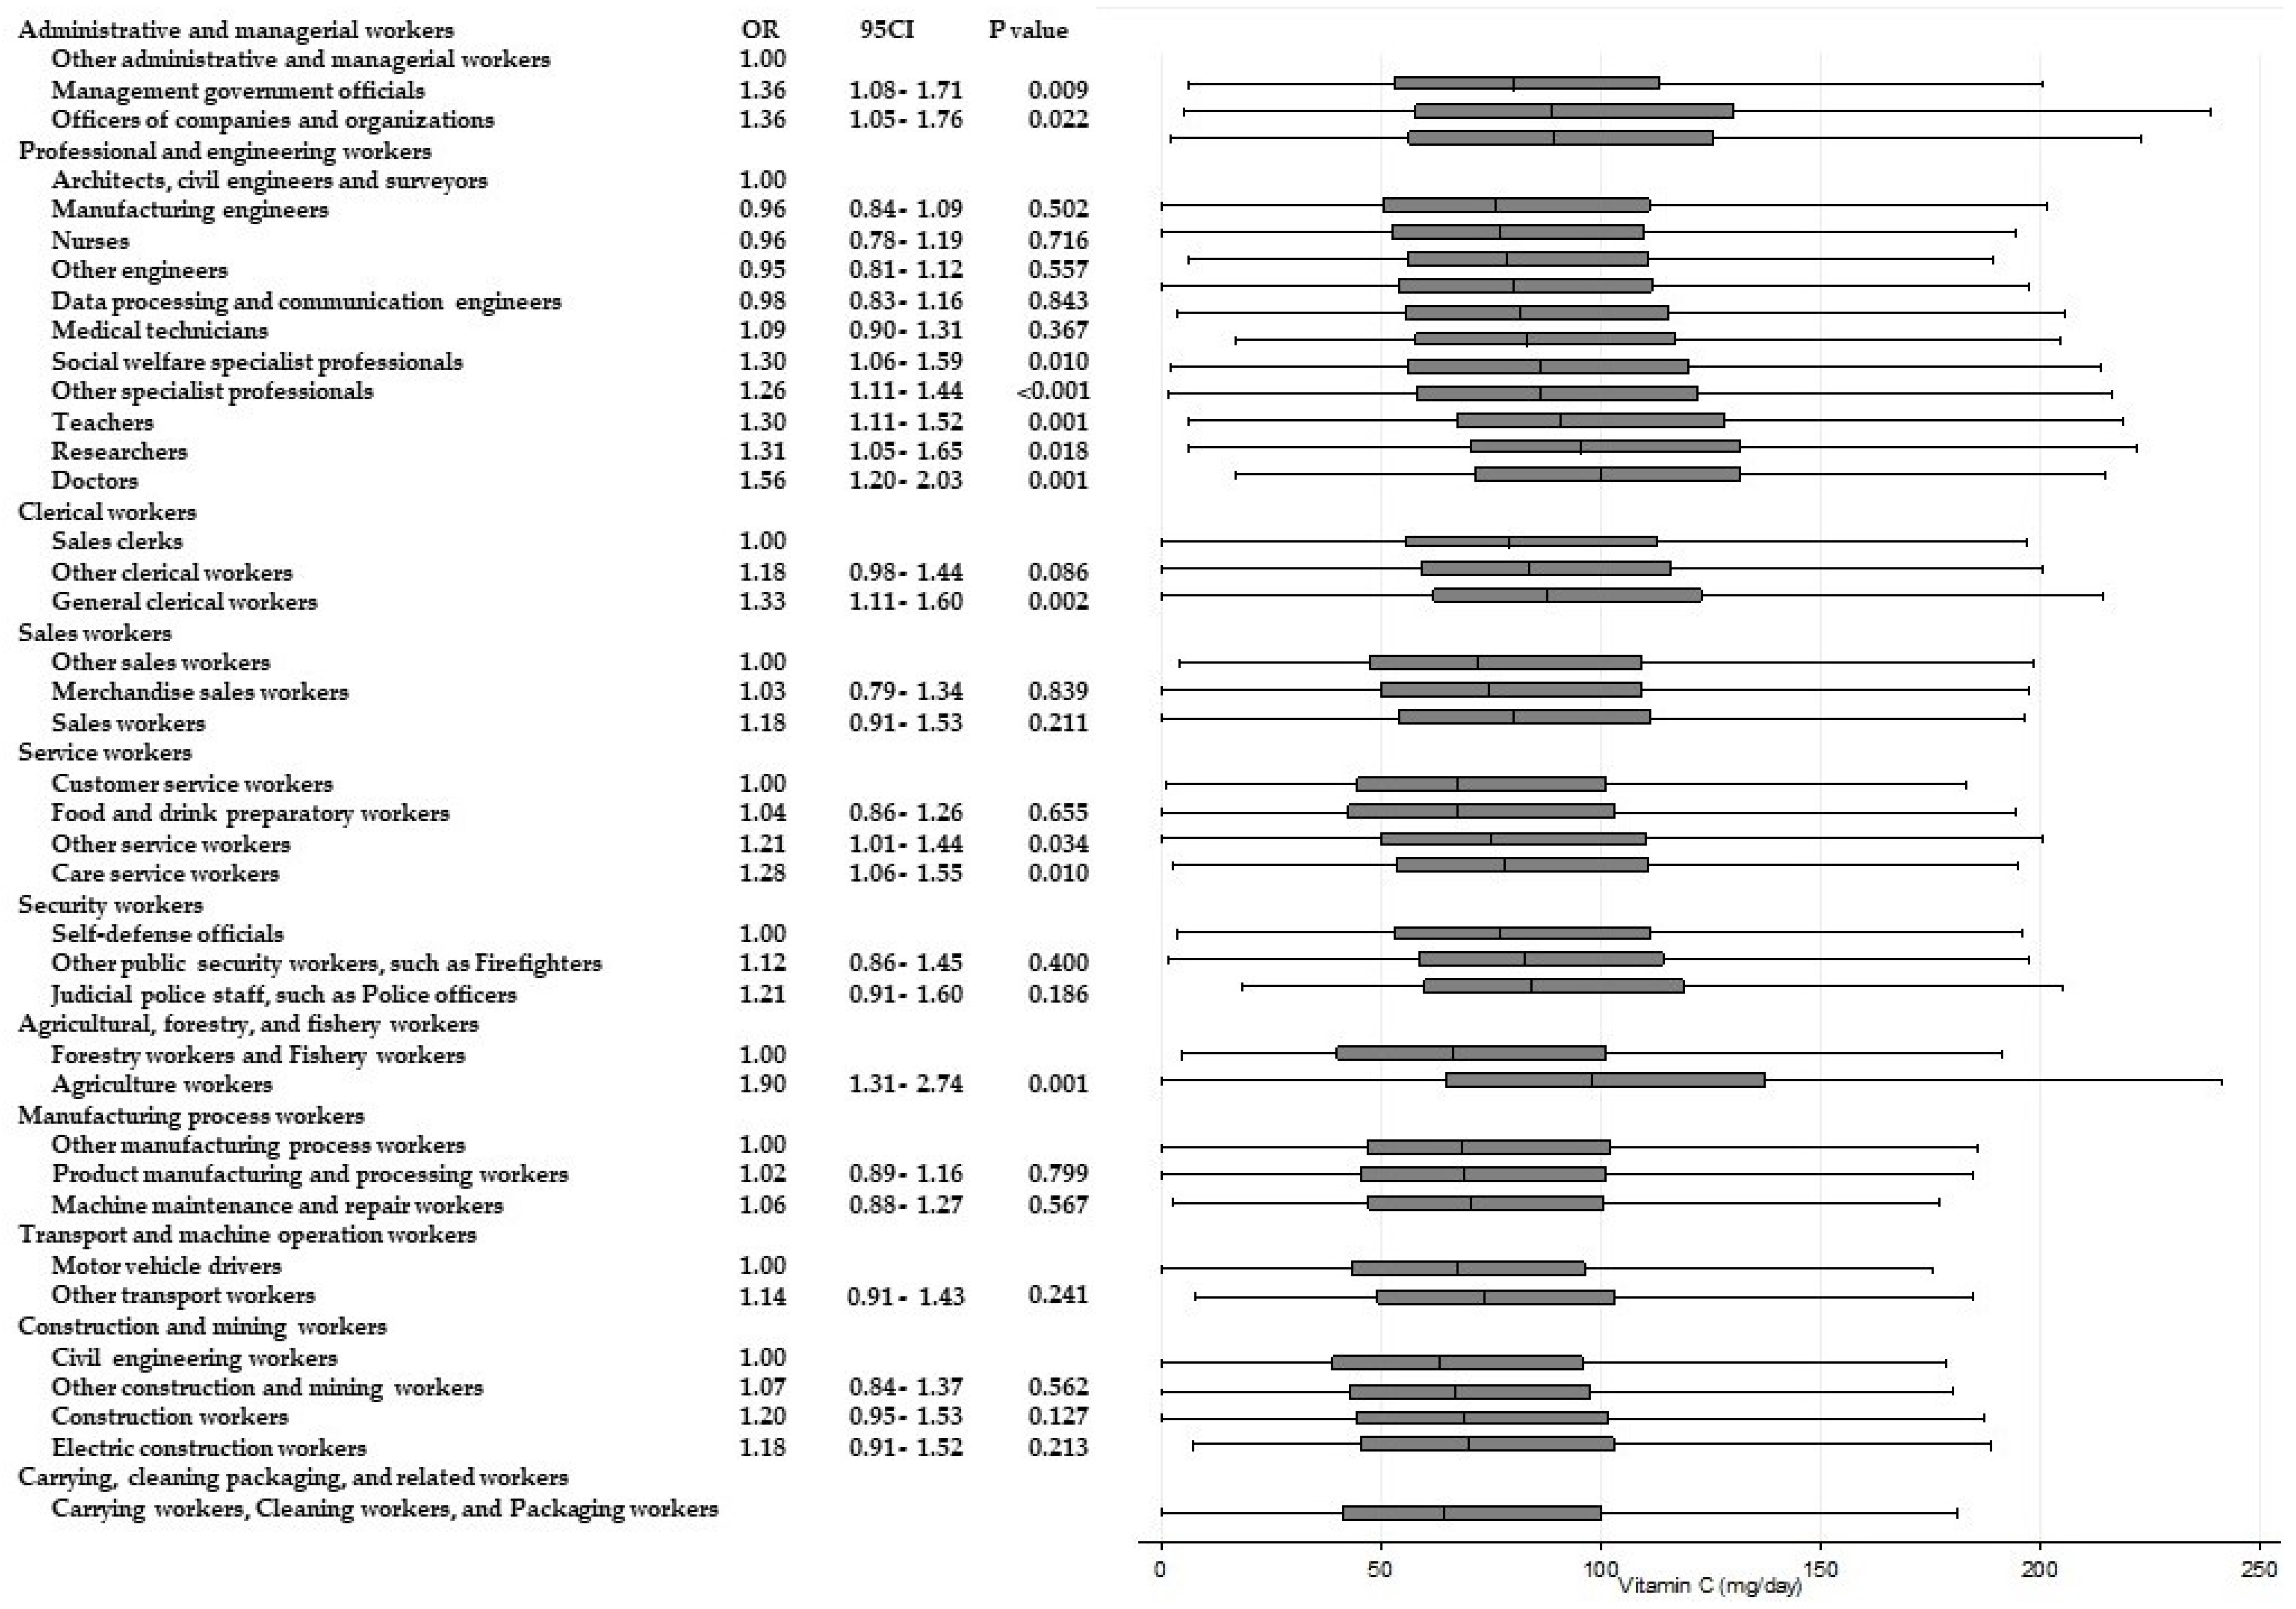
| Vitamin C ≥85 mg/day b | 16,905 | 44.0 |
| Vitamin B1 ≥1.1 mg/day b | 16,110 | 41.7 |
| Energy and Nutrients | Energy | Protein | Fatty Acid | Carbohydrate | Saturated Fatty Acid | Dietary Fiber | Salt | Potassium | Calcium | Vitamin A | Vitamin C | Vitamin B1 |
|---|---|---|---|---|---|---|---|---|---|---|---|---|
| Administrative and managerial workers a | * | NS | NS | * | NS | * | NS | * | NS | NS | * | ** |
| Professional and engineering workers a | ** | ** | ** | ** | ** | ** | ** | ** | ** | ** | ** | ** |
| Clerical workers a | NS | NS | NS | NS | NS | * | NS | ** | * | NS | ** | NS |
| Sales workers a | * | * | NS | ** | NS | * | NS | ** | ** | ** | ** | NS |
| Service workers a | NS | * | NS | ** | NS | ** | ** | ** | ** | ** | ** | ** |
| Security workers a | * | * | NS | * | NS | NS | NS | NS | NS | NS | * | NS |
| Agricultural, forestry, and fishery workers b | NS | NS | NS | NS | NS | ** | * | ** | ** | ** | ** | ** |
| Manufacturing process workers a | * | * | * | * | * | * | NS | ** | NS | * | NS | * |
| Transport and machine operation workers b | NS | ** | * | NS | NS | NS | * | * | NS | NS | * | * |
| Construction and mining workers a | NS | * | ** | NS | ** | * | NS | NS | * | NS | * | NS |
| Carrying, cleaning packaging, and related workers | - | - | - | - | - | - | - | - | - | - | - | - |
© 2018 by the authors. Licensee MDPI, Basel, Switzerland. This article is an open access article distributed under the terms and conditions of the Creative Commons Attribution (CC BY) license (http://creativecommons.org/licenses/by/4.0/).
Share and Cite
Tanaka, R.; Tsuji, M.; Senju, A.; Kusuhara, K.; Kawamoto, T.; Japan Environment and Children’s Study Group. Dietary Differences in Male Workers among Smaller Occupational Groups within Large Occupational Categories: Findings from the Japan Environment and Children’s Study (JECS). Int. J. Environ. Res. Public Health 2018, 15, 961. https://doi.org/10.3390/ijerph15050961
Tanaka R, Tsuji M, Senju A, Kusuhara K, Kawamoto T, Japan Environment and Children’s Study Group. Dietary Differences in Male Workers among Smaller Occupational Groups within Large Occupational Categories: Findings from the Japan Environment and Children’s Study (JECS). International Journal of Environmental Research and Public Health. 2018; 15(5):961. https://doi.org/10.3390/ijerph15050961
Chicago/Turabian StyleTanaka, Rie, Mayumi Tsuji, Ayako Senju, Koichi Kusuhara, Toshihiro Kawamoto, and Japan Environment and Children’s Study Group. 2018. "Dietary Differences in Male Workers among Smaller Occupational Groups within Large Occupational Categories: Findings from the Japan Environment and Children’s Study (JECS)" International Journal of Environmental Research and Public Health 15, no. 5: 961. https://doi.org/10.3390/ijerph15050961
APA StyleTanaka, R., Tsuji, M., Senju, A., Kusuhara, K., Kawamoto, T., & Japan Environment and Children’s Study Group. (2018). Dietary Differences in Male Workers among Smaller Occupational Groups within Large Occupational Categories: Findings from the Japan Environment and Children’s Study (JECS). International Journal of Environmental Research and Public Health, 15(5), 961. https://doi.org/10.3390/ijerph15050961