Cancer Incidence Trend in the Hebei Spirit Oil Spill Area, from 1999 to 2014: An Ecological Study


Abstract
1. Introduction
2. Materials and Methods
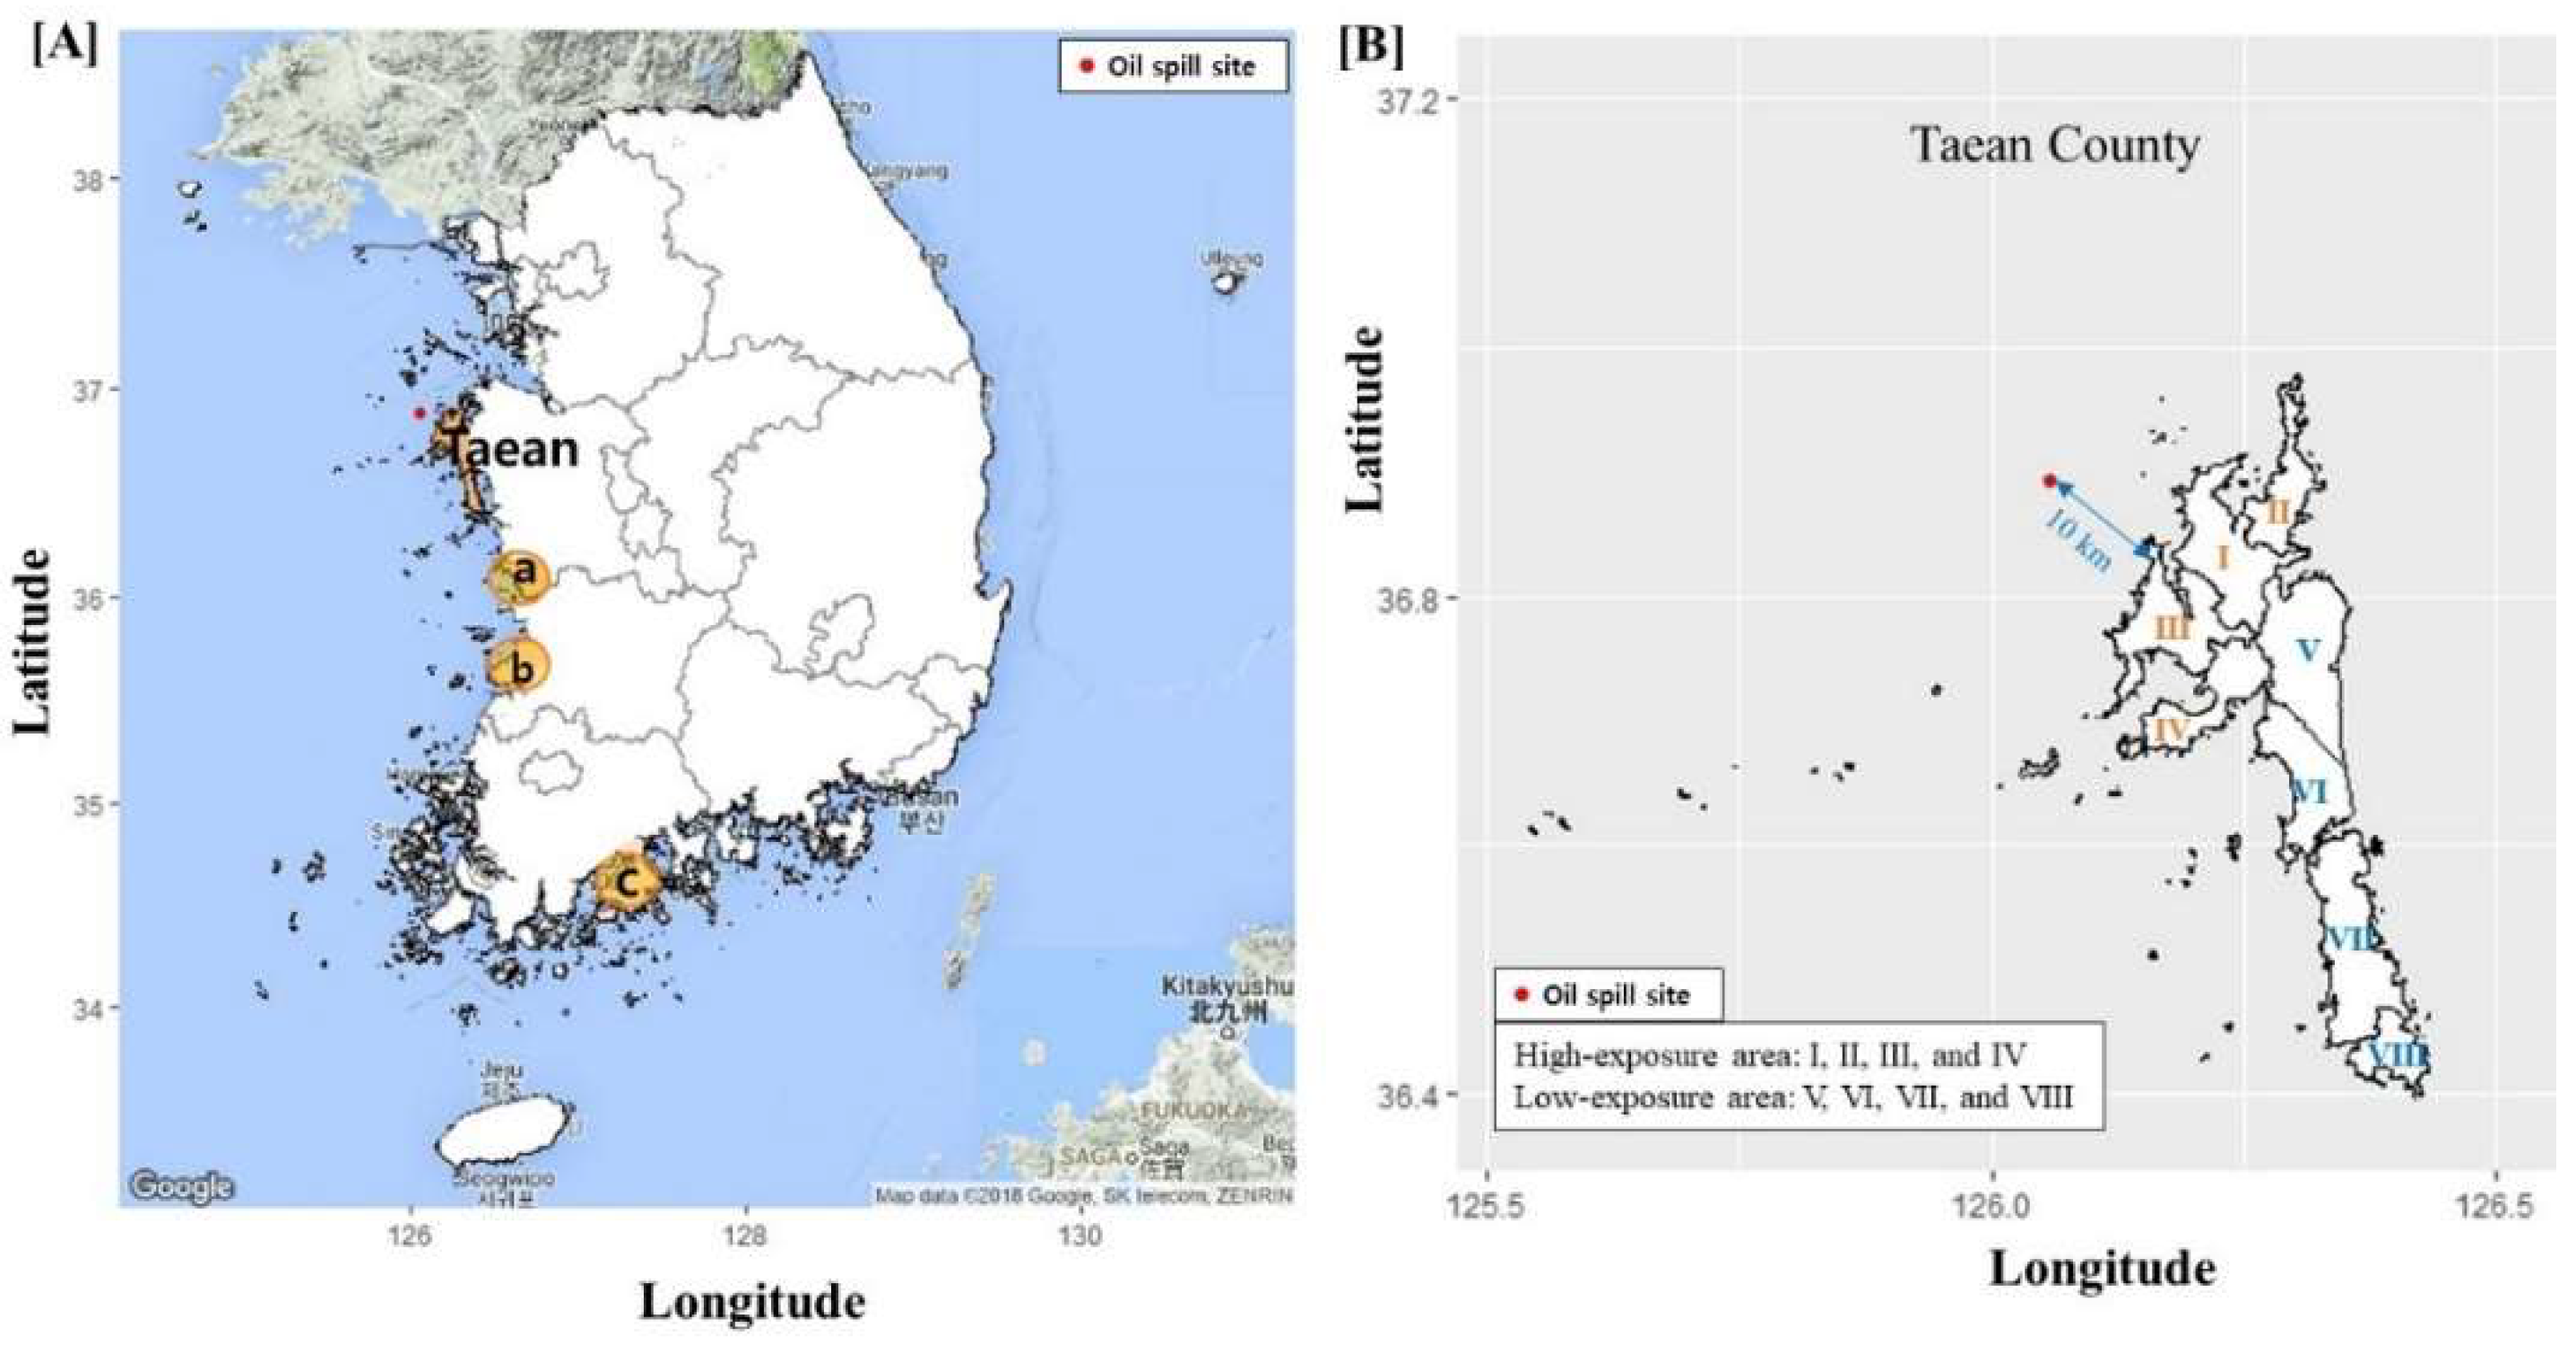
2.1. Study Areas
2.1.1. Exposure Area
2.1.2. Comparison Areas
2.2. Age-Standardized Cancer Incidence
2.3. Statistical Analysis
2.4. Ethics Statement
3. Results
3.1. Age-Standardized Incidence Rate and Incidence Rate Ratio
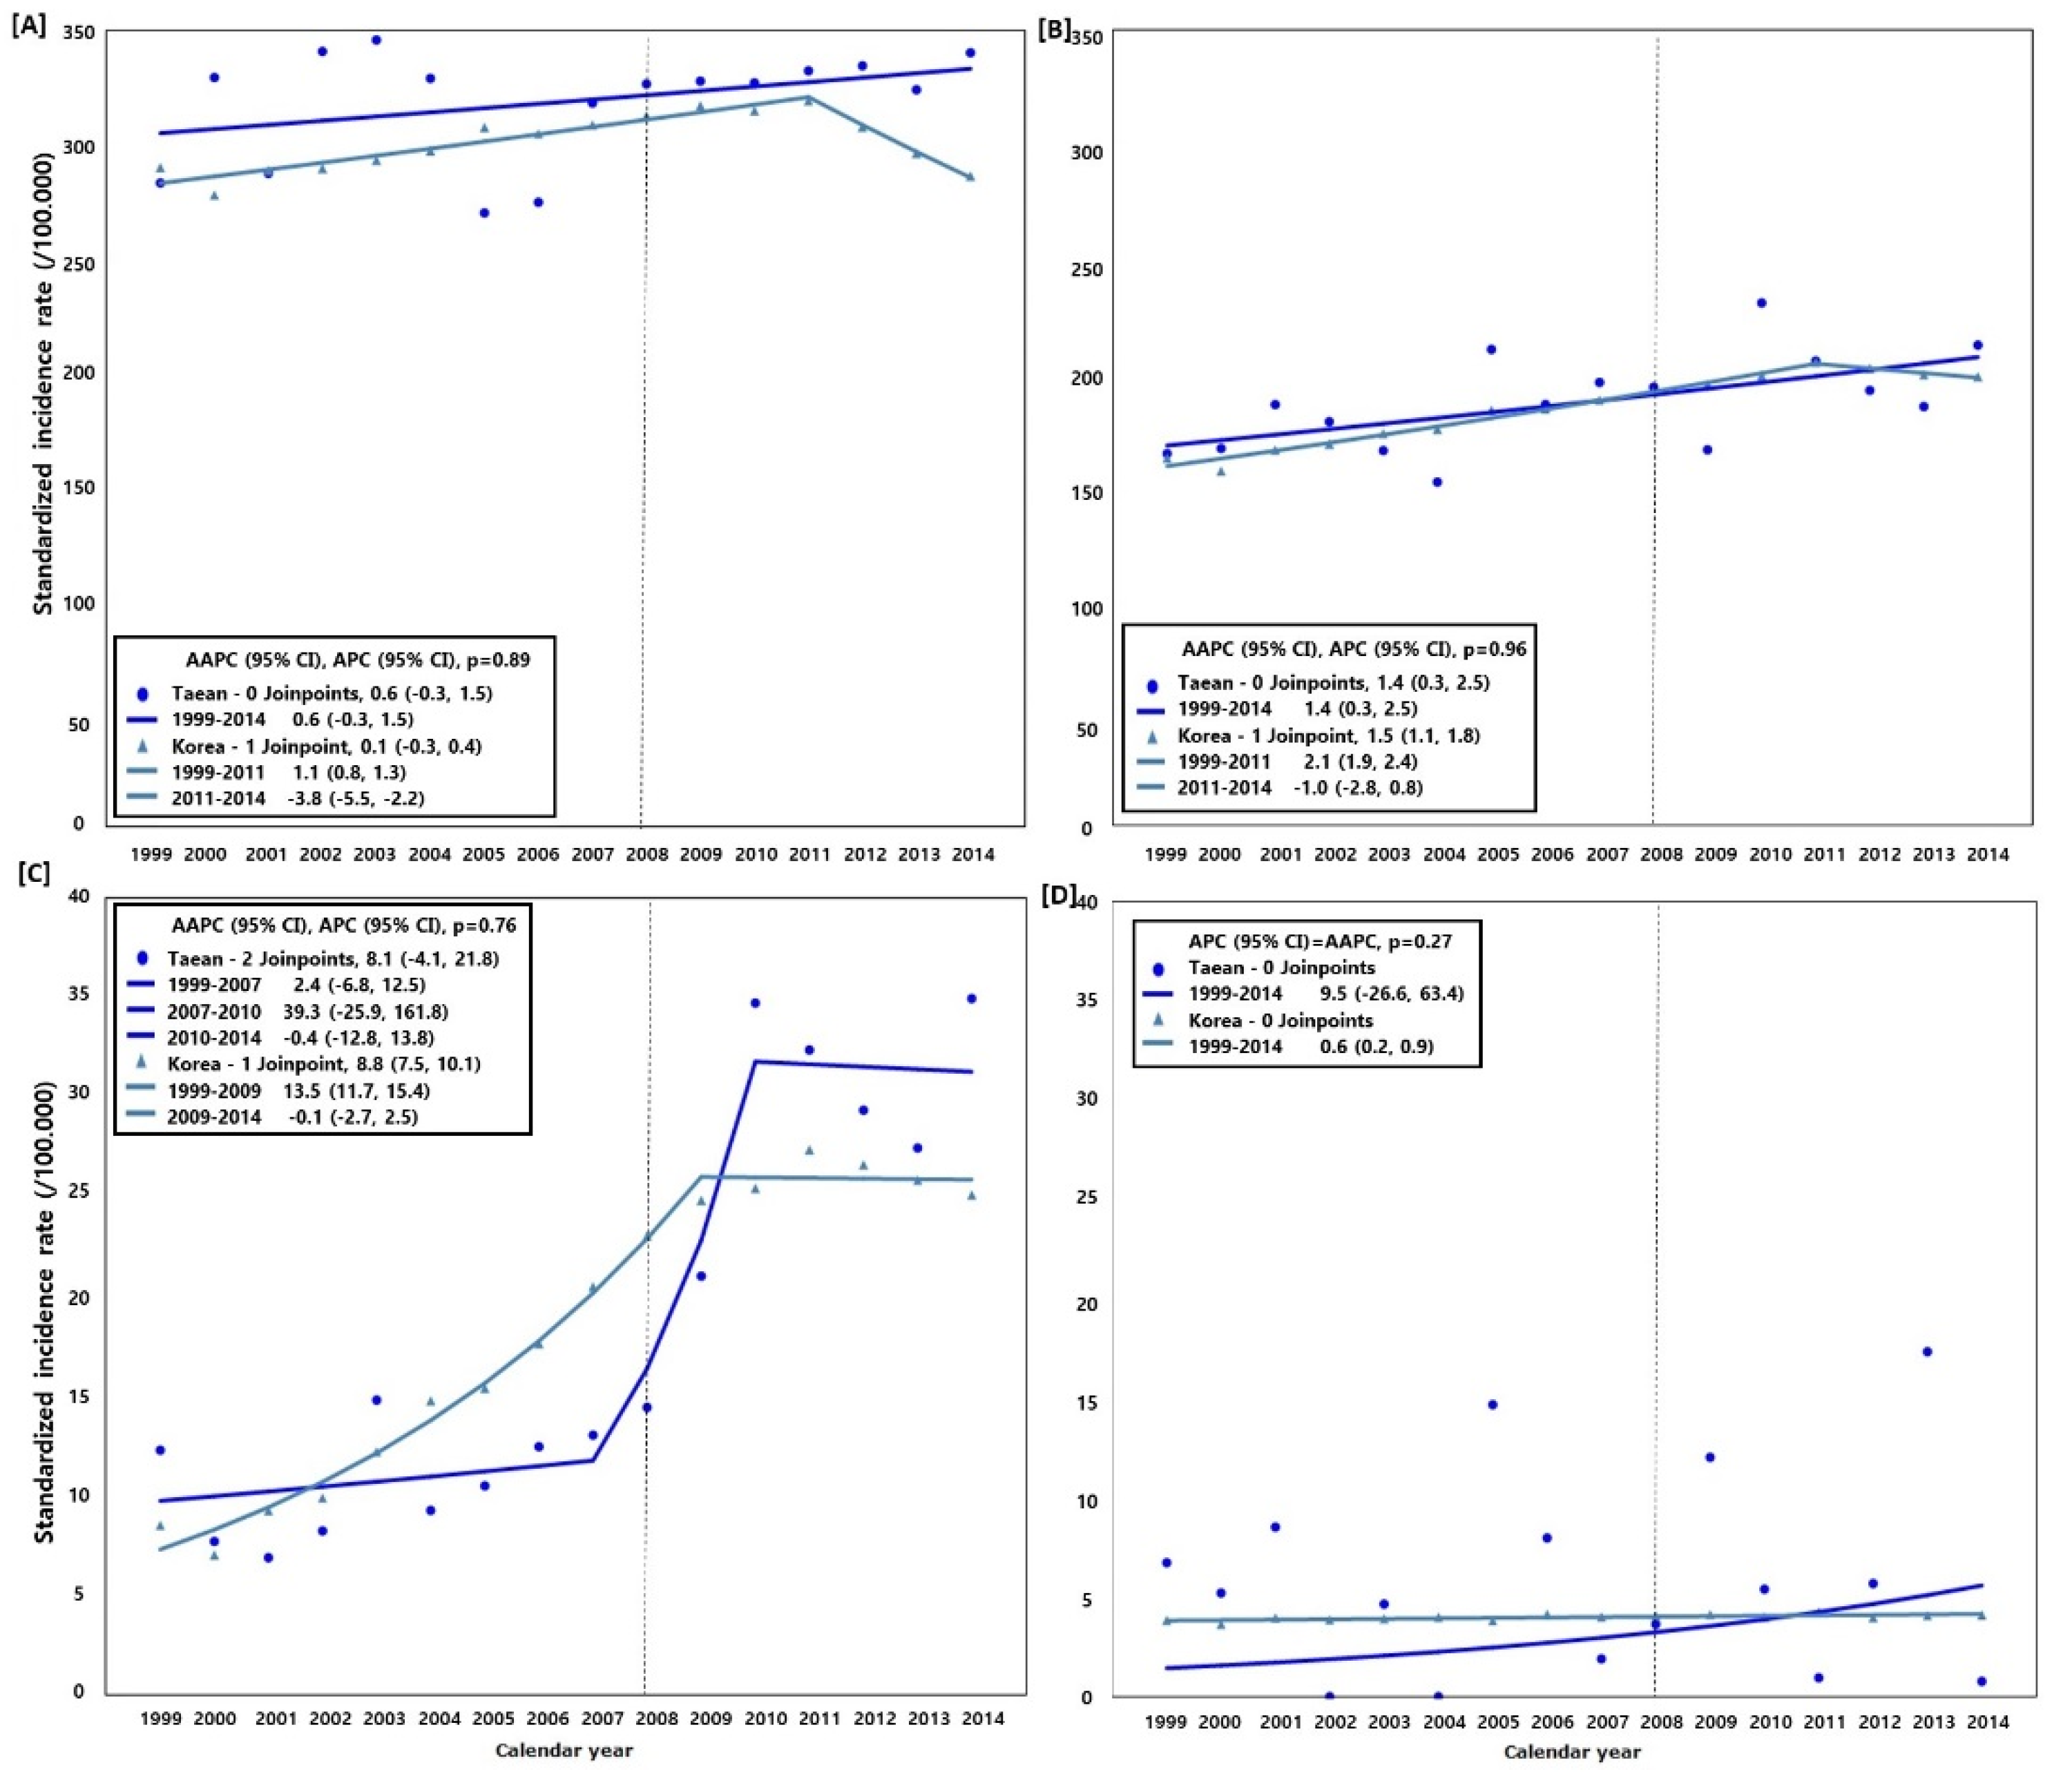
3.2. Trend of Cancer Incidence (Taean vs. Nationwide)
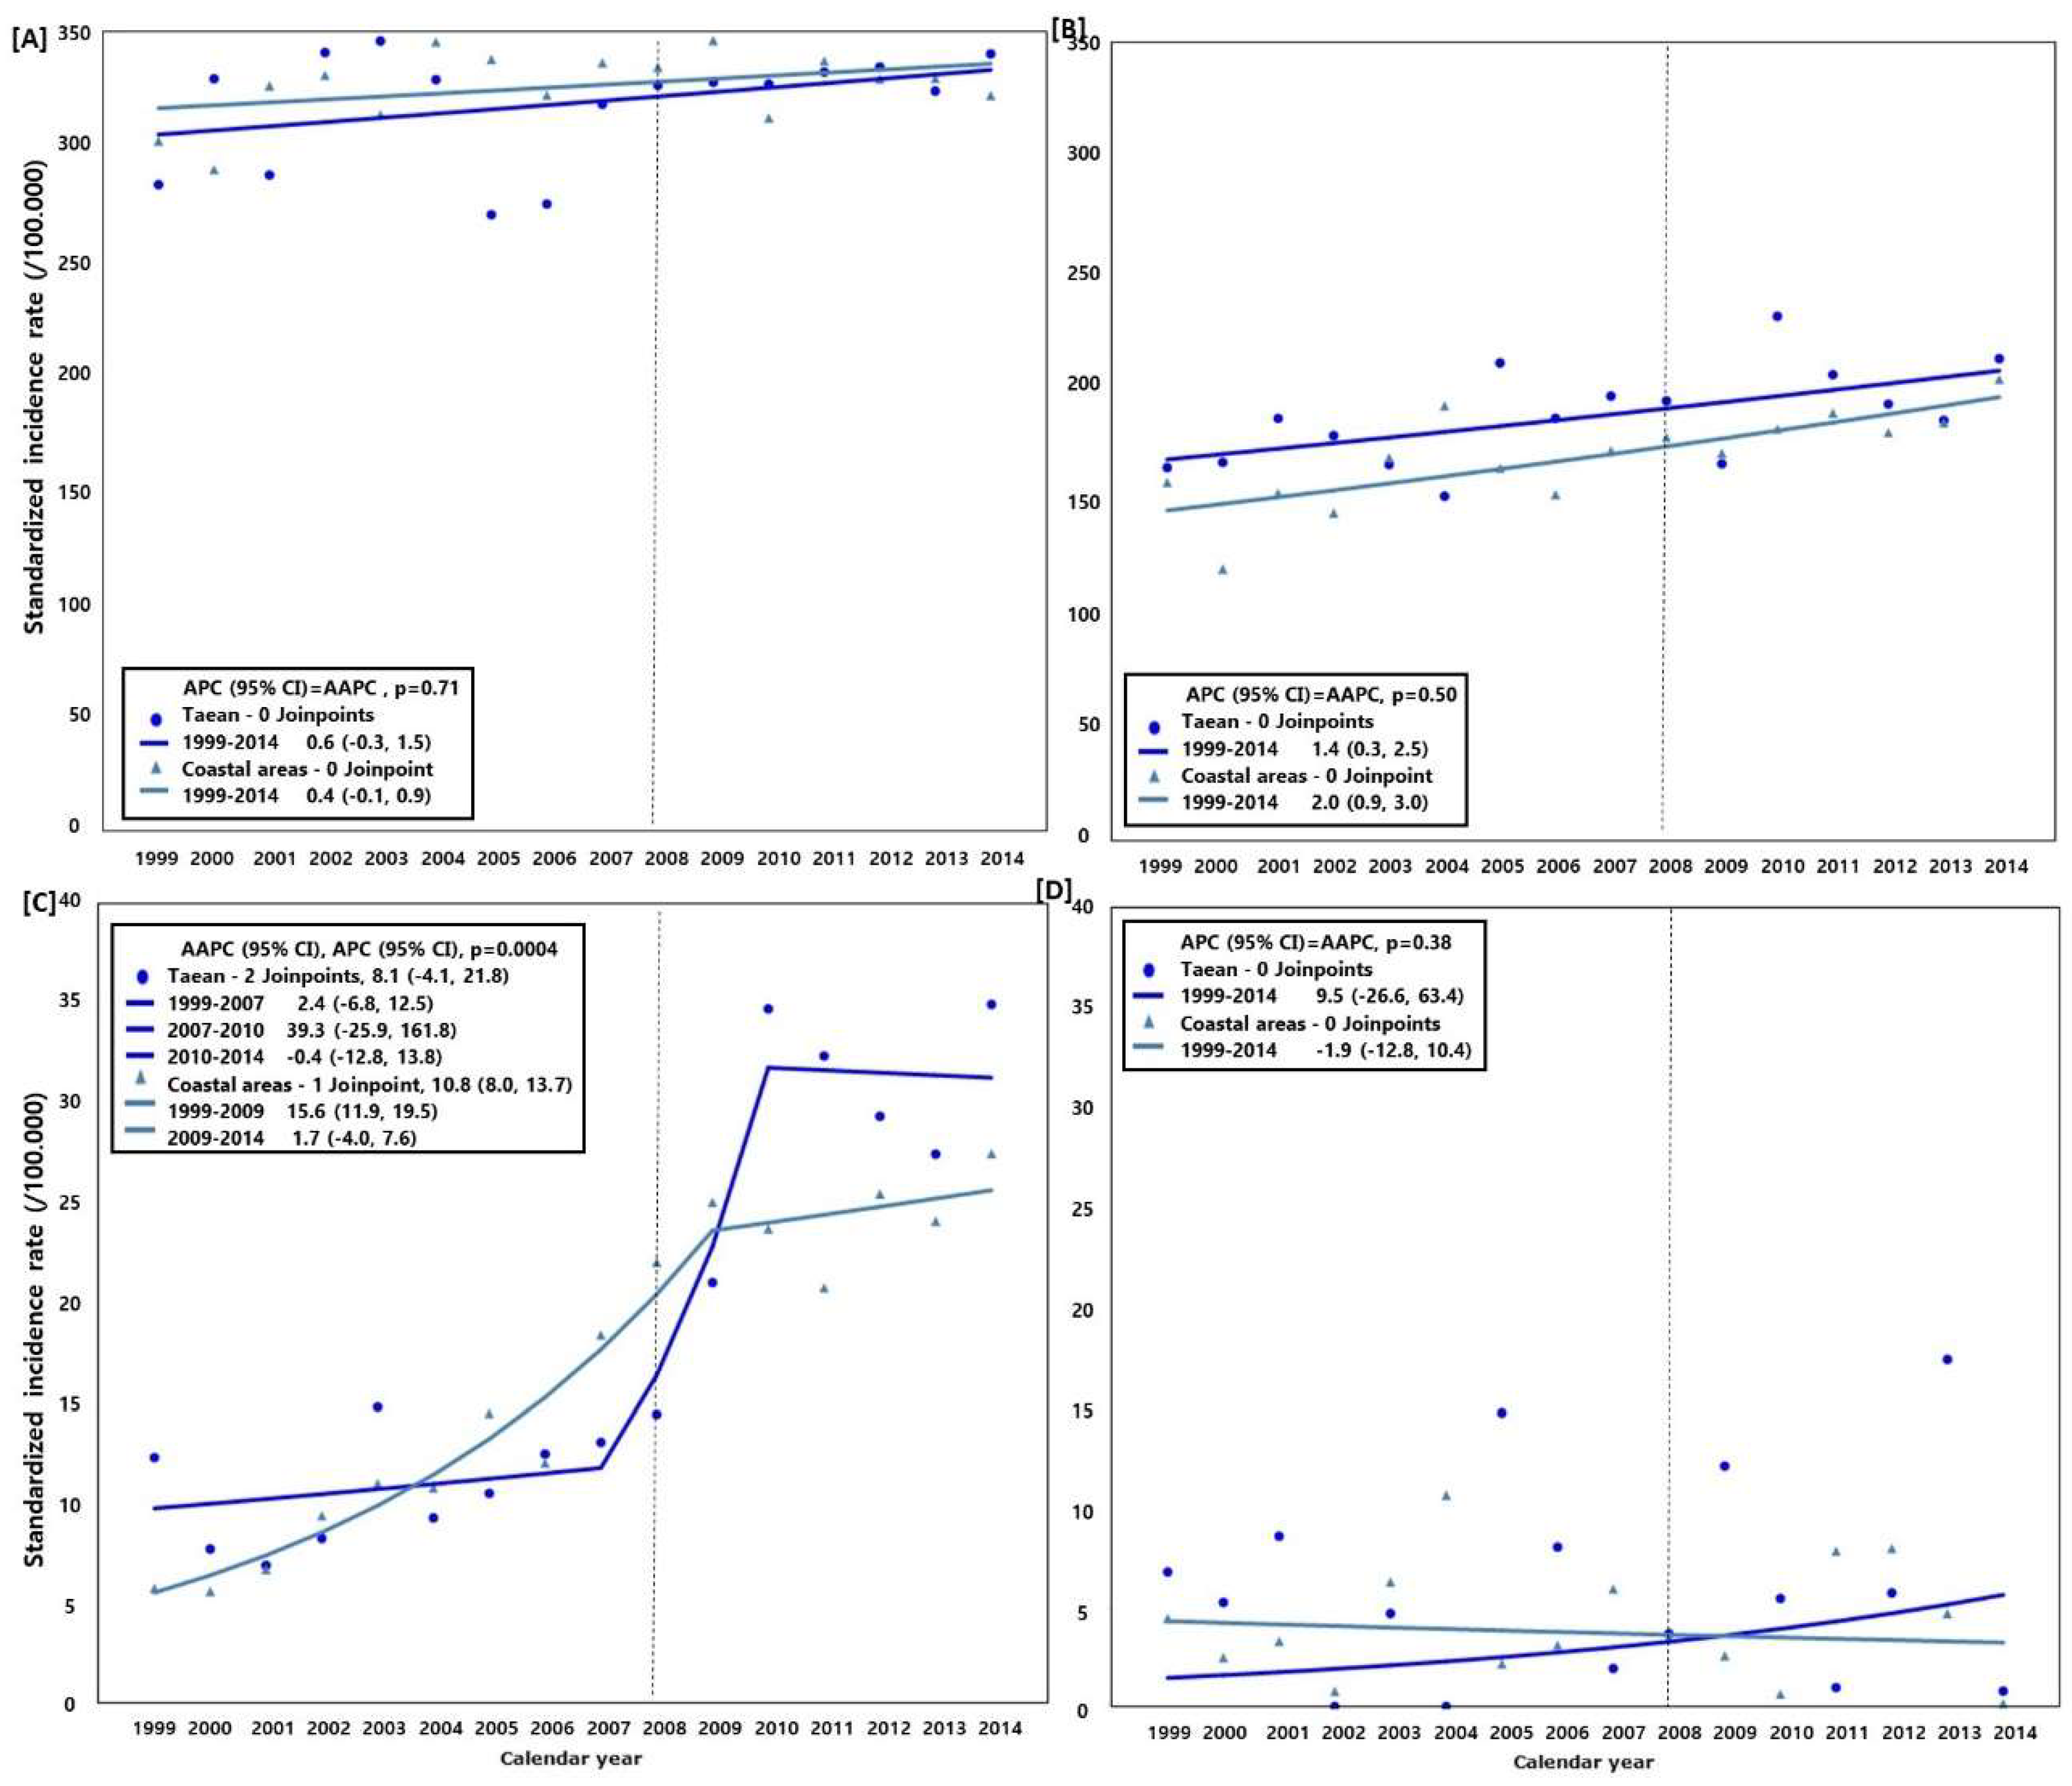
3.3. Trend of Cancer Incidence (Taean vs. the Coastal Areas)
4. Discussion
5. Conclusions
Supplementary Materials
Author Contributions
Acknowledgments
Conflicts of Interest
References
- Fingas, M. Oil Spill Science and Technology; Elsevier: New York, NY, USA, 2017. [Google Scholar]
- Choi, K.H.; Lim, M.H.; Ha, M.; Sohn, J.N.; Kang, J.W.; Choi, Y.H.; Cheong, H.K. Psychological vulnerability of residents of communities affected by the Hebei spirit oil spill. Disaster Med. Public Health Prep. 2015, 1–8. [Google Scholar] [CrossRef] [PubMed]
- Cheong, H.K.; Ha, M.; Lee, J.S.; Kwon, H.; Ha, E.H.; Hong, Y.C.; Choi, Y.; Jeong, W.C.; Hur, J.; Lee, S.M.; et al. Hebei spirit oil spill exposure and subjective symptoms in residents participating in clean-up activities. Environ. Health Toxicol. 2011, 26, e2011007. [Google Scholar] [CrossRef] [PubMed]
- International Agency for Research on Cancer (IARC). IARC Monographs on the Evaluation of Carcinogenic Risks to Humans; IARC: Lyon, France, 2018. [Google Scholar]
- Ha, M.; Kwon, H.; Cheong, H.K.; Lim, S.; Yoo, S.J.; Kim, E.J.; Park, S.G.; Lee, J.; Chung, B.C. Urinary metabolites before and after cleanup and subjective symptoms in volunteer participants in cleanup of the Hebei spirit oil spill. Sci. Total Environ. 2012, 429, 167–173. [Google Scholar] [CrossRef] [PubMed]
- Kim, B.-M.; Park, E.-K.; LeeAn, S.-Y.; Ha, M.-N.; Kim, E.-J.; Kwon, H.-J.; Hong, Y.-C.; Jeong, W.-C.; Hur, J.-I.; Cheong, H.-K.; et al. Btex exposure and its health effects in pregnant women following the Hebei spirit oil spill. J. Prev. Med. Public Health 2009, 42, 96–103. [Google Scholar] [CrossRef] [PubMed]
- Lee, C.-H.; Kang, Y.-A.; Chang, K.-J.; Kim, C.-H.; Hur, J.-I.; Kim, J.-Y.; Lee, J.-K. Acute health effects of the Hebei spirit oil spill on the residents of taean, Korea. J. Prev. Med. Public Health 2010, 43, 166–173. [Google Scholar] [CrossRef] [PubMed]
- Lee, S.-M.; Ha, M.-N.; Kim, E.-J.; Jeong, W.-C.; Hur, J.-I.; Park, S.-G.; Kwon, H.-J.; Hong, Y.-C.; Ha, E.-H.; Lee, J.-S.; et al. The effects of wearing protective devices among residents and volunteers participating in the cleanup of the Hebei spirit oil spill. J. Prev. Med. Public Health 2009, 42, 89–95. [Google Scholar] [CrossRef] [PubMed]
- Lee, I.-J.; Jang, B.-K.; Lee, J.-W.; Son, B.-S.; Cheong, H.-K.; Ha, M.; Choi, Y.-H.; Park, M. Association between metabolic syndrome and participation in clean-up work at the Hebei spirit oil spill. Korean J. Environ. Health Sci. 2015, 41, 335–348. [Google Scholar] [CrossRef]
- Song, M.-K.; Hong, Y.-C.; Cheong, H.-K.; Ha, M.-N.; Kwon, H.-J.; Ha, E.-H.; Choi, Y.; Jeong, W.-C.; Hur, J.; Lee, S.-M.; et al. Psychological health in residents participating in clean-up works of Hebei spirit oil spill. J. Prev. Med. Public Health 2009, 42, 82–88. [Google Scholar] [CrossRef] [PubMed]
- Ha, M.; Jeong, W.-C.; Lim, M.; Kwon, H.; Choi, Y.; Yoo, S.-J.; Noh, S.R.; Cheong, H.-K. Children’s mental health in the area affected by the Hebei spirit oil spill accident. Environ. Health Toxicol. 2013, 28, e2013010. [Google Scholar] [CrossRef] [PubMed]
- Eum, J.-H.; Cheong, H.-K.; Ha, M.; Kwon, H.-J.; Ha, E.-H.; Hong, Y.-C.; Choi, Y.Y.; Jeong, W.C.; Hur, J.-I.; Lee, S.; et al. Hebei spirit oil spill exposure and acute neuropsychiatric effects on residents participating in clean-up work. Epidemiol. Health 2008, 30, 239–251. [Google Scholar] [CrossRef]
- Noh, S.R.; Cheong, H.-K.; Ha, M.; Eom, S.-Y.; Kim, H.; Choi, Y.-H.; Paek, D. Oxidative stress biomarkers in long-term participants in clean-up work after the Hebei spirit oil spill. Sci. Total Environ. 2015, 515–516, 207–214. [Google Scholar] [CrossRef] [PubMed]
- Kim, J.A.; Noh, S.R.; Cheong, H.K.; Ha, M.; Eom, S.Y.; Kim, H.; Park, M.S.; Chu, Y.; Lee, S.H.; Choi, K. Urinary oxidative stress biomarkers among local residents measured 6 years after the Hebei spirit oil spill. Sci. Total Environ. 2017, 580, 946–952. [Google Scholar] [CrossRef] [PubMed]
- Hildur, K.; Templado, C.; Zock, J.P.; Giraldo, J.; Pozo-Rodriguez, F.; Frances, A.; Monyarch, G.; Rodriguez-Trigo, G.; Rodriguez-Rodriguez, E.; Souto, A.; et al. Follow-up genotoxic study: Chromosome damage two and six years after exposure to the prestige oil spill. PLoS ONE 2015, 10, e0132413. [Google Scholar] [CrossRef] [PubMed]
- Frances, A.; Hildur, K.; Barbera, J.A.; Rodriguez-Trigo, G.; Zock, J.P.; Giraldo, J.; Monyarch, G.; Rodriguez-Rodriguez, E.; de Castro Reis, F.; Souto, A.; et al. Persistence of breakage in specific chromosome bands 6 years after acute exposure to oil. PLoS ONE 2016, 11, e0159404. [Google Scholar] [CrossRef] [PubMed]
- Rodriguez-Trigo, G.; Zock, J.P.; Pozo-Rodriguez, F.; Gomez, F.P.; Monyarch, G.; Bouso, L.; Coll, M.D.; Verea, H.; Anto, J.M.; Fuster, C.; et al. Health changes in fishermen 2 years after clean-up of the prestige oil spill. Ann. Intern. Med. 2010, 153, 489–498. [Google Scholar] [CrossRef] [PubMed]
- Wickliffe, J.K.; Simon-Friedt, B.; Howard, J.L.; Frahm, E.; Meyer, B.; Wilson, M.J.; Pangeni, D.; Overton, E.B. Consumption of fish and shrimp from southeast louisiana poses no unacceptable lifetime cancer risks attributable to high-priority polycyclic aromatic hydrocarbons. Risk Anal. 2018. [Google Scholar] [CrossRef] [PubMed]
- Palinkas, L.A.; Petterson, J.S.; Russell, J.C.; Downs, M.A. Ethnic differences in symptoms of post-traumatic stress after the exxon valdez oil spill. Prehosp. Disaster Med. 2004, 19, 102–112. [Google Scholar] [CrossRef] [PubMed]
- Arata, C.M.; Picou, J.S.; Johnson, G.D.; McNally, T.S. Coping with technological disaster: An application of the conservation of resources model to the exxon valdez oil spill. J. Trauma. Stress 2000, 13, 23–39. [Google Scholar] [CrossRef] [PubMed]
- Palinkas, L.A.; Russell, J.; Downs, M.A.; Petterson, J.S. Ethnic differences in stress, coping, and depressive symptoms after the exxon valdez oil spill. J. Nerv. Ment. Dis. 1992, 180, 287–295. [Google Scholar] [CrossRef] [PubMed]
- Buttke, D.; Vagi, S.; Bayleyegn, T.; Sircar, K.; Strine, T.; Morrison, M.; Allen, M.; Wolkin, A. Mental health needs assessment after the gulf coast oil spill-Alabama and Mississippi, 2010. Prehosp. Disaster Med. 2012, 27, 401–408. [Google Scholar] [CrossRef] [PubMed]
- Buttke, D.; Vagi, S.; Schnall, A.; Bayleyegn, T.; Morrison, M.; Allen, M.; Wolkin, A. Community assessment for public health emergency response (casper) one year following the gulf coast oil spill: Alabama and Mississippi, 2011. Prehosp. Disaster Med. 2012, 1–7. [Google Scholar] [CrossRef] [PubMed]
- Buckingham-Howes, S.; Holmes, K.; Glenn Morris, J.; Grattan, L.M. Prolonged financial distress after the deepwater horizon oil spill predicts behavioral health. J. Behav. Health Serv. Res. 2018. [Google Scholar] [CrossRef] [PubMed]
- Rung, A.L.; Oral, E.; Fontham, E.; Harrington, D.J.; Trapido, E.J.; Peters, E.S. The long-term effects of the deepwater horizon oil spill on women’s depression and mental distress. Disaster Med. Public Health Prep. 2018, 1–8. [Google Scholar] [CrossRef] [PubMed]
- Kwok, R.K.; McGrath, J.A.; Lowe, S.R.; Engel, L.S.; Jackson, W.B.N.; Curry, M.D.; Payne, J.; Galea, S.; Sandler, D.P. Mental health indicators associated with oil spill response and clean-up: Cross-sectional analysis of the gulf study cohort. Lancet Public Health 2017, 2, e560–e567. [Google Scholar] [CrossRef]
- Cherry, K.E.; Sampson, L.; Galea, S.; Marks, L.D.; Baudoin, K.H.; Nezat, P.F.; Stanko, K.E. Health-related quality of life in older coastal residents after multiple disasters. Disaster Med. Public Health Prep. 2017, 11, 90–96. [Google Scholar] [CrossRef] [PubMed]
- Rung, A.L.; Gaston, S.; Oral, E.; Robinson, W.T.; Fontham, E.; Harrington, D.J.; Trapido, E.; Peters, E.S. Depression, mental distress, and domestic conflict among louisiana women exposed to the deepwater horizon oil spill in the watch study. Environ. Health Perspect. 2016, 124, 1429–1435. [Google Scholar] [CrossRef] [PubMed]
- Schulenberg, S.E.; Smith, C.V.; Drescher, C.F.; Buchanan, E.M. Assessment of meaning in adolescents receiving clinical services in Mississippi following the deepwater horizon oil spill: An application of the purpose in life test-short form (PIL-SF). J. Clin. Psychol. 2016, 72, 1279–1286. [Google Scholar] [CrossRef] [PubMed]
- Gam, K.B.; Kwok, R.K.; Engel, L.S.; Curry, M.D.; Stewart, P.A.; Stenzel, M.R.; McGrath, J.A.; Jackson, W.B., 2nd; Jensen, R.L.; Keil, A.P.; et al. Lung function in oil spill response workers 1–3 years after the deepwater horizon disaster. Epidemiology 2018. [Google Scholar] [CrossRef] [PubMed]
- Gam, K.B.; Kwok, R.K.; Engel, L.S.; Curry, M.D.; Stewart, P.A.; Stenzel, M.R.; McGrath, J.A.; Jackson, W.B., 2nd; Jensen, R.L.; Lichtveld, M.Y.; et al. Exposure to oil spill chemicals and lung function in deepwater horizon disaster response workers. J. Occup. Environ. Med. 2018. [Google Scholar] [CrossRef] [PubMed]
- Alexander, M.; Engel, L.S.; Olaiya, N.; Wang, L.; Barrett, J.; Weems, L.; Schwartz, E.G.; Rusiecki, J.A. The deepwater horizon oil spill coast guard cohort study: A cross-sectional study of acute respiratory health symptoms. Environ. Res. 2018, 162, 196–202. [Google Scholar] [CrossRef] [PubMed]
- McGowan, C.J.; Kwok, R.K.; Engel, L.S.; Stenzel, M.R.; Stewart, P.A.; Sandler, D.P. Respiratory, dermal, and eye irritation symptoms associated with corexit EC9527A/EC9500A following the deepwater horizon oil spill: Findings from the gulf study. Environ. Health Perspect. 2017, 125, 097015. [Google Scholar] [CrossRef] [PubMed]
- Kim, Y.M.; Park, J.H.; Choi, K.; Noh, S.R.; Choi, Y.H.; Cheong, H.K. Burden of disease attributable to the Hebei spirit oil spill in taean, Korea. BMJ Open 2013, 3, e003334. [Google Scholar] [CrossRef] [PubMed][Green Version]
- Google Maps. Google Maps. 2018. Available online: https://www.google.com/maps (accessed on 2 February 2018).
- Kahle, D.; Wickham, H. Ggmap: Spatial visualization with ggplot2. R J. 2013, 5, 144–162. [Google Scholar]
- Kim, S.-Y.; Jeong, D.-M.; Kim, K.-M. Classification Method Reflecting Various Characteristics of Rural Areas; Statistics Korea: Daejeon, Korea, 2008.
- Korean National Cancer Center. Cancer Facts and Figures 2015; Minister for Health and Welfare; President of National Cancer Center: Goyang, Korea, 2015.
- Korean National Cancer Center. Organization of National Cancer Control Institute. Available online: http://www.ncc.re.kr/main.ncc?uri=english/sub04_Organization (accessed on 13 February 2018).
- Korean Statistical Information Service (KOSIS). Statistical Datatbase; Statistics Korea: Daejeon, Korea. Available online: http://kosis.kr/eng/statisticsList/statisticsList_01List.jsp?vwcd=MT_ETITLE&parmTabId=M_01_01 (accessed on 11 July 2017).
- Boyle, P.; Parkin, D.M. Statistical methods for registries. In Cancer Registration: Principles and Methods; International Agency for Research on Cancer: Lyon, France, 1991. [Google Scholar]
- Kim, H.J.; Fay, M.P.; Feuer, E.J.; Midthune, D.N. Permutation tests for joinpoint regression with applications to cancer rates. Stat. Med. 2000, 19, 335–351. [Google Scholar] [CrossRef]
- Statistical Research and Application Branch, National Cancer Institute. Joinpoint Regression Program, Version 4.5.0.1; Statistical Research and Application Branch, National Cancer Institute: Bethesda, MD, USA, 2017.
- Korean Western Power Co., L. History of Taean Power Plant. Available online: https://www.iwest.co.kr/bsn/sub.asp?mid=1326 (accessed on 20 February 2018).
- Jung, K.-W.; Won, Y.-J.; Kong, H.-J.; Lee, E.S. Cancer statistics in Korea: Incidence, mortality, survival, and prevalence in 2015. Cancer Res. Treat. 2018, 50, 303–316. [Google Scholar] [CrossRef] [PubMed]
- Korea Central Cancer Registry, N.C.C.; National Health and Welfare. The First Announcement of Cancer occurrence Statistics and Occurrence Map by City and District in Korea; Korea Central Cancer Registry: Sejong, Korea, 2016. [Google Scholar]
- Merletti, F.; Galassi, C.; Spadea, T. The socioeconomic determinants of cancer. Environ. Health Glob. Access Sci. Source 2011, 10 (Suppl. 1), S7. [Google Scholar] [CrossRef] [PubMed]
- Sritharan, J.; Pahwa, M.; Demers, P.A.; Harris, S.A.; Cole, D.C.; Parent, M.E. Prostate cancer in firefighting and police work: A systematic review and meta-analysis of epidemiologic studies. Environ. Health Glob. Access Sci. Source 2017, 16, 124. [Google Scholar] [CrossRef] [PubMed]
- Jeon, Y.-J.; Jang, B.-K.; Lee, I.-J.; Lee, J.-W.; Son, B.-S.; Cheong, H.-K.; Ha, M.; Choi, Y.-H.; Park, M.; Lee, S.-H.; et al. Impact of allergic diseases in elementary school students by the Hebei spirit oil spill. Korean Public Health Res. 2016, 42, 57–68. [Google Scholar]
- Ministry of Health and Welfare. The Trend of Medical Staff and Facillity in 2007–2016; Ministry of Health and Welfare: Sejong, Korea, 2017.
- Dorak, M.T.; Karpuzoglu, E. Gender differences in cancer susceptibility: An inadequately addressed issue. Front. Genet. 2012, 3, 268. [Google Scholar] [CrossRef] [PubMed]
- Nadler, D.L.; Zurbenko, I.G. Estimating cancer latency times using a weibull model. Adv. Epidemiol. 2014, 2014. [Google Scholar] [CrossRef]
- McKenzie, L.M.; Allshouse, W.B.; Byers, T.E.; Bedrick, E.J.; Serdar, B.; Adgate, J.L. Childhood hematologic cancer and residential proximity to oil and gas development. PLoS ONE 2017, 12, e0170423. [Google Scholar] [CrossRef] [PubMed]
- Polychronakis, I.; Dounias, G.; Makropoulos, V.; Riza, E.; Linos, A. Work-related leukemia: A systematic review. J. Occup. Med. Toxicol. 2013, 8, 14. [Google Scholar] [CrossRef] [PubMed]
- Kim, Y.M.; Cheong, H.-K.; Kim, J.H.; Kim, J.H.; Ko, K.; Ha, M. Scientific basis of environmental health contingency planning for a coastal oil spill. J. Prev. Med. Public Health 2009, 42, 73–81. [Google Scholar] [CrossRef] [PubMed]
- Song, H.N.; Go, S.I.; Lee, W.S.; Kim, Y.; Choi, H.J.; Lee, U.S.; Kang, M.H.; Lee, G.W.; Kim, H.G.; Kang, J.H.; et al. Population-based regional cancer incidence in Korea: Comparison between urban and rural areas. Cancer Res. Treat. 2016, 48, 789–797. [Google Scholar] [CrossRef] [PubMed]
- Chung, J.H. Unfounded reports on thyroid cancer. J. Korean Med. Sci. 2014, 29, 1033–1034. [Google Scholar] [CrossRef] [PubMed]
- Pishgar, F.; Ebrahimi, H.; Saeedi Moghaddam, S.; Fitzmaurice, C.; Amini, E. Global, regional and national burden of prostate cancer, 1990 to 2015: Results from the global burden of disease study 2015. J. Urol. 2018, 199, 1224–1232. [Google Scholar] [CrossRef] [PubMed]


| Cancer Type | Taean | |||||||||||
|---|---|---|---|---|---|---|---|---|---|---|---|---|
| All | High Exposed Area | Low Exposed Area | ||||||||||
| Case 1 | SIR 2 | IRR1 3 (95% CI) | IRR2 4 (95% CI) | Case 1 | SIR 2 | IRR1 3 (95% CI) | IRR2 4 (95% CI) | Case 1 | SIR 2 | IRR1 3 (95% CI) | IRR2 4 (95% CI) | |
| Male | ||||||||||||
| All cancer (C00−C96) | ||||||||||||
| 1999−2003 | 753 | 318.0 | 1.1 (1.0, 1.2) | 1.0 (0.9, 1.1) | 284 | 309.7 | 1.1 (0.9, 1.2) | 1.0 (0.9, 1.1) | 420 | 288.8 | 1.0 (0.9, 1.1) | 0.9 (0.8, 1.0) |
| 2004−2008 | 872 | 314.6 | 1.0 (0.9, 1.1) | 0.9 (0.8, 1.0) | 323 | 309.2 | 1.0 (0.9, 1.1) | 0.9 (0.8, 1.0) | 547 | 315.2 | 1.0 (0.9, 1.1) | 0.9 (0.8, 1.0) |
| 2009−2014 | 1430 | 350.0 | 1.1 (1.0, 1.1) | 1.0 (0.9, 1.1) | 557 | 370.8 | 1.1 (1.0, 1.2) | 1.1 (1.0, 1.2) | 873 | 340.5 | 1.0 (1.0, 1.1) | 1.0 (0.9, 1.1) |
| All cancer (C00−C96) excluding thyroid (C73) | ||||||||||||
| 1999−2003 | 748 | 315.6 | 1.1 (1.0, 1.2) | 1.0 (0.9, 1.1) | 283 | 309.7 | 1.1 (0.9, 1.2) | 1.0 (0.9, 1.1) | 416 | 288.8 | 1.0 (0.9, 1.1) | 0.9 (0.8, 1.0) |
| 2004−2008 | 845 | 302.5 | 1.0 (0.9, 1.1) | 0.9 (0.8, 1.0) | 315 | 309.2 | 1.0 (0.9, 1.1) | 0.9 (0.8, 1.0) | 528 | 315.2 | 1.0 (0.9, 1.1) | 0.9 (0.8, 1.0) |
| 2009−2014 | 1369 | 325.3 | 1.1 (1.0, 1.1) | 1.0 (0.9, 1.1) | 531 | 370.8 | 1.1 (1.0, 1.2) | 1.0 (0.9, 1.1) | 838 | 340.5 | 1.0 (1.0, 1.1) | 1.0 (0.9, 1.1) |
| Stomach (C16) | ||||||||||||
| 1999−2003 | 207 | 89.6 | 1.3 (1.1, 1.6) | 1.2 (1.0, 1.4) | 69 | 81.4 | 1.2 (0.9, 1.6) | 1.1 (0.8, 1.4) | 123 | 85.2 | 1.3 (1.0, 1.5) | 1.1 (0.9, 1.4) |
| 2004−2008 | 183 | 63.9 | 1.0 (0.8, 1.1) | 0.9 (0.7, 1.0) | 69 | 60.2 | 0.9 (0.7, 1.2) | 0.8 (0.6, 1.1) | 114 | 64.1 | 1.0 (0.8, 1.2) | 0.9 (0.7, 1.1) |
| 2009−2014 | 277 | 67.1 | 1.1 (1.0, 1.3) | 1.1 (0.9, 1.2) | 101 | 64.4 | 1.1 (0.8, 1.3) | 1.0 (0.8, 1.3) | 176 | 67.5 | 1.1 (0.9, 1.3) | 1.1 (0.9, 1.3) |
| Lung (C33−C34) | ||||||||||||
| 1999−2003 | 128 | 51.2 | 1.0 (0.8, 1.2) | 0.9 (0.7, 1.0) | 58 | 55.1 | 1.1 (0.8, 1.4) | 0.9 (0.7, 1.2) | 60 | 40.3 | 0.8 (0.6, 1.0) | 0.7 (0.5, 0.9) |
| 2004−2008 | 173 | 58.0 | 1.2 (1.0, 1.4) | 1.0 (0.8, 1.2) | 58 | 53.3 | 1.1 (0.8, 1.5) | 0.9 (0.7, 1.2) | 115 | 62.8 | 1.3 (1.0, 1.6) | 1.1 (0.9, 1.3) |
| 2009−2014 | 257 | 53.2 | 1.2 (1.0, 1.3) | 1.0 (0.9, 1.2) | 102 | 56.3 | 1.2 (1.0, 1.6) | 1.1 (0.9, 1.4) | 155 | 53.1 | 1.2 (1.0, 1.4) | 1.0 (0.9, 1.2) |
| Colon (C18−C20) | ||||||||||||
| 1999−2003 | 55 | 22.7 | 0.7 (0.6, 0.9) | 0.9 (0.6, 1.1) | 22 | 21.3 | 0.7 (0.5, 1.0) | 0.8 (0.5, 1.2) | 32 | 21.7 | 0.7 (0.5, 0.9) | 0.8 (0.6, 1.2) |
| 2004−2008 | 102 | 37.8 | 0.9 (0.7, 1.0) | 1.1 (0.8, 1.3) | 37 | 34.8 | 0.8 (0.6, 1.1) | 1.0 (0.7, 1.4) | 65 | 38.2 | 0.9 (0.7, 1.1) | 1.1 (0.8, 1.4) |
| 2009−2014 | 197 | 48.7 | 1.0 (0.9, 1.2) | 1.0 (0.9, 1.3) | 69 | 50.2 | 1.0 (0.8, 1.4) | 1.1 (0.8, 1.5) | 128 | 49.0 | 1.0 (0.8, 1.2) | 1.1 (0.9, 1.3) |
| Liver (C22) | ||||||||||||
| 1999−2003 | 109 | 47.8 | 1.0 (0.9, 1.3) | 0.9 (0.7, 1.1) | 37 | 42.3 | 0.9 (0.7, 1.3) | 0.8 (0.6, 1.1) | 57 | 39.9 | 0.9 (0.7, 1.1) | 0.8 (0.6, 1.0) |
| 2004−2008 | 114 | 43.6 | 1.0 (0.9, 1.3) | 0.8 (0.7, 1.0) | 40 | 43.0 | 1.0 (0.7, 1.5) | 0.8 (0.6, 1.1) | 74 | 43.8 | 1.0 (0.8, 1.3) | 0.8 (0.7, 1.1) |
| 2009−2014 | 147 | 36.9 | 1.0 (0.9, 1.2) | 0.8 (0.7, 1.0) | 58 | 41.2 | 1.2 (0.8, 1.6) | 0.9 (0.7, 1.2) | 89 | 34.9 | 1.0 (0.8, 1.2) | 0.8 (0.6, 0.9) |
| Prostate (C61) | ||||||||||||
| 1999−2003 | 27 | 10.2 | 1.1 (0.7, 1.6) | 1.3 (0.8, 2.1) | 15 | 13.8 | 1.5 (0.8, 2.7) | 1.8 (0.9, 3.6) | 12 | 7.9 | 0.8 (0.5, 1.4) | 1.0 (0.5, 1.9) |
| 2004−2008 | 36 | 12.2 | 0.7 (0.5, 0.9) | 0.8 (0.6, 1.1) | 14 | 12.3 | 0.7 (0.4, 1.0) | 0.8 (0.5, 1.3) | 22 | 11.8 | 0.6 (0.5, 0.9) | 0.8 (0.5, 1.1) |
| 2009−2014 | 143 | 30.3 | 1.2 (1.0, 1.4) | 1.2 (1.0, 1.5) | 62 | 33.9 | 1.3 (1.0, 1.8) | 1.4 (1.0, 1.9) | 81 | 28.3 | 1.1 (0.9, 1.4) | 1.2 (0.9, 1.5) |
| Leukemia (C91−C95) | ||||||||||||
| 1999−2003 | 14 | 6.6 | 1.3 (0.7, 2.3) | 1.1 (0.6, 2.2) | 5 | 6.6 | 1.3 (0.4, 3.8) | 1.1 (0.4, 3.5) | 9 | 6.6 | 1.2 (0.6, 2.6) | 1.1 (0.5, 2.5) |
| 2004−2008 | 16 | 8.9 | 1.6 (0.8, 3.3) | 1.3 (0.6, 2.5) | 7 | 10.6 | 1.9 (0.5, 7.7) | 1.5 (0.4, 5.2) | 8 | 6.8 | 1.2 (0.6, 2.8) | 1.0 (0.4, 2.1) |
| 2009−2014 | 14 | 4.7 | 0.8 (0.4, 1.5) | 1.0 (0.5, 2.0) | 4 | 2.2 | 0.4 (0.2, 0.7) | 0.5 (0.2, 1.1) | 10 | 5.6 | 1.0 (0.5, 2.0) | 1.1 (0.5, 2.7) |
| Female | ||||||||||||
| All cancer (C00−C96) | ||||||||||||
| 1999−2003 | 474 | 192.8 | 1.0 (0.9, 1.2) | 1.1 (1.0, 1.3) | 159 | 169.1 | 0.9 (0.8, 1.1) | 1.0 (0.8, 1.2) | 288 | 184.8 | 1.0 (0.9, 1.2) | 1.1 (1.0, 1.3) |
| 2004−2008 | 679 | 264.4 | 1.1 (1.0, 1.2) | 1.1 (1.0, 1.3) | 233 | 251.2 | 1.1 (0.9, 1.3) | 1.1 (0.9, 1.3) | 446 | 266.9 | 1.1 (1.0, 1.2) | 1.2 (1.0, 1.3) |
| 2009−2014 | 905 | 325.6 | 1.0 (1.0, 1.1) | 1.1 (1.0, 1.2) | 358 | 295.6 | 1.0 (0.8, 1.1) | 1.0 (0.8, 1.2) | 738 | 327.0 | 1.1 (1.0, 1.2) | 1.1 (1.0, 1.2) |
| All cancer (C00−C96) excluding thyroid (C73) | ||||||||||||
| 1999−2003 | 434 | 170.0 | 1.0 (0.9, 1.2) | 1.2 (1.0, 1.3) | 148 | 155.7 | 0.9 (0.8, 1.2) | 1.1 (0.9, 1.3) | 259 | 162.0 | 1.0 (0.9, 1.1) | 1.1 (1.0, 1.3) |
| 2004−2008 | 527 | 185.4 | 1.0 (0.9, 1.1) | 1.1 (1.0, 1.2) | 188 | 184.6 | 1.0 (0.8, 1.2) | 1.1 (0.9, 1.3) | 338 | 186.7 | 1.0 (0.9, 1.1) | 1.1 (0.9, 1.3) |
| 2009−2014 | 805 | 198.3 | 1.0 (0.9, 1.1) | 1.1 (1.0, 1.2) | 270 | 188.2 | 0.9 (0.8, 1.2) | 1.0 (0.8, 1.3) | 535 | 204.8 | 1.0 (0.9, 1.1) | 1.1 (1.0, 1.3) |
| Thyroid (C73) | ||||||||||||
| 1999−2003 | 40 | 20.2 | 1.2 (0.8, 1.7) | 1.0 (0.7, 1.5) | 11 | 13.3 | 0.8 (0.4, 1.4) | 0.7 (0.4, 1.2) | 29 | 22.7 | 1.4 (0.9, 2.1) | 1.1 (0.7, 1.8) |
| 2004−2008 | 153 | 76.7 | 1.4 (1.1, 1.7) | 1.3 (1.1, 1.7) | 45 | 66.6 | 1.2 (0.8, 1.8) | 1.2 (0.8, 1.8) | 108 | 80.2 | 1.5 (1.1, 1.9) | 1.4 (1.1, 1.8) |
| 2009−2014 | 291 | 119.3 | 1.1 (1.0, 1.3) | 1.1 (0.9, 1.2) | 88 | 107.4 | 1.0 (0.8, 1.4) | 1.0 (0.7, 1.3) | 203 | 122.2 | 1.2 (1.0, 1.4) | 1.1 (0.9, 1.3) |
| Breast (C50) | ||||||||||||
| 1999−2003 | 57 | 31.9 | 1.1 (0.8, 1.5) | 1.8 (1.2, 2.6) | 17 | 28.1 | 1.0 (0.6, 1.7) | 1.5 (0.8, 3.1) | 40 | 33.4 | 1.2 (0.8, 1.7) | 1.8 (1.2, 2.9) |
| 2004−2008 | 75 | 39.3 | 1.0 (0.8, 1.3) | 1.4 (1.0, 1.9) | 25 | 42.1 | 1.1 (0.6, 1.9) | 1.4 (0.8, 2.8) | 50 | 38.7 | 1.0 (0.7, 1.3) | 1.3 (0.9, 1.9) |
| 2009−2014 | 118 | 46.4 | 0.9 (0.8, 1.1) | 1.4 (1.0, 1.8) | 35 | 39.5 | 0.8 (0.5, 1.2) | 1.2 (0.7, 1.9) | 83 | 47.6 | 1.0 (0.8, 1.2) | 1.4 (1.0, 1.9) |
| Colon (C18−C20) | ||||||||||||
| 1999−2003 | 60 | 20.9 | 1.1 (0.8, 1.5) | 1.3 (0.9, 1.9) | 16 | 11.8 | 0.6 (0.4, 1.0) | 0.7 (0.4, 1.2) | 42 | 24.5 | 1.3 (0.9, 1.9) | 1.5 (1.0, 2.3) |
| 2004−2008 | 66 | 21.0 | 0.9 (0.7, 1.1) | 0.9 (0.6, 1.2) | 22 | 19.9 | 0.8 (0.5, 1.4) | 0.8 (0.5, 1.4) | 44 | 21.8 | 0.9 (0.7, 1.2) | 0.9 (0.6, 1.3) |
| 2009−2014 | 130 | 23.0 | 0.9 (0.7, 1.0) | 0.9 (0.7, 1.2) | 39 | 17.9 | 0.7 (0.5, 0.9) | 0.7 (0.5, 1.0) | 91 | 25.7 | 1.0 (0.8, 1.2) | 1.0 (0.8, 1.4) |
| Stomach (C16) | ||||||||||||
| 1999−2003 | 82 | 29.1 | 1.1 (0.8, 1.4) | 1.1 (0.8, 1.4) | 28 | 29.4 | 1.1 (0.6, 1.8) | 1.1 (0.6, 1.9) | 49 | 27.3 | 1.0 (0.7, 1.3) | 1.0 (0.7, 1.4) |
| 2004−2008 | 96 | 31.3 | 1.2 (0.9, 1.5) | 1.1 (0.8, 1.5) | 32 | 25.3 | 0.9 (0.6, 1.6) | 0.9 (0.5, 1.5) | 64 | 34.0 | 1.3 (0.9, 1.7) | 1.2 (0.9, 1.7) |
| 2009−2014 | 139 | 31.6 | 1.2 (1.0, 1.6) | 1.1 (0.9, 1.5) | 46 | 26.8 | 1.1 (0.6, 1.7) | 1.0 (0.6, 1.6) | 93 | 33.4 | 1.3 (1.0, 1.8) | 1.2 (0.9, 1.6) |
| Lung (C33−C34) | ||||||||||||
| 1999−2003 | 46 | 14.5 | 1.2 (0.8, 1.6) | 1.1 (0.8, 1.7) | 19 | 11.8 | 0.9 (0.6, 1.5) | 0.9 (0.6, 1.5) | 22 | 12.7 | 1.0 (0.6, 1.6) | 1.0 (0.6, 1.6) |
| 2004−2008 | 60 | 15.4 | 1.1 (0.8, 1.5) | 1.4 (1.0, 2.1) | 18 | 11.9 | 0.9 (0.5, 1.4) | 1.1 (0.6, 2.0) | 42 | 18.0 | 1.3 (0.9, 1.9) | 1.7 (1.1, 2.6) |
| 2009−2014 | 90 | 15.3 | 1.0 (0.8, 1.3) | 1.2 (0.8, 1.6) | 37 | 19.8 | 1.3 (0.7, 2.6) | 1.5 (0.7, 3.1) | 53 | 14.3 | 1.0 (0.7, 1.3) | 1.1 (0.8, 1.5) |
| Leukemia (C91−C95) | ||||||||||||
| 1999−2003 | 11 | 5.1 | 1.3 (0.6, 2.8) | 1.5 (0.6, 3.7) | 2 | 1.4 | 0.4 (0.2, 0.8) | 0.4 (0.1, 1.2) | 7 | 5.0 | 1.3 (0.5, 3.2) | 1.5 (0.5, 4.2) |
| 2004−2008 | 13 | 5.7 | 1.4 (0.6, 3.1) | 1.1 (0.5, 2.5) | 6 | 10.8 | 2.7 (0.5, 15.2) | 2.1 (0.4, 10.3) | 7 | 3.9 | 1.0 (0.4, 2.2) | 0.8 (0.3, 1.9) |
| 2009−2014 | 13 | 7.3 | 1.8 (0.7, 4.5) | 1.9 (0.7, 5.0) | 6 | 20.8 | 5.1 (0.7, 36.3) | 5.3 (0.7, 39.1) | 7 | 4.2 | 1.0 (0.4, 2.8) | 1.1 (0.3, 3.3) |
© 2018 by the authors. Licensee MDPI, Basel, Switzerland. This article is an open access article distributed under the terms and conditions of the Creative Commons Attribution (CC BY) license (http://creativecommons.org/licenses/by/4.0/).
Share and Cite
Choi, K.-H.; Park, M.-S.; Ha, M.; Hur, J.-I.; Cheong, H.-K. Cancer Incidence Trend in the Hebei Spirit Oil Spill Area, from 1999 to 2014: An Ecological Study. Int. J. Environ. Res. Public Health 2018, 15, 1006. https://doi.org/10.3390/ijerph15051006
Choi K-H, Park M-S, Ha M, Hur J-I, Cheong H-K. Cancer Incidence Trend in the Hebei Spirit Oil Spill Area, from 1999 to 2014: An Ecological Study. International Journal of Environmental Research and Public Health. 2018; 15(5):1006. https://doi.org/10.3390/ijerph15051006
Chicago/Turabian StyleChoi, Kyung-Hwa, Myung-Sook Park, Mina Ha, Jong-Il Hur, and Hae-Kwan Cheong. 2018. "Cancer Incidence Trend in the Hebei Spirit Oil Spill Area, from 1999 to 2014: An Ecological Study" International Journal of Environmental Research and Public Health 15, no. 5: 1006. https://doi.org/10.3390/ijerph15051006
APA StyleChoi, K.-H., Park, M.-S., Ha, M., Hur, J.-I., & Cheong, H.-K. (2018). Cancer Incidence Trend in the Hebei Spirit Oil Spill Area, from 1999 to 2014: An Ecological Study. International Journal of Environmental Research and Public Health, 15(5), 1006. https://doi.org/10.3390/ijerph15051006