Article

Lagged Influence of Fine Particulate Matter and Geographic Disparities on Clinic Visits for Children’s Asthma in Taiwan

1
Epidemiology and Biostatistics, Department of Environmental and Occupational Health, University of Nevada, Las Vegas, NV 89154, USA
2
Department of Bioenvironmental Systems Engineering, National Taiwan University, Taipei 10617, Taiwan
*
Author to whom correspondence should be addressed.
Int. J. Environ. Res. Public Health 2018, 15(4), 829; https://doi.org/10.3390/ijerph15040829
Submission received: 7 March 2018 / Revised: 19 April 2018 / Accepted: 19 April 2018 / Published: 23 April 2018

Abstract

:
Recent studies have revealed the influence of fine particulate matter (PM2.5) on increased medication use, hospital admission, and emergency room visits for asthma attack in children, but the lagged influence of PM2.5 on children’s asthma and geographic disparities of children’s asthma have rarely been discussed simultaneously. This study investigated the documented diagnosis of children’s asthma in clinic visits for children aged less than 15 years old that were associated with PM2.5 in two counties located in west-central Taiwan during 2005–2010. The result shows that PM2.5 had a significant lagged effect on children’s asthma for up to 6 days. A significantly higher relative risk for children’s asthma was more likely to happen at 2-day lag compared to the present day when PM2.5 increased from 36.17 μg/m3 to 81.26 μg/m3. Considering all lagged effects, the highest relative risk for children’s asthma was 1.08 (95% CI = 1.05, 1.11) as PM2.5 increased as high as 64.66 μg/m3. In addition, geographic disparities of children’s asthma were significant, and 47.83% of areas were identified to have children vulnerable to asthma. To sum up, our findings can serve as a valuable reference for the implementation of an early warning to governmental agencies about a susceptible population of children.

1. Introduction

Asthma is a common chronic disease in childhood and has become an increasing problem in the last few decades because numerous studies have revealed an increasing trend of asthma prevalence in both developed and developing countries [1,2,3,4,5,6,7,8]. In Taiwan, children’s asthma is a major health issue, and evidence has shown that the prevalence of children’s asthma has also increased dramatically over the last 40 years [9,10]. The overall 8-year prevalence of asthma in children was 15.7% according to a national survey from 2000 to 2007 [11]. Although the factors behind the changing pattern remain unclear, many personal and environmental factors have contributed to asthma risk, such as tobacco smoke, chemical fumes, weather conditions, and air pollution [12,13,14,15,16]. In addition, many industrial factories in Taiwan, especially in west-central Taiwan, play an important role in the process of economic development, but they contribute to various kinds of pollutants to the ambient air, which may trigger the increase of asthma risk [17].
Of the environmental factors, air pollution is one of the widespread environmental threats to human health. In particular, the issue of the association between air pollutants and asthma has been extensively discussed. The literature has proven that air pollution is a significant factor of asthma exacerbations, especially in susceptible populations who may be at risk for exacerbation of asthma from the toxic effects of airborne particulate matter (PM) [18,19,20,21]. Potential pathways for pulmonary effects propose that air pollutants can bypass the body’s natural defenses and provoke an inflammatory response in the lungs, especially from fine particulate matter (PM2.5, particulate matter with an aerodynamic diameter ≤2.5 μm) [22].
Several studies have revealed the influence of PM2.5 on increased medication use, hospital admission, and emergency room visits for asthma attack in children [23,24,25,26,27,28]; however, some studies found nonsignificant impacts of PM2.5 on asthma hospitalization [29,30]. Current studies have no clear explanations for the conflict in this regard [29,30]. The reasons may include variability in population characteristics and geographic variation. Some researchers have pointed out the space-time variation of PM composition and concentrations [31], which could partially explain the spatial differences in the health effects for mortality and morbidity [32]. The same levels of PM2.5 may still have different chemical compositions, which result in various adverse health effects. Epidemiological studies have demonstrated a strong spatial variation in the chemical component of PM that causes geographic disparities in human health [14,32,33,34,35].
The time-series studies in PM2.5 have found out the temporal pattern of associations between daily counts of health end-points and daily concentration on the current and a few preceding days [34,36,37]. Such lagged effects caused by PM2.5 have been observed in asthma and other respiratory symptoms, such as cough and wheeze, while the results are different from 3 to 4 days [38,39] or 2–6 days [40,41,42]. One possible reason for the different lags affected by PM2.5 is because different lagged effects may provide insight into different biologic mechanisms of reaction to PM2.5 [43]. Moreover, earlier research applied linear modeling approaches to assess the lagged effect between ambient air pollution and health effects [41,44,45]. However, the choice in the number of lags was not objective in different models, and the linear relationship between a health outcome and a lag is also doubtful. Recently, more studies have applied nonlinear models and reached more solid findings [14,46,47,48].
In this study, we hypothesized that the health impact of PM2.5 on asthma has a nonlinear lagged influence and that the district level of PM2.5 concentration might have different effects on asthma incidence. Thus, we adopted a spatiotemporal model for investigating the nonlinear relationship between PM2.5 concentrations and children’s asthma clinic visits with consideration of spatial autocorrelation and lagged effects. Our research aims comprise: first, evaluating the lagged effects of the daily PM2.5 concentration on the morbidity of asthma; and second, investigating geographic disparities of asthma risk after controlling for air pollutants and weather conditions.

2. Materials and Methods

2.1. Asthma Data

The data used in this study were retrieved from claim files of the National Health Insurance Research Database (NHIRD) provided by the Department of Health at the Bureau of National Health Insurance and managed by the National Health Research Institutes (NHRI). The NHIRD provides all inpatient and ambulatory medical claims for around 99% of Taiwanese residents [49]. With the approval of the NHRI, this study used the annual ambulatory care visit registry to claim data between 2005 and 2010, which provide information on the date of the clinic visit, up to three diagnoses, scrambled identification numbers of both patients and attending physicians, date of birth of patients, and gender. Asthma cases younger than 15 years old from 2005 to 2010 with the International Classification of Diseases, 9th Revision, Clinical Modification code from 493.00 to 493.99 were recruited in the study sample.

2.2. Environmental Data

Measurements of air pollutants were based on data routinely collected at seven monitoring stations maintained by the Environmental Protection Administration in Taiwan (TWEPA): three in Changhua County and four in Yunlin County (Figure 1). Each monitoring station gathered hourly concentration data of carbon oxide (CO), nitric oxide and nitrogen dioxide (NOx), ozone (O3), sulfur dioxide (SO2), particulate matter with a diameter less than 10 μg/m3 (PM10), and PM2.5 together with weather-condition-related data, such as temperatures, relative humidity, wind speed, and wind direction. The Central Weather Bureau also provides weather records (temperature, relative humidity, and wind direction) from 35 weather monitoring stations in Changhua County and Yunlin County.

2.3. Study Area

Yunlin County is located in west-central Taiwan and accommodates one power plant, which is the third-largest coal-fired power plant in Taiwan. The widest east-west distance is about 50 kilometers (km) and the longest south-north distance is about 38 km. It has an area of 1291 km2 and a population of 710,000; 16% of the inhabitants are children. Changhua County is located at the center of Taiwan and is bordered by Yunlin County to the south. It has an area of about 1074 km2 and a population of around 1.3 million, of whom more than 17% are children. This county has a density of 7.7 factories per square kilometer. According to insurance administrative divisions, a total of 46 districts are contained in the study area, with 20 districts in Yunlin County and 26 districts in Changhua County as shown in Figure 1.

2.4. Imputation of Missing Environmental Data

We used the Bayesian maximum entropy (BME) method to estimate the spatiotemporal distribution of air pollution concentrations and weather conditions for each unmonitored location by day from 2005 to 2010. The BME method is a spatiotemporal interpolation technique to incorporate measurement data, prior knowledge of neighbor information, and local spatiotemporal covariates [50,51,52,53] and has been applied to estimate the ambient pollution concentration across space–time previously [54,55,56,57]. The process of spatiotemporal air pollutants can be characterized by spatiotemporal trend and covariance. Nested spatiotemporal covariance models were used to characterize the spatiotemporal dependence of the air pollutants to reveal the spatiotemporal processes at different space-time scales [50,57]. Before performing spatiotemporal data imputation, the wind data were decomposed into two wind components along longitude and latitude, respectively, i.e., μ and ν, by using the formula μ = (wind speed) × sine (wind direction) and ν = (wind speed) × cosine (wind direction). The imputed wind data were reconstructed from the estimated μ and ν at unmonitored spatial locations and time instants.

2.5. Statistical Modeling Approach

This study adopted a distributed lag nonlinear model (DLNM) to investigate the nonlinear lagged influence of PM2.5 on children’s clinic visits for asthma. Suppose Yit is the number of children’s asthma clinic visits at day t in district i, where Yit follows a Poisson distribution with a mean parameter μit. In order to adjust for the possible bias from the overdispersion problem, we especially considered a quasi-Poisson link function in the DLNM: log(μit) = α + β × (DOW) + γ × (AP) + δ × (WD) + f(TP) + f(RH) + f(Time) + f(PM2.5, lag = 7) + fspat + offset, where DOW is a day-of-the-week vector from Monday to Saturday (i.e., Sunday is the reference level), AP is a co-pollutant vector containing condensable particulate matter (cPM), the ratio of carbon oxide and nitrogen oxide (CO/NOx), SO2, and O3, and WD is an eight-level wind direction variable in terms of southwest (202.5–247.5°), west (247.5–292.5°), northwest (292.5–337.5°), north (337.5–22.5°), northeast (22.5–67.5°), east (67.5–112.5°), and southeast (112.5–157.5°), while south is a reference level (157.5–202.5°). We added three natural cubic splines for mean temperature (TP) with 6 degrees of freedom, mean relative humidity (RH) with 6 degrees of freedom, and calendar time (Time) with 21 degrees of freedom. The model also included a cross-basis function for PM2.5 to investigate the nonlinear association among children’s asthma, PM2.5, and lagged day. The cross-basis function is a 2-dimensional function from a natural cubic spline of PM2.5 with 4 degrees of freedom interacting with another natural cubic spline of lag up to 7 days with 3 degrees of freedom. A spatial function fspat was included by using the Markov random fields (MRF) to take spatial autocorrelation into account [58]. The MRF can transform a shape file into a neighborhood matrix to depict whether any couple of areas share any piece of their boundaries. The number of neighboring districts in each district was also used to estimate unknown parameters of the MRF. The last term is an offset from the logarithm of the district population from 2005 to 2010.
All linear estimates derived from the model can be transformed into the relative risk (RR) by an exponential function. In particular, the linear estimates of air pollutants were transformed into the increased percentage of the relative risk (RR%) by an inter-quartile range change. The estimates of the cross-basis function can be also transformed into RR along with PM2.5 concentrations and lagged days. We defined 35 μg/m3 as the reference level of PM2.5 according to the PM2.5 standard published by TWEPA, which suggests less outdoor physical activity among at-risk individuals sensitive to respiratory diseases when the density of PM2.5 is over 35 μg/m3. The reference level of the lagged day is the present day (lag 0). The MRF can conduct a spatial estimate in each district, which can be also transformed into RR to explain the excessive asthma risk of each district compared with the average asthma risk from all districts.
Our data were maintained and managed by SAS v9.3 (SAS Institute, Cary, NC, USA), and missing data were imputed by using SEKS-GUI v.1.0.3 (SpaceTimeWorks, LLC, San Diego, CA, USA) [59]. DLNM estimation was performed with software R, version 3.1.2 (R Development Core Team, Vienna, Austria). The statistical significance of an estimate was determined by the 95% confidence interval (CI).

3. Results

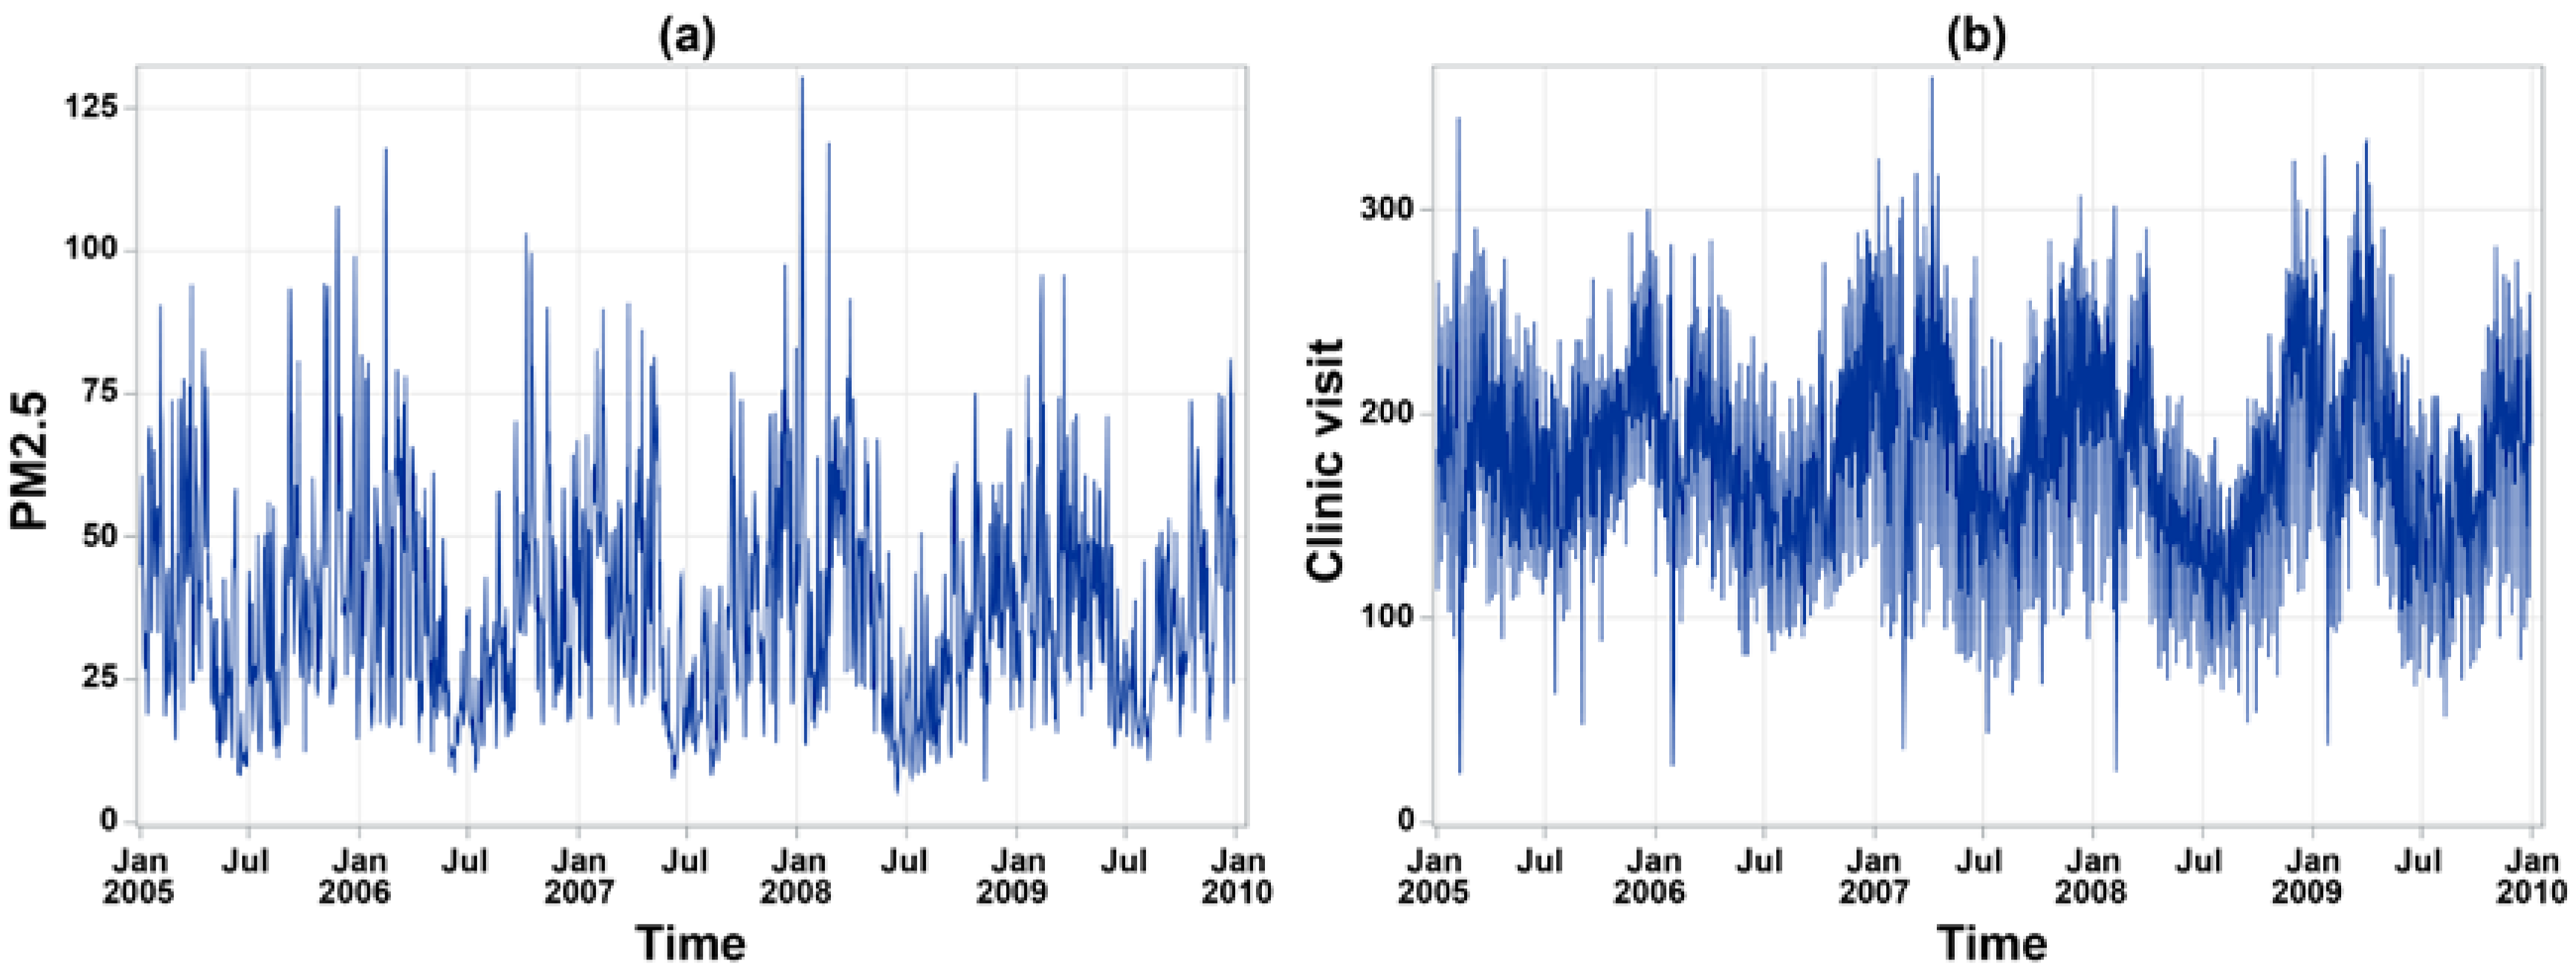
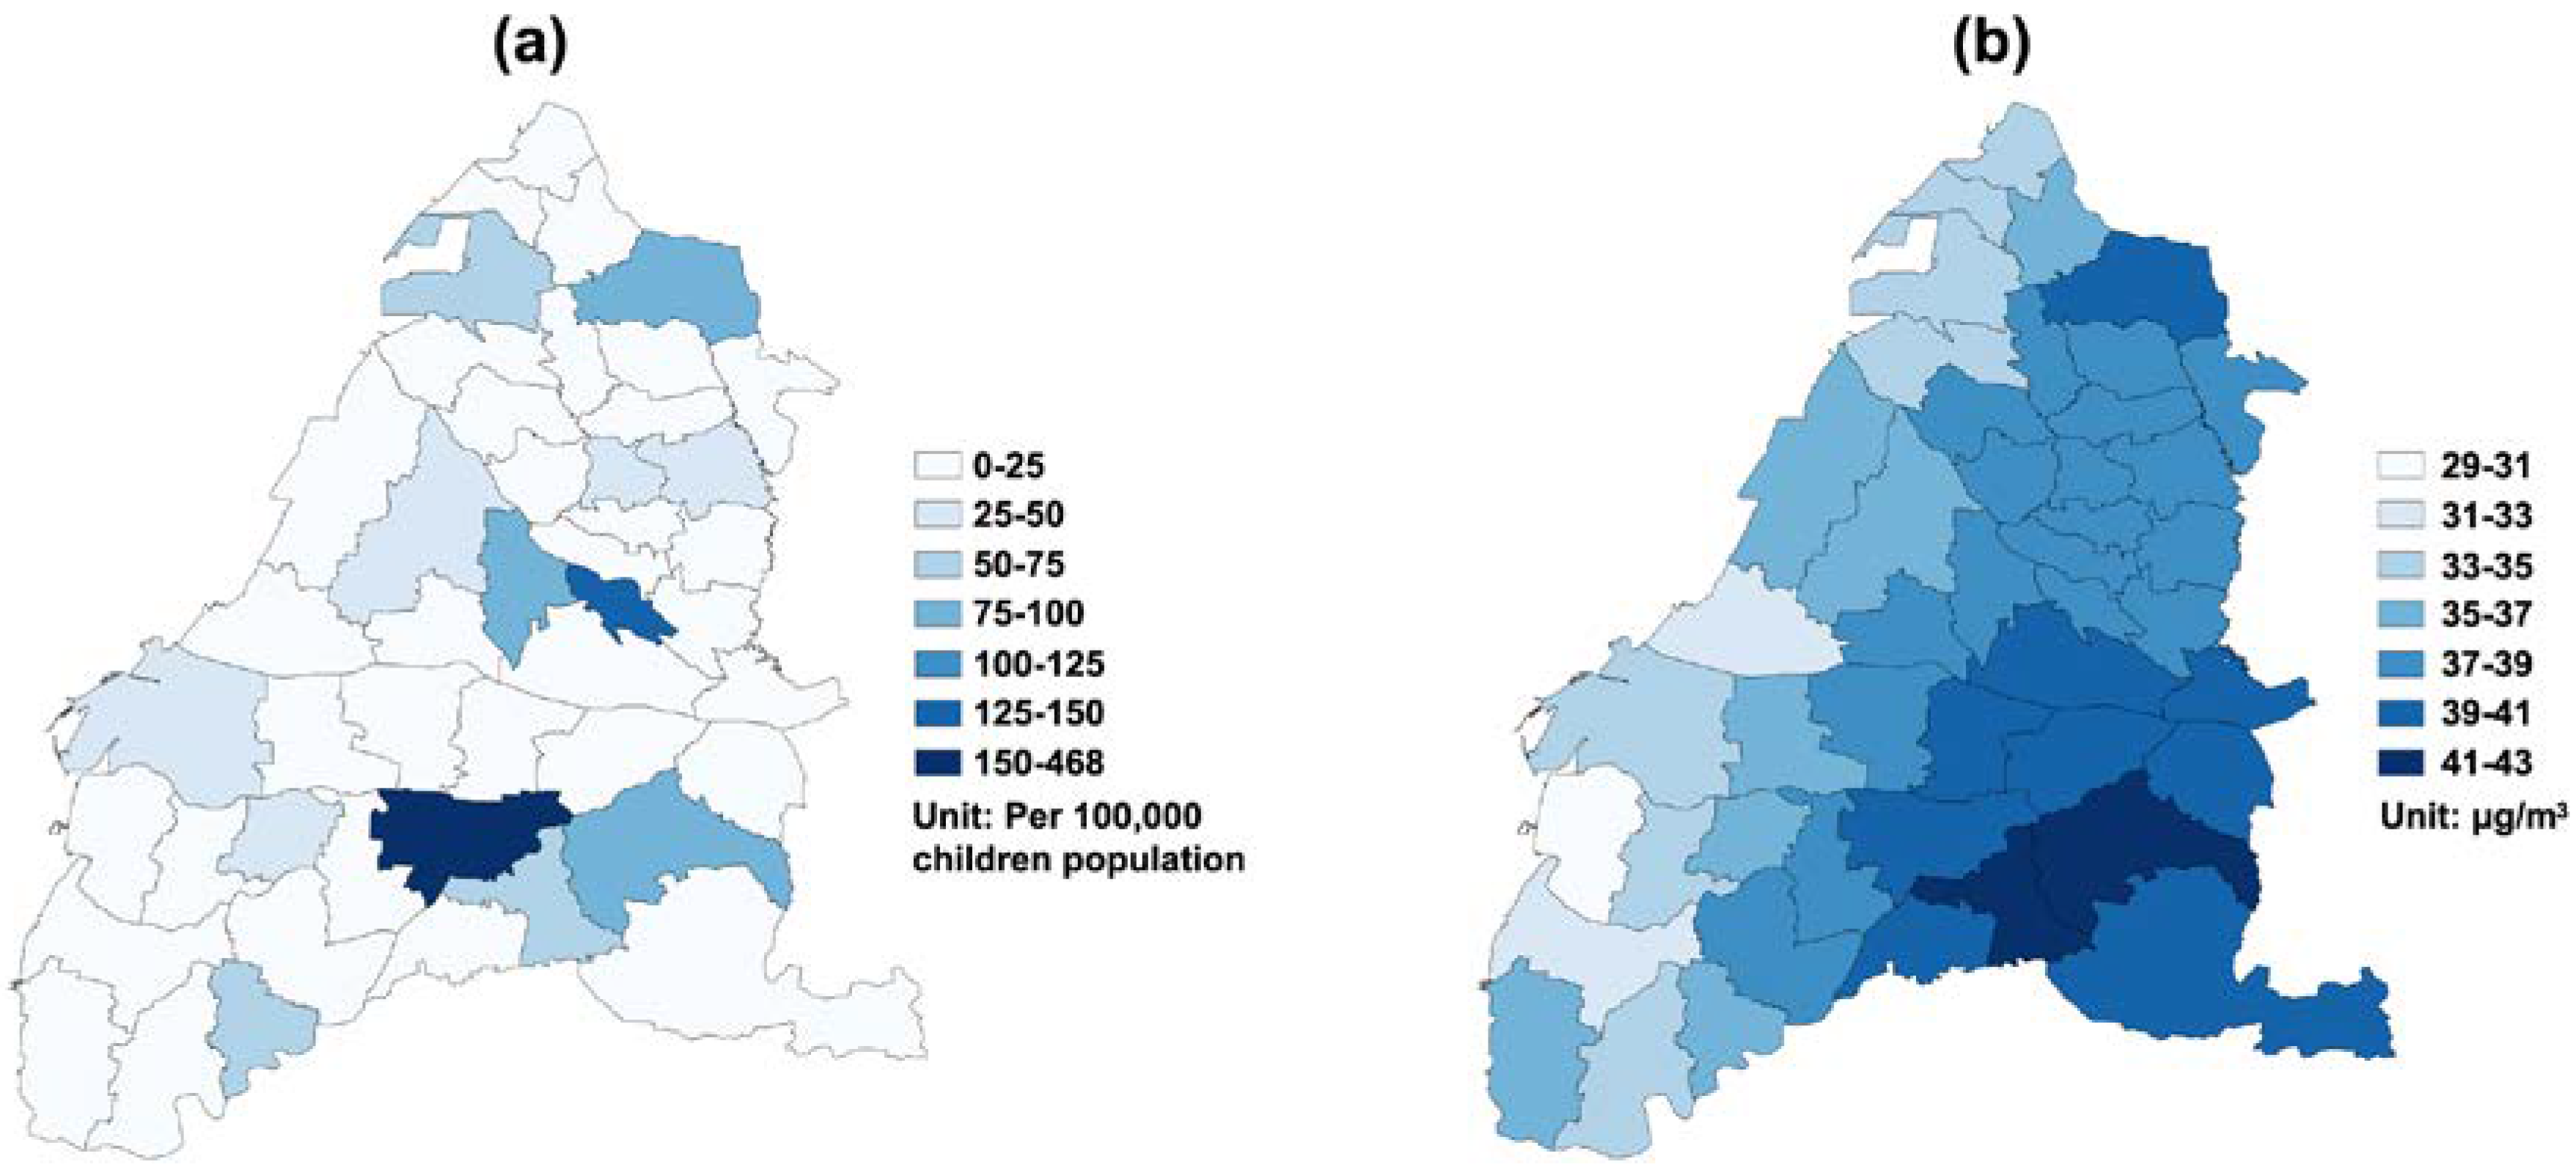
The number of annual clinic visits for children’s asthma was 172,696 in 2005, 157,278 in 2006, 162,837 in 2007, 148,439 in 2008, 150,680 in 2009, and 148,450 in 2010. The daily average of children’s asthma clinic visits was 4.70 cases (standard deviation (SD) = 14.28) in Yunlin County, while Changhua County only had 3.03 (SD = 7.94) children’s asthma clinic visits per day. Daily measurements of ambient pollutants and meteorological factors during the study period are summarized in Table 1. In particular, the mean daily average of PM2.5 was 37.22 μg/m3 (SD = 18.87) in Changhua County and 37.26 μg/m3 (SD = 19.38) in Yunlin County, and both were higher than the World Health Organization (WHO) guideline value (25 μg/m3). In addition, during the study period, 27.99% of days blow northeast wind in Changhua County, and 26.27% of days blow south wind in Yunlin County. Figure 2 shows a clear seasonality on the temporal variation of daily averaged PM2.5 concentration and daily clinic visits for children’s asthma. A total of 1543 days (70.4%) has the daily mean of PM2.5 concentration exceeding the WHO standard of 25 μg/m3 during the study period. On average, the study area had 180.22 daily clinic visits (SD = 51.84) for children’s asthma. A higher number of clinic visits more likely happened during springs and winters. Figure 3a depicts the geographic distribution of the average crude rate of daily children’s asthma and a higher rate more likely concentrated on a few eastern inland districts. Figure 3b presents the geographic distribution of daily average PM2.5 concentrations, in which there was a higher-density distribution from the western coast to the eastern inland districts in the whole study area, especially in the southeastern area.
Table 2 shows a significant RR of children’s asthma in each DOW compared to Sunday, whereas Monday had the highest RR by 2.07 (95% CI = 2.04–2.11; p-value < 0.0001). Moreover, compared to a southerly wind, a significantly lower RR was highly likely in a westerly wind (RR = 0.82; 95% CI = 0.76–0.89; p-value < 0.0001) and a northwesterly wind (RR = 0.89; 95% CI = 0.82–0.97; p-value = 0.0076). Only a northerly wind was significantly positively associated with children’s asthma (RR = 1.03; 95% CI = 1.00–1.06; p-value = 0.0272). Furthermore, increased asthma visits were significantly associated with cPM and SO2. When cPM increased one interquartile range (=17.60 μg/m3), the RR for children’s asthma significantly increased 1.42% (95% = 1.01–1.83; p-value < 0.0001). Similarly, when SO2 increased one interquartile range (=1.66 ppb), the RR significantly increased 1.25% (95% CI = 0.43–2.08; p-value = 0.0028).
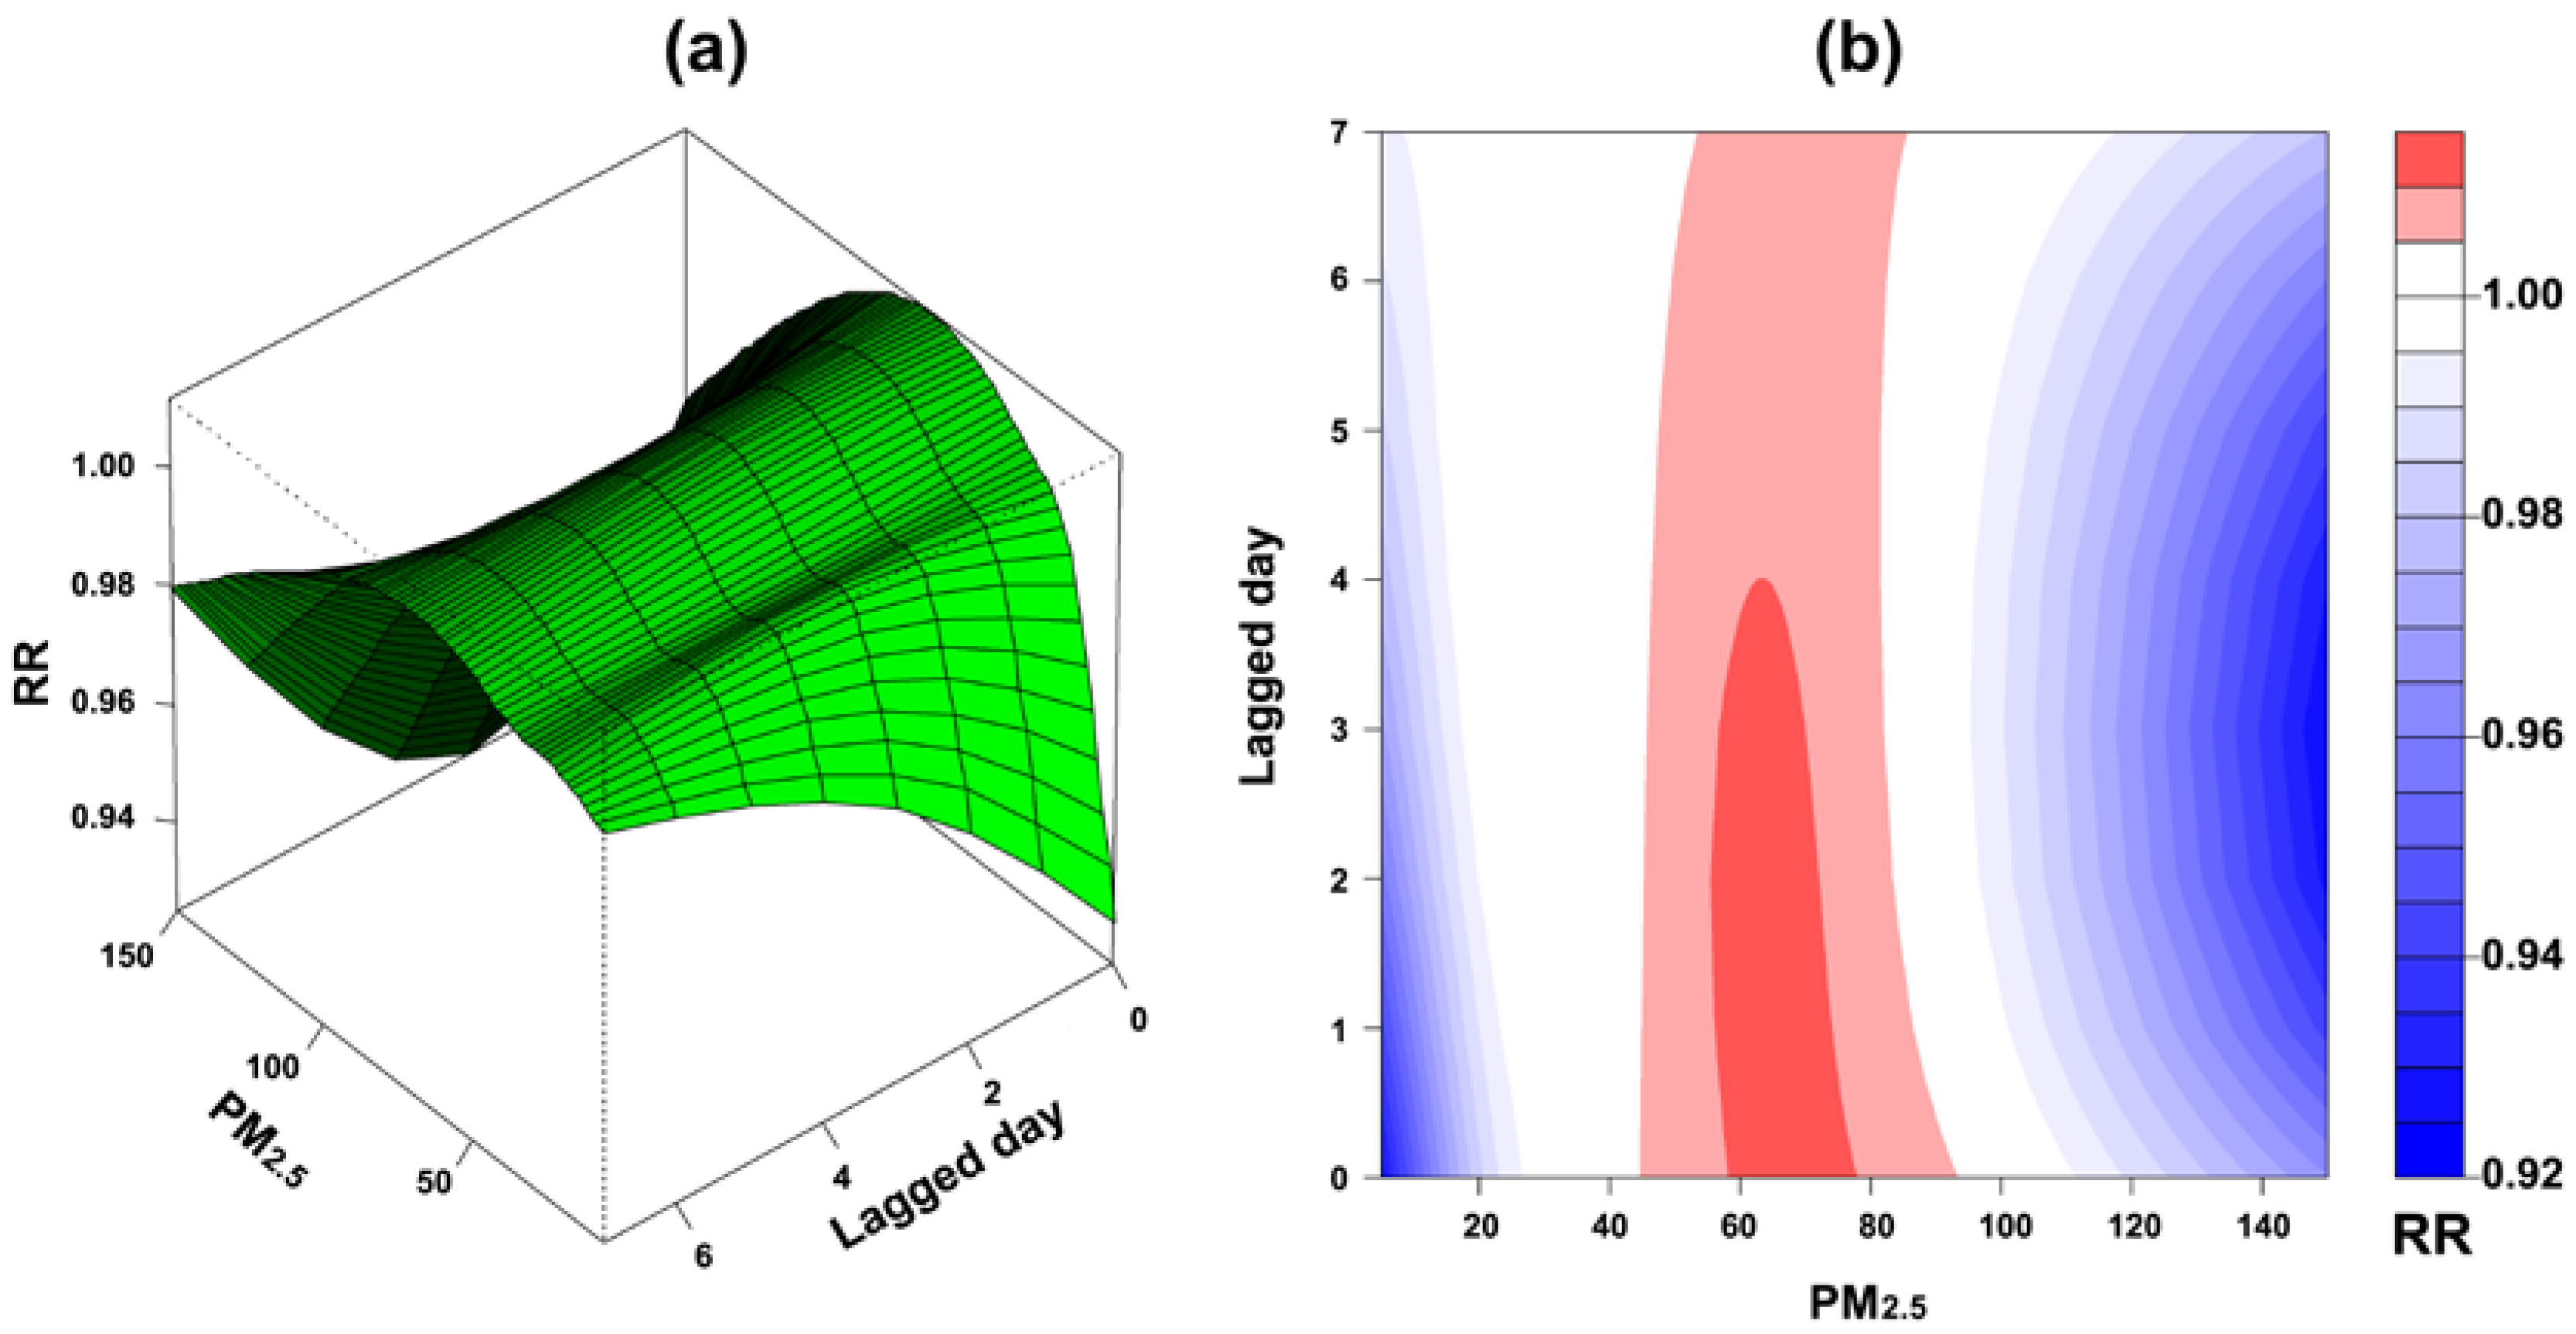
Figure 4a demonstrates the effect of PM2.5 concentration changes on children’s asthma along with lagged days, suggesting a higher RR of children’s asthma simultaneously increased when lagged day and PM2.5 concentration also increased. However, in each lagged day, the RR of children’s asthma gradually decreased when PM2.5 concentration increased over 80 μg/m3. A contour plot shown in Figure 4b presents a clear variation of RR by PM2.5 concentration and lagged day, indicating that a RR greater than 1 happened from present day and 4-day lag when PM2.5 concentration increased between 60 and 80 μg/m3.
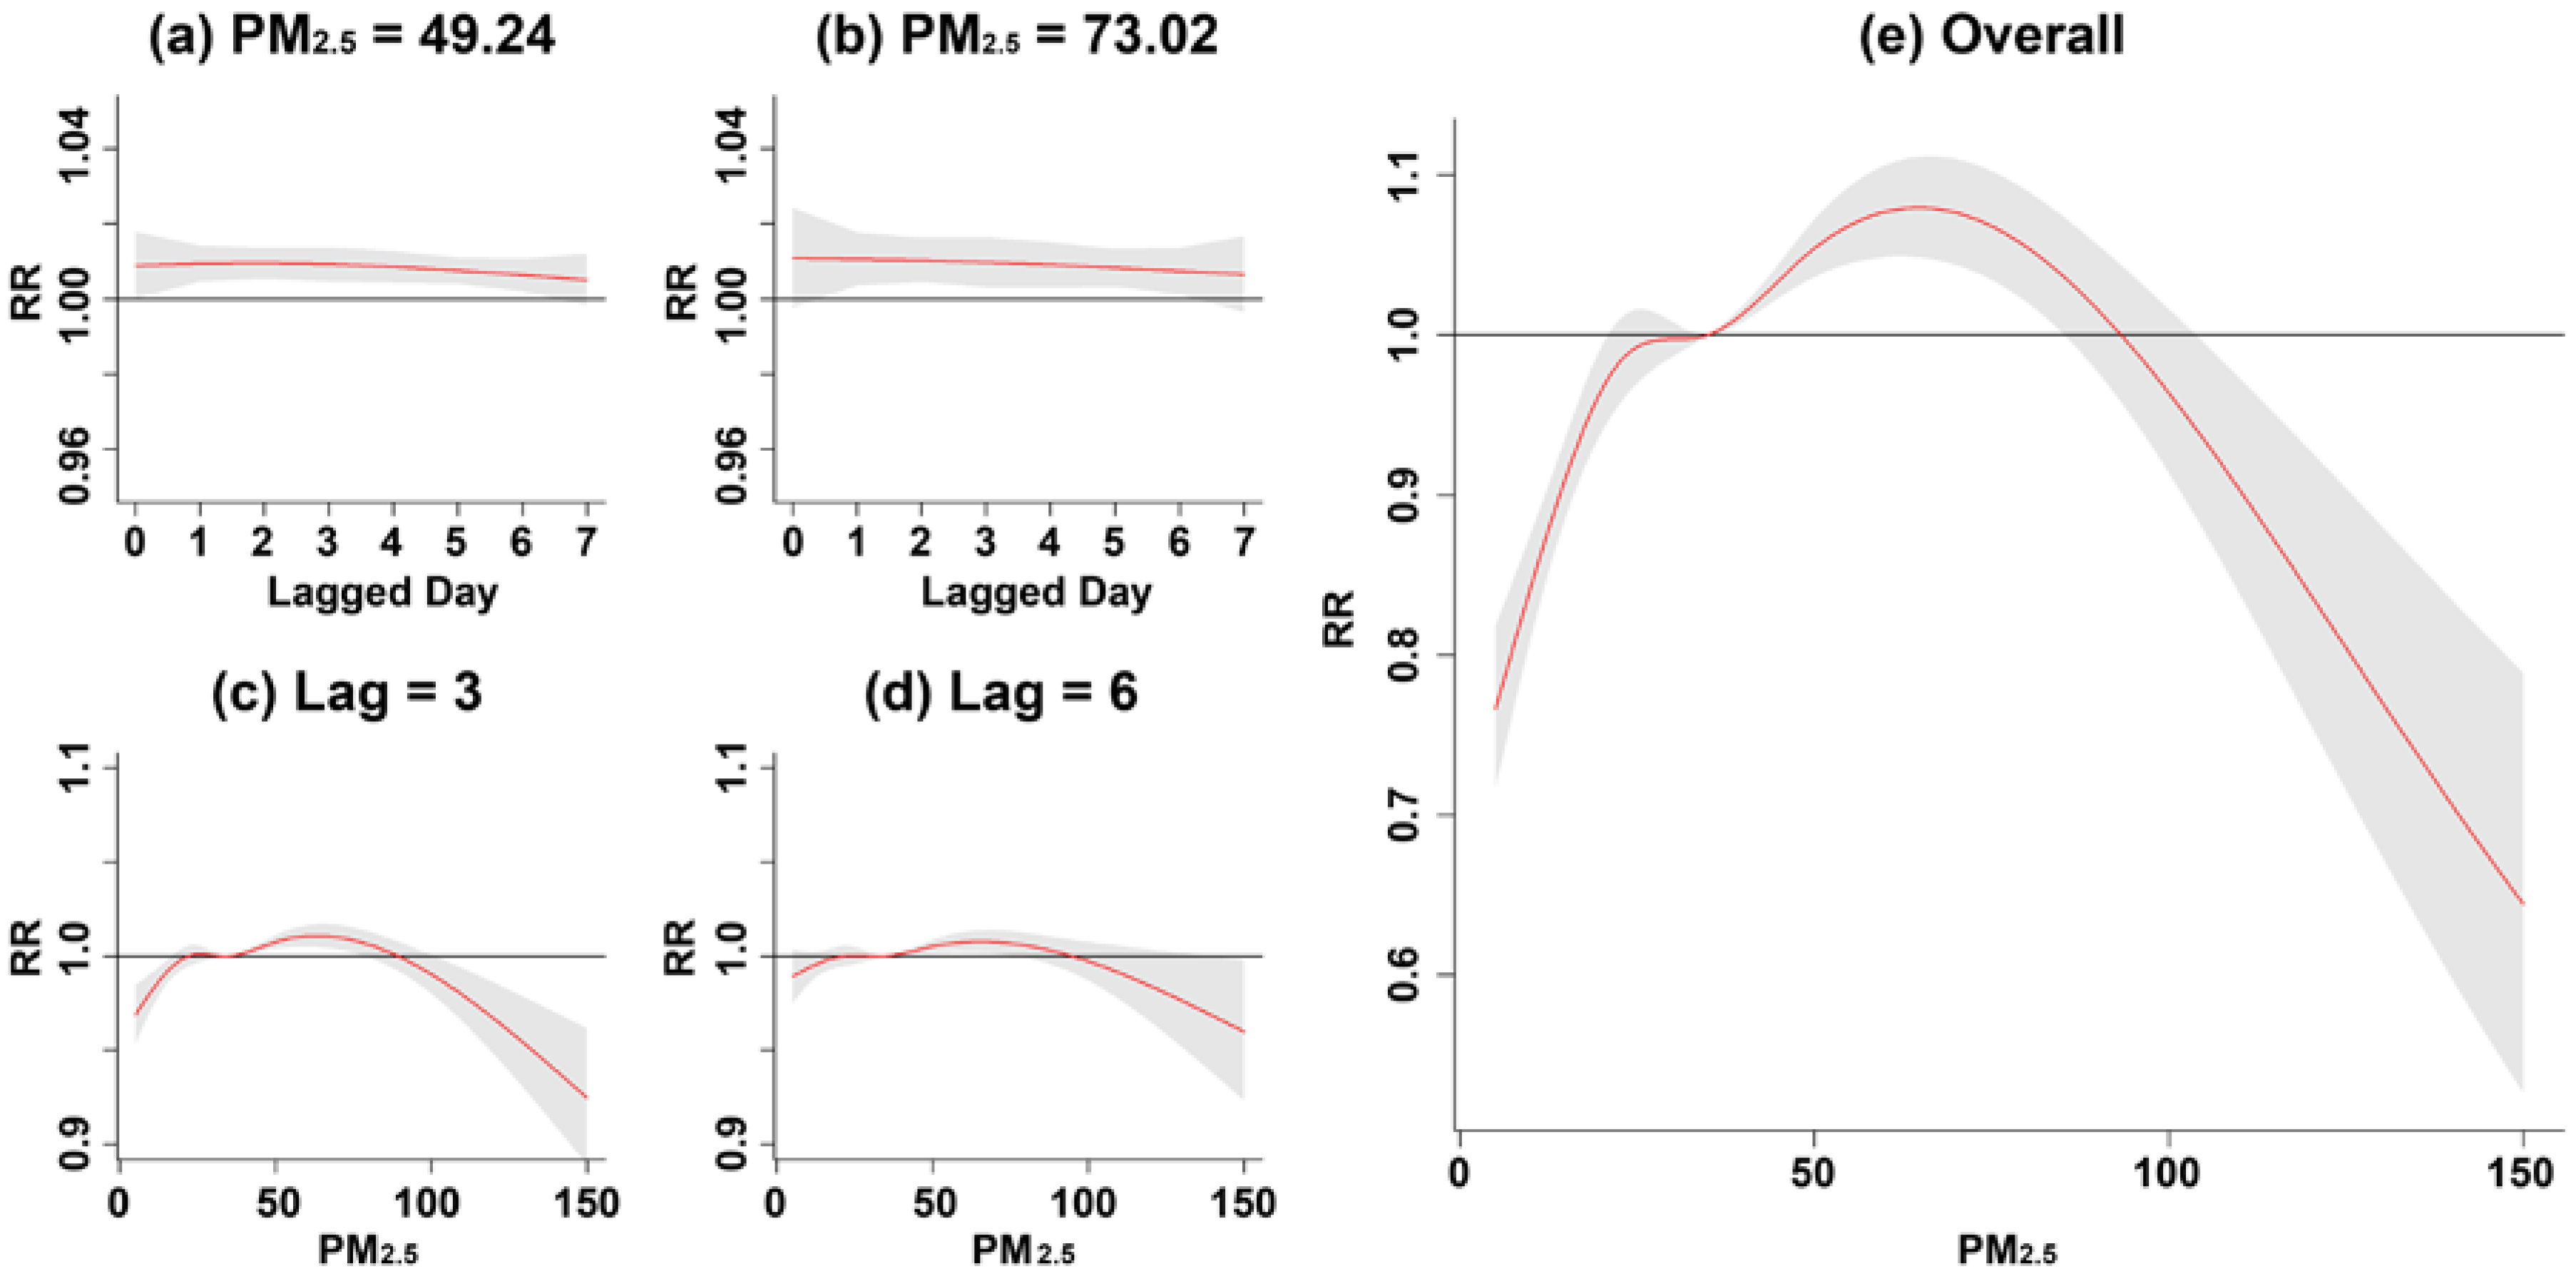
Compared to the reference level of PM2.5 (35 μg/m3), a higher concentration at the 75th percentile (49.24 μg/m3) and 95th percentile (73.02 μg/m3) of PM2.5 had a RR significantly higher than 1 from 1 to 6 lagged days as shown in Figure 5a,b. Compared to the present day, a higher RR was more likely to happen at 2-day lag, and it was significantly greater than 1 when PM2.5 increased from 36.17 μg/m3 to 81.26 μg/m3 (Figure 5c). The range of PM2.5 having a significant RR greater than 1 was shorter along with more lags. For instance, at 6-day lag, a significant RR greater than 1 can be only observed for the concentration of PM2.5 between 38.25 μg/m3 and 76.71 μg/m3 (Figure 5d). Figure 5e shows an overall PM2.5 effect on children’s asthma after accumulating all RRs from each lagged day along with PM2.5 concentration. The result displays a significant increase of RR when PM2.5 increased over 35 μg/m3. The cumulative RR reached the highest level by 1.08 (95% CI = 1.05, 1.11) as PM2.5 increased as high as 64.66 μg/m3. The increment of RR turned downward when PM2.5 was over 64.66 μg/m3, and no significant RR greater than 1 was observed when PM2.5 was higher than 85.25 μg/m3.
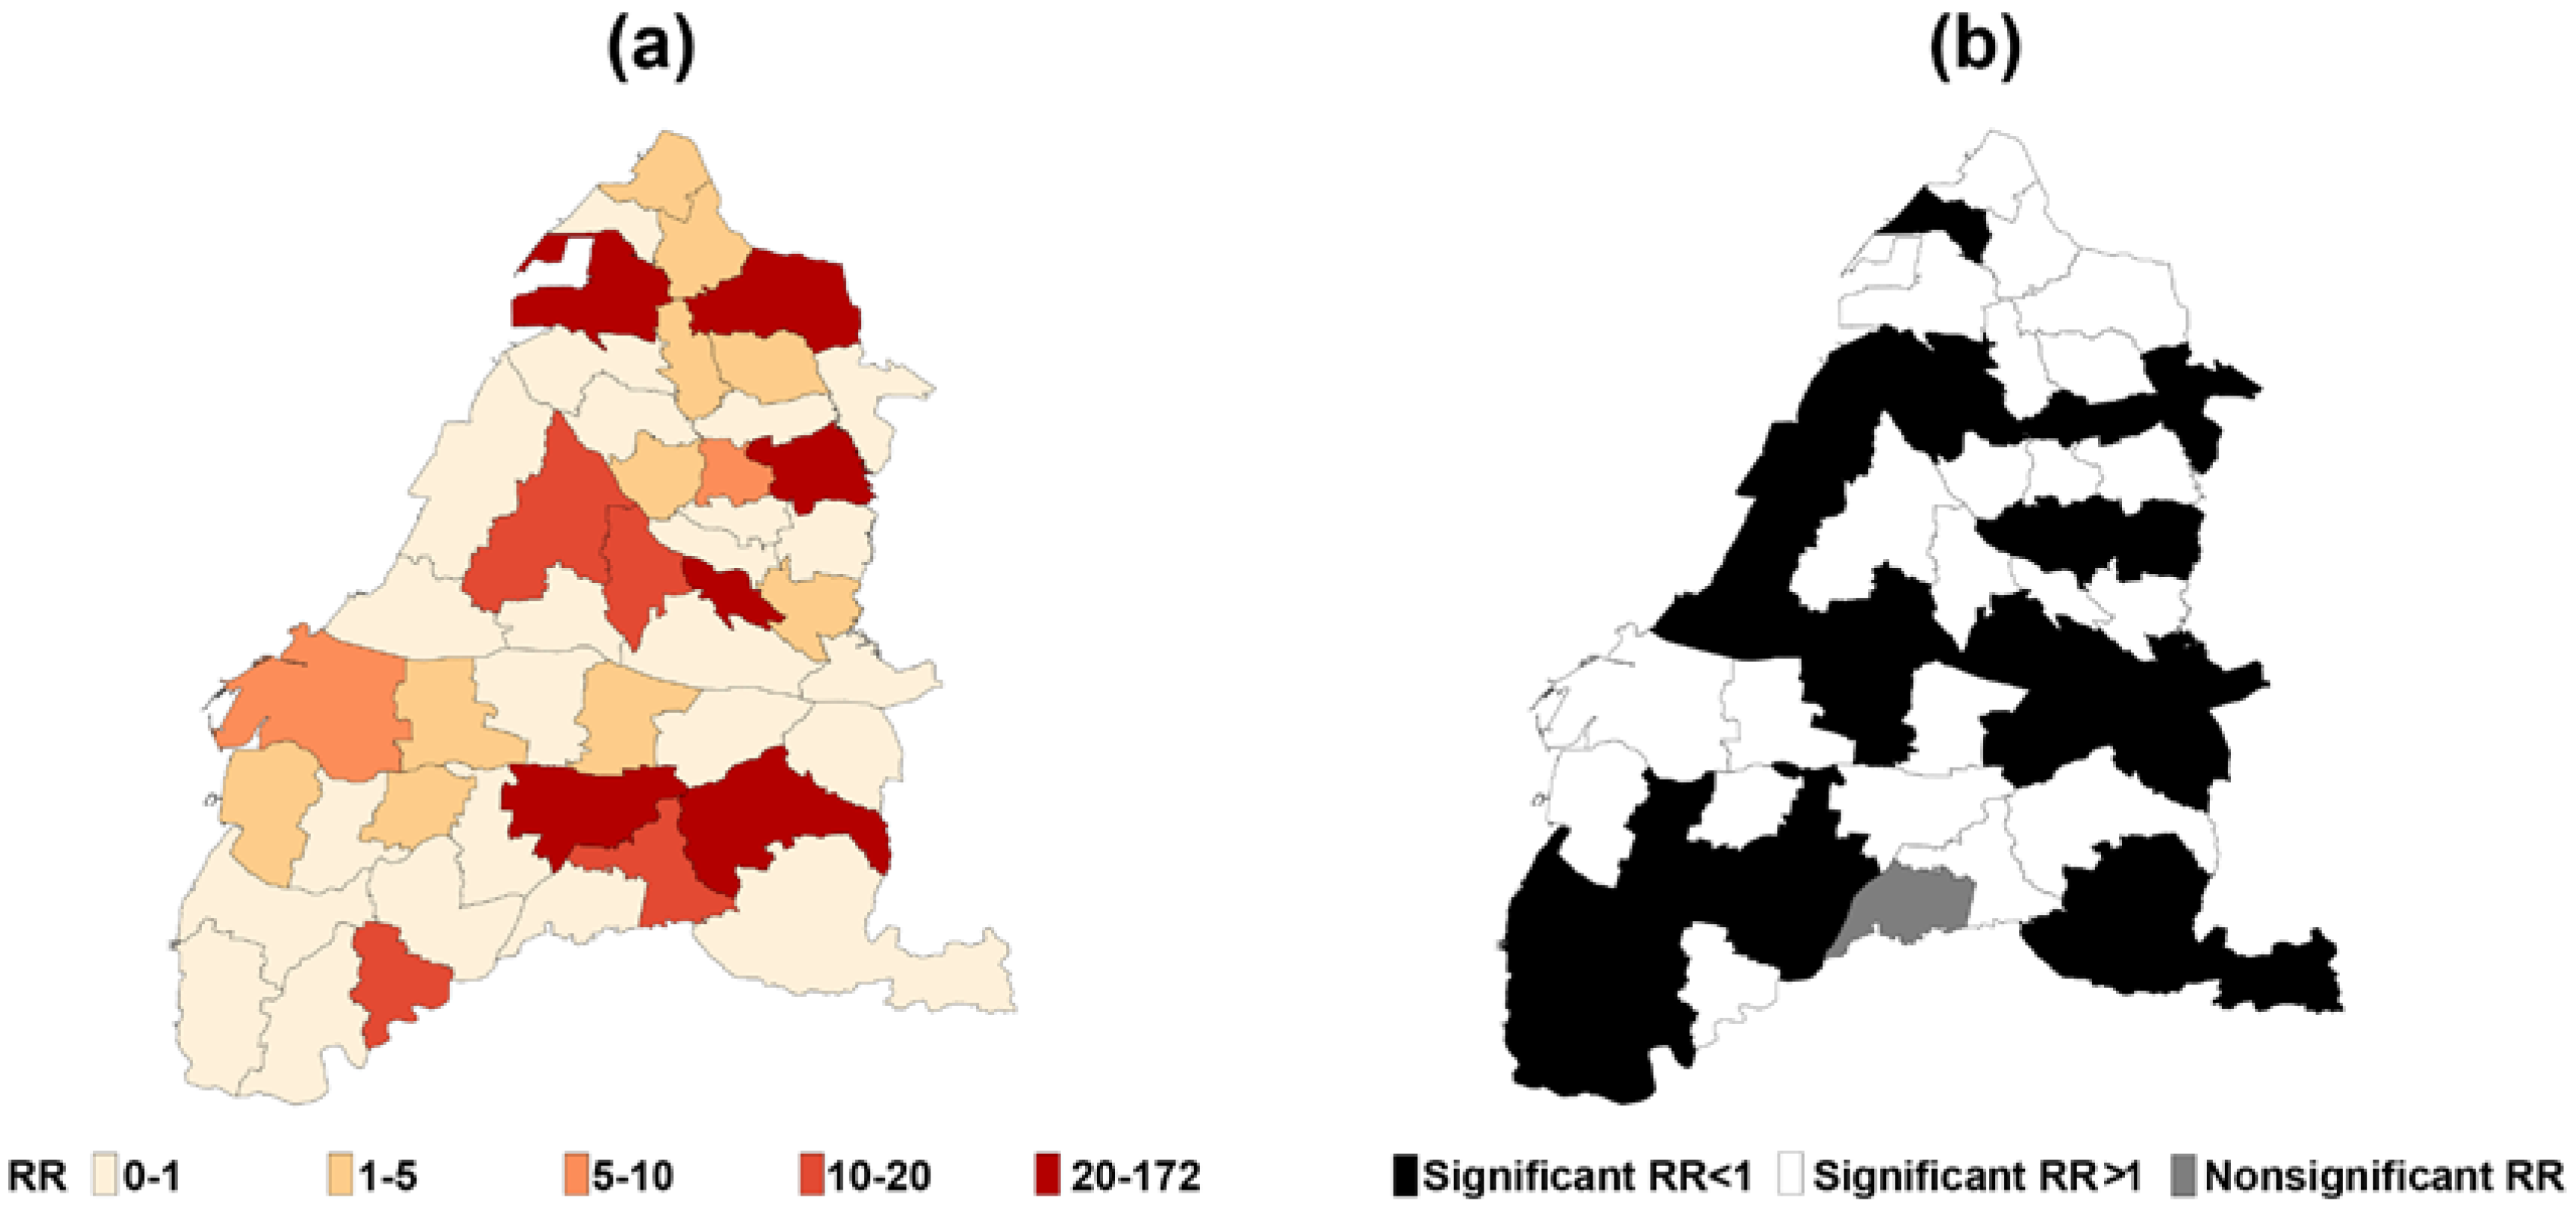
Several districts were identified to have a higher RR for children’s asthma in Changhua County and Yunlin County. In Figure 6a, districts with a higher RR were more located in Changhua County, while the highest one was observed in the Huwei District (RR = 172.80; 95% CI = 162.83–183.39) at the center of Yunlin County, which is the second significant district for local industries, medical care, economy, and employment. Figure 6b reveals a total of 22 districts (13 in Changhua County and 9 in Yunlin County) with a RR significantly higher than 1 after controlling for the other confounding variables. Meanwhile, children living in 47.83% of the total 46 districts were vulnerable to asthma.

4. Discussion

Air pollutants, especially in PM2.5, have been implicated as a potential risk factor for human health, and have raised the greatest public health threat globally according to the WHO’s report [60]. This study selected children as the study population because children are very sensitive to air pollution. We investigated the exposure-lag-response association between children’s asthma and PM2.5 within the lag period, resulting in significantly lagged effects on children’s asthma, especially from 2-day lag to 6-day lag. In addition, this study revealed several high-risk districts after controlling for ambient air pollutants and weather conditions. The finding not only verified the evidence of geographic disparities on children’s asthma, but also provided a priority order of at-risk areas for advanced interventions or preventions.
The main feature of this study is taking the nonlinear properties into account for assessing associations between children’s asthma clinic visits and exposure to ambient air pollution. While some previous studies have examined the linear association between PM2.5 and asthma [23,24,25,61,62], actually at-risk children may not have any asthma symptoms during the concurrent day when being exposed to air pollutants. Meanwhile, the admissions observed on a particular day can be related to the air pollution observed on previous days. Therefore, using a linear model cannot reflect the true relationship of PM2.5 and health, and the lag itself may not be linearly correlated as well. The more lags we consider, the more nonlinearity among lags should be explicit.
Previous epidemiological research on asthma has usually defined lagged effects as linear terms in a model [25,26,27,28], while this modeling strategy assumed that those lagged terms were linearly independent with each in nature. This study adopted the DLNM, which is more flexible in defining the relationships among lags and emphasizes the interactions between PM2.5 concentrations and lags. Thus, the linearity assumption is no longer needed. In fact, recent studies had applied the DLNM more frequently to research lagged effects of air pollution on asthma. For instance, a Sweden study used this model to analyze air pollution data on primary health care visits for asthma, resulting in a significant finding from NO2 [63]. A similar application with the same model in Hong Kong evaluated the association of asthma emergency room visits among children with ozone concentration [64]. More importantly, our model includes a spatial function to adjust for spatial heterogeneity among 46 districts. The rationale of including the spatial function is to present a possible phenomenon known as harvesting, which appears as a raised risk ratio at a short lag followed by an apparent protective effect at a longer lag [65]. In other words, without including the spatial function in the DLNM, the effect of harvesting may be ignored, and may cause a monotone increasing trend in a disease risk as the concentration of an air pollutant increases. The situation has been well-investigated and discussed in a previous study of acute respiratory disease and PM2.5 [66].
We explored the temporal lag patterns of the effects of PM2.5 concentrations on children’s asthma clinic visits to conclude that PM2.5 was correlated with 1–6-day lags. Among the 6-day lagged effect, the first 3 days have the greatest relative risks. Consistent with our results, previous studies have suggested the lagged effect on different asthma outcomes to be at most 6 days. For instance, Ko et al. reported stronger lagged effect estimates from lag of 0–4 days for asthma hospitalization in Hong Kong [67]. Slaughter et al. examined the relationship between PM2.5 and asthma attack in children and found a significant effect for 0–1 day lag [25]. A longer lagged effect, up to 5 days, was observed among children [40]. The possible mechanism leading to the lagged effect could partly be explained by inflammation in the alveolar region of the lung caused by the smaller particles in the pollutant mixture [68]. The efficient deposition of ultrafine particles has been shown to be able to penetrate deep into the lungs and in particular in subjects with asthma [69]. In addition to differences in biological mechanism, the different lagged effects could be attributed to patient behavior patterns. Several days are needed for exacerbation to become severe enough to lead to a clinic visit. This would explain why the increase in asthma clinic visits was delayed. The finding of the lagged effects of asthma from the exposure to high PM2.5 episodes provides an important reference for governmental agencies to assess the health effects of the PM2.5 events, which have occurred frequently in recent years throughout Taiwan, in terms of clinic visits and their associated economic costs from the national health insurance plan.
The short-term time effect should be considered as a confounding factor for clinic visits due to the fact that seeking medical treatment varies by the day of the week. In Taiwan, generally the open time in most hospitals is from Monday morning to Saturday afternoon. Therefore, people who need to see a doctor on Sunday would wait until the following Monday to be admitted. The situation reflects a higher RR on Monday in our model, which illustrates the temporal pattern of medical treatment associated with the short-term time effect.
Because of a variety of air pollutants generated by certain sources, such as transportation and industry, are the major sources of CO and NOx, having those co-pollutants as confounding factors in the model is necessary. However, the correlation between CO and NOx is as high as 0.81, causing the collinearity problem in the model. Although no previous study has examined whether collinearity will affect the estimation on a cross-basis function in the DLNM, we still alternatively used a single predictor by the CO/NOx ratio to avoid potential biases. In addition, the CO/NOx ratio has been frequently used in air quality assessment, where a high value indicates that mobile sources are the predominant contributors of these two compounds, while a low value of rationality indicates that point sources contribute from industrial sources [70,71]. Thus, this should be an adequate replacement rather than using CO and NOx separately in the same model.
The spatial function of our model identified a significant excessive asthma risk in 22 districts after controlling for confounding variables. The finding concluded that those districts may have other unobserved risk factors, while we can only examine why children living in those districts are more vulnerable to asthma than children living in the other districts. Those unobserved factors may attribute to socioeconomic deprivation, other unobserved pollutants, or uneven medical resources. In our study, we observed that the high RR regions are mostly those locations with major medical centers, such as Douliu, Huwei, Beikang, and the Mailiao Townships in Yunlin County. This suggests that the spatial disparity of medical resources can be an important confounding factor in the spatial distribution of clinic visits for asthma.
This study revealed the concentration-response relationship from the population-based clinic visits data. As a result, our finding can provide a solid background for a governmental agency to develop an effective strategy to mitigate the health effects from PM2.5 concentration. Two limitations should be noted regarding this study. First, this study was not able to adjust for potential confounders at the individual level, such as body mass index, exposure to environmental tobacco smoke, genetic information, and allergens, because no such information is available in the NHIRD. Second, we were unable to identify the composition of PM2.5 from monitoring stations because of differences in pollutant composition across space and time and different influences during specific exposure periods.

5. Conclusions

Ambient levels of PM2.5 are associated with children’s asthma clinic visits in Taiwan. The study results clearly show that PM2.5 had significant lagged effects of up to 6 days on children’s asthma. Those identified high-risk districts reveal where vulnerable children may live, and their parents need to be informed in advance when a high concentration of PM2.5 is measured. The findings in this research can be useful for forecasting children’s asthma clinic visits in the coming days, and therefore, our results can serve as a valuable reference for the implementation of an early warning to governmental agencies about susceptible populations.

Acknowledgments

This study was supported by Hwa-Lung Yu fund from the Taiwan Ministry of Science and Technology (103-2221-E-002-140-MY3).

Author Contributions

L.-C.C. conceived the statistical model and wrote the manuscript; Y.-A.C. collected data and carried out data analyses; and H.-L.Y. proposed the study design, analyzed the research findings, and wrote the manuscript.

Conflicts of Interest

The authors declare that they have no competing interests.

References

  1. Akinbami, L.J.; Schoendorf, K.C. Trends in childhood asthma: Prevalence, health care utilization, and mortality. Pediatrics 2002, 110, 315–322. [Google Scholar] [CrossRef] [PubMed]
  2. Asher, M.I.; Montefort, S.; Bjorksten, B.; Lai, C.K.; Strachan, D.P.; Weiland, S.K.; William, H.; ISAAC Phase Three Study Group. Worldwide time trends in the prevalence of symptoms of asthma, allergic rhinoconjunctivitis, and eczema in childhood: ISAAC Phases One and Three repeat multicountry cross-sectional surveys. Lancet 2006, 368, 733–743. [Google Scholar] [CrossRef]
  3. Asher, M.I.; Weiland, S.K. The International Study of Asthma and Allergies in Childhood (ISAAC). ISAAC Steering Committee. Clin. Exp. Allergy 1998, 28 (Suppl. 5), 52–66. [Google Scholar] [CrossRef] [PubMed]
  4. Magnus, P.; Jaakkola, J.J. Secular trend in the occurrence of asthma among children and young adults: Critical appraisal of repeated cross sectional surveys. BMJ 1997, 314, 1795–1799. [Google Scholar] [CrossRef] [PubMed]
  5. Maziak, W.; Behrens, T.; Brasky, T.M.; Duhme, H.; Rzehak, P.; Weiland, S.K.; Keil, U. Are asthma and allergies in children and adolescents increasing? Results from ISAAC phase I and phase III surveys in Munster, Germany. Allergy 2003, 58, 572–579. [Google Scholar] [CrossRef] [PubMed]
  6. Anandan, C.; Nurmatov, U.; van Schayck, O.C.; Sheikh, A. Is the prevalence of asthma declining? Systematic review of epidemiological studies. Allergy 2010, 65, 152–167. [Google Scholar] [CrossRef] [PubMed]
  7. Burney, P. The changing prevalence of asthma? Thorax 2002, 57 (Suppl. 2), II36–II39. [Google Scholar] [PubMed]
  8. Downs, S.H.; Marks, G.B.; Sporik, R.; Belosouva, E.G.; Car, N.G.; Peat, J.K. Continued increase in the prevalence of asthma and atopy. Arch. Dis. Child. 2001, 84, 20–23. [Google Scholar] [CrossRef] [PubMed]
  9. Hsieh, K.H.; Shen, J.J. Prevalence of childhood asthma in Taipei, Taiwan, and other Asian Pacific countries. J. Asthma 1988, 25, 73–82. [Google Scholar] [CrossRef] [PubMed]
  10. Tsuang, H.C.; Su, H.J.; Kao, F.F.; Shih, H.C. Effects of changing risk factors on increasing asthma prevalence in southern Taiwan. Paediatr. Perinat. Epidemiol. 2003, 17, 3–9. [Google Scholar] [CrossRef] [PubMed]
  11. Hwang, C.Y.; Chen, Y.J.; Lin, M.W.; Chen, T.J.; Chu, S.Y.; Chen, C.C.; Lee, D.D.; Chang, Y.T.; Wang, W.J.; Liu, H.N. Prevalence of atopic dermatitis, allergic rhinitis and asthma in Taiwan: A national study 2000 to 2007. Acta Derm. Venereol. 2010, 90, 589–594. [Google Scholar] [PubMed]
  12. Wieslander, G.; Norback, D.; Bjornsson, E.; Janson, C.; Boman, G. Asthma and the indoor environment: The significance of emission of formaldehyde and volatile organic compounds from newly painted indoor surfaces. Int. Arch. Occup. Environ. Health 1997, 69, 115–124. [Google Scholar] [CrossRef] [PubMed]
  13. Tang, C.S.; Chang, L.T.; Lee, H.C.; Chan, C.C. Effects of personal particulate matter on peak expiratory flow rate of asthmatic children. Sci. Total Environ. 2007, 382, 43–51. [Google Scholar] [CrossRef] [PubMed]
  14. Chan, T.C.; Chen, M.L.; Lin, I.F.; Lee, C.H.; Chiang, P.H.; Wang, D.W.; Chuang, J.H. Spatiotemporal analysis of air pollution and asthma patient visits in Taipei, Taiwan. Int. J. Health Geogr. 2009, 8, 26. [Google Scholar] [CrossRef] [PubMed]
  15. Hyrkas, H.; Jaakkola, M.S.; Ikaheimo, T.M.; Hugg, T.T.; Jaakkola, J.J. Asthma and allergic rhinitis increase respiratory symptoms in cold weather among young adults. Respir. Med. 2014, 108, 63–70. [Google Scholar] [CrossRef] [PubMed]
  16. Guo, Y.L.; Lin, Y.C.; Sung, F.C.; Huang, S.L.; Ko, Y.C.; Lai, J.S.; Dockery, D.W. Climate, traffic-related air pollutants, and asthma prevalence in middle-school children in Taiwan. Environ. Health Perspect. 1999, 107, 1001–1006. [Google Scholar] [CrossRef] [PubMed]
  17. Wichmann, F.A.; Muller, A.; Busi, L.E.; Cianni, N.; Massolo, L.; Schlink, U.; Porta, A.; Sly, P.D. Increased asthma and respiratory symptoms in children exposed to petrochemical pollution. J. Allergy Clin. Immunol. 2009, 123, 632–638. [Google Scholar] [CrossRef] [PubMed]
  18. USEPA. Asthma Facts. United States Environmental Protection Agency, 2015. Available online: https://www.epa.gov/sites/production/files/2015-10/documents/asthma_fact_sheet_eng_july_30_2015_v2.pdf (accessed on 17 January 2018).
  19. USEPA. Ozone and Your Health. United States Environmental Protection Agency, 2009. Available online: https://www3.epa.gov/airnow/ozone-c.pdf (accessed on 17 January 2018).
  20. Schwartz, J.; Sarnat, J.A.; Coull, B.A.; Wilson, W.E. Effects of exposure measurement error on particle matter epidemiology: A simulation using data from a panel study in Baltimore, MD. J. Expo. Sci. Environ. Epidemiol. 2007, 17 (Suppl. 2), S2. [Google Scholar] [CrossRef] [PubMed]
  21. Kelly, F.J.; Fussell, J.C. Size, source and chemical composition as determinants of toxicity attributable to ambient particulate matter. Atmos. Environ. 2012, 60, 504–526. [Google Scholar] [CrossRef]
  22. Villeneuve, P.J.; Goldberg, M.S.; Krewski, D.; Burnett, R.T.; Chen, Y. Fine particulate air pollution and all-cause mortality within the Harvard Six-Cities Study: Variations in risk by period of exposure. Ann. Epidemiol. 2002, 12, 568–576. [Google Scholar] [CrossRef]
  23. Chen, B.Y.; Chen, C.H.; Chen, P.C.; Wang, G.S.; Guo, Y.L. Air Pollution, Allergic Co-morbidity, and Emergency Department Visit for Pediatric Asthma in Taiwan. Aerosol Air Qual. Res. 2013, 13, 1847–1852. [Google Scholar] [CrossRef]
  24. Jalaludin, B.; Khalaj, B.; Sheppeard, V.; Morgan, G. Air pollution and ED visits for asthma in Australian children: A case-crossover analysis. Int. Arch. Occup. Environ. Health 2008, 81, 967–974. [Google Scholar] [CrossRef] [PubMed]
  25. Slaughter, J.C.; Lumley, T.; Sheppard, L.; Koenig, J.Q.; Shapiro, G.G. Effects of ambient air pollution on symptom severity and medication use in children with asthma. Ann. Allergy Asthma Immunol. 2003, 91, 346–353. [Google Scholar] [CrossRef]
  26. Tecer, L.H.; Alagha, O.; Karaca, F.; Tuncel, G.; Eldes, N. Particulate matter (PM(2.5), PM(10-2.5), and PM(10)) and children’s hospital admissions for asthma and respiratory diseases: A bidirectional case-crossover study. J. Toxicol. Environ. Health A 2008, 71, 512–520. [Google Scholar] [CrossRef] [PubMed]
  27. Andersen, Z.J.; Wahlin, P.; Raaschou-Nielsen, O.; Ketzel, M.; Scheike, T.; Loft, S. Size distribution and total number concentration of ultrafine and accumulation mode particles and hospital admissions in children and the elderly in Copenhagen, Denmark. Occup. Environ. Med. 2008, 65, 458–466. [Google Scholar] [CrossRef] [PubMed]
  28. Iskandar, A.; Andersen, Z.J.; Bonnelykke, K.; Ellermann, T.; Andersen, K.K.; Bisgaard, H. Coarse and fine particles but not ultrafine particles in urban air trigger hospital admission for asthma in children. Thorax 2012, 67, 252–257. [Google Scholar] [CrossRef] [PubMed]
  29. Lin, M.; Chen, Y.; Burnett, R.T.; Villeneuve, P.J.; Krewski, D. The influence of ambient coarse particulate matter on asthma hospitalization in children: Case-crossover and time-series analyses. Environ. Health Perspect. 2002, 110, 575–581. [Google Scholar] [CrossRef] [PubMed]
  30. Yamazaki, S.; Shima, M.; Yoda, Y.; Oka, K.; Kurosaka, F.; Shimizu, S.; Takahashi, H.; Nikatani, Y.; Nishikawa, J.; Fujiwara, K.; et al. Association between PM2.5 and primary care visits due to asthma attack in Japan: Relation to Beijing’s air pollution episode in January 2013. Environ. Health Prev. Med. 2014, 19, 172–176. [Google Scholar] [CrossRef] [PubMed]
  31. Malm, W.C.; Schichtel, B.A.; Pitchford, M.L.; Ashbaugh, L.L.; Eldred, R.A. Spatial and monthly trends in speciated fine particle concentration in the United States. J. Geophys. Res. Atmos. 2004, 109. [Google Scholar] [CrossRef]
  32. Bell, M.L.; HEI Health Review Committee. Assessment of the health impacts of particulate matter characteristics. Res. Rep. Health Eff. Inst. 2012, 161, 5–38. [Google Scholar]
  33. Englert, N. Fine particles and human health—A review of epidemiological studies. Toxicol. Lett. 2004, 149, 235–242. [Google Scholar] [CrossRef] [PubMed]
  34. Dominici, F.; Peng, R.D.; Bell, M.L.; Pham, L.; McDermott, A.; Zeger, S.L.; Samet, J.M. Fine particulate air pollution and hospital admission for cardiovascular and respiratory diseases. JAMA 2006, 295, 1127–1134. [Google Scholar] [CrossRef] [PubMed]
  35. Oyana, T.J.; Rivers, P.A. Geographic variations of childhood asthma hospitalization and outpatient visits and proximity to ambient pollution sources at a U.S.-Canada border crossing. Int. J. Health Geogr. 2005, 4, 14. [Google Scholar] [CrossRef] [PubMed] [Green Version]
  36. Wong, C.M.; Vichit-Vadakan, N.; Vajanapoom, N.; Ostro, B.; Thach, T.Q.; Chau, P.Y.; Chan, E.K.; Chung, R.Y.; Ou, C.Q.; Yang, L.; et al. Part 5. Public health and air pollution in Asia (PAPA): A combined analysis of four studies of air pollution and mortality. Res. Rep. Health Eff. Inst. 2010, 154, 377–418. [Google Scholar]
  37. Lee, S.L.; Wong, W.H.; Lau, Y.L. Association between air pollution and asthma admission among children in Hong Kong. Clin. Exp. Allergy 2006, 36, 1138–1146. [Google Scholar] [CrossRef] [PubMed]
  38. Tiittanen, P.; Timonen, K.L.; Ruuskanen, J.; Mirme, A.; Pekkanen, J. Fine particulate air pollution, resuspended road dust and respiratory health among symptomatic children. Eur. Respir. J. 1999, 13, 266–273. [Google Scholar] [CrossRef] [PubMed]
  39. Ostro, B.; Lipsett, M.; Mann, J.; Braxton-Owens, H.; White, M. Air pollution and exacerbation of asthma in African-American children in Los Angeles. Epidemiology 2001, 12, 200–208. [Google Scholar] [CrossRef] [PubMed]
  40. Halonen, J.I.; Lanki, T.; Yli-Tuomi, T.; Kulmala, M.; Tiittanen, P.; Pekkanen, J. Urban air pollution, and asthma and COPD hospital emergency room visits. Thorax 2008, 63, 635–641. [Google Scholar] [CrossRef] [PubMed]
  41. Ostro, B.; Roth, L.; Malig, B.; Marty, M. The effects of fine particle components on respiratory hospital admissions in children. Environ Health Perspect. 2009, 117, 475–480. [Google Scholar] [CrossRef] [PubMed]
  42. Peel, J.L.; Tolbert, P.E.; Klein, M.; Metzger, K.B.; Flanders, W.D.; Todd, K.; Mulholland, J.A.; Ryan, P.B.; Frumkin, H. Ambient air pollution and respiratory emergency department visits. Epidemiology 2005, 16, 164–174. [Google Scholar] [CrossRef] [PubMed]
  43. Zanobetti, A.; Schwartz, J.; Samoli, E.; Gryparis, A.; Touloumi, G.; Peacock, J.; Anderson, R.H.; Le Tertre, A.; Bobros, J.; Celko, M.; et al. The temporal pattern of respiratory and heart disease mortality in response to air pollution. Environ. Health Perspect. 2003, 111, 1188–1193. [Google Scholar] [CrossRef] [PubMed]
  44. de Hartog, J.J.; Lanki, T.; Timonen, K.L.; Hoek, G.; Janssen, N.A.; Ibald-Mulli, A.; Peters, A.; Heinrich, J.; Tarkiainen, T.H.; van Grieken, R.; et al. Associations between PM2.5 and heart rate variability are modified by particle composition and beta-blocker use in patients with coronary heart disease. Environ. Health Perspect. 2009, 117, 105–111. [Google Scholar] [CrossRef] [PubMed]
  45. Slaughter, J.C.; Kim, E.; Sheppard, L.; Sullivan, J.H.; Larson, T.V.; Claiborn, C. Association between particulate matter and emergency room visits, hospital admissions and mortality in Spokane, Washington. J. Expo. Anal. Environ. Epidemiol. 2005, 15, 153–159. [Google Scholar] [CrossRef] [PubMed]
  46. Li, S.; Batterman, S.; Wasilevich, E.; Wahl, R.; Wirth, J.; Su, F.C.; Mukherjee, B. Association of daily asthma emergency department visits and hospital admissions with ambient air pollutants among the pediatric Medicaid population in Detroit: Time-series and time-stratified case-crossover analyses with threshold effects. Environ. Res. 2011, 111, 1137–1147. [Google Scholar] [CrossRef] [PubMed]
  47. Xu, Z.; Huang, C.; Su, H.; Turner, L.R.; Qiao, Z.; Tong, S. Diurnal temperature range and childhood asthma: A time-series study. Environ. Health 2013, 12, 12. [Google Scholar] [CrossRef] [PubMed]
  48. Xu, Z.; Huang, C.; Hu, W.; Turner, L.R.; Su, H.; Tong, S. Extreme temperatures and emergency department admissions for childhood asthma in Brisbane, Australia. Occup. Environ. Med. 2013, 70, 730–735. [Google Scholar] [CrossRef] [PubMed]
  49. Lu, J.F.R.; Hsiao, W.C. Does universal health insurance make health care unaffordable? Lessons from Taiwan. Health Aff. 2003, 22, 77–88. [Google Scholar] [CrossRef] [PubMed]
  50. Yu, H.L.; Wang, C.H. Retrospective prediction of intraurban spatiotemporal distribution of PM2.5 in Taipei. Atmos. Environ. 2010, 44, 3053–3065. [Google Scholar]
  51. Kolovos, A.; Skupin, A.; Jerrett, M.; Christakos, G. Multi-Perspective Analysis and Spatiotemporal Mapping of Air Pollution Monitoring Data. Environ. Sci. Technol. 2010, 44, 6738–6744. [Google Scholar] [CrossRef] [PubMed]
  52. Zagouras, A.; Kolovos, A.; Coimbra, C.F.M. Objective framework for optimal distribution of solar irradiance monitoring networks. Renew. Energy 2015, 80, 153–165. [Google Scholar] [CrossRef]
  53. Christakos, G. A Bayesian Maximum-Entropy View to the Spatial Estimation Problem. Math. Geol. 1990, 22, 763–777. [Google Scholar] [CrossRef]
  54. Christakos, G.; Serre, M.L.; Kovitz, J.L. BME representation of particulate matter distributions in the state of California on the basis of uncertain measurements. J. Geophys. Res. Atmos. 2001, 106, 9717–9731. [Google Scholar] [CrossRef]
  55. De Nazelle, A.; Arunachalam, S.; Serre, M.L. Bayesian Maximum Entropy Integration of Ozone Observations and Model Predictions: An Application for Attainment Demonstration in North Carolina. Environ. Sci. Technol. 2010, 44, 5707–5713. [Google Scholar] [CrossRef] [PubMed]
  56. Yu, H.L.; Chen, J.C.; Christakos, G.; Jerrett, M. BME Estimation of Residential Exposure to Ambient PM10 and Ozone at Multiple Time Scales. Environ. Health Perspect. 2009, 117, 537–544. [Google Scholar] [CrossRef] [PubMed]
  57. Christakos, G.; Serre, M.L. BME analysis of spatiotemporal particulate matter distributions in North Carolina. Atmos. Environ. 2000, 34, 3393–3406. [Google Scholar] [CrossRef]
  58. Kindermann, R.P.; Snell, J.L. Markov random fields and their applications. In Contemporary Mathematics; American Mathematical Society: Providence, RI, USA, 1980. [Google Scholar]
  59. Yu, H.L.; Kolovos, A.; Christakos, G.; Chen, J.C.; Warmerdam, S.; Dev, B. Interactive spatiotemporal modelling of health systems: The SEKS-GUI framework. Stoch. Environ. Res. Risk A 2007, 21, 555–572. [Google Scholar] [CrossRef]
  60. WHO. WHO Air Quality Guidelines for Particulate Matter, Ozone, Nitrogen Dioxide and Sulfur Dioxide: Global Update 2005. Summary of Risk Assessment. 2006. Available online: http://apps.who.int/iris/bitstream/10665/69477/1/WHO_SDE_PHE_OEH_06.02_eng.pdf (accessed on 17 January 2018).
  61. Norris, G.; YoungPong, S.N.; Koenig, J.Q.; Larson, T.V.; Sheppard, L.; Stout, J.W. An association between fine particles and asthma emergency department visits for children in Seattle. Environ. Health Perspect. 1999, 107, 489–493. [Google Scholar] [CrossRef] [PubMed]
  62. Wang, K.Y.; Chau, T.T. An association between air pollution and daily outpatient visits for respiratory disease in a heavy industry area. PLoS ONE 2013, 8, e75220. [Google Scholar] [CrossRef] [PubMed]
  63. Taj, T.; Jakobsson, K.; Stroh, E.; Oudin, A. Air pollution is associated with primay health care visits for asthma in Sweden: A case-crossover design with a distributed lag nonlinear model. Spat. Spatio-Tempor. Epidemiol. 2016, 17, 37–44. [Google Scholar] [CrossRef] [PubMed]
  64. Dai, Y.; Qiu, H.; Sun, S.; Yang, Y.; Lin, H.; Tian, L. Age-dependent effect of ambient ozone on emergency asthma hospitalizations in Hong Kong. J. Allergy Clin. Immunol. 2018, 141, 1532–1534. [Google Scholar] [CrossRef] [PubMed]
  65. Schwartz, J. Is there harvesting in the association of airborne particles with daily deaths and hospital admissions? Epidemiology 2001, 12, 55–61. [Google Scholar] [CrossRef] [PubMed]
  66. Chien, L.-C.; Guo, Y.; Li, X.; Yu, H.-L. Considering spatial heterogeneity in the distributed lag nonlinear model when analyzing spatiotemporal data. J. Expo. Sci. Environ. Epidemol. 2016, 28, 13. [Google Scholar]
  67. Ko, F.W.; Tam, W.; Wong, T.W.; Lai, C.K.; Wong, G.W.; Leung, T.F.; Ng, S.S.; Hui, D.S. Effects of air pollution on asthma hospitalization rates in different age groups in Hong Kong. Clin. Exp. Allergy 2007, 37, 1312–1319. [Google Scholar] [CrossRef] [PubMed]
  68. Peters, A.; Wichmann, H.E.; Tuch, T.; Heinrich, J.; Heyder, J. Respiratory effects are associated with the number of ultrafine particles. Am. J. Respir. Crit. Care Med. 1997, 155, 1376–1383. [Google Scholar] [CrossRef] [PubMed]
  69. Anderson, P.J.; Wilson, J.D.; Hiller, F.C. Respiratory tract deposition of ultrafine particles in subjects with obstructive or restrictive lung disease. Chest 1990, 97, 1115–1120. [Google Scholar] [CrossRef] [PubMed]
  70. Parrish, D.D. Critical evaluation of US on-road vehicle emission inventories. Atmos. Environ. 2006, 40, 2288–2300. [Google Scholar] [CrossRef]
  71. Wang, T.; Cheung, T.F.; Li, Y.S.; Yu, X.M.; Black, D.R. Emission characteristics of CO, NOx, SO2 and indications of biomass burning observed at a rural site in eastern China. J. Geophys. Res. 2002, 107, ACH-9-1–ACH-9-10. [Google Scholar] [CrossRef]
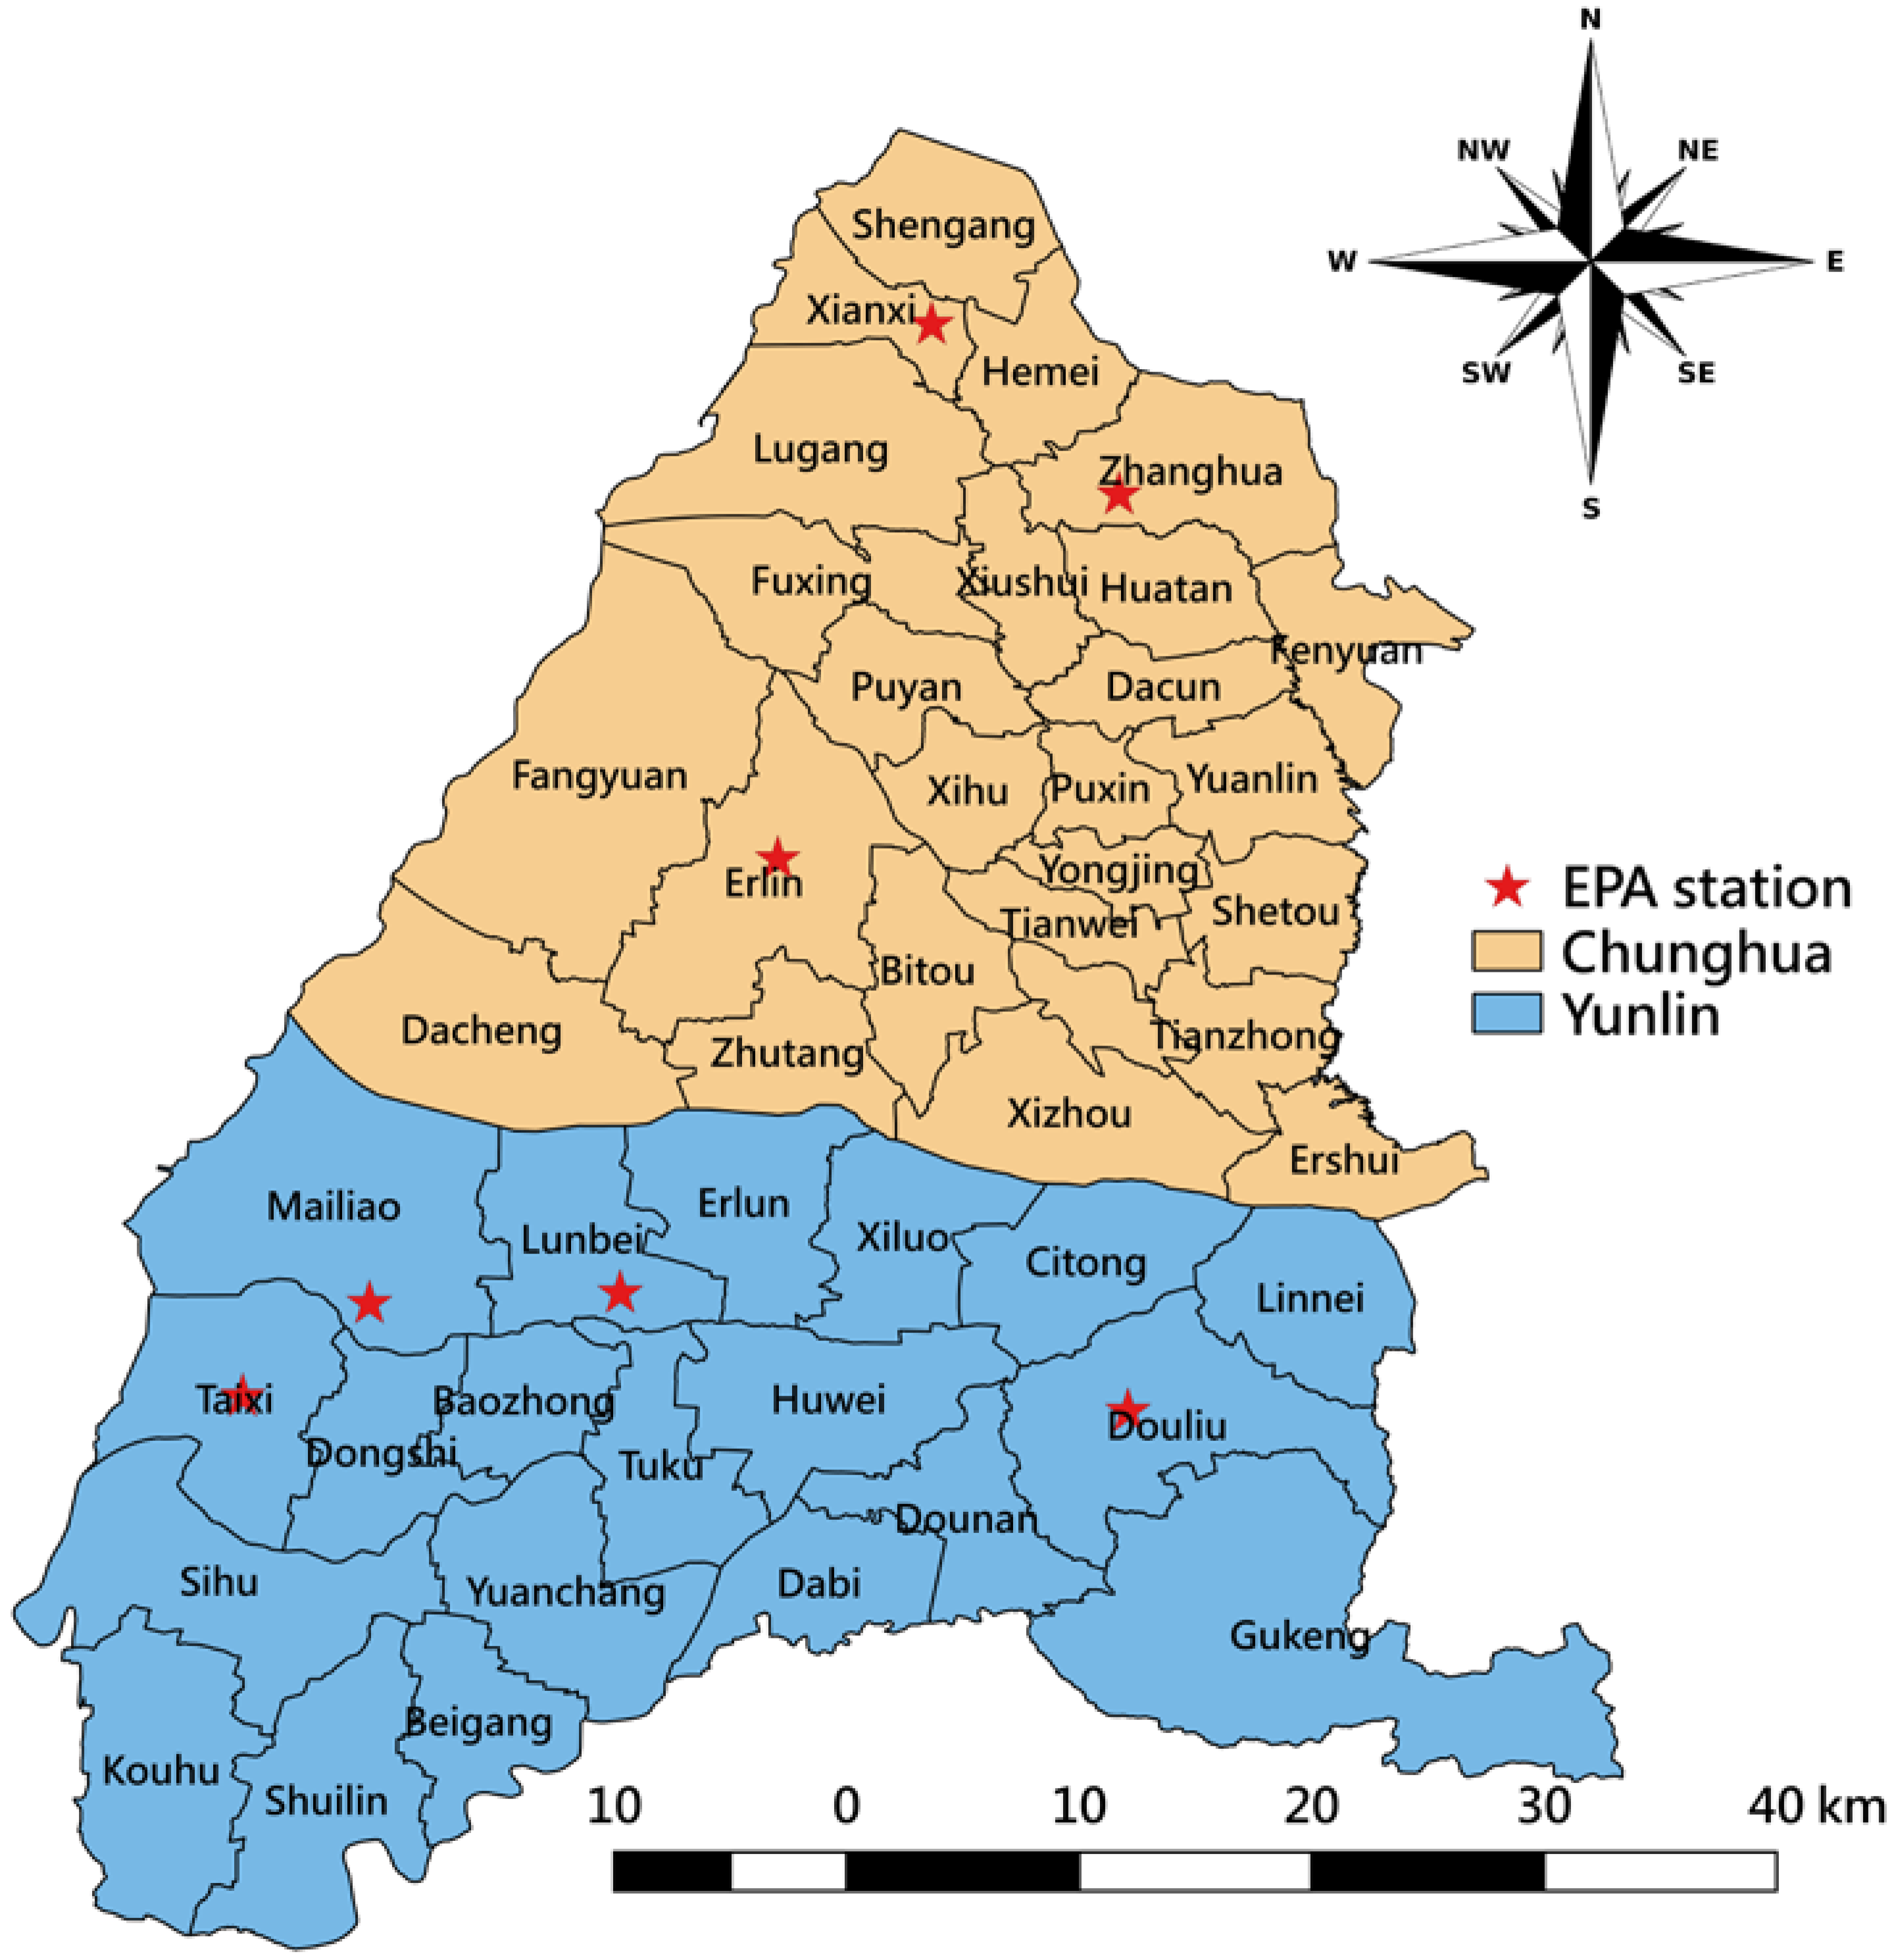
Figure 1. Map of the study area with 20 districts in Yunlin County and 26 districts in Changhua County. EPA = Environmental Protection Administration.
Ijerph 15 00829 g001
Figure 2. Trend plots of (a) daily PM2.5 concentration and (b) daily clinic visits for children’s asthma averaged by district from 2005 to 2010.
Ijerph 15 00829 g002
Figure 3. Geographical distribution of the (a) crude asthma visit rates (/100,000 children) and (b) daily average PM2.5 concentration (μg/m3) at the district level in Changhua County and Yunlin County from 2005 to 2010.
Ijerph 15 00829 g003
Figure 4. Transformed estimated cross-basis function for PM2.5: (a) The three-dimensional plot shows the variation of relative risk (RR) of children’s asthma along with PM2.5 concentration and lagged day; (b) The contour plot shows the hot spot of RR of children’s asthma in a coordinate of PM2.5 concentration and lagged day.
Ijerph 15 00829 g004
Figure 5. Overall relative risk and specific relative risk of children’s asthma with respect to selected PM2.5 concentrations and lagged days.
Ijerph 15 00829 g005
Figure 6. Maps for each district in Changhua County and Yunlin County according to the transformed estimated spatial function. Map (a) is the relative risk (RR) of children’s asthma from small (white) to large (red). Map (b) is the statistical significance of RR in each district determined by the 95% confidence interval, where black represents a significant RR < 1, white represents a significant RR > 1, and gray represents a nonsignificant RR.
Ijerph 15 00829 g006
Table 1. Characteristics of study variables.
Study VariablesChanghuaYunlin
MeanStandard deviationMeanStandard deviation
Children’s asthma cases3.037.944.7014.28
PM2.5 (μg/m3)37.2218.8737.2619.38
O3 (ppb)28.8910.0131.6810.67
SO2 (ppb)3.731.423.591.39
cPM (μg/m3)24.2017.8228.7621.00
CO/NOx (ppm/ppb)0.020.010.020.01
Temperature (°C)22.334.8521.874.69
Relative humidity (%)68.028.0069.677.09
FrequencyPercentFrequencyPercent
Wind direction
South15,37126.98%11,51026.27%
Southwest41647.31%22625.16%
West3070.54%2260.52%
Northwest1360.24%1620.37%
North11602.04%17143.91%
Northeast15,94427.99%11,18625.53%
East842914.80%707316.14%
Southeast11,45520.11%968722.21%
PM2.5 = fine particulate matter; O3 = ozone; SO2 = sulfur dioxide; cPM = condensable particulate matter; CO = carbon oxide; NOx = nitric oxide and nitrogen dioxide.
Table 2. Percentage change of relative risk (RR) in children’s clinic visits for asthma from 2005 to 2010.
VariableRR95% CIp-Value
Day of the Week
Sunday1.00Reference-
Monday2.07(2.04, 2.11)<0.0001
Tuesday1.75(1.72, 1.79)<0.0001
Wednesday1.71(1.68, 1.74)<0.0001
Thursday1.45(1.42, 1.48)<0.0001
Friday1.64(1.61, 1.67)<0.0001
Saturday1.74(1.71, 1.77)<0.0001
Wind direction
South1.00Reference-
Southwest1.00(0.97, 1.02)0.6907
West0.82(0.76, 0.89)<0.0001
Northwest0.89(0.82, 0.97)0.0076
North1.03(1.00, 1.06)0.0272
Northeast1.00(0.98, 1.02)0.9091
East1.00(0.98, 1.02)0.9532
Southeast1.00(0.99, 1.02)0.7150
RR%95% CIp-Value
Air pollutant
cPM1.42(1.01, 1.83)<0.0001
CO/NOx−3.16(−3.85, −2.46)<0.0001
SO21.25(0.43, 2.08)0.0028
O30.82(−0.07, 1.71)0.0704
Abbreviation: RR = Relative risk; RR% = Increased percentage of relative risk per interquartile range change; CI = Confidence interval.