1. Introduction
Indoor air quality (IAQ) problems in buildings are common in Finland. In 2015, construction works in Finland totalled about 1.5 million buildings, of which 51% were built before 1980. Their combined value was 17.1 billion €, and of this, renovation construction accounted for 6.8 billion € [
1]. The prevalence of significant mould and moisture problems in Finnish building stock has been estimated to be 2.5–26%, depending on the type of building. Cost estimates are 1.2–1.6 billion € [
2]. In addition to moisture and mould damage, several other factors and their interactions, such as material emissions [
3], ventilation deficiencies [
4] and system impurities [
5], outdoor and soil impurities [
6], human activities in the premises [
7] and indoor air (IA) temperature [
8] can cause IAQ problems and difficulties for occupants or employees. The ageing of building stock, neglectful maintenance, and building and planning errors are often the cause of IAQ problems and are associated with environmental complaints [
9]. Several studies have found that the problems reported in damaged and non-damaged buildings vary according to building types [
10,
11,
12,
13]. Different building-related and individual factors, as well as those in the psychosocial environment, affect reported IAQ [
14,
15,
16]. Thus, when examining IAQ problems, it is advisable to assess the problem from a wider perspective, also taking into account the experience of the users of the premises and the psychosocial environment [
10,
14,
15].
Several previous studies have convincingly created methods for identifying, classifying and predicting factors that indicate building IAQ problems [
17,
18,
19,
20,
21,
22,
23,
24]. In addition, computational, scientific and complex methods and indices have been created from the viewpoint of the building’s moisture and mould damage [
17,
19,
22,
25,
26,
27]. Many of these methods are complicated, and their applicability in the decision-making processes of IAQ is challenging. Several proactive or index-based methods have studied individual sources of IA pollutants and their concentrations, as well as indicators of the properties of the materials and building maintenance that directly or indirectly affect IAQ. The disadvantage of identifying an individual IAQ pollutant is that it does not constitute an overall assessment of the factors affecting IAQ. In these cases, the actual risk and the source of impurities, and their extent, severity and significance to IAQ cannot be concluded and hence, assessment of the impact on the health of the premises’ users is usually impossible. Data from a number of studies are based solely on the problems reported by the residents or users of the buildings, and lack researchers’ investigations and verification of damage in the building and the sources of impurity. A recently published study by Mendell and Kumagai [
28] found deficiencies in the methods of observation of building damage.
In order to assess the health significance and the urgency and extent of the measures, property owners, occupational health experts, and safety and healthcare professionals need comprehensive information on the buildings and on the sources and severity of the impurities. IAQ problems may also affect sick leave and work efficiency [
29,
30], and there is evidence that the repair of moisture and mould damage and the removal of contaminants from buildings reduce respiratory symptoms [
12,
31] and improve work efficiency and IAQ [
32]. Moreover, predictive property management has been estimated to reduce symptoms among premises users [
33]. When the extent and severity of IAQ problems are properly assessed, the degree, timing and possible prioritisation of measures can be successfully completed. Properly timed and targeted measures have important implications for the economy, health and well-being.
Previous studies have estimated that researcher surveys of buildings have been more reliable than the damage reports of residents themselves [
28,
34,
35]. It is rarely possible to detect microbial damage in structures through mere observation [
28]. Furthermore, measurement of IA contaminants often fails to demonstrate microbial damage in building materials [
36,
37]. Therefore, indicators of moisture and mould damage should be observed in the buildings [
38]. It is important to evaluate the structures from their moisture and thermal aspects, to make the necessary structural openings and to take samples from the structures that are assessed as being at risk and have indications of damage [
9,
39,
40]. A previous study has already determined that the natural ageing of coating materials and excessive moisture on structures causes microbial damage to materials [
41], which can also be considered in connection with moisture damage as an indicator of indoor microbial impurities [
7,
42]. It has been estimated that the classification of pollutants play an important role in assessing exposure in mould-damaged workplaces, and that mould growth in association with moisture damage could be a relevant criterion for the assessment of exposure [
43]. In this case, a pragmatic approach is needed for categorising the factors affecting IAQ as a whole and the urgency of the measures from the perspective of building health.
The aim of this study was to: (i) test and develop the use of a probability of an abnormal IA exposure assessment tool for determining the urgency for the measures from the perspective of building health; (ii) evaluate the relation between the probability of abnormal IA exposure results and workers’ perceived work environment and (iii) assess the relation between ventilation system deficiencies and the perceived work environment. The results did not enable far-reaching conclusions regarding sources of impurities in the building on the basis of employees’ experiences. According to the results, categorising tool can partly support the assessment of the urgency for repairs when several factors that affect IAQ are taken into account.
This paper uses the term probability of abnormal IA exposure, which means a comprehensive categorisation method for deficiencies in building and ventilation systems and other possible IA impurities that affect IAQ.
2. Materials and Methods
2.1. Materials
The data are from two research and development projects from 2013 to 2014 which investigated the buildings of two Finnish hospital districts. The cooperation agreement of the projects is governed by the obligation of confidentiality. This publication with analyses and writing was made between October 2016 to February 2018. Background information revealed that parts of the buildings had IAQ problems. The study investigated 27 buildings, totaling an area of about 130,000 m2, and focused on 111 building floors and hospital sections. The mean building year was 1963. The oldest building was built around the year 1902 and the newest in 2010. All the buildings were of stone in the form of massive brick, concrete or concrete elements with insulation, or different combinations of stone materials.
2.2. Building and Ventilation System Investigation
The systematic building investigations covered: (i) construction and architectural plan surveys; (ii) maintenance staff interviews; (iii) examinations and openings of high risk building constructions; (iv) moisture- and mould-damaged range and severity authentications (v) assessments of ventilation systems; (vi) assessments of air leaks from or through damaged constructions; (vii) assessments of air pressure differences; and (viii) assessments of other IA pollutants or pollutant sources in the buildings.
The condition of all the 27 hospital buildings and their floors (111) were investigated carefully and categorised on a scale of 1 to 4 (probability of abnormal IA exposure). Sixteen premises or floors were not in use. We did not categorise these premises, but we did investigate them and take into account the effect of the findings on the IAQ of the surrounding premises. In addition to the age of the ventilation systems, purity, sufficiency and pollution sources were assessed. The same IA researcher group conducted all the building investigations and ventilation system assessments. All the data were analysed by the same multi-professional group of experts, which comprised IA researchers, a construction engineer, an occupational health physician, a microbiologist, and a ventilation specialist.
The building’s technical investigations focused on verify mould and moisture damage and their extent, severity and range in the constructions and on observations of air leaks from or through a damaged construction. In addition, the occurrence of other relevant IA pollution from materials such as man-made vitreous fibres (MMVFs), damaged floor coatings and creosote was assessed, and asbestos was measured. Background information on the buildings included planning, investigation and renovation documents, as well as interviews of the maintenance personnel. The assessments of high-risk building constructions and ventilation systems were based on documents such as construction, ventilation and architectural plans, and required: (i) experimental and theoretical knowledge of heat and moisture transfer in structures and materials; (ii) details of air tight performances in construction joints; (iii) the constructions’ details, materials, sensitivity to moisture damage, and their location in the building; (iv) the typical time of construction and the construction materials used; (v) knowledge of well-known IA pollutants sources such as asbestos and creosote; (vi) details on the theoretical impact of the maintenance history and earlier repairs on the constructions’ functions; and (vii) background information on the ventilation systems and earlier repair and maintenance history.
All ventilation systems were inspected, and the focus was on their age, pollution sources, purity, and ventilation sufficiency. The aim was to detect and identify all significant sources of impurity on the premises. Microbial growth in the structures was primarily verified with microbial analyses, except for cases in which mould growth could be seen in materials or on surfaces. Samples were taken to detect surface moisture in floor and wall structures from nearly all the premises studied. More detailed measurements and sampling were carried out if there was uncertainty regarding the presence of an impurity source or if it was suspected but could not be visually identified. The measurement data will be published in a separate journal article.
2.3. Assessment of Probability of Abnormal IA Exposure
The tested method for assessing IA impurity sources and IAQ was based on Finnish authorities’ instructions [
44] The National Building Code of Finland [
45,
46] and earlier studies on the severity of mould and moisture damage [
7] and its significance for health [
28,
47,
48,
49].
First, the building investigation and ventilation system assessment results were studied and categorised as follows: (i) assessment of the extent and range of mould damage in the constructions (
Table 1); (ii) assessment of air leaks from or through damaged constructions and air pressure differences (
Table 2); (iii) assessment of ventilation systems and their impact on IA (
Table 3); and (iv) assessment of other IA pollutants from the building or from its use (
Table 4).
Second, categorised parameters were collected for the final assessment (
Table 5) of the probability of abnormal IA exposure. The final assessment was categorised into four levels: (1) probability of abnormal IA exposure unlikely; (2) probability of abnormal IA exposure possible; (3) probability of abnormal IA exposure likely; and (4) probability of abnormal IA exposure very likely.
The final assessment of probability of abnormal IA exposure is presented in
Table 1 and
Table 2 in accordance with
Table 5. The predominant IA impurity source was a determining one. In cases of moisture and mould damage, air leaks through or from damage to IA must be looked at simultaneously with indoor negative pressure. The impact and extent of the problem and the impurity source must always be taken into account in the assessment. For example, the whole building is not in category very likely if the impurity sources are only in the basement and they are not influencing to the upper floors. The ventilation systems’ impact on IA (
Table 3) and the IA measurement results were evaluated at the same time with the final assessment of the probability of abnormal IA exposure (
Table 5).
2.4. Measurements and Sampling in Buildings
In building and IAQ measurements and interpretation of measurement results we followed the Finnish national instructions to the monitoring of health-related conditions of housing and other residential buildings [
44]. Microbial growth in the structures was primarily verified with microbial analyses, except for cases in which mould growth could be seen in materials or on surfaces. Materials microbial growth and contamination were verified with microbial analyses in according to ISO 16000-19 [
51]. Structural humidity and incision moisture measurements between floor surfaces and concreate were measured with Vaisala HMI41, HMP42, HMP40 devices (Vaisala Oy, Vantaa, Finland). Surfaces moisture detection were measured with Moisture Encounter Plus (Tramex Ltd., County Wicklow, Ireland) and Gann Hydrometer RTU600, B50 (Gann Mess-u., Regeltechnik GmbH, Gerlingen, Germany). Measurements were conducted concreate or other materials humidity in accordance with the Finnish guidance for concrete floor structures, moisture management and coating [
52]. Sampling of asbestos were made according to ISO 16000-7 standard [
53]. Volatile organic compound (VOC) sampling were carried out according to ISO 16000-6 standard [
54]. The air flow tester (Dräger smoke, Drägerwerk AG & Co., Lübeck, Germany) were used to visualize air flows, rates and pressure. Ventilation rates and the carbon dioxide content were measured in according to ISO 16000-26 standard [
55]. Room temperature and indoor air humidity and air pressure differences were measured (Swema 3000d, Swema AB, Stockholm, Sweden) if needed and measured in according to SFS-EN 12599 standard [
56].
2.5. Employees’ Experience of Indoor Air Quality
To study the employees’ experiences of the work premises, validated and frequently used IA questionnaire was used, which is based on Örebro’s [
57] indoor climate questionnaire [
11,
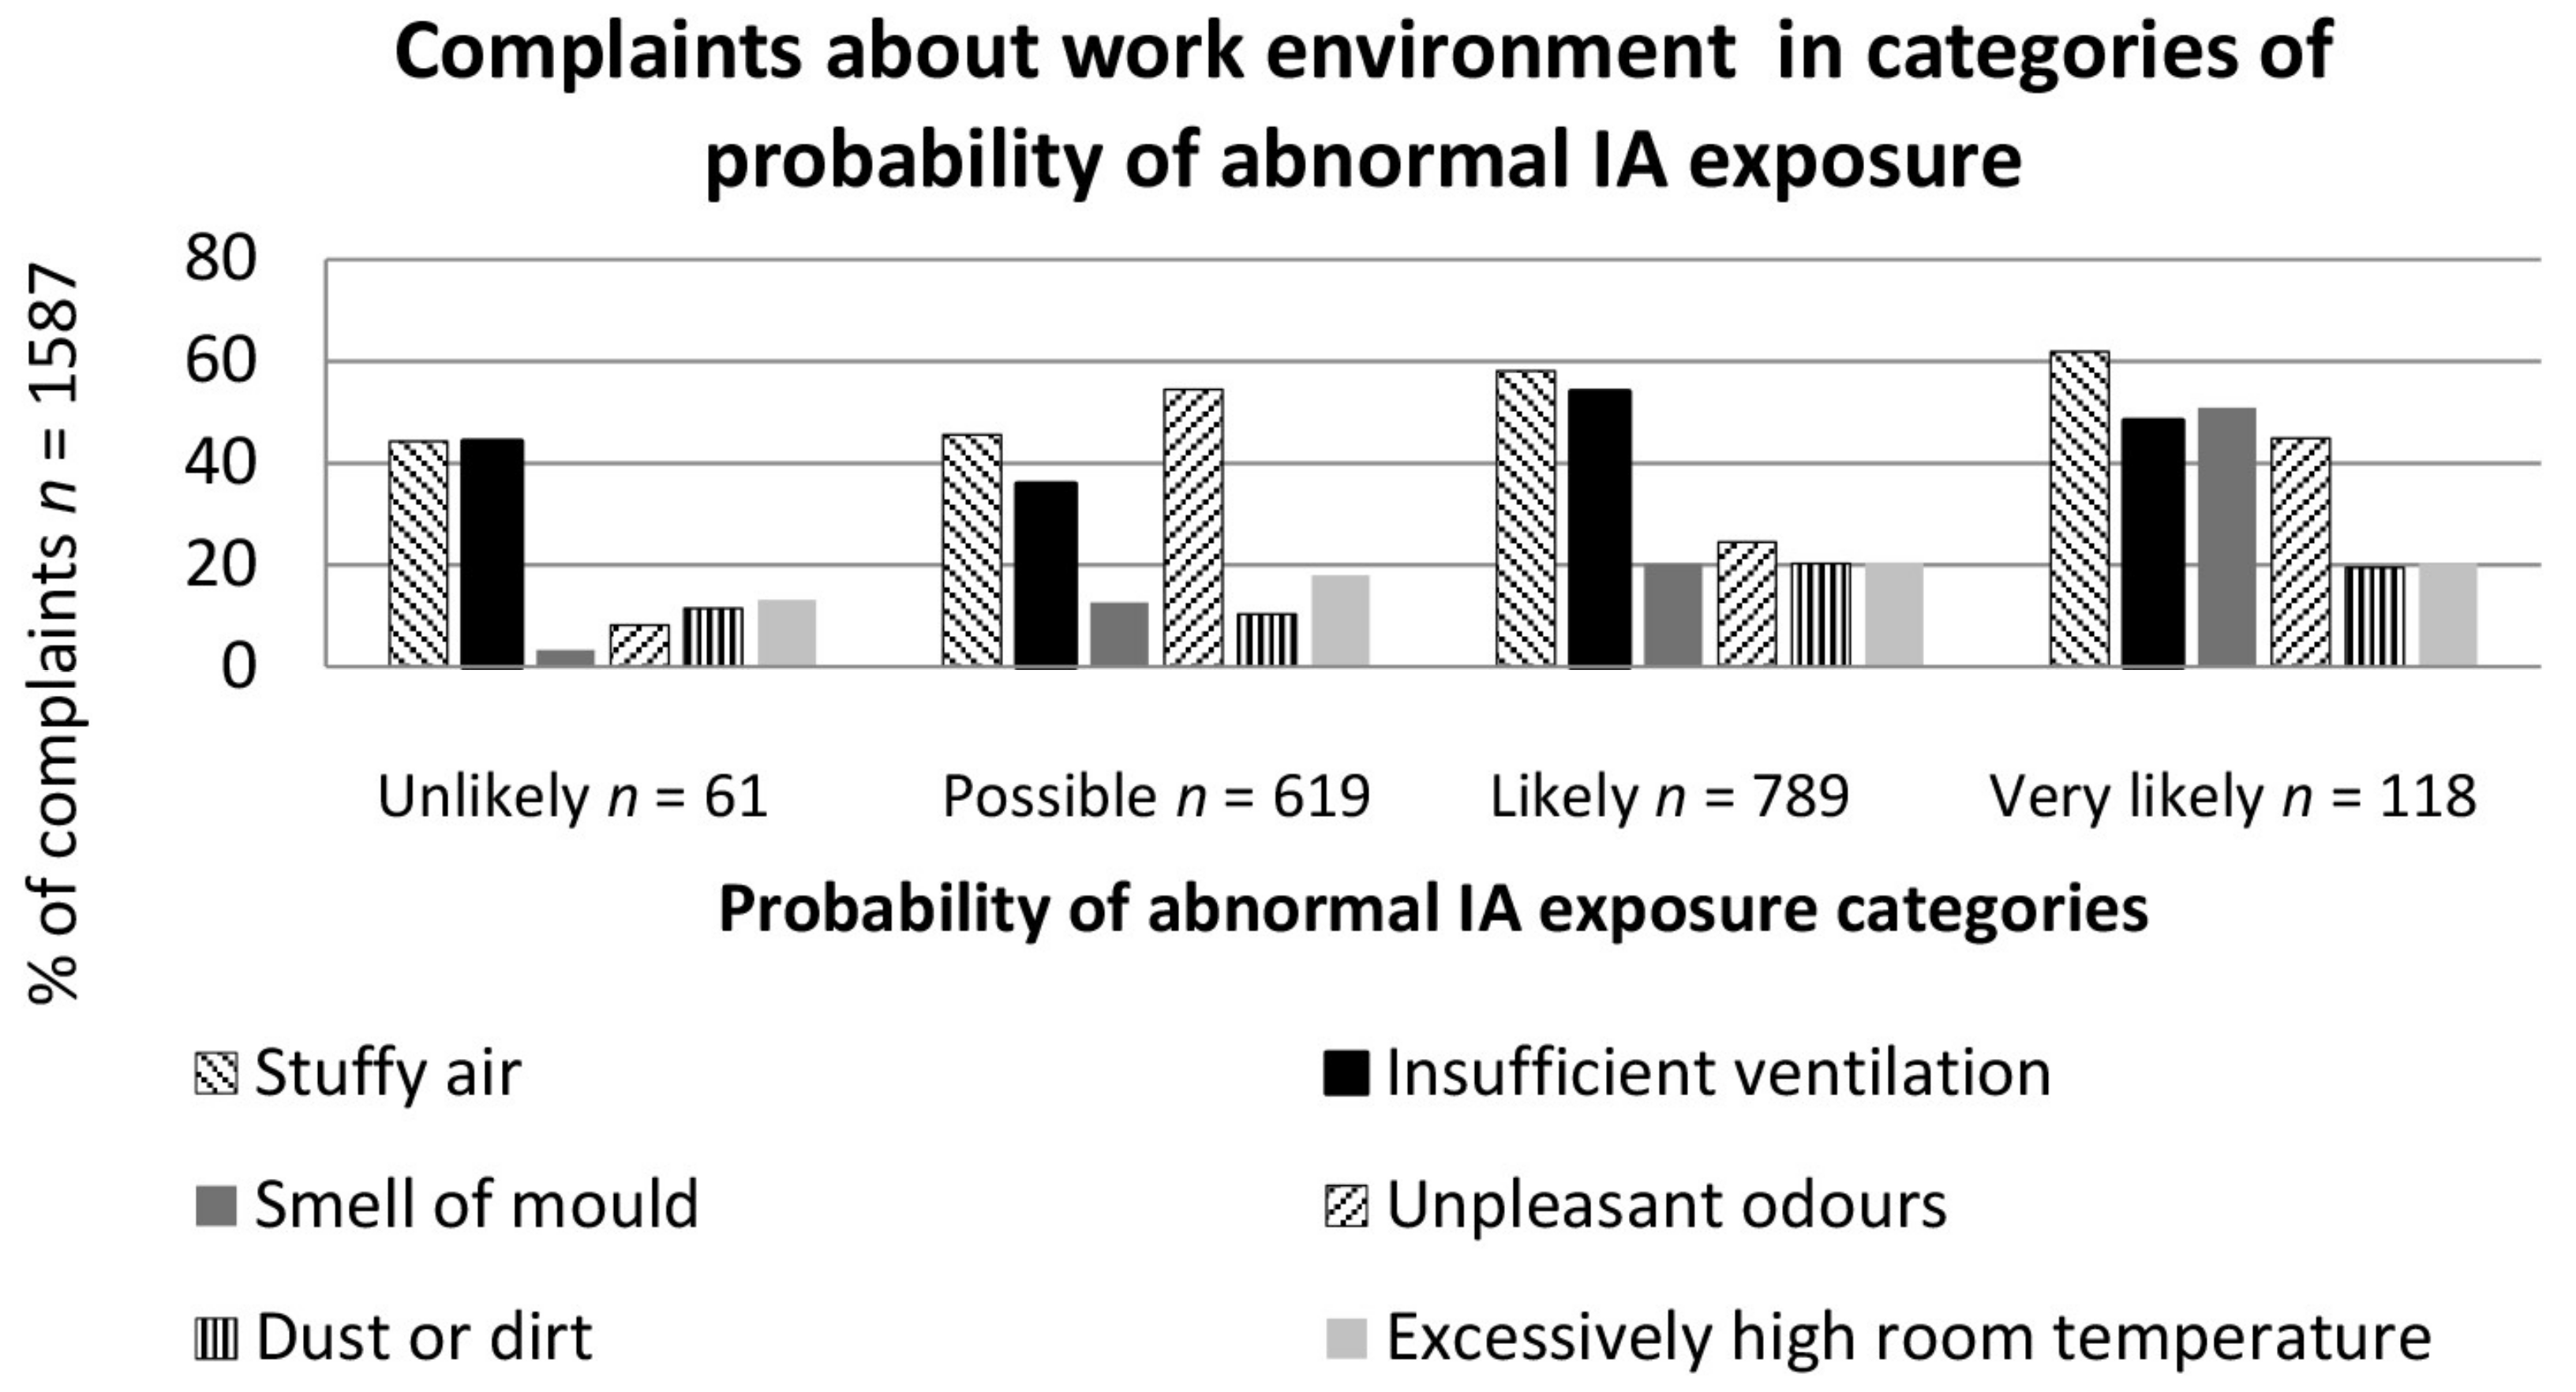
58]. The questionnaire was sent to 3608 hospital employees, of whom 2669 responded. The total response rate was 74% with a range of 51 to 93%. The IA questionnaire groups comprised employees working in the same workspaces in the same building and under technically similar circumstances. Forty IA questionnaire groups were selected for this study, totalling 1587 respondents. One selection criterion was that the IAQ groups should be in such premises in which a probability of abnormal IA exposure assessment had been performed. Cases in which the questionnaire had been carried out among employees in the whole building as one group, and in which the probability of abnormal IA exposure assessment concerned different sections of the building, were excluded. This is a questionnaire based study, in which participation was voluntary and since there was no intervention on individuals, the Finnish legislation does not require ethics committee handling.
2.6. Statistical Analyses
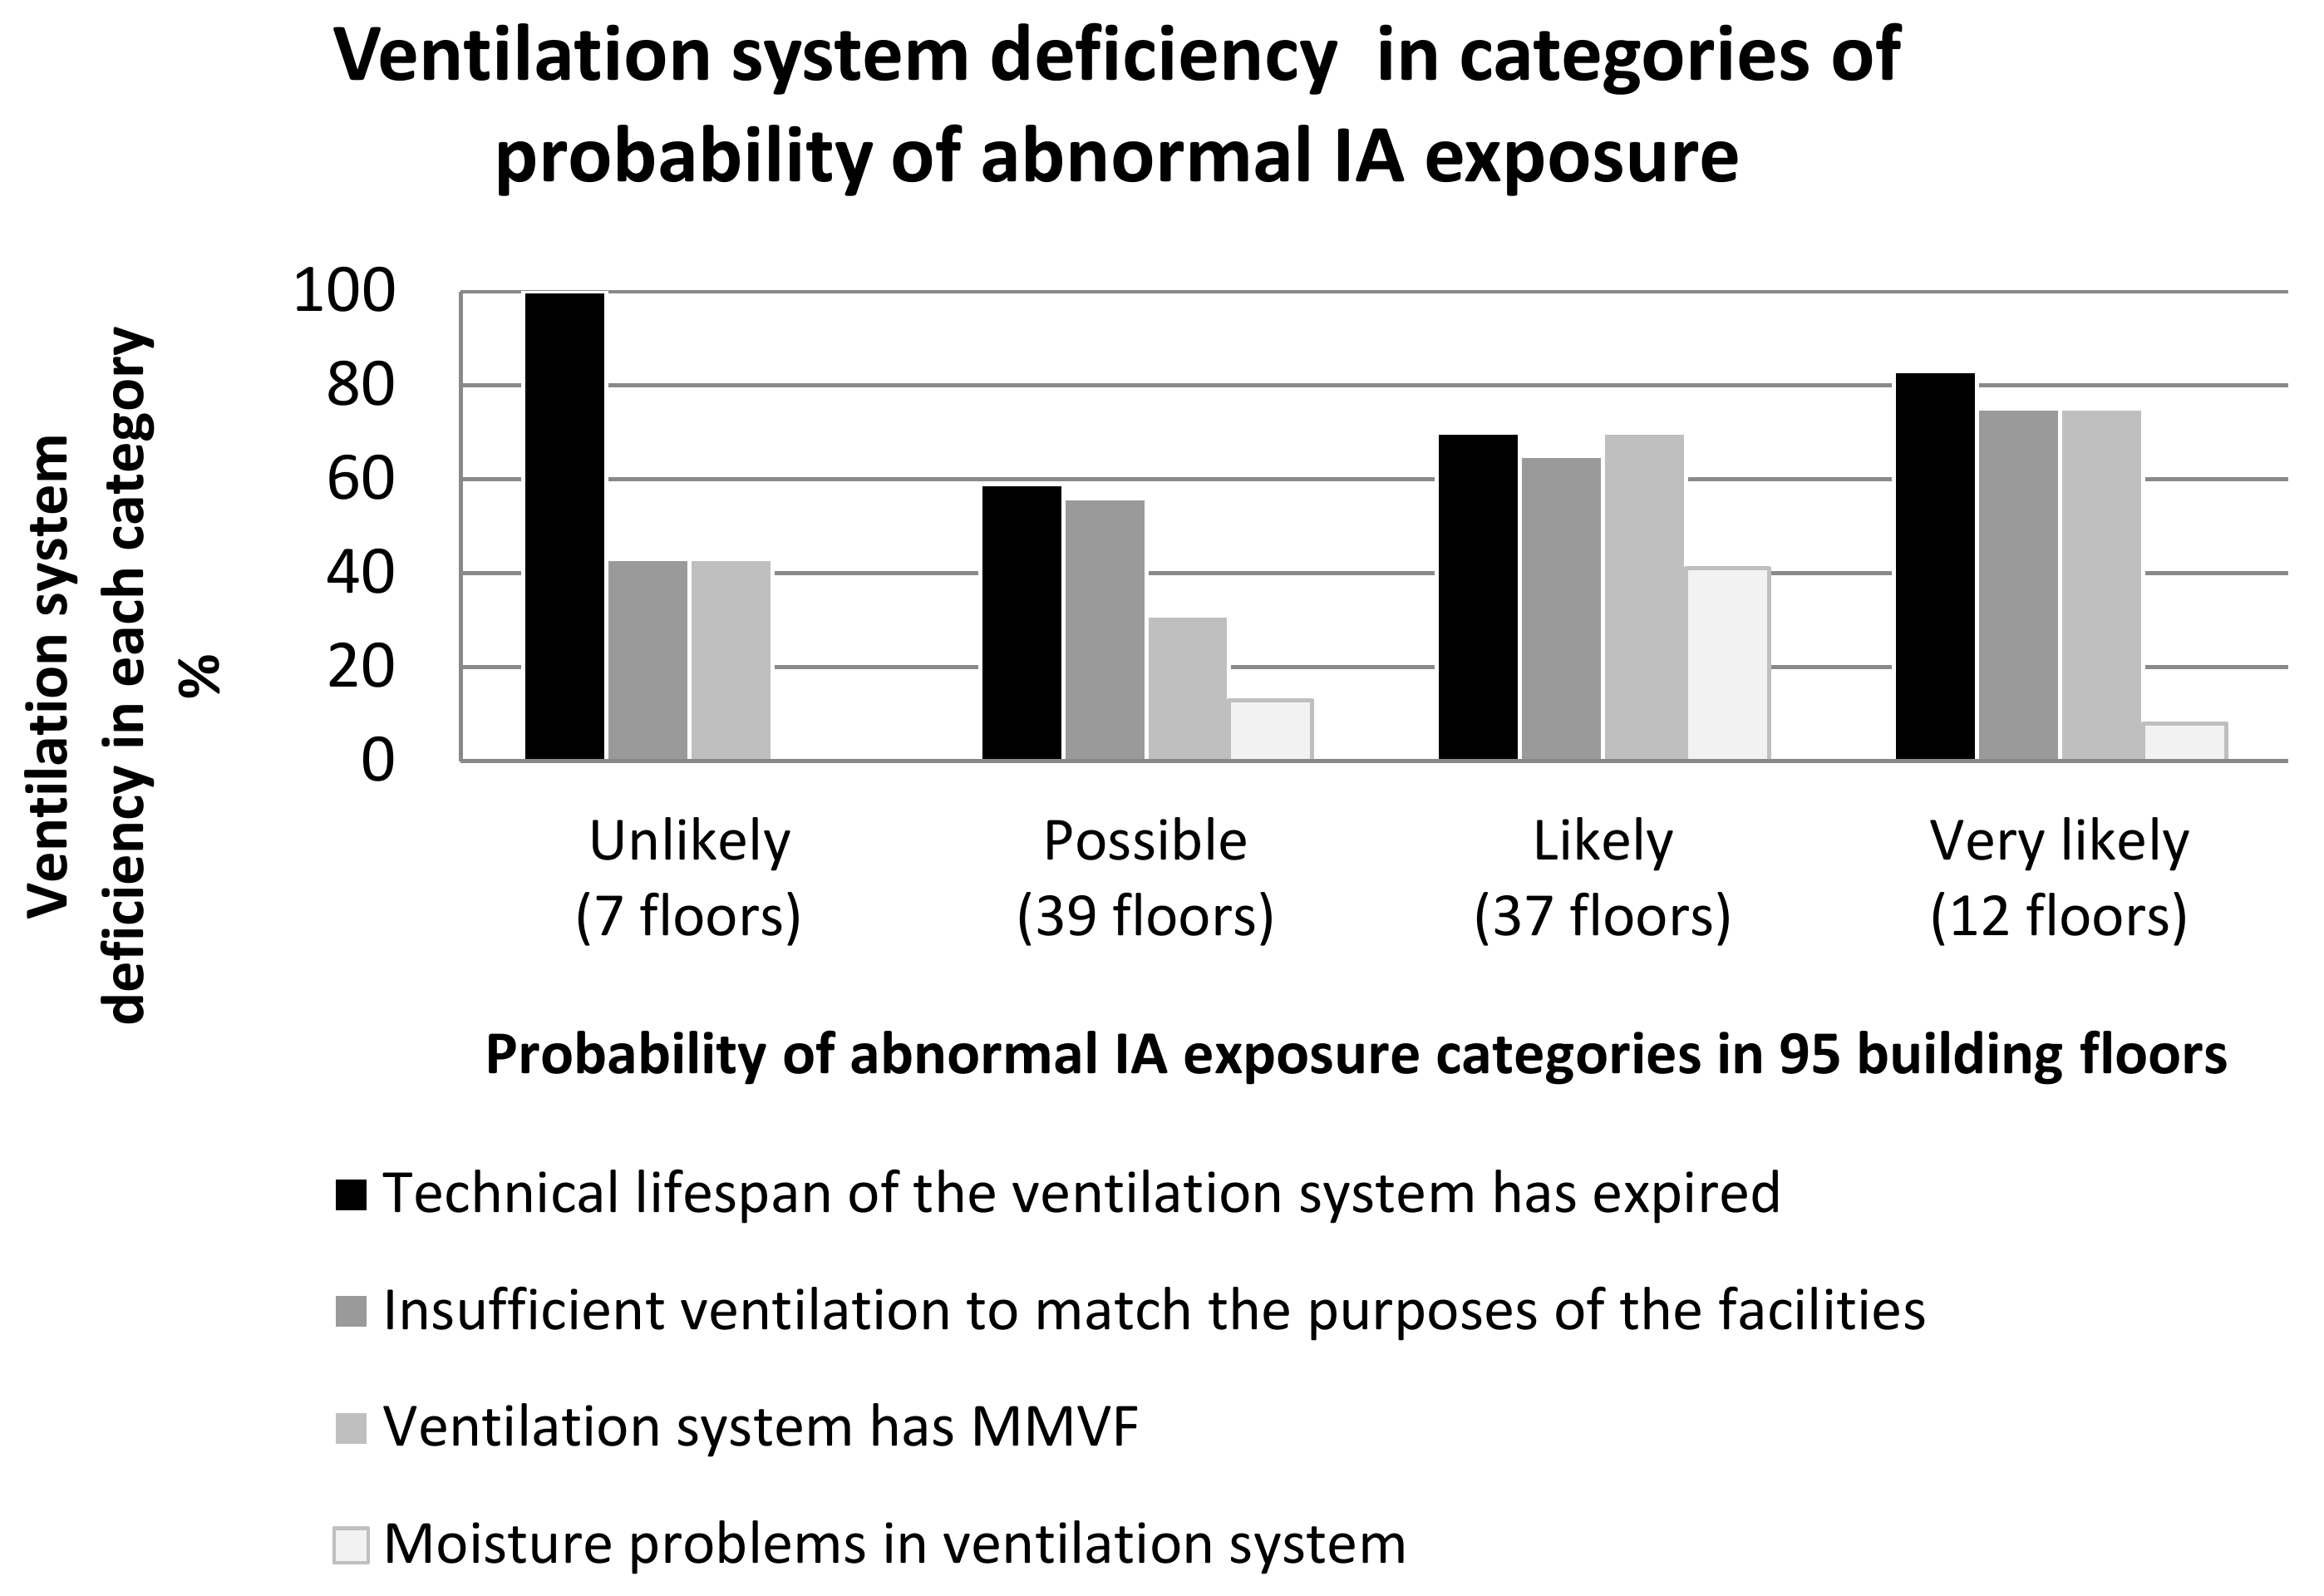
Statistical analyses were carried out using IBM SPSS Statistics program 24.0 (SPSS Finland Oy, Espoo, Finland) with a statistically significant level of p < 0.05. The statistical analysis used weighted averages of group response rates. The Mann-Whitney U test studied the differences between the probability of abnormal IA exposure categories (unlikely, possible, likely and very likely) and the employees’ complaints about their work environment. This test also compared the difference between two groups ‘yes’ and ‘no’ (categorised according to building investigations findings) ventilation adequacy, ventilation MMVF sources, ventilation moisture problems, and ventilation lifespan having expired and employees’ complaints about their work environment.
4. Discussion
This was the first study in Finland to use a comprehensive, systematic method of categorising impurity sources from buildings and their impact on IAQ. We know of no previous studies that have as extensively taken both building technology and ventilation-related factors that affect IAQ into account.
The strength of this research was its systematic and comprehensive building surveys, which were carried out by researchers, and IAQ questionnaires for the users of the premises. The IAQ questionnaire group division followed the same distribution as the assessment of probability of abnormal IA exposure. The employees did not know the results of the assessment of probability of abnormal IA exposure prior to responding to the IAQ surveys, which contributes to the reliability of the study.
The results support previous observations of the connection between the age and moisture of a building and mould [
59]. The building stock of the research was mostly over 50 years old. The technical lifespan of the building materials used had already been exceeded, which had led to deterioration of the technical properties of the structures and allowed moisture access to structures.
Knowledge of building physics and materials technology and construction techniques have changed over the decades in Finland. Therefore, the plans, building materials and building implementations of buildings aged over 50 years, which were the object of this study, are also often risky [
9]. In the surveyed buildings, more than 50% of the examined building floors had extensive microbial or moisture damage in one or two building blocks. Earlier repairs to the buildings had not generally taken into account the sources of the contaminants inside the structures or the connections between these sources and the IA and the airtightness of the structures, which had resulted in the presence of contaminants in even refurbished buildings.
According to the results, workers perceived mould odour in the same parts of the building as those in which the IAQ researcher made the mould odour observations and premises or where the floor of the building had extensive moisture and or mould damage. These results support earlier studies in that the mould odour and moisture damage were connected [
17,
26,
28,
60]. Several studies have found that asthma and respiratory symptoms are linked to moisture and mould damage in buildings [
28,
47,
48,
59]. Among qualitative indicators of dampness and mould, mould odour has the strongest associations with health effects [
61]. Thus, mould odour observations by the users of premises should always be taken seriously and should lead to more detailed studies to determine the origin of the odour.
In previous studies, inadequate ventilation has associated with poor IAQ [
62,
63,
64,
65,
66,
67]. This supports the results of this research. Employees experienced the most dissatisfaction with weekly inadequate ventilation and the second most dissatisfaction with stuffy air. The worse the probability of abnormal IA exposure was estimated to be, the more problems and impurity sources appeared in the ventilation system. On the basis of the results, the poor condition of a building also indicates deficiency in ventilation. Employees also experienced inadequate ventilation even in the premises in which the IA researcher had assessed the ventilation as adequate for the use of the premises. However, it must be taken into account that there was extensive mould damage to the structures in these areas which may also have impact to the experience of poor IAQ. Previous research has found similar results [
13], estimating that building mould damage increases the perception of stuffy air. MMVF in the ventilation system may cause the presence of particulate fibres both in IA and on surfaces, and may cause upper respiratory irritation and skin symptoms among the users of the premises [
3,
63,
68,
69]. This study found a relation between the presence of MMVF sources in the ventilation system and the perceived IAQ. It also found an association between the age of the ventilation system and the perceived IAQ. Therefore, on the basis of the work environment observations of the users of the premises, it is not possible to distinguish problems in IAQ when the ventilation system is an MMVF source and the system has exceeded its technical lifespan. As ventilation deficiencies were also observed in premises in which the probability of abnormal IA exposure was assessed as being likely or very likely, the experience of the users of the premises could be due to inadequate ventilation and stuffy air from a lack of ventilation and or other sources of IA pollutants in the premises.
As a whole, it seems that the more IA impurity sources that were found in the building, the more the users of the premises experienced poor IAQ. There were no statistical differences between the probability of abnormal IA exposure categories and perceived IAQ, but when the probability of abnormal IA exposure categories was considered higher (more abnormal), there were more work-related complaints. The results of this research on the work environment survey may not be unambiguous, because many factors can be influenced by a person’s experience [
10,
16,
70,
71] and experiences may differ from one person to another. The results of this research suggest an agreement between the mouldy odour found by inspectors and that experienced by employees working in the premises. Other IAQ questions on the questionnaire may leave more room for interpretation.
The probability of abnormal IA exposure method was used to systematically and objectively rank the results of the building investigations and the other factors influencing the IA in an overall assessment. The method only describes factors affecting the IA conditions of the building; it does not describe the implications of risk assessment, such as the severity of harm or the symptoms of the premises users. In addition, the method is very pragmatic and is always based on strong technical expertise in building technology and IA. The criteria for the probability of abnormal IA exposure are guidelines only, which means that the assessment also involves a researcher’s subjective view. All IA pollutants cannot be measured and for many IA pollutants, no health-based limit values have been set for non-industrial buildings [
28,
48]. However, although the method depends on the researcher’s competence and interpretation, and the model is partly based on national guidelines, it is nevertheless a pragmatic tool and a good basis for further developing the categorised exposure scenario.
Workplaces may also have other factors that affect the perceived indoor environment, and individual factors may also play a role. Thus, perceptions of the work environment are not directly proportional to the identified technical findings in buildings and in IAQ [
16]. The results did not suggest significant enough associations between the probability of abnormal IA exposure categories and perceived IAQ, hence this research does not assert the validation of the method.


