A Review of Recent Advances in Research on PM2.5 in China


Abstract
:1. Introduction
2. Sources of PM2.5
2.1. Sources of PM2.5 in Urban Atmosphere
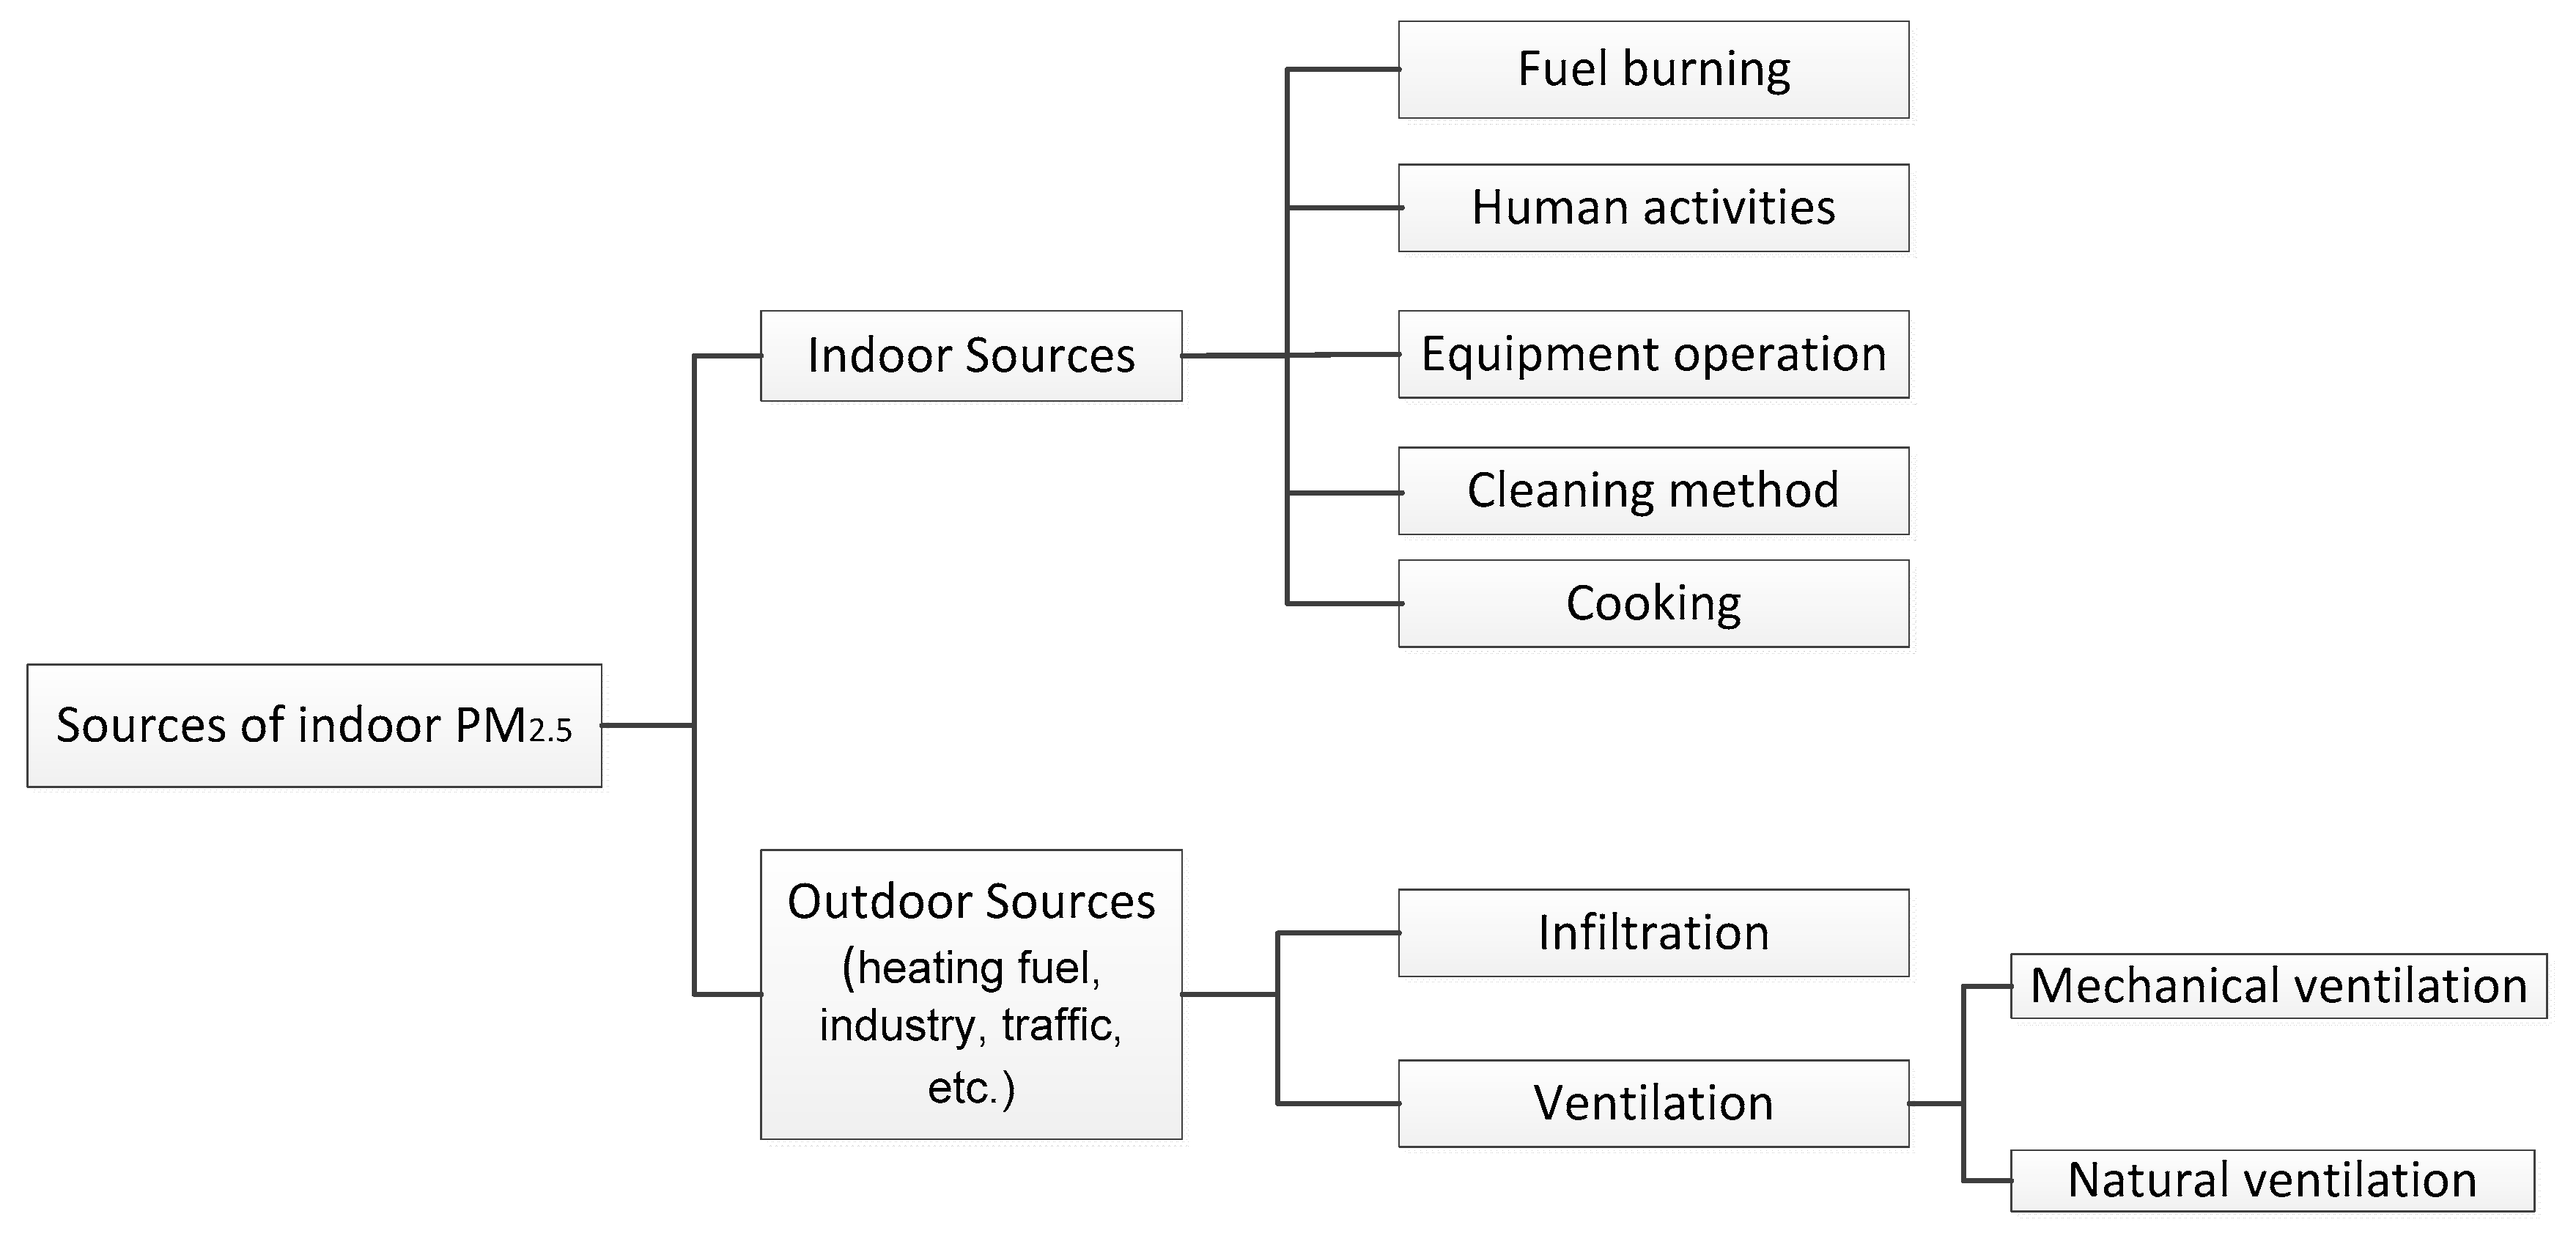
2.2. Sources of Indoor PM2.5
2.2.1. Outdoor Sources
2.2.2. Indoor Sources
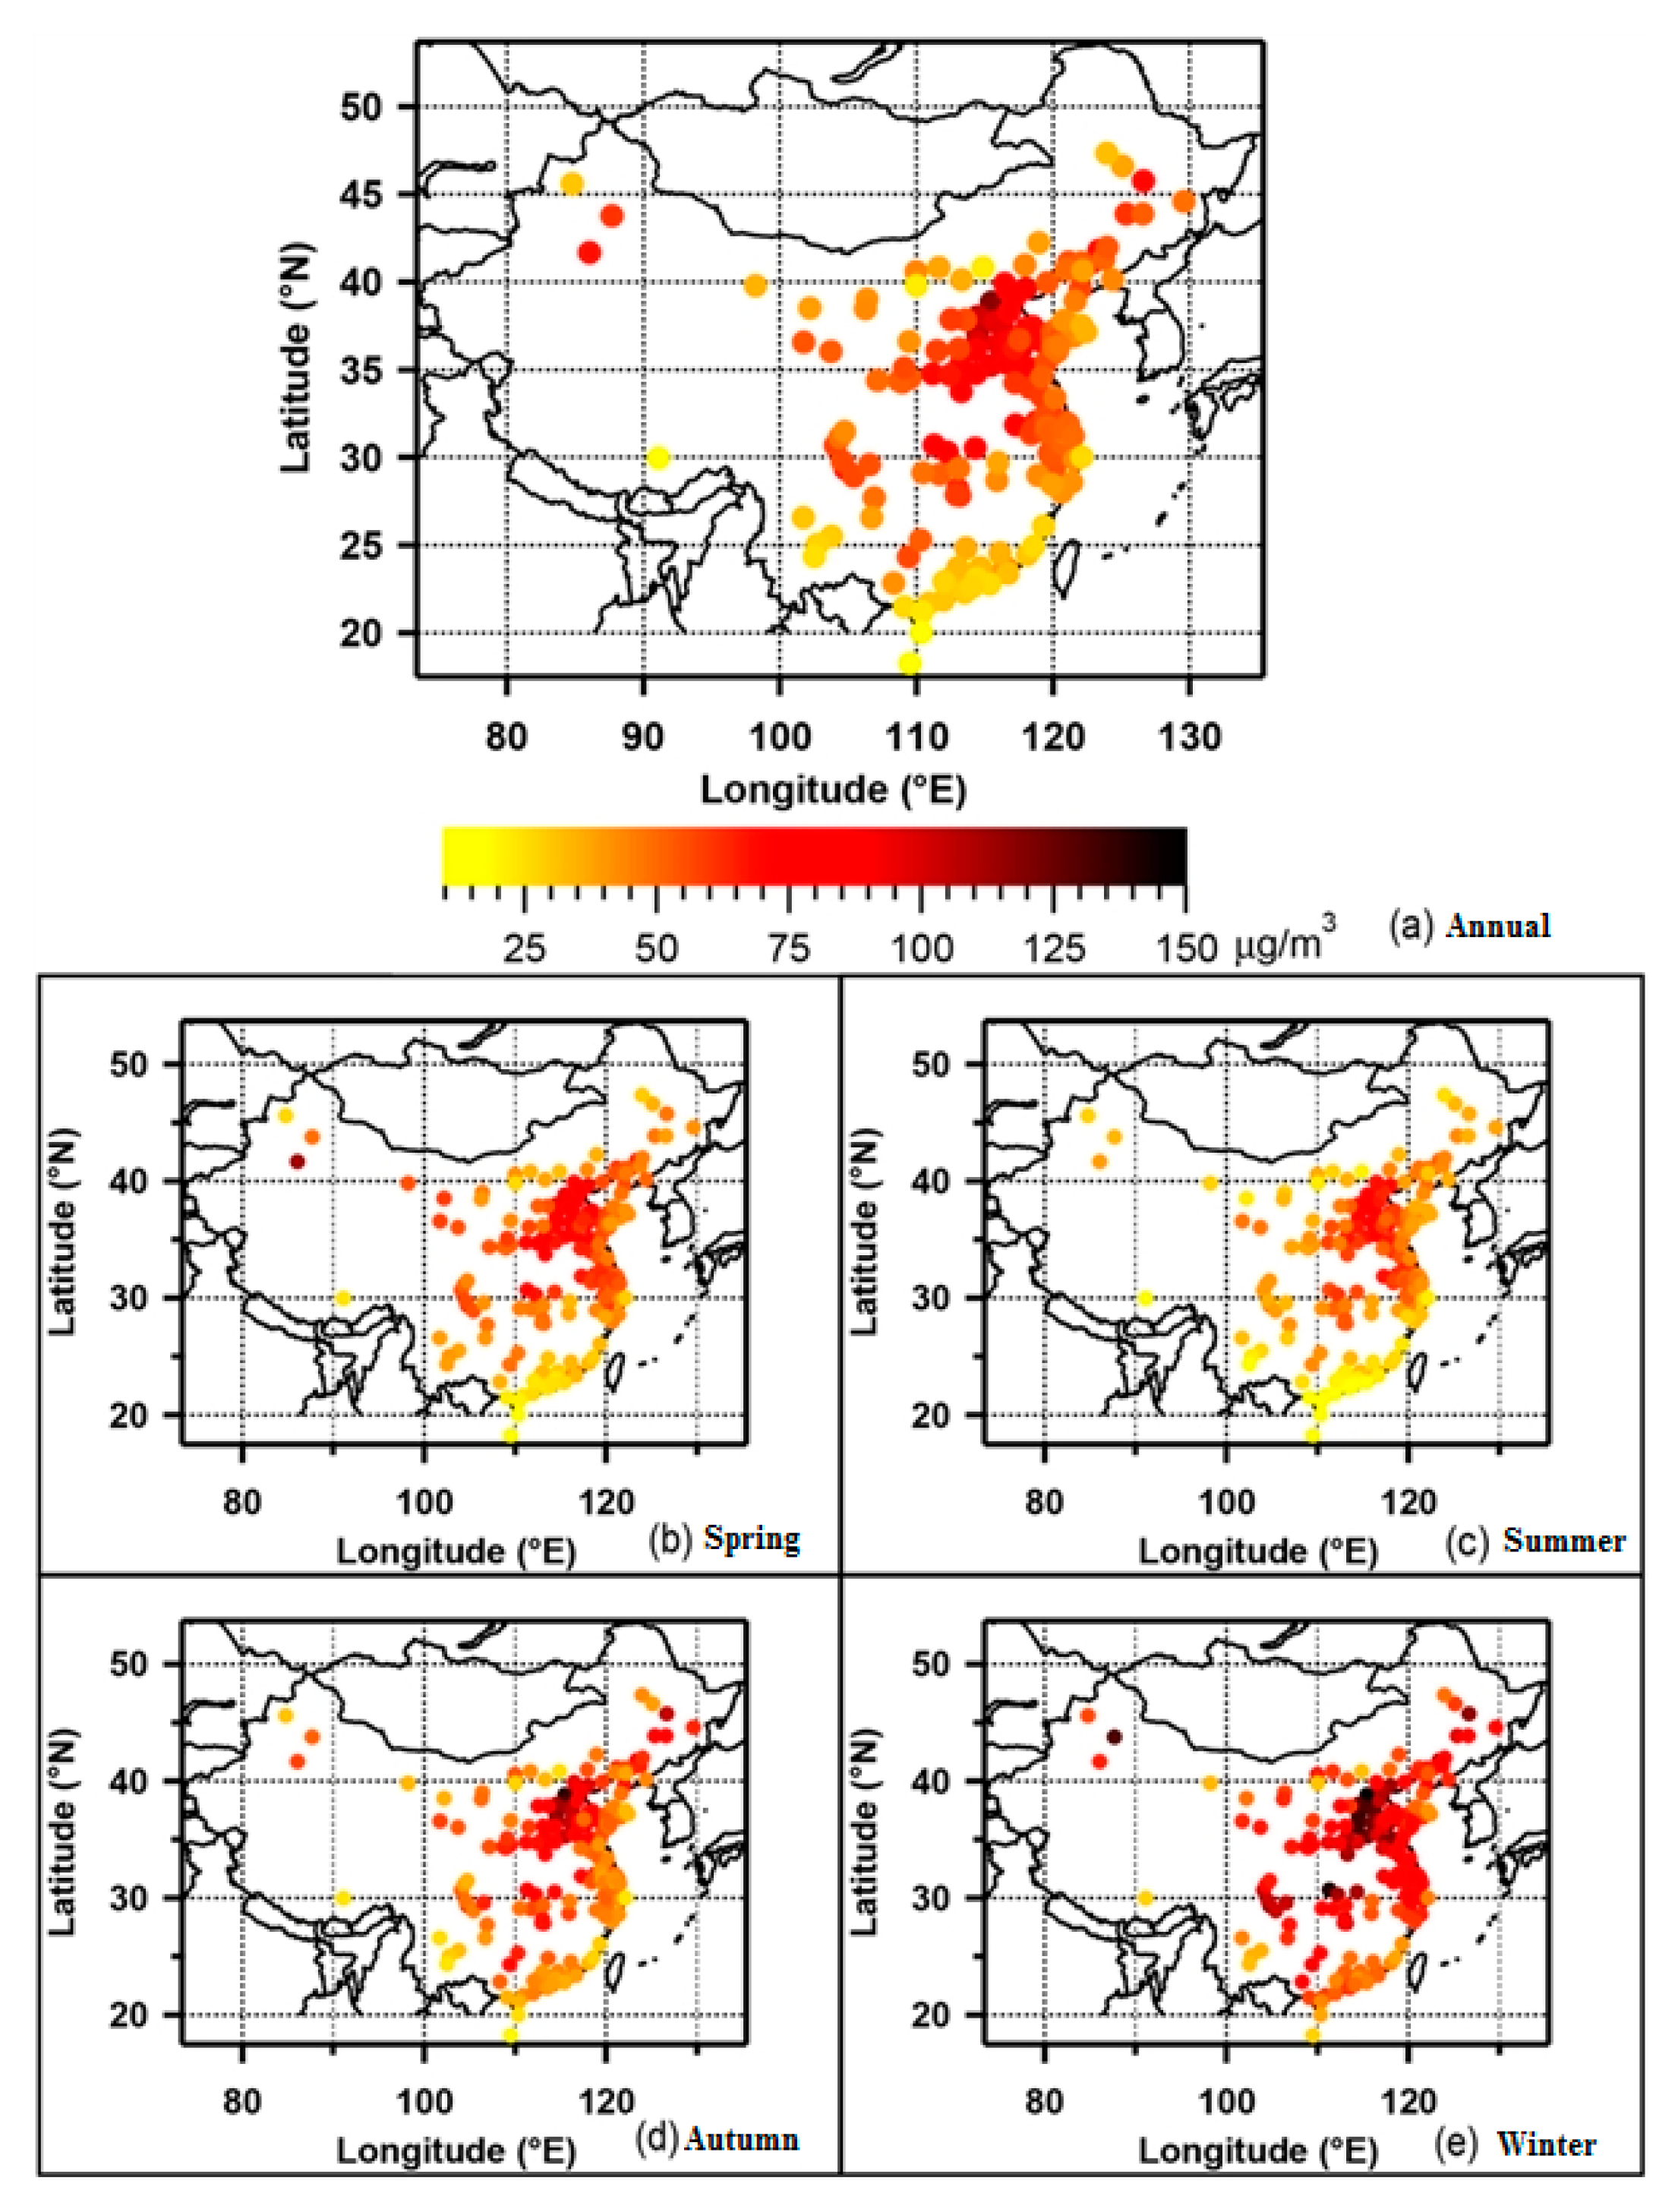
2.3. PM2.5 Reginal Variations
2.4. Impact of Meteological Factors on PM2.5 Variations
3. Various Impacts of PM2.5 Pollution
3.1. Impacts on Atmospheric Visibility
3.2. Impacts on Regional Climate
3.3. Impact on Human Health
3.4. Impact on Human Behavior
4. Indoor and Outdoor PM2.5 Relationship
4.1. Current Indoor PM2.5 Pollution Status
4.2. Ease of Indoor Environment Contaminated by Outdoor PM2.5
4.2.1. I/O Ratio
4.2.2. Penetration Coefficient
5. Indoor PM2.5 Control
5.1. Air Filter and Air Conditioner Combination
5.2. Development of New Material for Air Filters
5.3. Anti-Haze Room Air Conditioners Available in the Market
6. Conclusions
Acknowledgments
Author Contributions
Conflicts of Interest
References
- Zhang, S.; Wang, Y.; Li, Y.; Zhang, P. Spatial distribution of haze pollution and its influencing factors. China Popul. Resour. Environ. 2017, 27, 15–22. [Google Scholar] [CrossRef]
- Ministry of Environmental Protection of the People’s Republic of China. Bulletin on Environmental Conditions in China in 2015. Available online: http://www.mep.gov.cn/hjzl/zghjzkgb/lnzghjzkgb/201606/P020160602333160471955.pdf (accessed on 19 December 2017).
- Ministry of Environmental Protection of the People’s Republic of China. Bulletin on Environmental Conditions in China in 2016. Available online: http://www.mep.gov.cn/hjzl/zghjzkgb/lnzghjzkgb/201706/P020170605833655914077.pdf (accessed on 19 December 2017).
- Liang, Z.; Ma, M.; Du, G. Comparison of characteristics and trend analysis of atmospheric pollution in Beijing–Tainji–Shijiazhuang during 2003–2012. Environ. Eng. 2014, 12, 76–81. [Google Scholar]
- Zhang, Y.L.; Cao, F. Fine particulate matter (PM2.5) in China at a city level. Sci. Rep. 2015, 5, 14884. [Google Scholar] [CrossRef] [PubMed]
- Yang, F.; Ma, Y.; He, K. Research on General Situation of PM2.5. World Environ. 2000, 4, 32–35. [Google Scholar]
- WHO. WHO’s Urban Ambient Air Pollution Database 2016. Available online: http://www.who.int/phe/health_topics/outdoorair/databases/who-aap-database-may2016.xlsx (accessed on 10 December 2017).
- US EPA. National Ambient Air Quality Standards (NAAQS). Available online: https://www.epa.gov/sites/production/files/2015-02/documents/criteria.pdf (accessed on 24 December 2017).
- Australian Government, Department of the Environment and Energy. Ambient Air Quality Standards. Available online: http://www.environment.gov.au/protection/air-quality/air-quality-standards (accessed on 24 December 2017).
- WHO. WHO Air Quality Guidelines for Particulate Matter, Ozone, Nitrogen Dioxide and Sulfur Dioxide. Available online: http://apps.who.int/iris/bitstream/10665/69477/1/WHO_SDE_PHE_OEH_06.02_eng.pdf (accessed on 24 December 2017).
- European Commission. Air Quality Standards. Available online: http://ec.europa.eu/environment/air/quality/standards.htm (accessed on 24 December 2017).
- National Environment Agency. Air Quality and Targets. Available online: http://www.nea.gov.sg/anti-pollution-radiation-protection/air-pollution-control/air-quality-and-targets (accessed on 24 December 2017).
- Ministry of the Environment, Government of Japan. Environmental Quality Standards in Japan—Air Quality. Available online: http://www.env.go.jp/en/air/aq/aq.html (accessed on 24 December 2017).
- Ministry of Environment, Forest, and Climate Change, Government of India. National Ambient Air Quality Standards Central Pollution Control Board Notification. Available online: http://www.moef.nic.in/sites/default/files/notification/Recved%20national.pdf (accessed on 24 December 2017).
- Department of Science, Technology and Standards, Ministry of Environmental Protection of the People’s Republic of China. Ambient Air Quality Standards. Available online: http://kjs.mep.gov.cn/hjbhbz/bzwb/dqhjbh/dqhjzlbz/201203/W020120410330232398521.pdf (accessed on 24 December 2017).
- Wu, G.; Hu, W.; Teng, E.; Wei, F. PM2.5 and PM10 pollution level in the four cities in China. China Environ. Sci. 1999, 2, 133–137. [Google Scholar]
- Wang, W.; Tang, D.; Liu, H.; Yue, X.; Pang, Z.; Ding, Y. Research on Current Pollution Status and Pollution Characteristics of PM2.5 in China. Res. Environ. Sci. 2000, 13, 1–6. [Google Scholar] [CrossRef]
- He, K.; Yang, F.; Ma, Y.; Zhang, Q.; Yao, X.; Chan, C.K.; Cadle, S.; Chan, T.; Mulawa, P. The characteristics of PM2.5 in Beijing, China. Atmos. Environ. 2001, 35, 4959–4970. [Google Scholar] [CrossRef]
- Yang, F.; He, K.; Ma, Y. Chemical characteristics of PM2.5 species in Beijing ambient air. J. Tsinghua Univ. Nat. Sci. Ed. 2002, 42, 1605–1608. [Google Scholar]
- Huang, L.; Wang, G.; Wang, H.; Gao, S.; Wang, L. Pollution level of the airborne particulate matter (PM10, PM2.5) in Nanjing City. China Environ. Sci. 2002, 22, 334–337. [Google Scholar] [CrossRef]
- Wang, H.; Wang, G.; Gao, S.; Wang, L. Characteristics of atmospheric particulate pollution in spring in Nanjing City. China Environ. Sci. 2003, 23, 55–59. [Google Scholar] [CrossRef]
- Yang, F.; He, K.; Ma, Y.; Chen, X.; Cadle, S.H.; Chan, T.; Mulawa, P.A. Characteristics and Sources of Trace Elements in Ambient PM2.5 in Beijing. Environ. Sci. 2003, 24, 33–37. [Google Scholar] [CrossRef]
- Jian, Z.; Song, W.; Zhou, X.; Zhang, Y. Study on mouse pulmonary acute injury induced by air-borne PM2.5. J. Hyg. Res. 2004, 33, 264–266. [Google Scholar]
- Dong, C.; Song, W.; Shi, Y. Study on the oxidative injury of the vascular endothelial cell affected by PM2.5. J. Hyg. Res. 2005, 34, 169–171. [Google Scholar] [CrossRef]
- Huang, N.H.; Wang, Q.; Xu, D.Q. Immunological effect of PM2.5 on cytokine production in female Wistar rats. Biomed. Environ. Sci. 2008, 21, 63–68. [Google Scholar] [CrossRef]
- Zhu, L.; Xiao, Y.; Chen, J.; Zhou, H.; Zhang, X. Pollution Status and Cytotoxicity of PM2.5 in Hangzhou City. J. Environ. Health 2009, 2, 147–148. [Google Scholar]
- Xiao, C.; Li, S.; Shang, D.; Zhu, X.; Chen, D.; Wang, R. Pathologic changes in trachea of rats exposed to PM2.5 artificial air pollution. Chin. J. Public Health 2011, 12, 1579–1581. [Google Scholar]
- Dong, C. Study on Toxic Effects of PM2.5 on Cardiovascular System. Ph.D. Thesis, Fudan University, Shanghai, China, 2005. [Google Scholar]
- Dan, M.; Zhuang, G.; Li, X.; Tao, H.; Zhuang, Y. The characteristics of carbonaceous species and their sources in PM2.5 in Beijing. Atmos. Environ. 2004, 38, 3343–3452. [Google Scholar] [CrossRef]
- Zheng, M.; Salmon, L.G.; Schauer, J.J.; Zeng, L.; Kiang, C.S.; Zhang, Y.; Cass, G.R. Seasonal trends in PM2.5 source contributions in Beijing, China. Atmos. Environ. 2005, 39, 3967–3976. [Google Scholar] [CrossRef]
- Wang, Y.; Zhuang, G.; Zhang, X.; Huang, K.; Xu, C.; Tang, A.; Chen, J.; An, Z. The ion chemistry, seasonal cycle, and sources of PM2.5 and TSP aerosol in Shanghai. Atmos. Environ. 2006, 40, 2935–2952. [Google Scholar] [CrossRef]
- Song, Y.; Tang, X.; Xie, S.; Zhang, Y.; Wei, Y.; Zhang, M.; Zeng, L.; Lu, S. Source apportionment of PM2.5 in Beijing in 2004. J. Hazard. Mater. 2007, 146, 124–130. [Google Scholar] [CrossRef] [PubMed]
- Dong, X.; Sun, J. Source analysis of PM2.5 in Wuhan area. J. Liaoning Tech. Univ. Sci. Ed. 2009, 28, 125–127. [Google Scholar]
- Ye, W. Study on source apportionment of PM10 and PM2.5 in ambient air of Ningbo. Res. Environ. Sci. 2011, 33, 66–69. [Google Scholar] [CrossRef]
- Yang, F.; Duan, F.; He, K. PM2.5 speciation sampling and analysis methods. Environ. Monit. China 2004, 20, 14–19. [Google Scholar] [CrossRef]
- Yang, F.M.; Ye, B.M.; He, K.B.; Ma, Y.L.; Cadle, S.H.; Chan, T.; Mulawa, P.A. Characterization of Atmospheric Mineral Components of PM2.5 in Beijing and Shanghai, China. Sci. Total Environ. 2005, 343, 221–230. [Google Scholar] [CrossRef] [PubMed]
- Sun, Y.L.; Zhuang, G.S.; Tang, A.H.; Wang, Y.; An, Z.S. Chemical characteristics of PM2.5 and PM10 in haze-fog episodes in Beijing. Environ. Sci. Technol. 2006, 40, 3148–3155. [Google Scholar] [CrossRef] [PubMed]
- Lain, S.C.; Zou, S.C.; Cao, J.J.; Lee, S.C.; Ho, K.F. Characterizing ionic species in PM2.5 and PM10 in four Pearl River Delta cities, South China. J. Environ. Sci. 2007, 19, 939–947. [Google Scholar] [CrossRef]
- Tan, J. Chemical characteristics of PM2.5 during a typical haze episode in Guangzhou. J. Environ. Sci. 2009, 21, 774–781. [Google Scholar] [CrossRef]
- Chen, K.; Yin, Y.; Wei, Y.; Yang, W. Characteristics of carbonaceous aerosols in PM2.5 in Nanjing. China Environ. Sci. 2010, 8, 1015–1020. [Google Scholar]
- Yang, T. Chemical Compositions and Source Apportionment of PM2.5 in Changsha. Master’s Thesis, Central South University, Changsha, China, 2010. [Google Scholar]
- Gu, J.; Bai, Z.; Li, W.; Wu, L.; Liu, A.; Dong, H.; Xie, Y. Chemical composition of PM2.5 during winter in Tianjin, China. Particuology 2011, 3, 215–221. [Google Scholar] [CrossRef]
- Huang, X.; Yun, H.; Guan, Z.; Li, X.; He, L.; Zhang, Y.; Hu, M. Source apportionment and secondary organic aerosol estimation of PM2.5 in an urban atmosphere in China. Sci. Sin. Terrae 2014, 44, 723–734. [Google Scholar] [CrossRef]
- Hu, M.; Tang, Q.; Peng, J.; Wang, E.; Wang, S.; Cha, F. Study on Characterization and Source Apportionment of Atmospheric Particulate Matter in China. Environ. Sustain. Dev. 2011, 5, 15–19. [Google Scholar] [CrossRef]
- Zheng, J.; Zhang, Y.; Yang, C. Review of PM2.5 Source Apportionment Methods in China. J. Peking Univ. Sci. Ed. 2014, 50, 1141–1154. [Google Scholar] [CrossRef]
- Huang, X.; Yun, H.; Gong, Z.; Li, X.; He, L.; Zhang, Y.; Hu, M. Air pollution characteristic and variation trend of Central Triangle urban agglomeration from 2005 to 2014. Sci. Sin. Terrae 2014, 44, 723–734. [Google Scholar]
- Wang, J.; Bi, X.; Feng, Y.; Zhang, Y.; Wu, J.; Lv, A. Pollution characteristics and source apportionment of PM2.5 during heavy pollution process in Urumchi City. Res. Environ. Sci. 2014, 27, 113–119. [Google Scholar]
- Zhao, X.; Wang, X.; Chu, Y.; Yang, W.; Ren, L.; Bai, Z. Characterization of chemical composition mass balance and source appointment of ambient PM2.5 in Xinzhou city. Chin. J. Environ. Eng. 2017, 11, 4660–4668. [Google Scholar]
- Xiao, Z.; Bi, X.; Feng, D.; Wang, Y.; Zhou, J.; Fu, X.; Wen, Y. Source Apportionment of Ambient PM10 and PM2.5 in Urban Area of Ningbo City. Environ. Sci. Res. 2012, 25, 549–555. [Google Scholar]
- Tang, M. Tianjin Ambient Air PM2.5 Source Apportionment. Master’s Thesis, Nankai University, Tianjin, China, 2014. [Google Scholar]
- Ren, L.; Zhou, Z.; Zhao, X.; Yang, W.; Yin, B.; Bai, Z.; Ji, Y. Source Apportionment of PM10 and PM2.5 in Urban Areas of Chongqing. Environ. Sci. Res. 2014, 27, 1387–1394. [Google Scholar]
- Yang, Y.; Li, J.; Lian, Y.; Chen, T.; Liu, B.; Sun, F.; Cheng, G.; Su, J.; Zhang, D. Source apportionment of PM2.5 in Beijing by the chemical mass balance. Acta Sci. Circumst. 2015, 35, 2693–2700. [Google Scholar] [CrossRef]
- Dou, Y.; Zhao, X.; Xu, X.; Gao, H.; Li, T.; Ding, M.; Liu, Y.; Han, B.; Bai, Z. Source Apportionment of PM2.5 in Xining by the Chemical Mass Balance. Environ. Monit. China 2016, 32, 7–14. [Google Scholar] [CrossRef]
- Chen, F.; Yu, H.; Hu, J.; Chai, F. Analysis of Source of PM2.5 in Xingtai Using Chemical Mass model. J. Ecol. Rural Environ. 2017, 33, 1075–1083. [Google Scholar] [CrossRef]
- Cheng, H.; Wang, Z.; Feng, J.; Chen, H.; Zhang, F.; Liu, J. Carbonaceous species composition and source apportionment of PM2.5 in urban atmosphere of Wuhan. Ecol. Environ. 2012, 21, 1574–1579. [Google Scholar]
- Zhang, Z.; Tao, J.; Xie, S.; Zhou, L.; Song, D.; Zhang, P.; Cao, J.; Luo, L. Seasonal variations and source apportionment of PM2.5 at urban area of Chengdu. J. Environ. Sci. Circumst. 2013, 33, 2947–2952. [Google Scholar]
- Wang, X.; Zhao, Q.; Cui, H. PM2.5 source apportionment at suburb of Shanghai in winter based on real time monitoring. J. Nanjing Univ. Sci. Ed. 2015, 51, 517–523. [Google Scholar] [CrossRef]
- Zong, Z.; Wang, X.; Tian, C.; Chen, Y.; Lin, Q.; Ji, L.; Zhi, G.; Li, J.; Zhang, G. Source apportionment of PM2.5 at a regional background site in North China using PMF linked with radiocarbon analysis: Insight into the contribution of biomass burning. Atmos. Chem. Phys. 2016, 16, 11249–11265. [Google Scholar] [CrossRef]
- Tan, J.; Zhang, L.; Zhou, X.; Duan, J.; Li, Y.; Hu, J.; He, K. Chemical characteristics and source apportionment of PM2.5 in Lanzhou, China. Sci. Total Environ. 2017, 601–602, 1743–1752. [Google Scholar] [CrossRef] [PubMed]
- Chen, Y.; Xie, S.D.; Luo, B.; Zhai, C.Z. Particulate pollution in urban Chongqing of southwest China: Historical trends of variation, chemical characteristics and source apportionment. Sci. Total Environ. 2017, 584–585, 523–534. [Google Scholar] [CrossRef] [PubMed]
- Yao, L.; Yang, L.; Yuan, Q.; Yan, C.; Dong, C.; Meng, C.; Sui, X.; Yang, F.; Lu, Y.; Wang, W. Sources apportionment of PM2.5 in a background site in the North China Plain. Sci. Total Environ. 2016, 541, 590–598. [Google Scholar] [CrossRef] [PubMed]
- Wang, F.; Lin, T.; Feng, J.; Fu, H.; Guo, Z. Source apportionment of polycyclic aromatic hydrocarbons in PM2.5 using positive matrix factorization modeling in Shanghai, China. Environ. Sci. Process. Impacts 2015, 17, 197–205. [Google Scholar] [CrossRef] [PubMed]
- Wang, J. Chemical Composition Characteristics and Source Apportionment of PM2.5 in Zhengzhou. Ph.D. Thesis, Zhengzhou University, Zhengzhou, China, 2015. [Google Scholar]
- Zhou, Y.; Zhang, H.; Wang, Q.; Xu, L.; Wang, C. Pollution characteristics and source apportionment of PM2.5 from Qinshan District in Wuhan during the winter. Environ. Sci. Technol. 2015, 38, 159–164. [Google Scholar]
- Chen, X.; Du, P.; Guang, Q.; Feng, X.; Xu, D.; Lin, S. Application of ICP-MS and ICP-AES for Studying on Source Apportionment of PM2.5 during Haze Weather in Urban Beijing. Spectrosc. Spectr. Anal. 2015, 35, 1724–1729. [Google Scholar] [CrossRef]
- Ma, X.; Wang, L.; Ma, S.; Wei, Z.; Zhang, C.; Zheng, A. Spatial and temporal distribution and source analysis of components in PM2.5, Handan. Environ. Chem. 2017, 36, 1932–1940. [Google Scholar]
- Meng, C.; Wang, L.; Su, J.; Yang, J.; Wei, Z.; Zhang, F.; Ma, S. Chemical compositions and source apportionment of PM2.5 in Handan City, Hebei Province. Environ. Sci. Technol. 2016, 39, 57–64. [Google Scholar]
- Cui, H.; Chen, W.; Dai, W.; Liu, H.; Wang, X.; He, K. Source apportionment of PM2.5 in Guangzhou combining observation data analysis and chemical transport model simulation. Atmos. Environ. 2015, 116, 262–271. [Google Scholar] [CrossRef]
- Wang, L.; Bi, X.; Liu, B.; Wu, J.; Zhang, Y.; Feng, Y.; Zhang, Q. Source Directional Apportionment of PM2.5 in Heze City. Environ. Sci. Res. 2017, 30, 1849–1858. [Google Scholar]
- Shi, G.; Liu, J.; Wang, H.; Tian, Y.; Wen, J.; Shi, X.; Feng, Y.; Ivey, C.E.; Russell, A.G. Source apportionment for fine particulate matter in a Chinese city using an improved gas-constrained method and comparison with multiple receptor models. Environ. Pollut. 2018, 233, 1058–1067. [Google Scholar] [CrossRef] [PubMed]
- Qiao, X.; Ying, Q.; Li, X.; Zhang, H.; Hu, J.; Tang, Y.; Chen, X. Source apportionment of PM2.5 for 25 Chinese provincial capitals and municipalities using a source-oriented Community Multiscale Air Quality model. Sci. Total Environ. 2018, 612, 462–471. [Google Scholar] [CrossRef] [PubMed]
- Jin, X.; Zhang, G.; Xiao, C.; Huang, D.; Yuan, G.; Yao, Y.; Wang, X.; Hua, L.; Wang, P.; Ni, B. Source Apportionment of PM2.5 in Xinzhen Beijing Using PIXE and XRF. At. Energy Sci. Technol. 2014, 48, 1325–1330. [Google Scholar]
- Zhang, Y.; Zhang, W.; Wang, J. Establishment and application of pollutant Inventory-Chemical Mass Balance (I-CMB) model for source apportionment of PM2.5. Trans. Atmos. Sci. 2015, 38, 279–284. [Google Scholar] [CrossRef]
- Shi, J.; Yuan, D.; Zhao, Z. Residential indoor PM2.5 sources, concentration and influencing factors in China. J. Environ. Health 2015, 32, 825–829. [Google Scholar]
- Han, Y.; Qi, M.; Chen, Y.; Shen, H.; Liu, J.; Huang, Y.; Chen, H.; Liu, W.; Wang, W.; Liu, J.; et al. Influences of ambient air PM2.5 concentration and meteorological condition on the indoor PM2.5 concentrations in a residential apartment in Beijing using a new approach. Environ. Pollut. 2015, 205, 307–314. [Google Scholar] [CrossRef] [PubMed]
- Zhao, L.; Chen, C.; Wang, P.; Wang, Y.; Chen, Z.; Wang, Q.; Lu, B.; Cao, G.; Meng, C.; Wang, L.; et al. Characteristics of Change of PM2.5 Mass Concentration Indoors and Outdoors in an Office Building in Beijing in Summer and Winter. Build. Sci. 2015, 31, 32–39. [Google Scholar] [CrossRef]
- Du, T.; Yao, W.; Zhang, S.; Zhou, Z. Influencing Factors of Outdoor PM2.5 Mass Concentration and Indoor Control Measures. Gas Heat 2016, 36, 21–25. [Google Scholar] [CrossRef]
- Wang, F.; Meng, D.; Li, X.; Tan, J. Indoor-outdoor relationships of PM2.5 in four residential dwellings in winter in the Yangtze River Delta, China. Environ. Pollut. 2016, 215, 280–289. [Google Scholar] [CrossRef] [PubMed]
- Ji, W.; Zhao, B. Contribution of outdoor-originating particles, indoor-emitted particles and indoor secondary organic aerosol (SOA) to residential indoor PM2.5 concentration: A model-based estimation. Build. Environ. 2015, 90, 196–205. [Google Scholar] [CrossRef]
- Zhang, S.; Duan, Y. Ditermination the PM2.5 concentration in the room of Liting mosquito-repellent incense and cigarette. Inn. Mong. Environ. Sci. 2013, 25, 184–185. [Google Scholar] [CrossRef]
- Li, T.; Cao, S.; Fan, D.; Zhang, Y.; Wang, B.; Zhao, X.; Leaderer, B.P.; Shen, G.; Zhang, Y. Duan, X. Household concentrations and personal exposure of PM2.5 among urban residents using different cooking fuels. Sci. Total Environ. 2016, 548–549, 6–12. [Google Scholar] [CrossRef] [PubMed]
- Zhou, Z.; Liu, Y.; Yuan, J.; Zuo, J.; Chen, G.; Xu, L.; Rameezdeen, R. Indoor PM2.5 concentrations in residential buildings during a severely polluted winter: A case study in Tian, China. Renew. Sustain. Energy Rev. 2016, 64, 372–381. [Google Scholar] [CrossRef]
- Gui, F.; Ye, Q.; Zhou, Y.; Huang, H. Influences of sweeping on the Concentration of Particulate Matter in the indoor air. J. Anhui Univ. Technol. Nat. Sci. 2013, 30, 250–254. [Google Scholar]
- Sun, H.; Lin, Z.; Mao, H. PM2.5 Emission from Laser Printers in an Environmental Chamber. Build. Energy Environ. 2016, 35, 44–48. [Google Scholar]
- Zhang, N.; Han, B.; He, F.; Xu, J.; Zhao, R.; Zhang, Y.; Bai, Z. Chemical characteristic of PM2.5 emission and inhalational carcinogenic risk of domestic Chinese cooking. Environ. Pollut. 2017, 227, 24–30. [Google Scholar] [CrossRef] [PubMed]
- Xue, W.; Fu, F.; Wang, J.; Tang, G.; Lei, Y.; Yang, J.; Wang, Y. Numerical study on the characteristics of regional transport of PM2.5 in China. China Environ. Sci. 2014, 34, 1361–1368. [Google Scholar]
- Wu, D.; Fung, J.C.H.; Yao, T.; Lau, A.K.H. A study of control policy in the Pearl River Delta region by using the particulate matter source apportionment method. Atmos. Environ. 2013, 76, 147–161. [Google Scholar] [CrossRef]
- Lü, W.; Li, J.F.; Wang, X.S.; Zhang, Y.H. Numerical modeling on the impact of long-range transport of air pollutants on the regional air quality in the Pearl River Delta. Acta Sci. Circumst. 2015, 35, 30–41. [Google Scholar] [CrossRef]
- Li, T.Y.; Fan, S.J.; Deng, X.J.; Zhang, X.B.; Deng, T.; Li, T. Study on the regional transported effect of PM2.5 in Guangzhou area. J. Univ. Chin. Acad. Sci. 2014, 31, 403–409. [Google Scholar] [CrossRef]
- Wang, Y.; Xue, W.; Lei, Y.; Wang, J.; Wu, W. Regional Transport Matrix Study of PM2.5 in Jingjinji Region, 2015. Environ. Sci. 2017, 38, 4897–4904. [Google Scholar] [CrossRef]
- Wang, Z.; Li, Y.; Chen, T.; Zhang, D.; Sun, F.; Pan, L. Spatial-temporal characteristics of PM2.5 in Beijing in 2013. Acta Geogr. Sin. 2015, 70, 110–120. [Google Scholar]
- Zhang, L.; Wu, J.; Bao, Y.; Li, J.; Yu, C. Study on the temporal and spatial distribution characteristics of PM2.5 in Xi’an city. Air Pollut. Control 2016, 34, 87–90. [Google Scholar]
- Zhao, C.X.; Wang, Y.Q.; Wang, Y.J.; Zhang, H.L.; Zhao, B. Temporal and Spatial Distribution of PM2.5 and PM10 Pollution Status and the Correlation of Particulate Matters and Meteorological Factors During Winter and Spring in Beijing. Environ. Sci. 2014, 2, 418–427. [Google Scholar]
- Su, Z.; Wang, J. Pollution Characteristics and Determinants of Atmospheric Particulate Matter and Its Determinants in Guiyang. Acta Sci. Nat. Univ. Sunyatseni 2015, 54, 77–84. [Google Scholar] [CrossRef]
- Wang, H.; Wang, S.; Guo, Z.; Han, Z.; Gong, X.; Li, Y. Study on the Variation Characteristics of SO2, PM10, and PM2.5 Concentrations in the Urban and Surburban Areas during Winter in Taiyuan. Environ. Sustain. Dev. 2014, 39, 190–193. [Google Scholar]
- Song, Y.; Tang, X.; Zhang, Y.; Hu, M.; Fang, C.; Zeng, L.; Wang, W. Effects on Fine Particles by the Continued High Temperature Weather in Beijing. Environ. Sci. 2002, 23, 33–36. [Google Scholar] [CrossRef]
- Zheng, X.; Zhao, W.; Yan, X.; Zhao, W.; Xiong, Q. Spatial and temporal variation of PM2.5 in Beijing city after rain. Ecol. Environ. Sci. 2014, 23, 797–805. [Google Scholar] [CrossRef]
- Jiang, D.; Li, C. Relationship of the Diffusion of PM2.5 and Meteorological Conditions in Nanjing Urban Area. Adm. Tech. Environ. Monit. 2016, 28, 36–40. [Google Scholar] [CrossRef]
- Wei, Y.X.; Yin, Y.; Yang, W.F.; Rui, D.M.; Hang, W.Q. Analysis of the Pollution Characteristics & Influence Factors of PM2.5 in Nanjing Area. Environ. Sci. Manag. 2009, 34, 29–34. [Google Scholar] [CrossRef]
- Chen, T.; He, J.; Lu, X.W.; She, J.F.; Guan, Z.Q. Spatial and Temporal Variations of PM2.5 and Its Relation to Meteorological Factors in the Urban Area of Nanjing, China. Int. J. Environ. Res. Public Health 2016, 13, 921. [Google Scholar] [CrossRef] [PubMed]
- Zhang, C.; Wang, M.; Hu, Z.; Yuan, Y.; Liu, H.; Qiu, F. Temporal and spatial distribution of PM2.5 concentration and the correlation of PM2.5 and meteorological factors in Kunming City. J. Yunnan Univ. 2016, 38, 90–98. [Google Scholar] [CrossRef]
- Wang, H.C.; Wu, Z.B.; Zhou, J.B.; Bao, J. Relationship between PM2.5 concentration and meteorological elements at Shangdianzi station of Beijing. J. Meteorol. Environ. 2015, 31, 99–104. [Google Scholar]
- Zhang, S.P.; Han, L.J.; Zhou, W.Q.; Zheng, X.X. Relationships between fine particulate matter (PM2.5) and meteorological factors in winter at typical Chinese cities. Acta Ecol. Sin. 2016, 36, 7897–7907. [Google Scholar] [CrossRef]
- Wu, D.; Liu, Q.; Lian, Y.; Bi, X.; Li, F.; Tan, H.; Liao, B.; Chen, H. Hazy weather formation and visibility deterioration resulted from fine particulate (PM2.5) pollutions in Guangdong and Hong Kong. J. Environ. Sci. Circumst. 2012, 32, 2660–2669. [Google Scholar]
- Ma, Z.; Zhao, X.; Meng, W.; Meng, Y.; He, D.; Liu, Y. Comparison of Influence of Fog and Haze on Visibility in Beijing. Environ. Sci. Res. 2012, 25, 1208–1214. [Google Scholar]
- Zhang, H.; Shi, C.; Wu, B.; Yang, Y. Quantified Relationships among the Visibility, Relative Humidity and PM2.5 Mass Concentration in Hefei City. Ecol. Environ. 2017, 26, 1001–1008. [Google Scholar] [CrossRef]
- Yao, Q.; Han, X.; Cai, Z.; Zhang, M. Study on characteristic of aerosol extinction at Tianjin City in Spring. China Environ. Sci. 2012, 32, 795–802. [Google Scholar] [CrossRef]
- Hao, J.; Zhang, G.; Yang, Y. The characteristics of atmospheric visibility and influencing factors. J. Arid Land Resour. Environ. 2017, 31. [Google Scholar] [CrossRef]
- Chen, J.; Qiu, S.S.; Shang, J.; Wilfrid, O.M.F.; Liu, X.G.; Tian, H.Z.; Boman, J. Impact of Relative Humidity and Water Soluble Constituents of PM2.5 on Visibility Impairment in Beijing, China. Aerosol Air Qual. Res. 2014, 14, 260–268. [Google Scholar] [CrossRef]
- Wang, J.L.; Zhang, Y.H.; Shao, M.; Liu, X.L.; Zeng, L.M.; Cheng, C.L.; Xu, X.F. Quantitative relationship between visibility and mass concentration of PM2.5 in Beijing. J. Environ. Sci. 2006, 3, 475–481. [Google Scholar] [CrossRef]
- Shi, H.D.; Gao, Q.X.; Zhang, S.H.; Chen, D.S.; Du, W.P.; Fu, J.F.; Bai, H.M. Research review of impacts and feedback of air pollution on climate change. Res. Environ. Sci. 2012, 25, 974–980. [Google Scholar]
- Zhang, X.; Xia, X.; Che, H.; Tang, J.; Tang, Y.; Meng, W.; Dong, P. Observation Study on Aerosol Optical Properties and Radiative Forcing Using the Ground-based and Satellite Remote Sensing at Background Station during the Regional Pollution Episodes. Environ. Sci. 2014, 35, 2439–2448. [Google Scholar]
- Hu, S.L.; Liu, H.N. Effects of PM2.5 on the urban radiation and air temperature in Hefei. J. Meteorol. Sci. 2017, 1, 78–85. [Google Scholar] [CrossRef]
- Wu, H.; Wang, T.; Riemer, N.; Chen, P.; Li, M.; Li, S. Urban heat island impacted by fine particles in Nanjing, China. Sci. Rep. 2017, 7, 11422. [Google Scholar] [CrossRef] [PubMed]
- Gui, Z.; Zheng, Y.; Qian, Z.; He, H.; Zeng, X. Numerical study of indirect aerosols effect on regional climate over eastern China. J. Nanjing Univ. Nat. Sci. 2014, 50, 781–791. [Google Scholar] [CrossRef]
- Yao, L. Causative impact of air pollution on evapotranspiration in the North China Plain. Environ. Res. 2017, 158, 436–442. [Google Scholar] [CrossRef] [PubMed]
- Li, F.; Zhang, C. Analysis on the Relationship between PM2.5 and the Precipitation in Xi’an. Environ. Monit. China 2013, 29, 22–28. [Google Scholar] [CrossRef]
- Abbey, D.E.; Ostro, B.E.; Petersen, F.; Burchette, R.J. Chronic respiratory symptoms associated with estimated long-term ambient concentrations of fine particulates less than 2.5 microns in aerodynamic diameter (PM2.5) and other air pollutants. J. Expo. Anal. Environ. Epidemiol. 1995, 5, 137–196. [Google Scholar] [PubMed]
- Churg, A.; Brauer, M. Human lung parenchyma retains PM2.5. Am. J. Respir. Crit. Care Med. 1997, 155, 2109–2111. [Google Scholar] [CrossRef] [PubMed]
- Pope, C.A., III; Dockey, D.W. Heath effects of fine particulate air pollution: Lines that connect. J. Air Waste Manag. Assoc. 2006, 56, 709–742. [Google Scholar] [CrossRef] [PubMed]
- Kim, K.H.; Kabir, E.; Kabir, S. A review on the human health impact of airborne particulate matter. Environ. Int. 2015, 74, 136–143. [Google Scholar] [CrossRef] [PubMed]
- Xu, J.; Zhang, Z.; Geng, H.; Qiu, Y.; Tong, G.; Han, J.; Zhao, Y.; Liu, J. Relationship between PM2.5 exposure and pulmonary function in different working environments. J. Environ. Health 2013, 30, 1–4. [Google Scholar]
- Xing, Y.; Xu, Y.; Shi, M.; Lian, Y. The impact of PM2.5 on the human respiratory system. J. Thorac. Dis. 2016, 8, 69–74. [Google Scholar] [CrossRef]
- Duan, Y.; Huang, Z.; Shu, Z.; Yuan, H. Ambient PM2.5 during pregnancy and risk on preterm birth. Chin. J. Cardiol. 2014, 44, 179–182. [Google Scholar] [CrossRef]
- Yeh, H.L.; Hsu, S.W.; Chang, Y.C.; Chan, T.C.; Tsou, H.C.; Chang, Y.C.; Chiang, P.H. Spatial Analysis of Ambient PM2.5 Exposure and Bladder Cancer Mortality in Taiwan. Int. J. Environ. Res. Public Health 2017, 14, 508. [Google Scholar] [CrossRef] [PubMed]
- Shu, Y.; Zhu, L.; Yuan, F.; Chen, E.; Chen, L. Analysis of the relationship between PM2.5 and lung cancer based on protein-protein interactions. Comb. Chem. High Throughput Screen 2016, 19, 100–108. [Google Scholar] [CrossRef] [PubMed]
- Song, C.; He, J.; Wu, L.; Jin, T.; Chen, X.; Li, R.; Ren, P.; Zhang, L.; Mao, H. Heath burden attributable to ambient PM2.5 in China. Environ. Pollut. 2017, 223, 575–586. [Google Scholar] [CrossRef] [PubMed]
- Wu, J.; Zhu, J.; Li, W.; Xu, D.; Liu, J. Estimation of the PM2.5 health effects in China during 2000–2011. Environ. Sci. Pollut. Res. 2017, 224, 10695–10707. [Google Scholar] [CrossRef] [PubMed]
- Shi, T.; Dong, H.; Yang, T.; Jian, Q.; Hu, G.; Feng, W.; Lv, J.; Lin, H. Association between PM2.5 air pollution and daily resident mortality in Guangzhou urban area in winter. J. Environ. Health 2015, 32. [Google Scholar] [CrossRef]
- Zhang, Z.; Guo, C.; Lau, A.K.H.; Chan, T.C.; Chuang, Y.C.; Lin, C.; Jiang, W.K.; Yeoh, E.K.; Tam, T.; Woo, K.S.; et al. Long-Term Exposure to Fine Particulate Matter, Blood Pressure, and Incident Hypertension in Taiwanese Adults. Environ. Health Perspect. 2018, 126, 017008. [Google Scholar] [CrossRef] [PubMed]
- Lin, H.; Guo, Y.; Zheng, Y.; Di, Q.; Liu, T.; Xiao, J.; Li, X.; Zeng, W.; Cummings-Vaughn, L.A.; Howard, S.W.; et al. Long-Term Effects of Ambient PM2.5 on Hypertension and Blood Pressure and Attributable Risk Among Older Chinese Adults. Hypertension 2017, 69, 806–812. [Google Scholar] [CrossRef] [PubMed]
- Xu, T.; Hou, J.; Cheng, J.; Zhang, R.; Yin, W.; Huang, C.; Zhu, X.; Chen, W.; Yuan, J. Estimated individual inhaled dose of fine particles and indicators of lung function: A pilot study among Chinese young adults. Environ Pollut. 2018, 235, 505–513. [Google Scholar] [CrossRef] [PubMed]
- Hwang, B.F.; Chen, Y.H.; Lin, Y.T.; Wu, X.T.; Leo Lee, Y. Relationship between exposure to fine particulates and ozone and reduced lung function in children. Environ. Res. 2015, 137, 382–390. [Google Scholar] [CrossRef] [PubMed]
- Chen, Y.; Wong, G.W.; Li, J. Environmental Exposure and Genetic Predisposition as Risk Factors for Asthma in China. Allergy Asthma Immunol. Res. 2016, 8, 92–100. [Google Scholar] [CrossRef] [PubMed]
- Liu, T.; Wu, B.; Wang, Y.; He, H.; Lin, Z.; Tan, J.; Yang, L.; Kamp, D.W.; Zhou, X.; Tang, J.; et al. Particulate matter 2.5 induces autophagy via inhibition of the phosphatidylinositol 3-kinase/Akt/mammalian target of rapamycin kinase signaling pathway in human bronchial epithelial cells. Mol. Med. Rep. 2015, 12, 1914–1922. [Google Scholar] [CrossRef] [PubMed]
- Zhang, Y.X.; Liu, Y.; Xue, Y.; Yang, L.Y.; Song, G.D.; Zhao, L. Correlational study on atmospheric concentrations of fine particulate matter and children cough variant asthma. Eur. Rev. Med. Pharmacol. Sci. 2016, 20, 2650–2654. [Google Scholar] [PubMed]
- Xue, T.; Zhang, Q. Associating ambient exposure to fine particles and human fertility rates in China. Environ. Pollut. 2018, 235, 497–504. [Google Scholar] [CrossRef] [PubMed]
- Wu, L.; Jin, L.; Shi, T.; Zhang, B.; Zhou, Y.; Zhou, T.; Bao, W.; Xiang, H.; Zuo, Y.; Li, G.; et al. Association between ambient particulate matter exposure and semen quality in Wuhan, China. Environ. Int. 2017, 98, 219–228. [Google Scholar] [CrossRef] [PubMed]
- Zhou, N.; Jiang, C.; Chen, Q.; Yang, H.; Wang, X.; Zou, P.; Sun, L.; Liu, J.; Li, L.; Huang, L.; et al. Exposures to Atmospheric PM10 and PM10–2.5 Affect Male Semen Quality: Results of MARHCS Study. Environ. Sci. Technol. 2018, 52, 1571–1581. [Google Scholar] [CrossRef] [PubMed]
- Ding, A.; Yang, Y.; Zhao, Z.; Hüls, A.; Vierkötter, A.; Yuan, Z.; Cai, J.; Zhang, J.; Gao, W.; Li, J.; et al. Indoor PM2.5 exposure affects skin aging manifestation in a Chinese population. Sci. Rep. 2017, 7, 15329. [Google Scholar] [CrossRef] [PubMed]
- Wu, J.; Shi, Y.; Asweto, C.O.; Feng, L.; Yang, X.; Zhang, Y.; Hu, H.; Duan, J.; Sun, Z. Fine particle matters induce DNA damage and G2/M cell cycle arrest in human bronchial epithelial BEAS-2B cells. Environ. Sci. Pollut. Res. Int. 2017, 24, 25071–25081. [Google Scholar] [CrossRef] [PubMed]
- Chen, S.; Wu, X.; Hu, J.; Dai, G.; Rong, A.; Guo, G. PM2.5 exposure decreases viability, migration and angiogenesis in human umbilical vein endothelial cells and human microvascular endothelial cells. Mol. Med. Rep. 2017, 16, 2425–2430. [Google Scholar] [CrossRef] [PubMed]
- Chen, G.; Zhang, W.; Li, S.; Williams, G.; Liu, C.; Morgan, G.G.; Jaakkola, J.J.K.; Guo, Y. Is short-term exposure to ambient fine particles associated with measles incidence in China? A multi-city study. Environ. Res. 2017, 156, 306–311. [Google Scholar] [CrossRef] [PubMed]
- Meng, X.; Zhang, Y.; Yang, K.Q.; Yang, Y.K.; Zhou, X.L. Potential Harmful Effects of PM2.5 on Occurrence and Progression of Acute Coronary Syndrome: Epidemiology, Mechanisms, and Prevention Measures. Int. J. Environ. Res. Public Health 2016, 13, 748. [Google Scholar] [CrossRef] [PubMed]
- Hong, Z.; Guo, Z.; Zhang, R.; Xu, J.; Dong, W.; Zhuang, G.; Deng, C. Airborne Fine Particulate Matter Induces Oxidative Stress and Inflammation in Human Nasal Epithelial Cells. Tohoku J. Exp. Med. 2016, 239, 117–125. [Google Scholar] [CrossRef] [PubMed]
- Feng, C.; Li, J.; Sun, W.; Zhang, Y.; Wang, Q. Impact of ambient fine particulate matter (PM2.5) exposure on the risk of influenza-like-illness: A time-series analysis in Beijing, China. Environ. Health 2016, 15. [Google Scholar] [CrossRef] [PubMed]
- Giannadaki, D.; Lelieveld, J.; Pozzer, A. Implementing the U.S. air quality standard for PM2.5 worldwide can prevent millions of premature deaths per year. Environ. Health 2016, 15. [Google Scholar] [CrossRef] [PubMed]
- Lin, H.; Wang, X.; Qian, Z.M.; Guo, S.; Yao, Z.; Vaughn, M.G.; Dong, G.; Liu, T.; Xiao, J.; Li, X.; et al. Daily exceedance concentration hours: A novel indicator to measure acute cardiovascular effects of PM2.5 in six Chinese subtropical cities. Environ. Int. 2017, 111, 117–123. [Google Scholar] [CrossRef] [PubMed]
- Che, L.; Li, Y.; Gan, C. Effect of short-term exposure to ambient air particulate matter on incidence of delirium in a surgical population. Sci. Rep. 2017, 7, 15461. [Google Scholar] [CrossRef] [PubMed]
- Fang, X.; Fang, B.; Wang, C.; Xia, T.; Bottai, M.; Fang, F.; Cao, Y. Relationship between fine particulate matter, weather condition and daily non-accidental mortality in Shanghai, China: A Bayesian approach. PLoS ONE 2017, 12, e0187933. [Google Scholar] [CrossRef] [PubMed]
- Dai, J.; Chen, R.; Meng, X.; Yang, C.; Zhao, Z.; Kan, H. Ambient air pollution, temperature and out-of-hospital coronary deaths in Shanghai, China. Environ. Pollut. 2015, 203, 116–121. [Google Scholar] [CrossRef] [PubMed]
- Cao, Q.; Liang, Y.; Niu, X. China’s Air Quality and Respiratory Disease Mortality Based on the Spatial Panel Model. Int. J. Environ. Res. Public Health 2017, 14, 1081. [Google Scholar] [CrossRef] [PubMed]
- Li, C.; Lu, F.; Liu, Y.; Chen, C. Association between maternal exposure to fine particulate matter and low birth weight: A meta analysis. J. Environ. Health 2017, 34, 38. [Google Scholar]
- Chen, Y.; Feng, Y.; Duan, X.; Zhao, N.; Wang, J.; Li, C.; Guo, P.; Xie, B.; Zhang, F. Ambient PM2.5 during pregnancy and risk on preterm birth. Chin. J. Epidemiol. 2016, 37, 572–577. [Google Scholar] [CrossRef]
- Zhu, X.; Liu, Y.; Chen, Y.; Yao, C.; Che, Z.; Cao, J. Maternal exposure to fine particulate matter (PM2.5) and pregnancy outcomes: A meta-analysis. Environ. Sci. Pollut. Res. Int. 2015, 22, 3383–3396. [Google Scholar] [CrossRef] [PubMed]
- Chen, J.; Wu, Y.; Jiao, M.; Yang, X.; Ma, P.; Yuan, B. Comparison of the cytotoxicity of the indoor PM2.5 from allergic or from non-allergic children’s homes: An in vitro study. J. Environ. Sci. Circumst. 2017. [Google Scholar] [CrossRef]
- Tu, H. The Characteristics of PM2.5 and the Relationship between PM2.5 and Children Health in Urban Areas in Nanchang. Master’s Thesis, Nanchang University, Nanchang, China, 2016. [Google Scholar]
- Ouyang, F.; Liu, S.; Mao, J.; Zheng, Q.; Ma, T.; Hu, M. Relationship between air pollution and the number of pneumonia hospitalization in a children’s hospital in Changsha. Zhong Nan Da Xue Xue Bao Yi Xue Ban 2017, 42, 1417–1424. [Google Scholar] [CrossRef] [PubMed]
- Zhang, Z.; Hong, Y.; Liu, N. Association of ambient Particulate matter 2.5 with intensive care unit admission due to pneumonia: A distributed lag non-linear model. Sci. Rep. 2017, 7, 8679. [Google Scholar] [CrossRef] [PubMed]
- Wang, X.; Li, G.; Jin, X.; Mu, J.; Pan, J.; Liang, F.; Tian, L.; Chen, S.; Guo, Q.; Dong, W.; et al. Study of relationship between atmospheric fine particulate matter concentration and one grade a tertiary hospital emergency room visits during 2012 and 2013 in Beijing. Zhonghua Yu Fang Yi Xue Za Zhi 2016, 50, 73–78. [Google Scholar] [CrossRef] [PubMed]
- Jia, Z.; Wei, Y.; Li, X.; Yang, L.; Liu, H.; Guo, C.; Zhang, L.; Li, N.; Guo, S.; Qian, Y.; et al. Exposure to Ambient Air Particles Increases the Risk of Mental Disorder: Findings from a Natural Experiment in Beijing. Int. J. Environ. Res. Public Health 2018, 15, 160. [Google Scholar] [CrossRef] [PubMed]
- Gu, J.; Xie, H. Investigation on Risk Cognition and Responding Behavior towards Haze of Nanjing Residents. Environ. Sci. Manag. 2015, 40, 178–187. [Google Scholar]
- Shi, S.; Zhao, B. Occupants’ interaction with windows in 8 residential apartments in Beijing and Nanjing, China. Build. Simul. 2015, 9. [Google Scholar] [CrossRef]
- Pang, S.; Xu, C.; Wei, S.; MHassan, T.; Xie, L.; Xiong, Y.; de Wilde, P. Research on the Occupant Window Opening Behavior in an Office Building in Beijing. Build. Sci. 2015, 31, 212–217. [Google Scholar] [CrossRef]
- Su, L. Healthy Air Supply-Smart Sensing Technology Leading New Direction of Air Conditioning into the Cold 2018. Househ. Appl. 2017, 9, 82–83. [Google Scholar]
- Nan, Y.; Sun, J. Effects of Haze on the Tourist Decision-Making. J. Guangzhou Univ. Soc. Sci. Ed. 2015, 10, 35–41. [Google Scholar]
- Liu, J. Study on Healthy Risk Assessment & Simulation on Residential Indoor Environmental Based on Stochastic Theory. Ph.D. Thesis, Hunan University, Changsha, China, 2007. [Google Scholar]
- Chen, C.; Zhao, B. Review of relationship between indoor and outdoor particles: I/O ratio, infiltration factor and penetration factor. Atmos. Environ. 2011, 45, 275–288. [Google Scholar] [CrossRef]
- Du, Y.; Zhang, Y.; Li, T. Residential indoor exposures of PM2.5 and relationship between indoor and outdoor PM2.5 in winter in Beijing. J. Environ. Health 2016, 4, 268–283. [Google Scholar] [CrossRef]
- Zhang, M.; Qian, H.; Zheng, X.; Zhang, H. Analysis of indoor and outdoor PM2.5 mass concentration and influencing factors of a kindergarten in Nanjing. Heat. Vent. Air Cond. 2012, 46, 20–25. [Google Scholar]
- Xie, W.; Fan, Y.; Huang, Y.; Li, L. The Characteristic of Indoor and Outdoor PM10, PM2.5, PM1.0 Pollution of Natural Ventilation. Contam. Control Air-Cond. Technol. 2015, 3, 51–55. [Google Scholar] [CrossRef]
- Chen, C.; Wang, Y.; Chen, Z.; Wang, Y.; Wu, Y.; Zhao, L. Dynamic Characteristics in Air Infiltration Rate with Respect to Atmospheric PM2.5 Pollution. J. Beijing Univ. Technol. 2017, 2, 285–293. [Google Scholar] [CrossRef]
- Lin, C.; Liao, Q.; Huang, F. Investigation on the Influencing Factors of PM2.5 Concentration. In Proceedings of the Annual Meeting of Chinese Society for Environmental Sciences, Haikou, China, 13–14 October 2016. [Google Scholar]
- Zhou, L. Research on Affecting Factors of PM2.5. Contam. Control Air-Cond. Technol. 2017, 1. [Google Scholar] [CrossRef]
- Wang, Q.; Li, G.; Meng, C.; Zhao, L.; Wang, J.; Wangm, X. Penetration of outdoor fine particulate matter (PM2.5) through building envelope and passive control methods. Heat. Vent. Air Cond. 2015, 12, 8–13. [Google Scholar]
- Xu, C.; Wang, Q.; Li, N.; Chang, J.; Lin, X.; Xu, D. Investigation of indoor fine particles in public places and influencing factors. J. Environ. Health 2014, 11, 993–996. [Google Scholar]
- Liu, Y.; Cao, J.; Chen, F.; Chen, J.; Zhang, Z.; Lu, Y. Characteristics of air pollution in various indoor public places. Chin. J. Public Health 2016, 36. [Google Scholar] [CrossRef]
- Fan, D.; Cao, S.; Zhang, Y.; Huang, N.; Dong, T.; Zhao, X.; Li, T.; Duan, X.; Zhang, W. Preliminary study on indoor PM2.5 pollution levels of residents in Lanzhou during heating period. J. Environ. Health 2014, 3, 232–234. [Google Scholar]
- Wang, Y.; Cui, L.; Zhou, L.; Wu, J.; Zhang, X.; Ding, Z.; Chen, X.; Ji, Q.; Zhou, Y.; Wang, T.; et al. Investigation of indoor PM2.5 and PM1.0 in some houses in Nanjing. J. Environ. Health 2013, 10, 900. [Google Scholar]
- Li, J.; Yu, S.; Liu, G.; Huang, G.; Wang, W.; Zhang, Z. Indoor Air Concentrations of PM2.5 in Hospitals in Shenzhen. J. Environ. Health 2012, 4, 330–331. [Google Scholar]
- Li, W.; Wang, G.; Zheng, W.; Yang, Y.; Pan, Y. Hygienic survey about indoor PM2.5 and air nicotine in main public places in Tianjin. J. Environ. Health 2014, 31, 787–789. [Google Scholar]
- Shen, F.; Jia, Y.; Zhang, Q.; Zhao, R.; Huang, L.; Li, R.; Zhang, G.; Guo, Q. Indoor PM2.5 pollution level and influencing factors in public places in Beijing in winter. J. Environ. Health 2014, 31, 262–263. [Google Scholar]
- Zhang, J.; Yu, S.; Song, M. Study on the Pollution Level of Formaldehyde and PM2.5 in Indoor Environment of Furniture and Clothing Markets. Build. Sci. 2016, 32, 21–26. [Google Scholar]
- Chen, L.; Fan, Y.; Yang, S.; Wu, J.; Li, Z.; Chen, H. Investigation of indoor air PM2.5 concentration in public places in Nanchang. J. Hyg. Res. 2014, 1, 146–148. [Google Scholar]
- Li, G. Study on the PM2.5 Penetration through Exterior Windows under Different Conditions and Control Methods. Ph.D. Thesis, China Academy of Building Research, Beijing, China, 2016. [Google Scholar]
- Li, G.; Wang, Q.; Zhao, L.; Wang, X.; Wang, J. Penetration of particle through building envelope and its influence factor. Build. Sci. 2015, 31, 72–76. [Google Scholar]
- Tung, T.C.W.; Chao, C.Y.H.; John, B. A methodology to investigate the particulate penetration coefficient through building shell. Atmos. Environ. 1993, 33, 881–893. [Google Scholar] [CrossRef]
- Thatcher, T.L.; Lunden, M.M.; Revzan, K.L.; Sextro, R.G.; Brown, N.J. A concentration rebound method for measuring particle penetration and deposition in the indoor environment. Aerosol Sci. Technol. 2003, 37, 847–864. [Google Scholar] [CrossRef]
- Lai, A.C.K.; Fung, J.L.S.; Li, M.; Leung, K.Y. Penetration of fine particles through rough cracks. Atmos. Environ. 2012, 60, 436–443. [Google Scholar] [CrossRef]
- Liu, D.L.; Nazaroff, W.W. Modeling pollutant penetration across building envelopes. Atmos. Environ. 2001, 35, 4451–4462. [Google Scholar] [CrossRef]
- Tian, L.; Zhang, G.; Lin, Y.; Yu, J.; Zhou, J.; Zhang, Q. Mathematical model of particle penetration through smooth/rough building envelop leakages. Build. Environ. 2009, 44, 1144–1149. [Google Scholar] [CrossRef]
- Tian, L.; Zhang, G.; Yu, J. Mathematical Simulation of Particle Penetration through Smooth and Rough Building Envelop Leakage. J. Hunan Univ. Nat. Sci. Ed. 2008, 35, 12–15. [Google Scholar]
- Li, A.; Ren, T.; Yang, C.; Lv, W.; Zhangm, F. Study on particle penetration through straight, L, Z and wedge-shaped cracks in buildings. Build. Environ. 2017, 114, 333–343. [Google Scholar] [CrossRef]
- Gao, Z.; Wang, X. Correlation study on air change rate and particle penetration coefficient through building envelope. Heat. Vent. Air Cond. 2016, 46, 14–19. [Google Scholar]
- Cao, G.; Xie, H.; Zhao, S. Strategic Research of Pollution Control of Indoor PM2.5 in Public Buildings. Build. Sci. 2015, 31. [Google Scholar] [CrossRef]
- Tu, Y.; Tu, G. Study on particulate matter (PM2.5) filtration efficiency of ventilating air filters. Heat. Vent. Air Cond. 2016, 46, 49–54. [Google Scholar]
- Wang, X. The PM2.5 Filtration Performance and Comprehensive Assessment of Air Filter Used in Fresh Air Unit. Ph.D. Thesis, Chongqing University, Chongqing, China, 2016. [Google Scholar]
- Lv, X.; Zhang, L.; Liu, Z.; Xu, X. Primary return air system PM2.5 control strategy. J. Environ. Eng. 2016, 10, 7141–7146. [Google Scholar] [CrossRef]
- Zhao, X.; Li, Y.; Hua, T.; Jiang, P.; Yin, X.; Yu, J.; Ding, B. Low-Resistance Dual-Purpose Air Filter Releasing Negative Ions and Effectively Capturing PM2.5. ACS Appl. Mater. Interfaces 2017, 9, 12054–12063. [Google Scholar] [CrossRef] [PubMed]
- Zhang, R.; Liu, C.; Hsu, P.C.; Zhang, C.; Liu, N.; Lee, H.R.; Lu, Y.; Qiu, Y.; Chu, S.; Cui, Y. Nanofiber Air Filters with High-Temperature Stability for Efficient PM2.5 Removal from the Pollution Sources. Nano Lett. 2016, 16, 3642–3649. [Google Scholar] [CrossRef] [PubMed]
- Li, M.; Feng, Y.; Wang, K.; Yong, W.F.; Yu, L.; Chung, T.S. Novel Hollow Fiber Air Filters for the Removal of Ultrafine Particles in PM2.5 with Repetitive Usage Capability. Environ. Sci. Technol. 2017, 51, 10041–10049. [Google Scholar] [CrossRef] [PubMed]
- Liu, C.; Hsu, P.C.; Lee, H.W.; Ye, M.; Zheng, G.; Liu, N.; Li, W.; Cui, Y. Transparent air filter for high-efficiency PM2.5 capture. Nat. Commun. 2015, 6. [Google Scholar] [CrossRef] [PubMed]
- Zhao, X.; Wang, S.; Yin, X.; Yu, J.; Ding, B. Slip-Effect Functional Air Filter for Efficient Purification of PM2.5. Sci. Rep. 2016, 6, 35472. [Google Scholar] [CrossRef] [PubMed]
- Khalid, B.; Bai, X.; Wei, H.; Huang, Y.; Wu, H.; Cui, Y. Direct Blow-Spinning of Nanofibers on a Window Screen for Highly Efficient PM2.5 Removal. Nano Lett. 2017, 17, 1140–1148. [Google Scholar] [CrossRef] [PubMed]
- Shi, S.; Bian, Y.; Zhang, L.; Chen, C. A method for assessing the performance of nanofiber films coated on window screens in reducing residential exposures to PM2.5 of outdoor origin in Beijing. Indoor Air 2017, 27, 1190–1200. [Google Scholar] [CrossRef] [PubMed]


| Country/Organization | Annual Average Limit (μg·m−3) | Daily Average Limit (μg·m−3) | Notes | Web References |
|---|---|---|---|---|
| USA-1 | 15 | 65 | Established in 1997 | [8] |
| USA-2 | 15 | 35 | Established in 2006 | |
| USA-3 | 15 | 12 | Established in 2012 | |
| Australia | 8 | 25 | Established in 2003, not enforced till now | [9] |
| WHO air quality goal (AQG) | 10 | 25 | Published in 2005, and the limit is mainly for developing countries | [10] |
| WHO transition target-1 (the most flexible limit) | 35 | 75 | Compared with AQG value, long-term exposure at these levels increases the risk of death by about 15% | |
| WHO transition target-2 | 25 | 50 | Among other health benefits, exposures at this level reduce the risk of death by about 6% (2% to 11%) compared with transition target-1 | |
| WHO transition target-3 | 15 | 37.5 | This is the lowest level for long-term exposure to PM2.5, at which total mortality, cardiopulmonary disease mortality and lung cancer mortality will increase with over 95% confidence | |
| EU-1 (2010–2015) | 25 | Published in 2008, executed in 2010, and not allowed to go beyond the limit in 2015 | [11] | |
| EU-2 (2015–2020) | 20 | Not enforced until 2020 | ||
| Singapore (long term target) | 10 | 25 | Established in 2008 | [12] |
| Singapore-1 (2008–2014) | 15 | Established in 2008 | ||
| Singapore-2 (2015–2020) | 12 | 37.5 | Established in 2015 | |
| Japan | 15 | 35 | Established in 2009 | [13] |
| India | 40 | 60 | Established in 2009 | [14] |
| China level 1 | 15 | 35 | Established in 2012, fully implemented in 2016 | [15] |
| China level 2 | 35 | 75 |
| Method | Reference | Location | Sampling Time Period | Main Sources of PM2.5 and Their Contribution Rates |
|---|---|---|---|---|
| CMB | [34] | Ningbo | 15–24 March 2010; 31 May–9 June 2010; 10–19 December 2010 | Urban dust (20.42%), coal dust (14.37%) and vehicle exhaust (15.15%) |
| [47] | Urumchi | 19–30 January 2013 | Urban dust (24.7%), coal dust (15.6%) and secondary particles (38.0%) | |
| [48] | Qizhou | September 2013; February–March 2014; May 2014 | Dust (21–35%), secondary particles (25–26%) and vehicle exhaust (21–26%) | |
| [49] | Ningbo | 25–31 January 2010; 31 May–6 June 2010; 10–16 October 2010 | Urban dust (19.9%), coal dust (14.4%), secondary sulfate (16.9%), vehicle exhaust (15.2%), secondary nitrate (9.78%) and secondary organic carbon (8.85%) | |
| [50] | Tianjin | 13–20 May 2010; 20–27 October 2010; 19–26 December 2010 | Open source (urban dust, soil dust and construction cement dust, total contribution of 30%),Secondary particles (secondary sulfate, secondary nitrate and secondary carbon, total contribution of 28%), coal dust (19.6%) and vehicle exhaust (15.9%) | |
| [51] | Chongqing | 6–28 February 2012; 6–28 August 2012; 19–27 October 2012; 7–29 December 2012 | Secondary particles (30.1%) and moving source (27.9%) | |
| [52] | Beijing | August 2012–July 2013, continuous for 5 to 7 days per month | Secondary inorganic salts (36%), organic matter (20%), vehicle/fuel (16%), coal burning (15%), soil dust (6%) and others (7%) | |
| [53] | Xining | 26 February–4 March 2014; 22–28 April 2014; 19–25 September 2014 | Urban dust (26.24%), coal dust (14.5%), vehicle exhaust (12.8%), secondary sulphate (9.0%), biomass burning (6.6%), secondary nitrates (5.7%), steel dust (4.7%), construction dust (4.4%), soil dust (4.4%), food and beverage emissions (2.9%) and other unidentified sources (5.2%) | |
| [54] | Xingtai | 24 February–15 March 2014; 22 April–19 May 2014; 15–28 July 2014 | Coal dust (25%), secondary inorganic particles (sulfate and nitrate, 45%), vehicle exhaust (11%), dust (9%), soil dust (3%), construction and metallurgical dust (1%) and other unidentified sources (3%) | |
| PMF | [55] | Wuhan | July 2011–February 2012 | Vehicle sources (27.1%), secondary sulphates and nitrates (26.8%), manufacturing emissions (26.4%) and biomass combustion (19.6%) |
| [56] | Chengdu | 29 April–17 May 2009; 6 July–6 August 2009; 26 October–26 November 2009; 1–31 January 2010 | Soil dust and raise dust (14.3%), biomass combustion (28.0%), vehicle sources (24.0%) and secondary nitrates/sulfates (31.3%) | |
| [46] | Shenzhen | January–December 2009 | Secondary sulphate (30.0%), vehicle sources (26.9%), biomass combustion (9.8%) and secondary nitrates (9.3%) | |
| [57] | suburbs of Shanghai | 23 December 2012–18 February 2014 | Secondary aerosol (50.8%), fuel combustion (17.5%), biomass combustion/sea salt (17.2%), raise dust/construction dust (7.7%), and coal-burning/smelting dust (6.9%) | |
| [58] | North China | 3 January–11 February 2014 | Coal combustion (29.6%), biomass combustion (19.3%) and vehicle sources (15.9%) | |
| [59] | Lanzhou | Winter 2012 and summer 2013 | Steel industry, secondary aerosols, coal combustion, power plants, vehicle emissions, crustal dust, and smelting industry contributed 7.1%, 33.0%, 28.7%, 3.12%, 8.8%, 13.3%, and 6.0%, respectively, in winter, and 6.7%, 14.8%, 3.1%, 3.4%, 25.2%, 11.6% and 35.2% in summer | |
| [60] | Chongqing | 2012–2013 | Secondary inorganic aerosols (37.5%), coal combustion (22.0%), other industrial pollution (17.5%), soil dust (11.0%), vehicular emission (9.8%) and metallurgical industry (2.2%) | |
| [61] | Yellow River Delta National Nature Reserve (YRDNNR) | January–November 2011 | Secondary sulphate and nitrate (54.3%), biomass burning (15.8%), industry (10.7%), crustal matter (8.3%), vehicles (5.2%) and copper smelting (4.9%) | |
| [62] | Shanghai | October 2011–August 2012 | Coal burning (30.5%), gasoline engine emission (29.0%), diesel engine emission (17.5%), air-surface exchange (11.9%) and biomass burning (11.1%) | |
| [63] | Zhengzhou | April 2011–December 2013 | Coal burning (29%), vehicle (26%), dust (21%), secondary aerosols (17%) and biomass burning (4%) | |
| [64] | Qingshan District, Wuhan | 15 November–28 December 2013 | Traffic exhaust (28.60%), industry (27.10%), road dust (22%), coal combustion (13.20%) and building dust (9.5%) | |
| FA | [65] | Beijing | 16 January–28 February 2013 | Industrial dust and human activities (40.3%), biomass combustion and building dust (27.0%), soil and wind induced dust (9.1%), fossil fuel sources (4.9%), electronic waste sources (4.8%) and regional migration sources (4.6%) |
| PCA | [66] | Hangdan | January, April, July and October 2015 | Secondary aerosol source, transportation, fossil fuel and biomass burning (46.5%), soil and construction dust (19.5%), steel industry (19.5%) and transportation (9%) |
| [67] | Hangdan | October 2012–January 2013 | Industry and coal burning (33.3%), secondary aerosol and biomass burning (21.7%), vehicle (12.8%) and road dust (9.1%), | |
| WRF/Chem+ observation data analysis | [68] | Guangzhou | January–December 2013 | Moving sources (37.4%), industrial emissions (32.2%), electricity emissions (12.2%), residential emissions (6.6%) and others (11.6%) |
| PMF and backward trajectory model | [69] | Heze | 13–22 August 2015; 21–30 October 2015; 14–23 January 2016 7–16 April 2016 | Secondary inorganic salt (32.61%), vehicle emissions (22.60%), raise dust (19.64%), coal dust (16.25%) and construction cement dust (9.00%) |
| Chemical mass balance gas constraint-Iteration (CMBGC-Iteration) | [70] | Tianjin | April 2014–January 2015 | Secondary sources (30%), crustal dust (25%), vehicle exhaust (16%), coal combustion (13%), SOC (7.6%) and cement dust (0.40%) |
| Ensemble-average of CMB, CMB-Iteration, CMB-GC, PMF, WALSPMF, and NCAPCA | Secondary sources (28%), crustal dust (20%), coal combustion (18%), vehicle exhaust (17%), SOC (11%) and cement dust (1.3%) | |||
| Community Multiscale Air Quality (CMAQ) model | [71] | 25 Chinese provincial capitals and municipalities | 2013 | Power plants (8.7–12.7%), agriculture NH3 (9.5–12%), windblown dust (6.1–12.5%) and secondary organic aerosol (SOA) (5.4–15.5%) |
| Particle Induced X-ray Emission(PIXE), XRay Fluorescence (XRF), and PMF | [72] | Xigngzhen District, Beijing | 19 May 2007–19 July 2013 | Coal burning (29.2%), vehicle exhaust and waste incineration (26.2%), construction industry (23.3%), soil (15.4%) and industry with chlorine (5.9%) |
| Inventory-Chemical Mass Balance (I-CMB) | [73] | Beijing | 2012 | Coal (28.06%), vehicle (19.73%), dust (17.88%), industry (16.50%), food (3.43%) and plant (3.40%) |
| Building Type | Sampling Location | Sampling Condition | Average Indoor PM2.5 Concentration (μg·m−3) | References | Times Exceeding Limit Set by Standard |
|---|---|---|---|---|---|
| Public place | Chongqing | Business hour | 211 (68–468) | [176] | 6.03 |
| Public place | Ma’anshan | Business hour | 133.73 (74.96–259.28) | [177] | 3.82 |
| Residential building | Lanzhou | Daily routine | Kitchen: 124.75 (48.14–279.25); Bedroom: 118.91 (38.34–367.62) | [178] | 3.56; 3.40 |
| Residential building | Nanjing | No cooking, no smoking | 80 (47–113) | [179] | 2.29 |
| Hospital | Shenzhen | Business hour | 36.71 (4.98–318.01) | [180] | 1.05 |
| Government agency | Tianjin | Business hour | 71.0 (1–380) | [181] | 2.03 |
| Shopping mall | Beijing | Business hour | 47 (9–253) | [182] | 1.34 |
| Market | Beijing | Business hour | 56.21–61.36 | [183] | 1.61–2.25 |
| Food court | Nanchang | Business hour | 164 (38.03–492.73) | [184] | 4.69 |
| Ventilation Mode | Reference | Sampling Time Period | Building Type | Impact Factors of I/O Ratio | Results |
|---|---|---|---|---|---|
| Natural ventilation | [169] | 1 December 2013–28 February 2014 | Residential building | Outdoor PM2.5 mass concentration level | When the outdoor PM2.5 concentration is in the ranges of 0–33 μg·m−3, 34–65 μg·m−3, 66–129 μg·m−3, and ≥130 μg·m−3, the I/O ratios are 1.75, 1.05, 0.76 and 0.63, respectively |
| [170] | April–December 2015 (one week per month, except in July and August) | School | Outdoor PM2.5 mass concentration level, ACH, wind speed and outdoor air temperature | The time average I/O is 0.69. It varies in the range of 0.1–5.46. The I/O ratio decreases with the increases of outdoor PM2.5 mass concentration level | |
| [171] | 09:00–18:00, 13–15 March 2014 | Laboratory complex building | ACH | 48.7–57.3% of the PM2.5 pollutants come from indoor sources and the I/O ratio varies 0.90–1.23 | |
| Infiltration | [172] | September 2013–August 2014 | Office | Outdoor dry bulb temperature, relative humidity ratio and wind speed | The average ACH is 0.10 under mild weather, 0.22 when the wind speed is 1.6–3.4 m/s, 0.39 when the wind speed is 5.5–8.0 m/s. The corresponding I/O ratios are 0.43, 0.56 and 0.62, respectively |
| [82] | Winter, 2014 | Residential building | Indoor pollution sources | When the indoor PM2.5 concentration reached its peak value, the I/O ratio was 0.67–0.89 | |
| [76] | June 2013–August 2013; December 2013–February 2014 | Office | Seasonal changes, wind speed and relative humidity ratio | The indoor and outdoor PM2.5 concentrations in winter were higher than those in summer and the corresponding I/O ratios were also higher in winter than in summer |
| Brand | Type | Capacity (W) | Energy Grade | Main PM2.5 Removal Technology | PM2.5 Removal Efficiency |
|---|---|---|---|---|---|
| Panasonic | KFR-36GW/BpSJ1S | 3600 | 3 | PM2.5 air filter | 84% |
| Haier | KFR-50LW/16UCP22AU1 | 5300 | 2 | PET antibacterial and anti-mildew air filter | 99% |
| Gree | KFR-26GW/(26571)FNBh-1 | 2650 | 1 | Group filters with strong PM2.5 capturing ability, primary air filter and high efficiency air filter | ≥97% |
| KELON | KFR-72LW/EFVEA2(2N01) | 7200 | 2 | Inhibitory fins that inhibit the growth of 99.9% bacteria | ≥99% |
| Midea | KFR-35GW/BP3DN1Y-QA100 | 3500 | 1 | Washable PM2.5 purifying module and dust collecting device | 90% |
© 2018 by the authors. Licensee MDPI, Basel, Switzerland. This article is an open access article distributed under the terms and conditions of the Creative Commons Attribution (CC BY) license (http://creativecommons.org/licenses/by/4.0/).
Share and Cite
Lin, Y.; Zou, J.; Yang, W.; Li, C.-Q. A Review of Recent Advances in Research on PM2.5 in China. Int. J. Environ. Res. Public Health 2018, 15, 438. https://doi.org/10.3390/ijerph15030438
Lin Y, Zou J, Yang W, Li C-Q. A Review of Recent Advances in Research on PM2.5 in China. International Journal of Environmental Research and Public Health. 2018; 15(3):438. https://doi.org/10.3390/ijerph15030438
Chicago/Turabian StyleLin, Yaolin, Jiale Zou, Wei Yang, and Chun-Qing Li. 2018. "A Review of Recent Advances in Research on PM2.5 in China" International Journal of Environmental Research and Public Health 15, no. 3: 438. https://doi.org/10.3390/ijerph15030438
APA StyleLin, Y., Zou, J., Yang, W., & Li, C.-Q. (2018). A Review of Recent Advances in Research on PM2.5 in China. International Journal of Environmental Research and Public Health, 15(3), 438. https://doi.org/10.3390/ijerph15030438