Study on Urban Heat Island Intensity Level Identification Based on an Improved Restricted Boltzmann Machine


Abstract
:1. Introduction
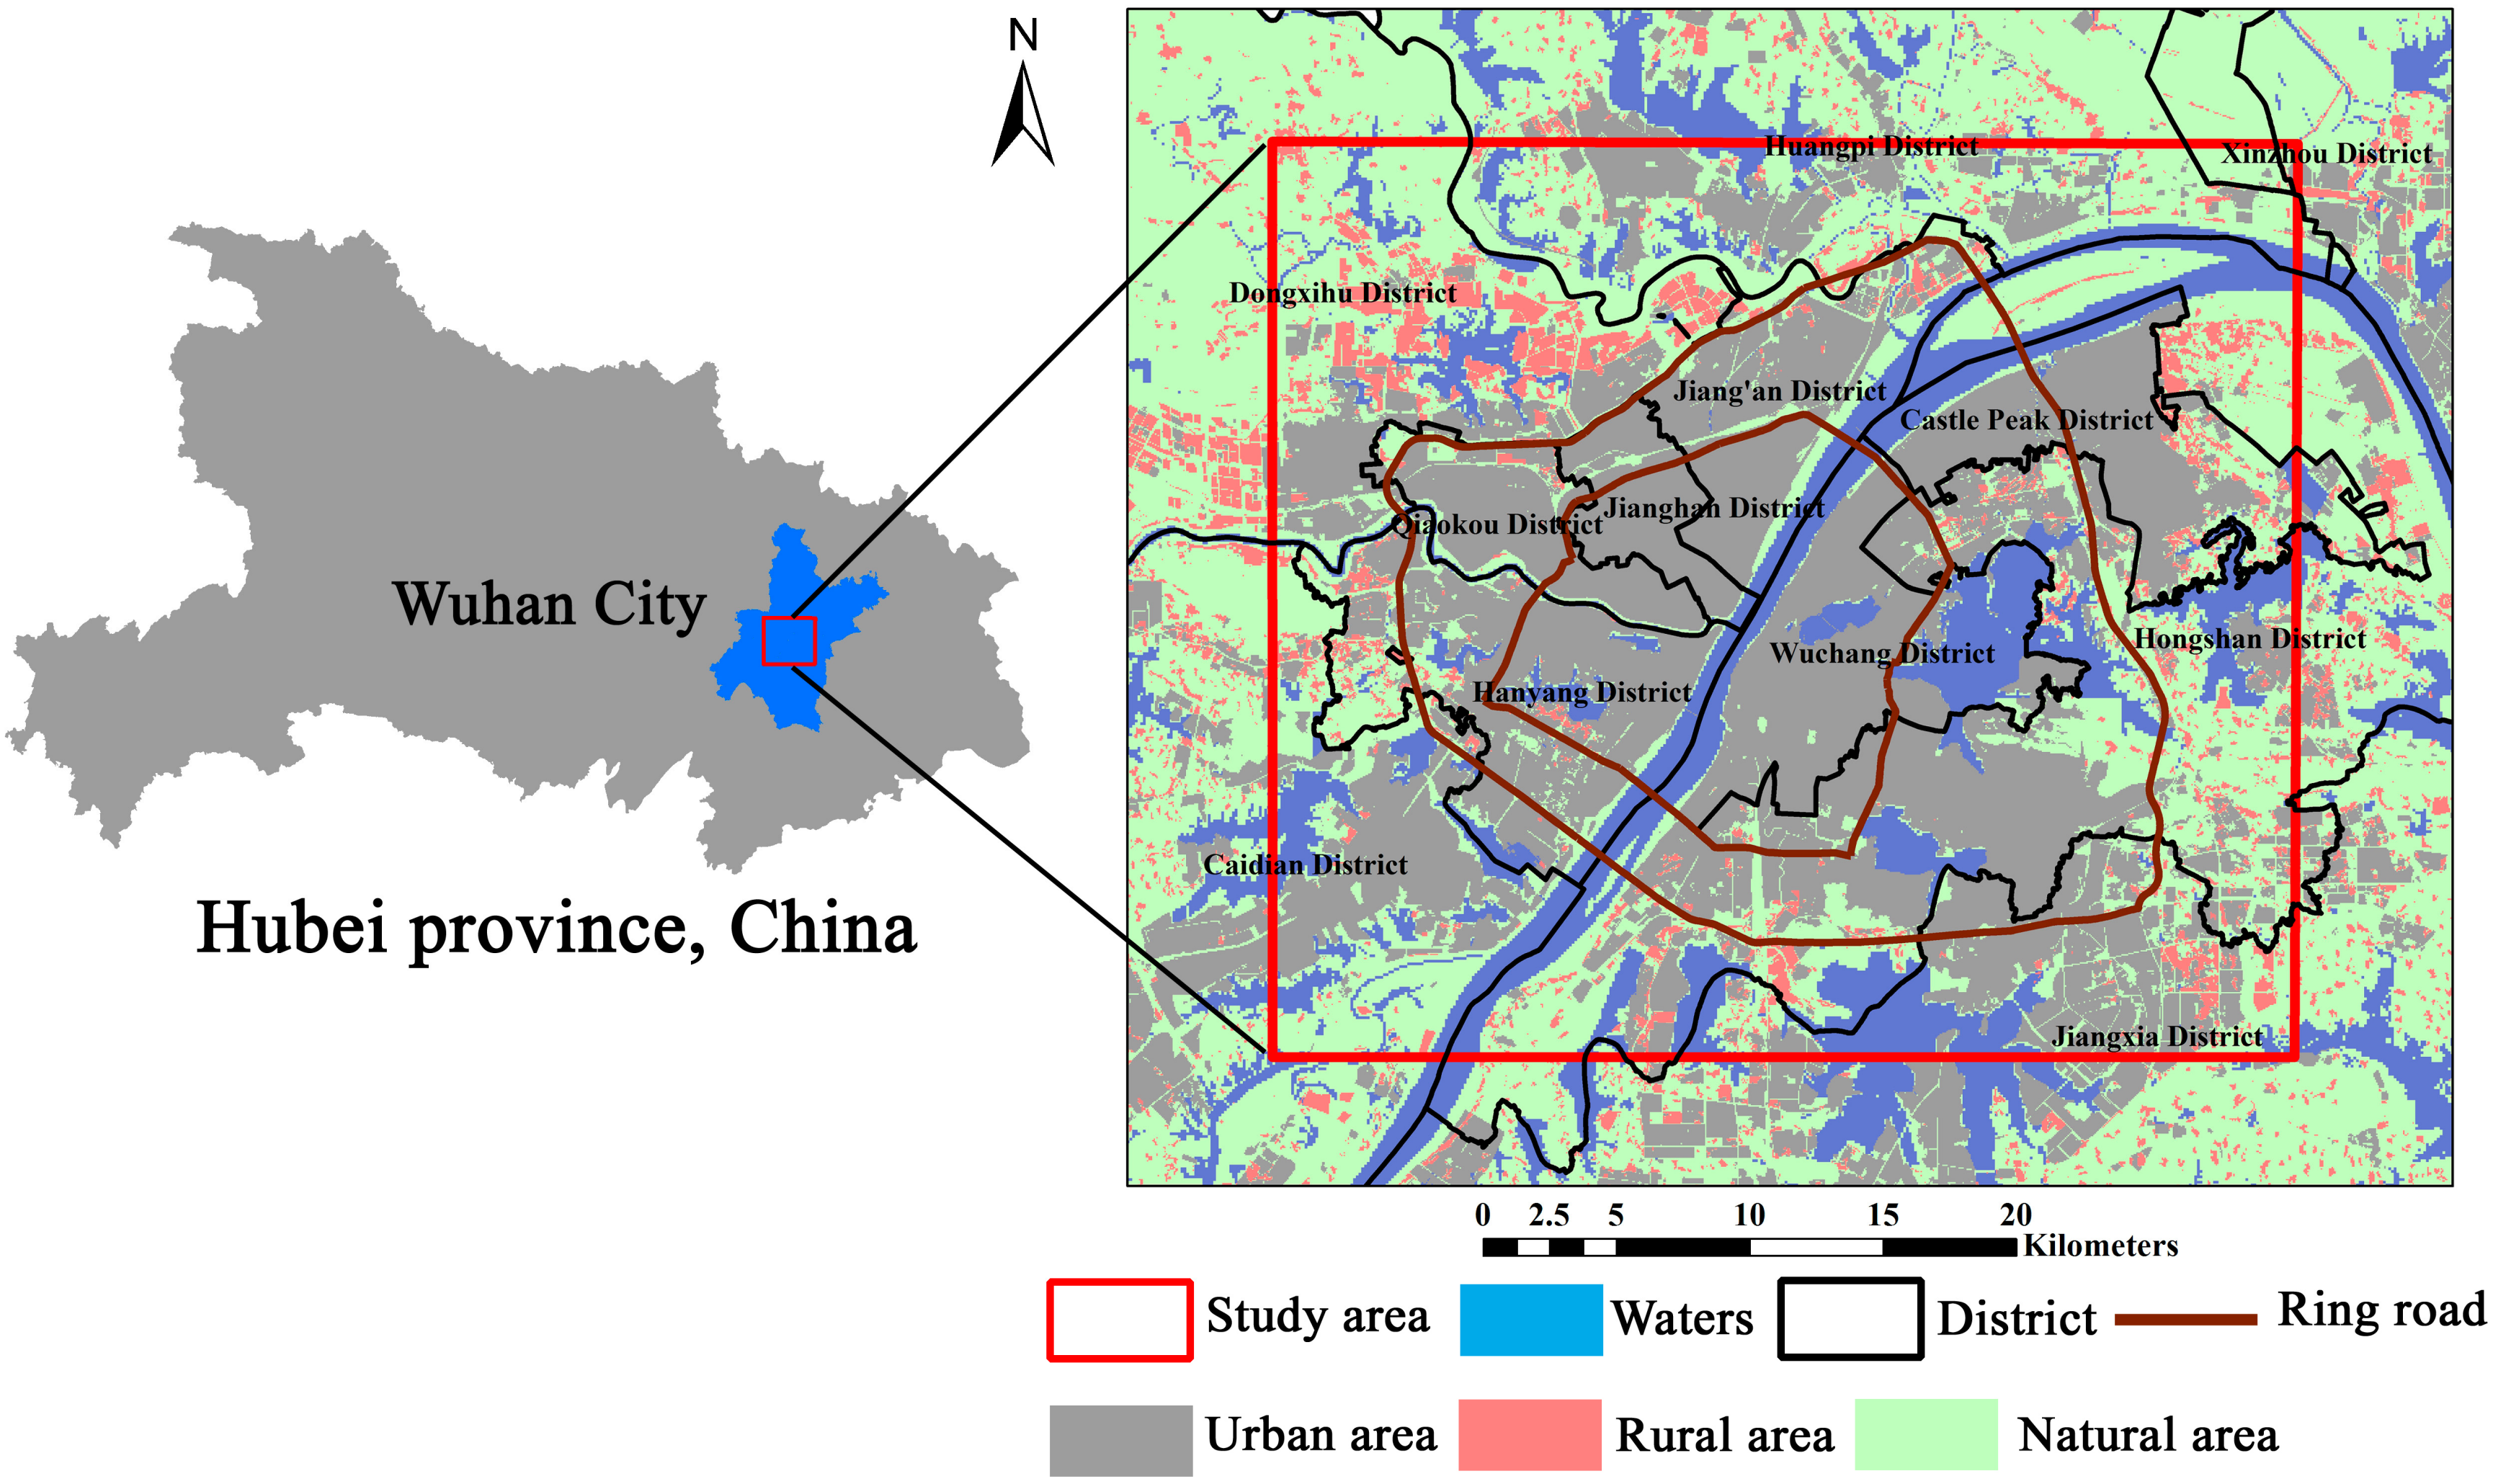
2. Research Area and Data
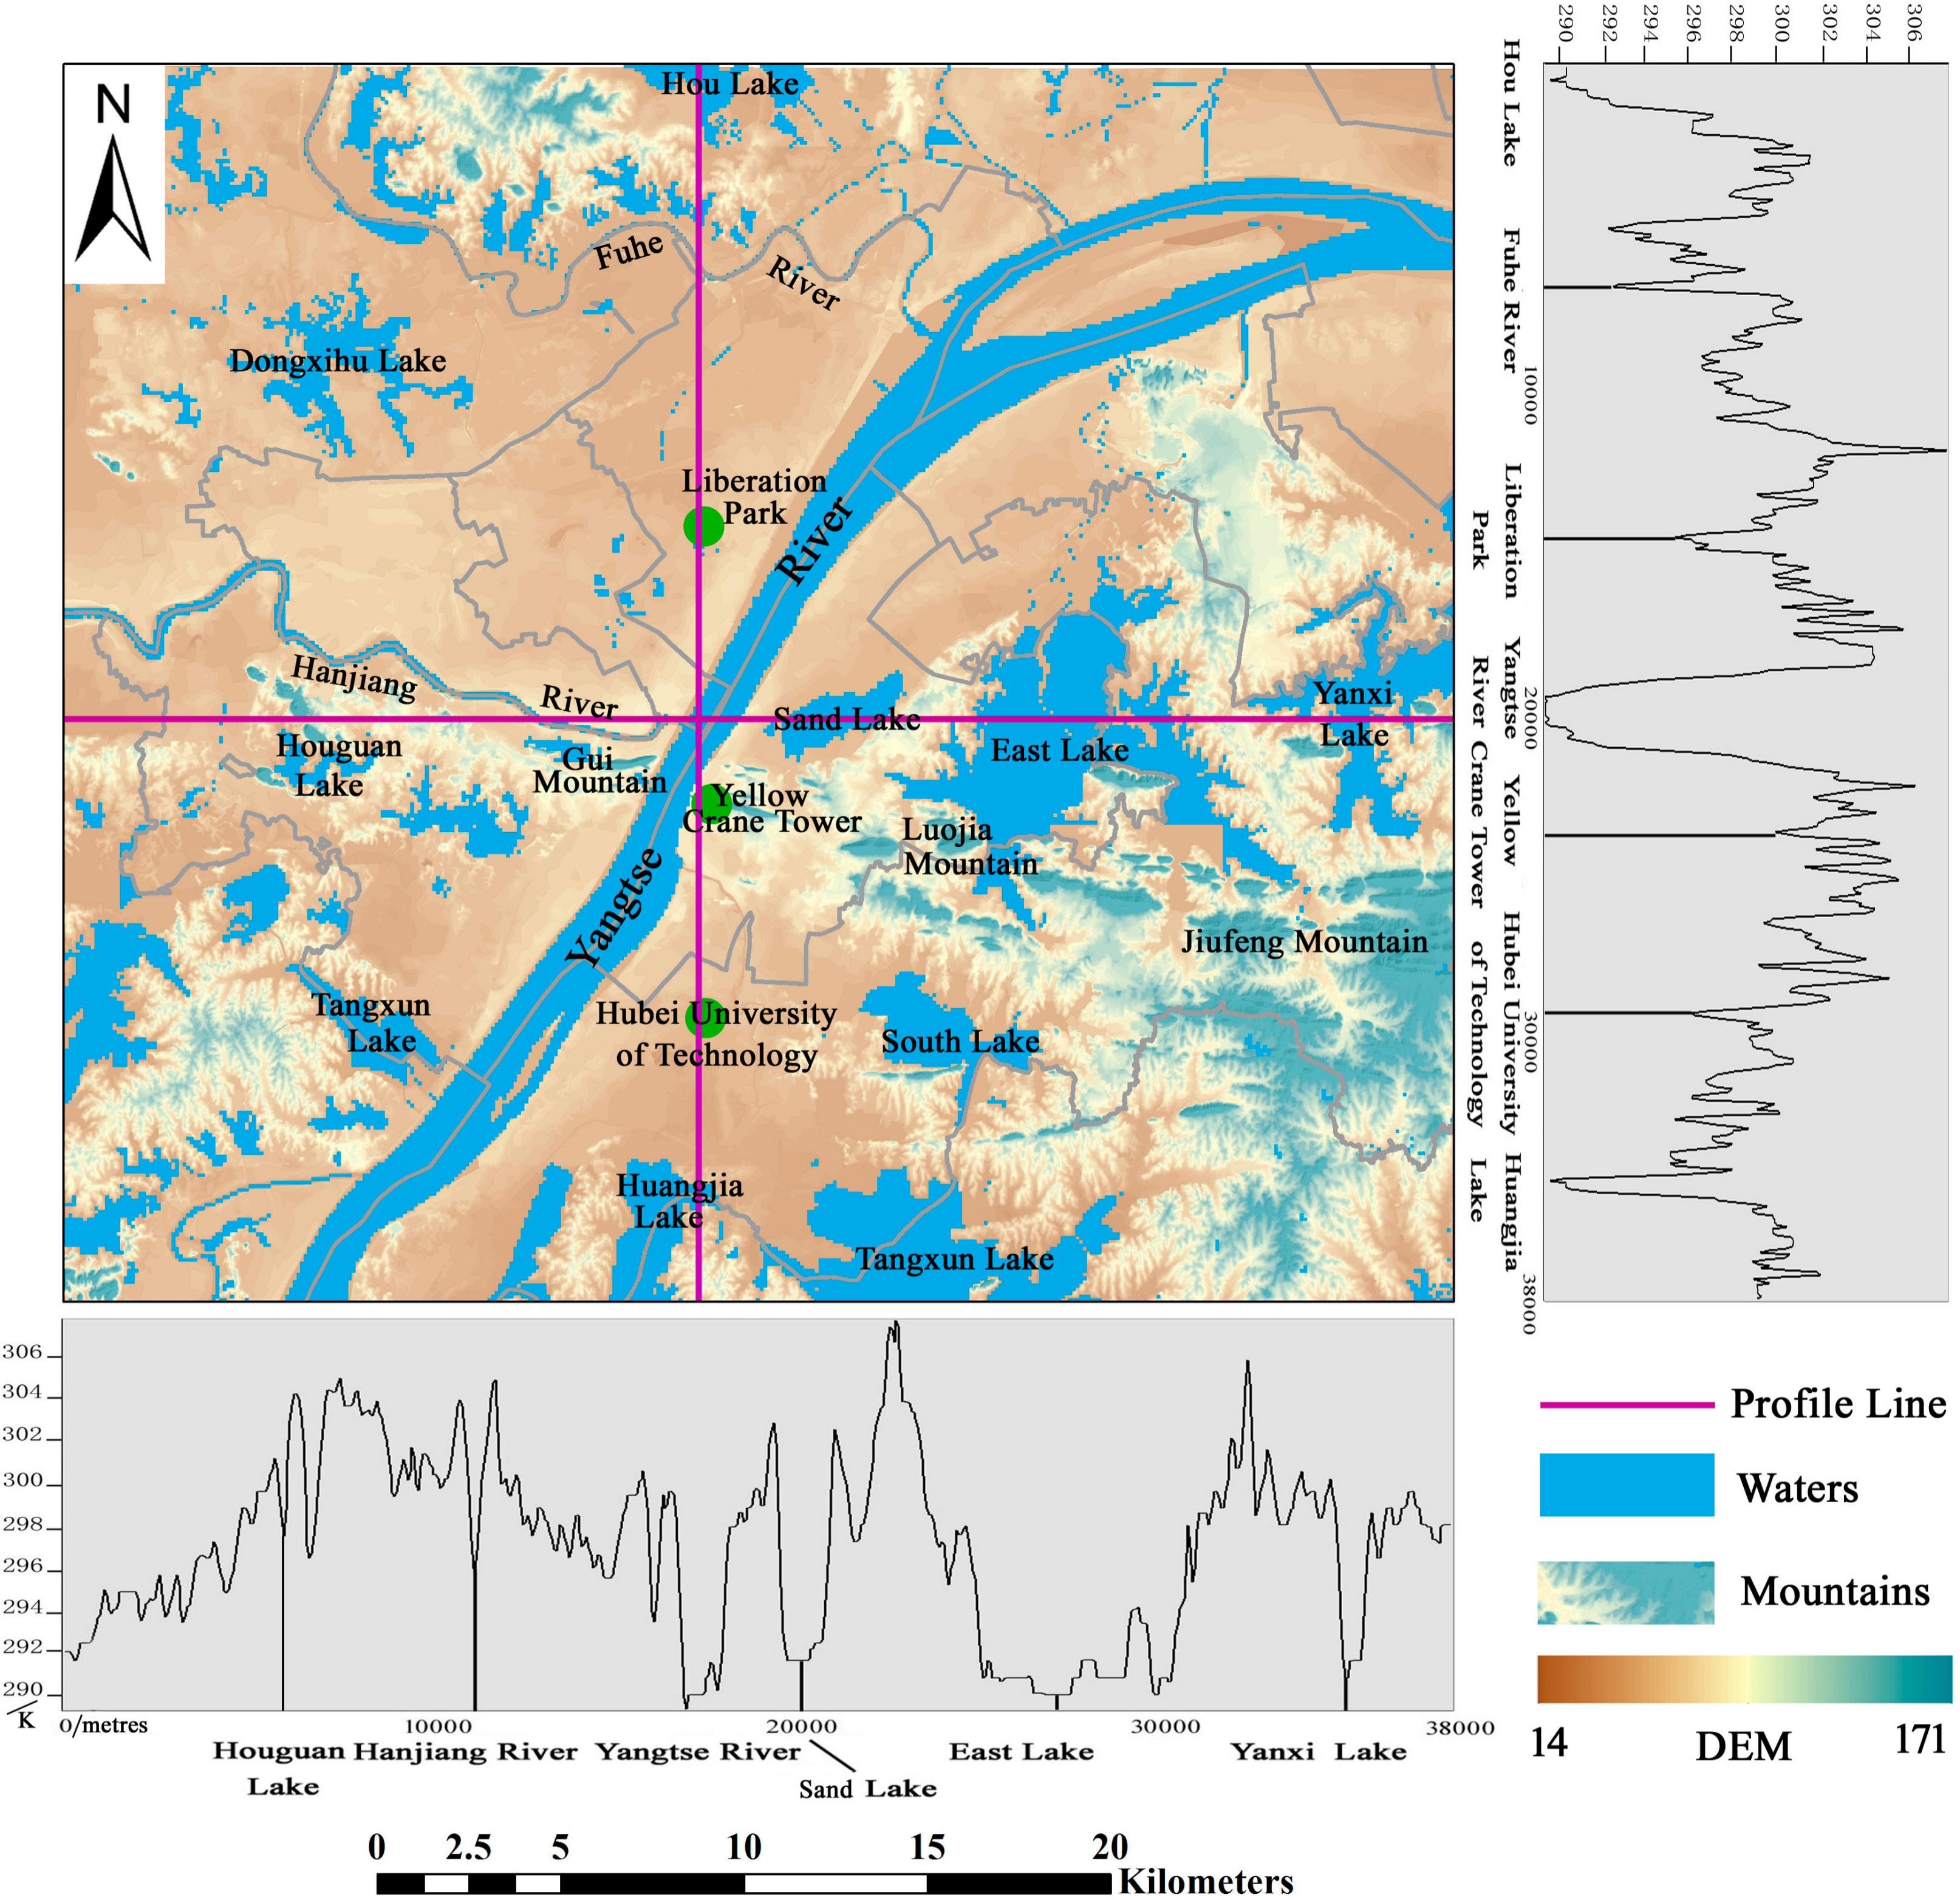
2.1. Research Area
2.2. Data
3. Research Methods
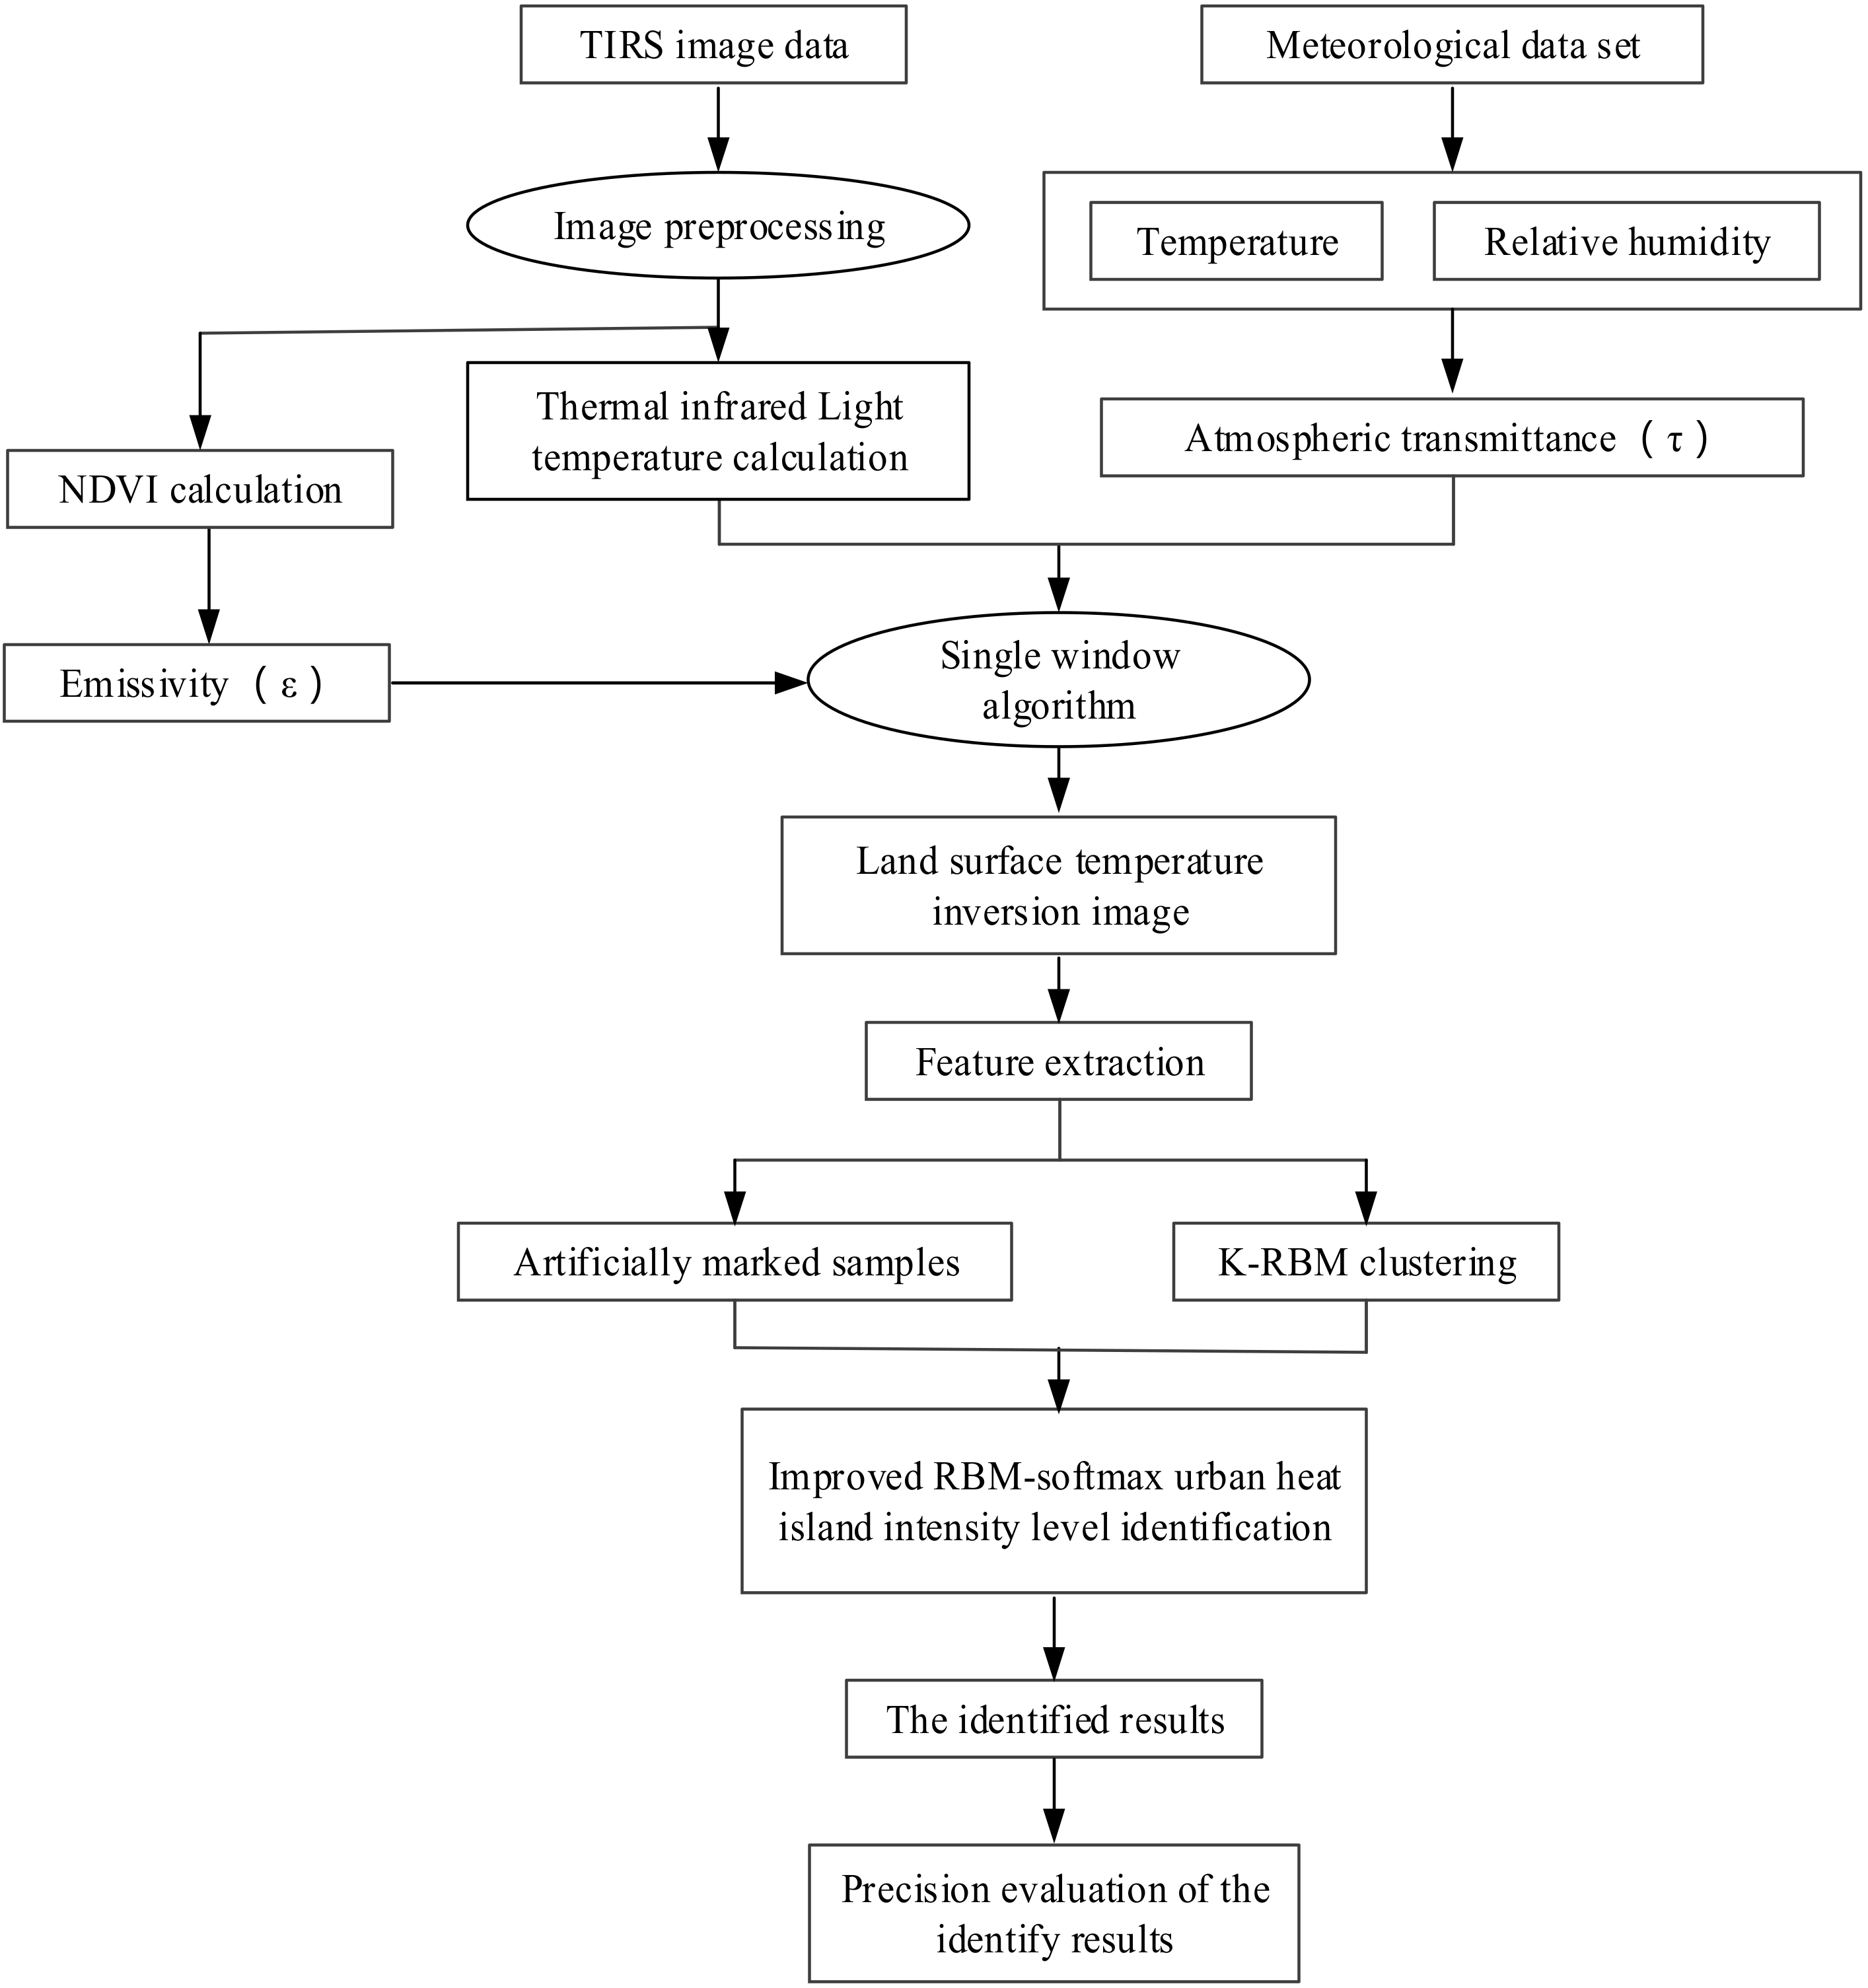
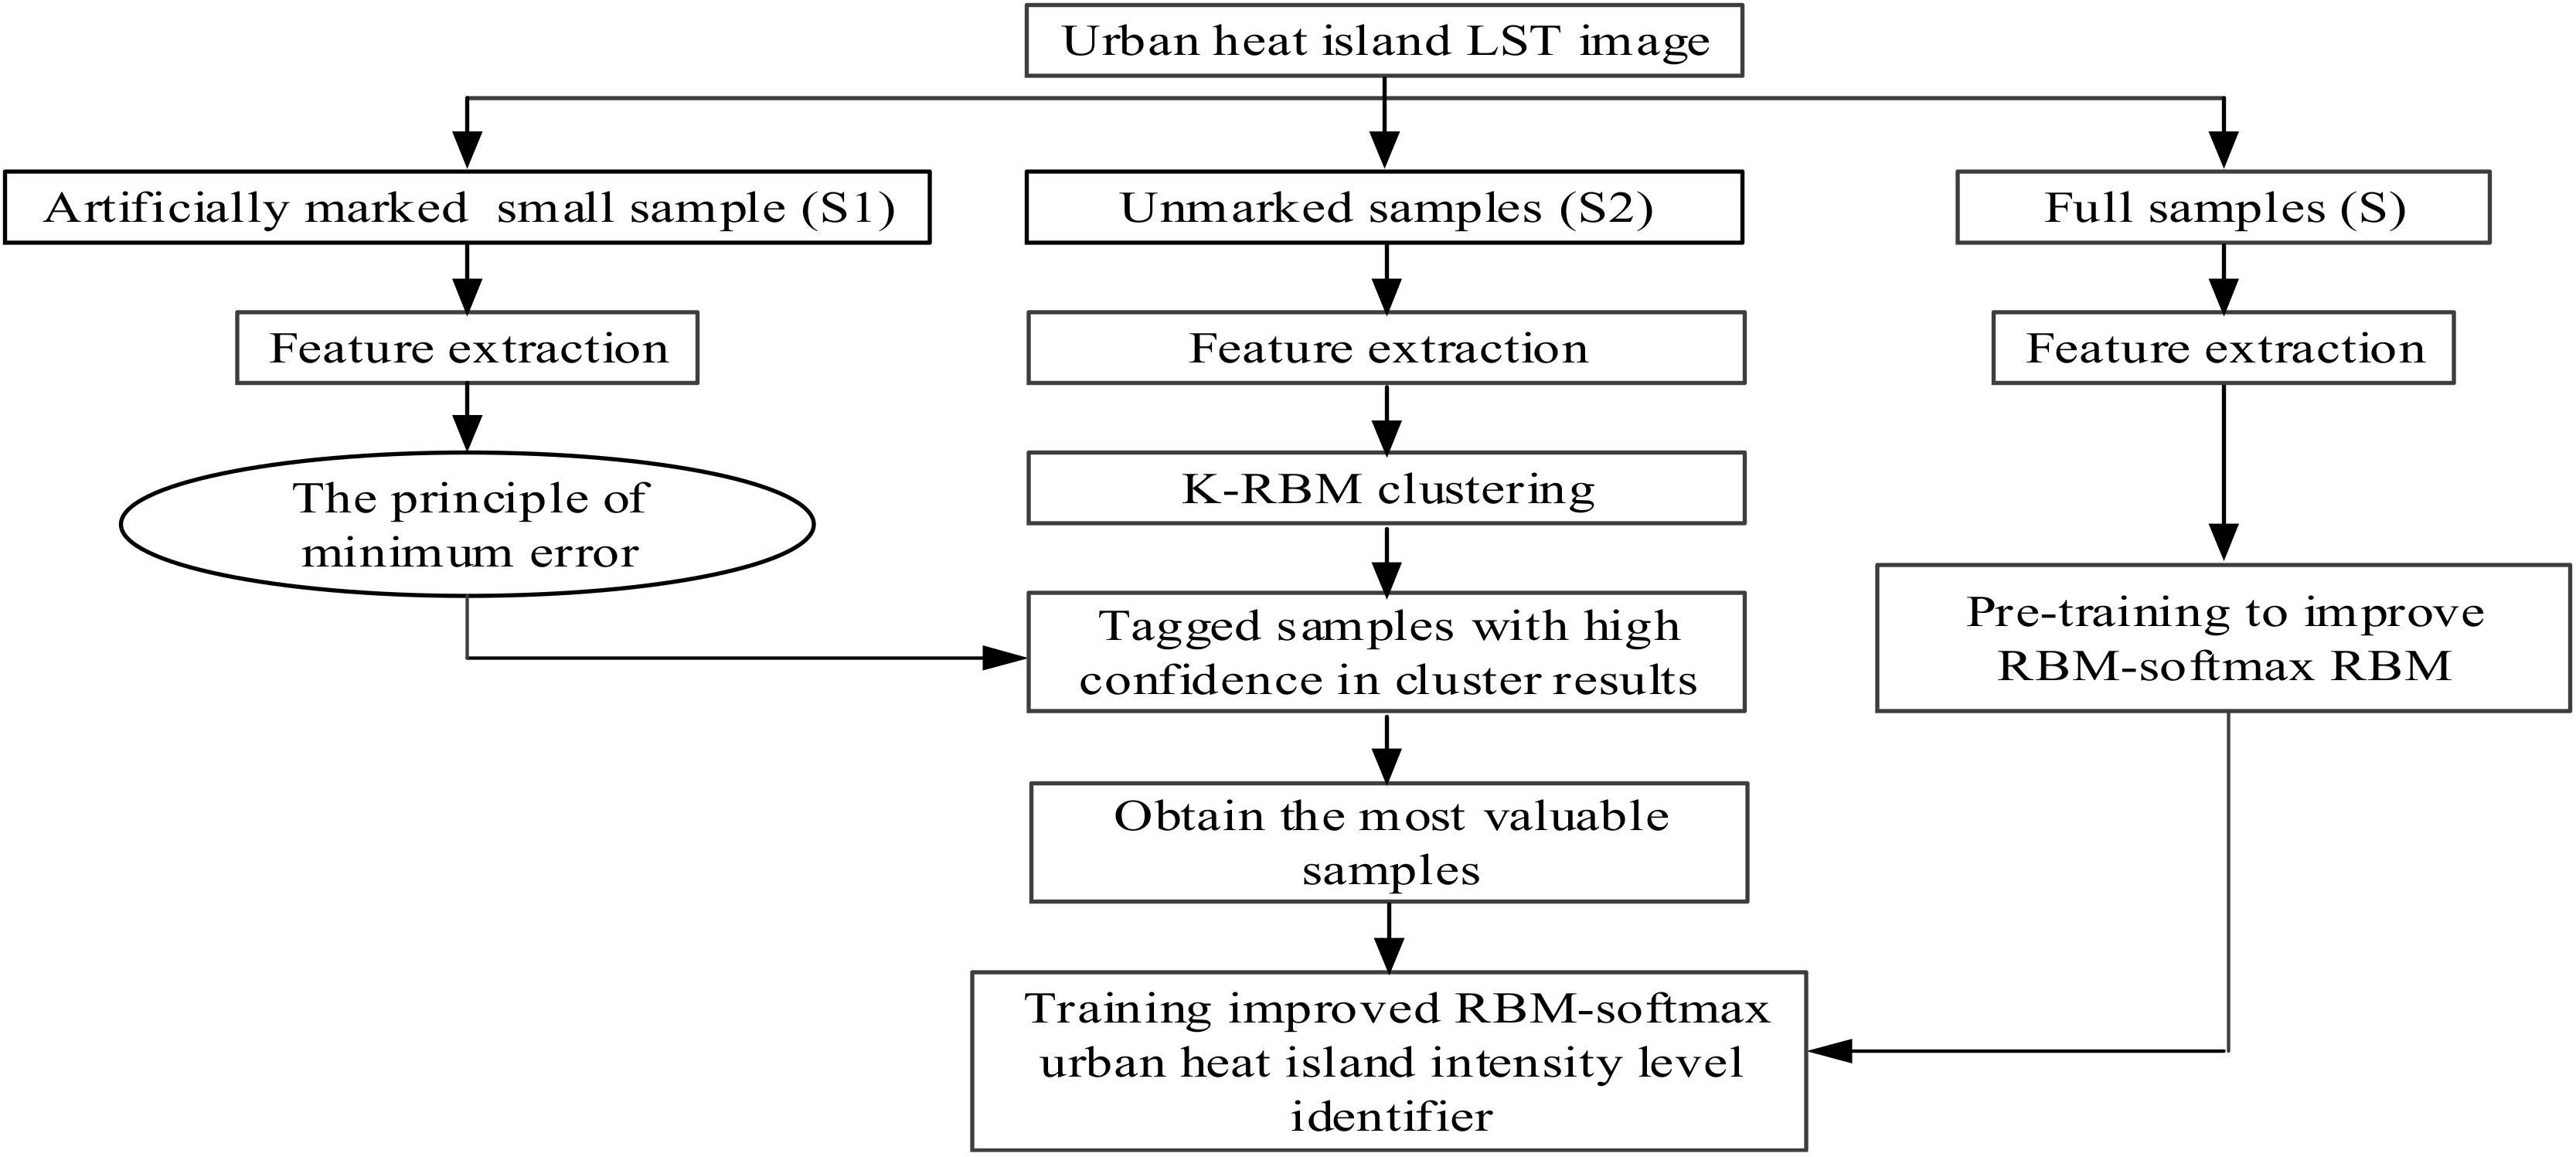
3.1. Technical Route
3.2. Land Surface Temperature Inversion
3.3. K-RBM Clustering
- (1)
- Initialize K-RBMs, and initialize the rate of error change (EC = 15) of the sum of the reconstruction errors of the eigenvectors of all the pixels in the sample. Initialize all elements in the class chart Y to 0, Y = {ym,n|1 ≤ m ≤ M, 1 ≤ n ≤ N}; ym,n indicates the class of any pixel (m, n) in the sample. The number of the subscript k in the 3 × 3 neighborhood of (m, n) in the initialized graph Y is N3m,n(k) = 0.
- (2)
- Input the feature vectors of all the pixels (A) into the K-RBMs.The feature vectors of all the pixels (m, n) are input into the K-RBMs, and the reconstruction error () of the K-RBMs for Fm,n is calculated. Based on the principle of minimum error, the extracted feature vector (Fm,n) is classified into K groups (Sk).
- (3)
- Correct the error of the preliminary classification results. In this step, the mean value (Pk) of the eigenvector (Fm,n ) in Sk is calculated; then, the distance () between Fm,n and the cluster center is calculated.where T1 represents the threshold.
- (4)
- Train the K-RBMs by the feature vector (Fm,n) in Gk. If the algorithm converges, the training is terminated, otherwise perform step 2.
3.4. Improved Restricted Boltzmann Machine
- (1)
- is normalized for each row of matrix (HJ×L), using to denote the value of row j and column 1 in the matrix after row normalization. The formula is expressed as follows:
- (2)
- l2 is normalized for the columns of the normalized matrix, using to denote the value of row j and column 1 in the matrix after row normalization. The formula is expressed as follows:
3.5. Construction of the Urban Heat Island Intensity Level Identification Algorithm Based on the Improved RBM
- (1)
- A small amount of sample S1 is extracted from the image that has been subjected to the land surface temperature inversion and it is manually marked. The number of artificial markers in a small sample of S1 of each type of clustering center is calculated. At the same time, the unmarked samples (S2) are clustered based on the K-means algorithm.
- (2)
- The Euclidean distance between the two types of cluster centers is compared with that of S1 and S2. Based on the minimum error criterion, the set of assignments with higher confidence, achieved via the K-RBM algorithm, is selected and combined with S1 samples to form the most valuable samples.
- (3)
- For pre-training to improve the RBM, the unsupervised learning of the RBM is improved by using the full sample (S). The next step is carried out when the error between the modified training samples of the RBM and the reconstructed data is quite small. At the same time, the relevant parameters obtained from the pre-training improvement RBM are used in the next step to improve the RBM; otherwise, continue to perform pre-training operations.
- (4)
- The most valuable sample obtained in step 2 is entered into the improved RBM-softmax urban heat island intensity level identification model, training the model parameters by the steepest descent method until convergence.
- (5)
- The data are input into the trained RBM-softmax urban heat intensity level identifier; then, the identification result is obtained, and the classification accuracy is calculated.
4. Results Analysis
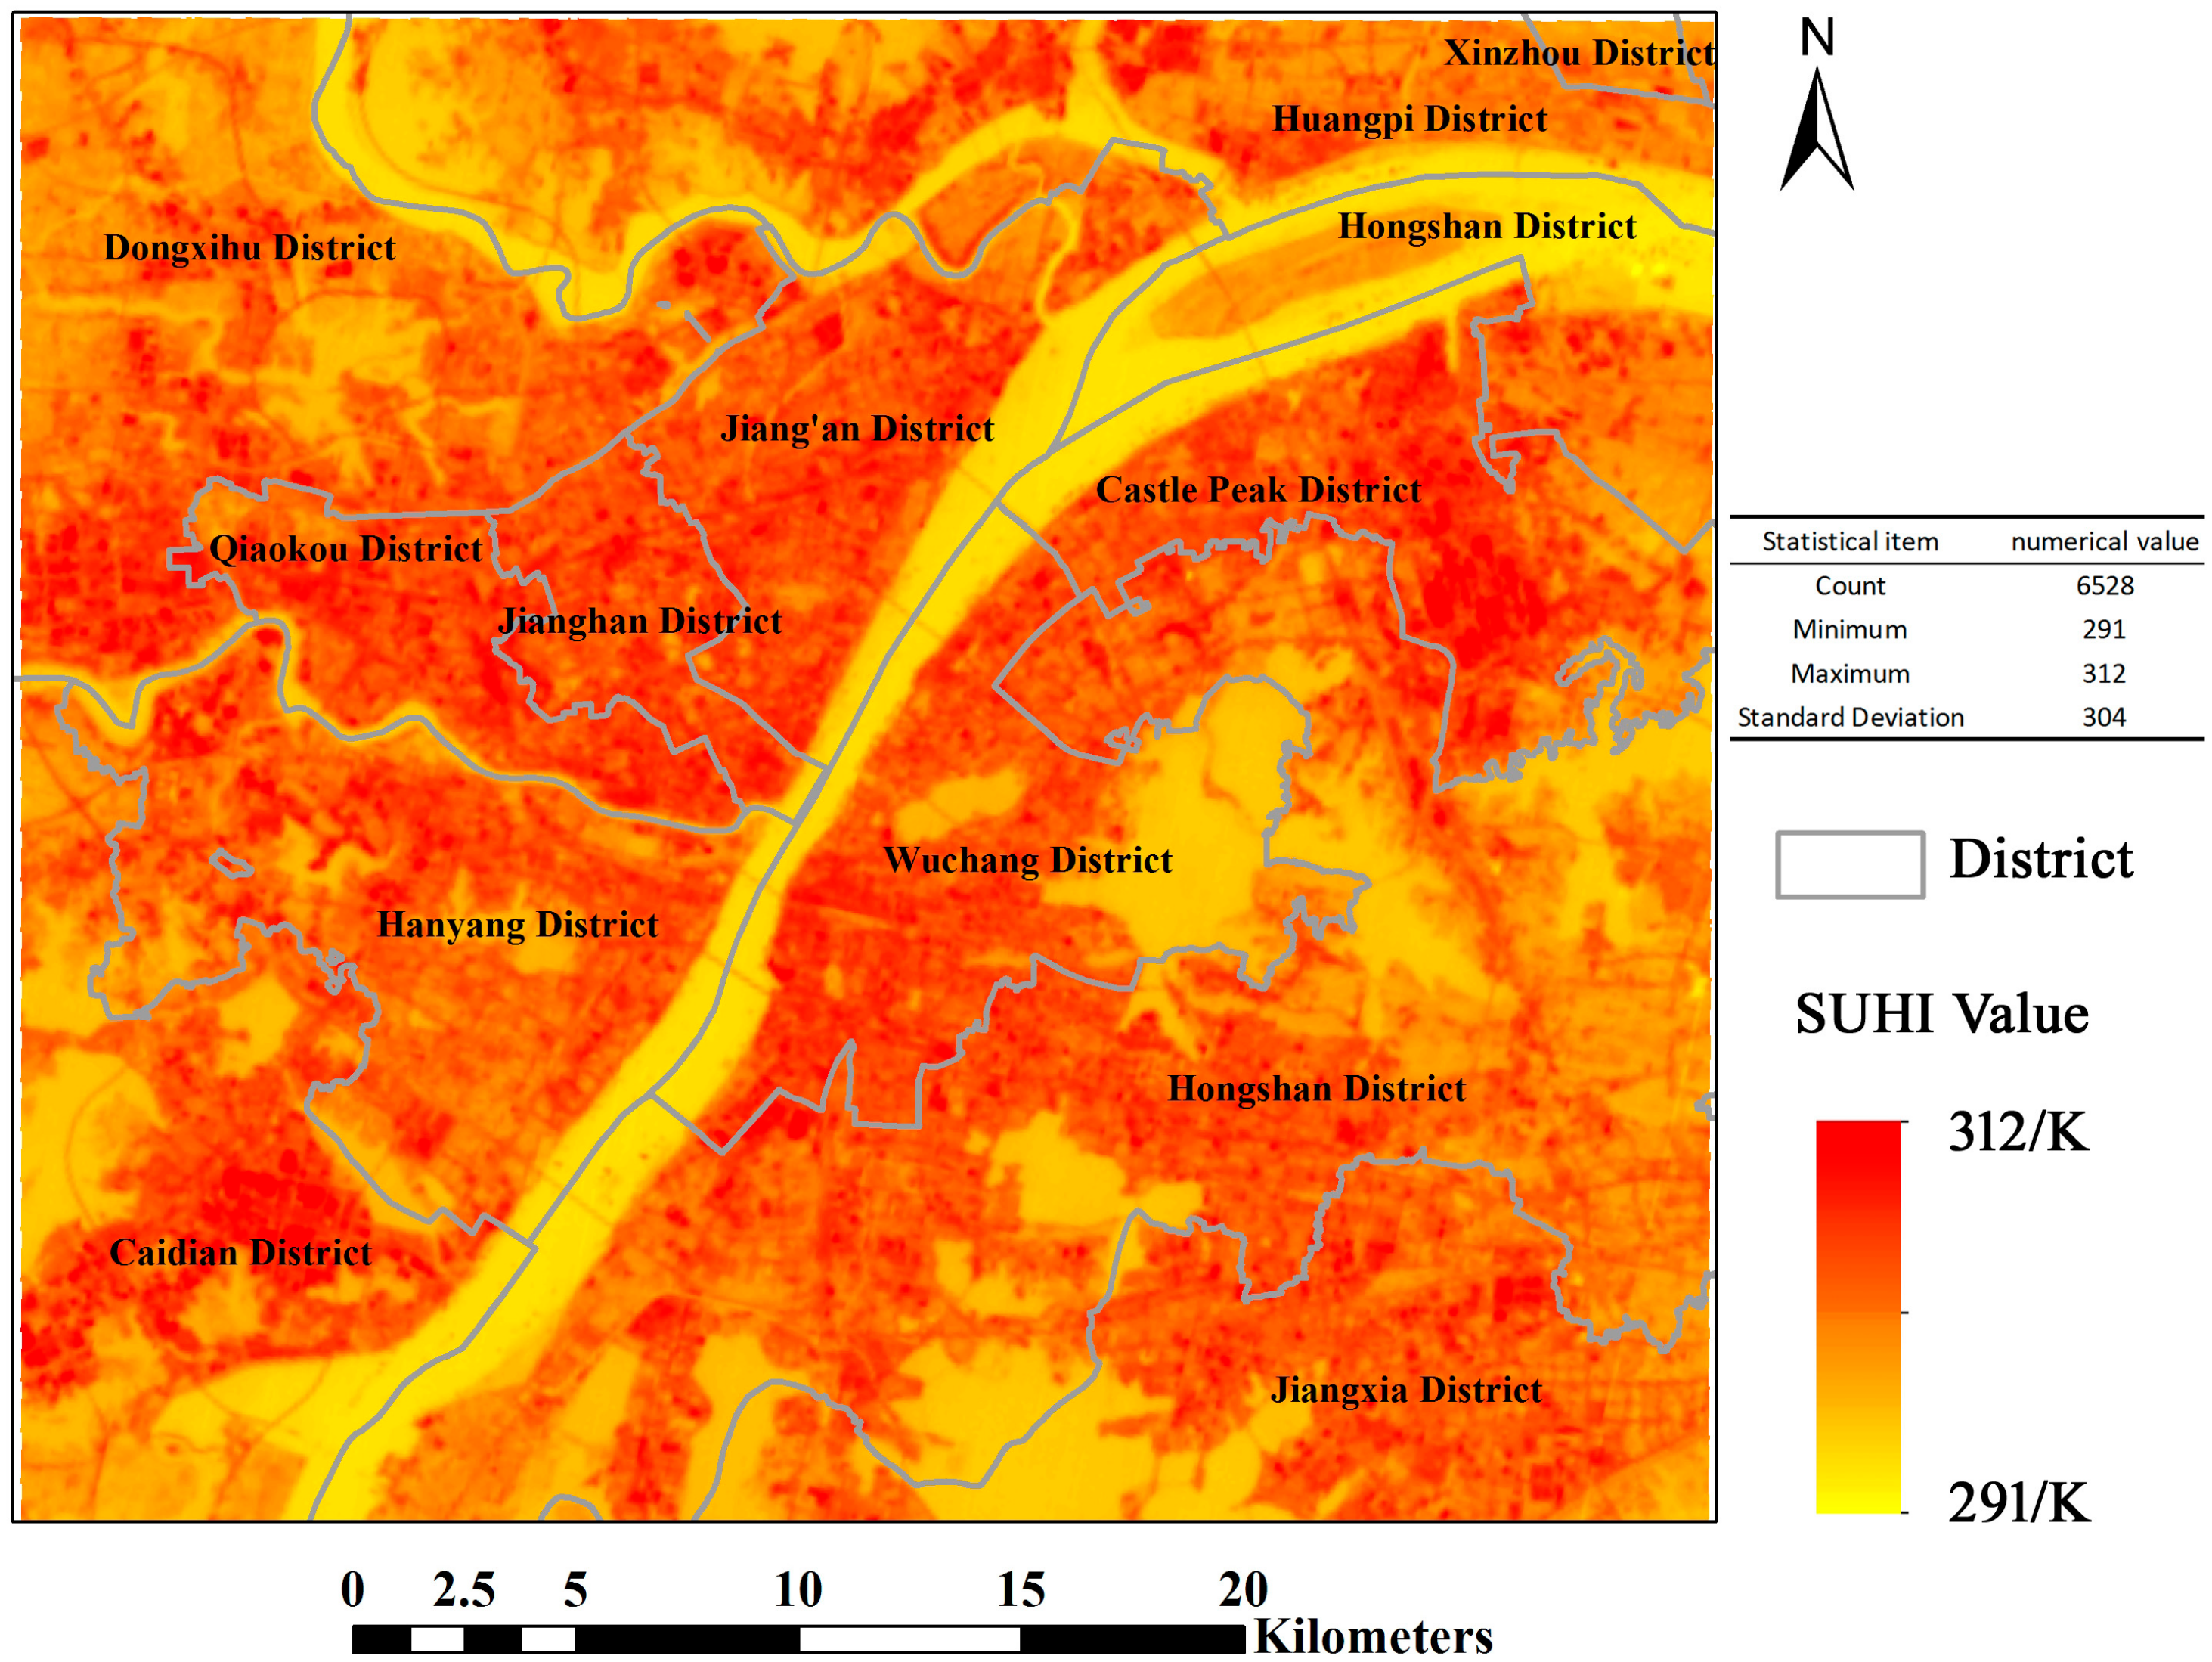
4.1. Spatial Distribution of Surface Urban Heat Island
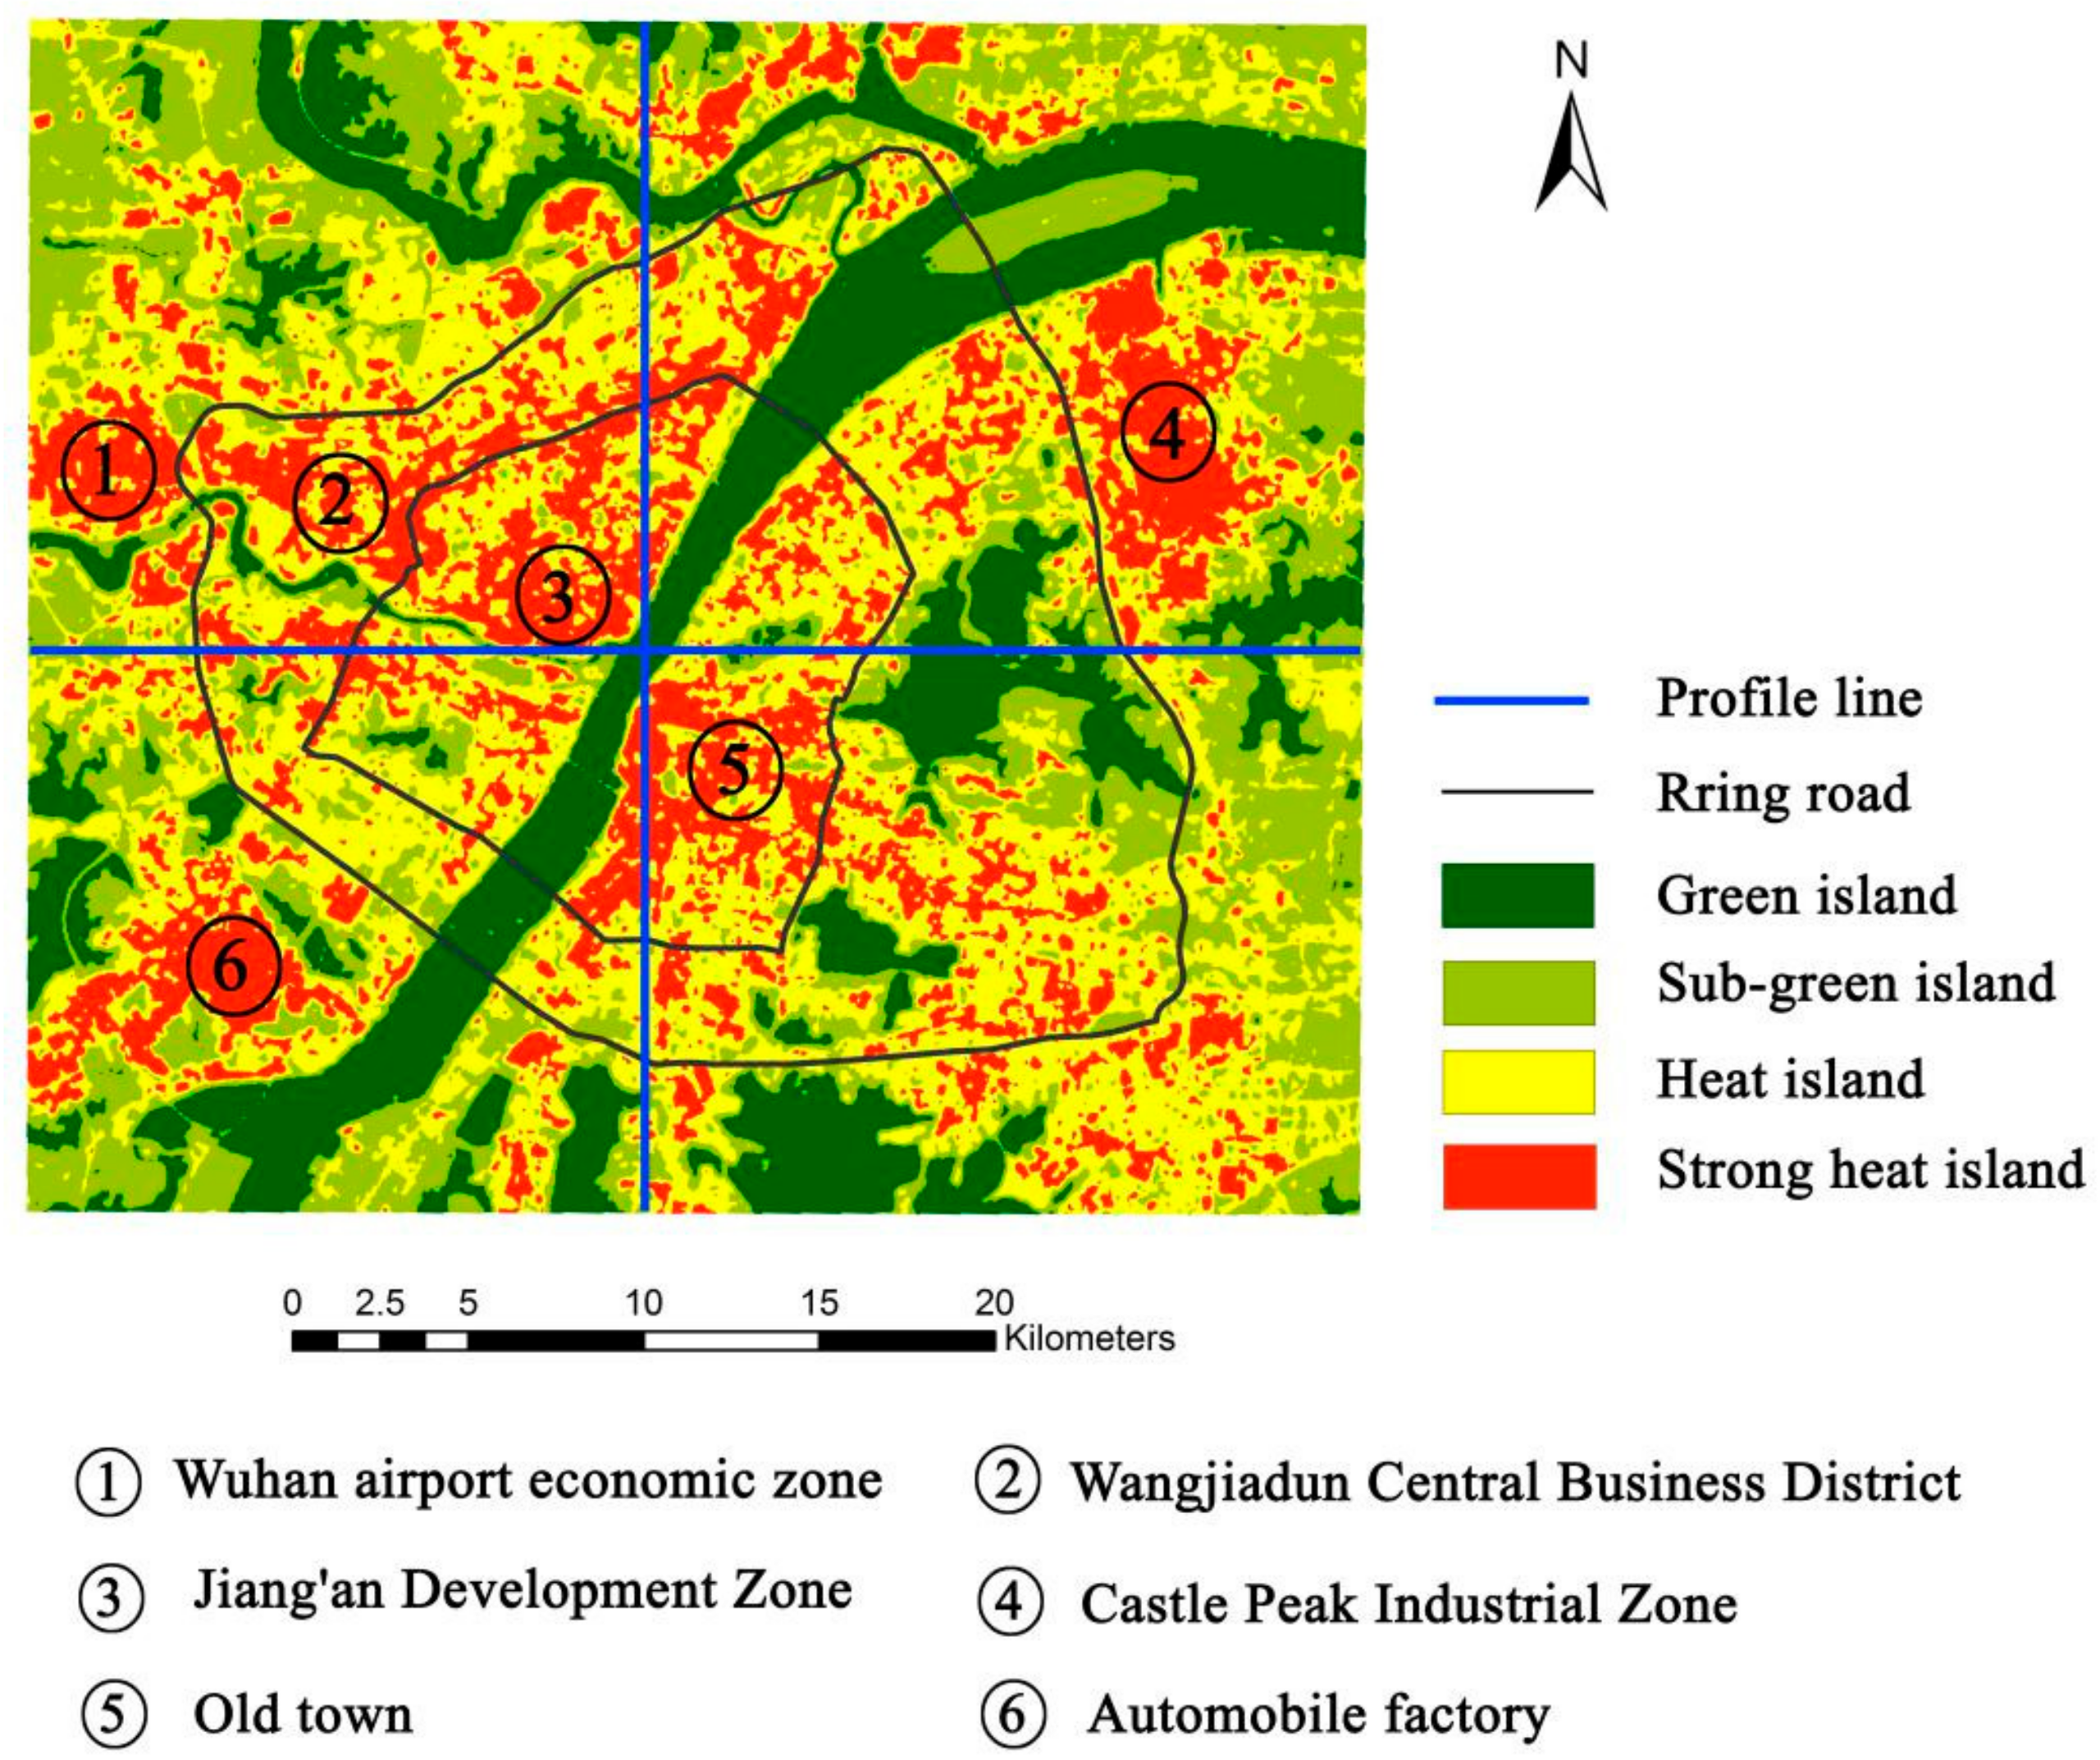
4.2. Identify the Results
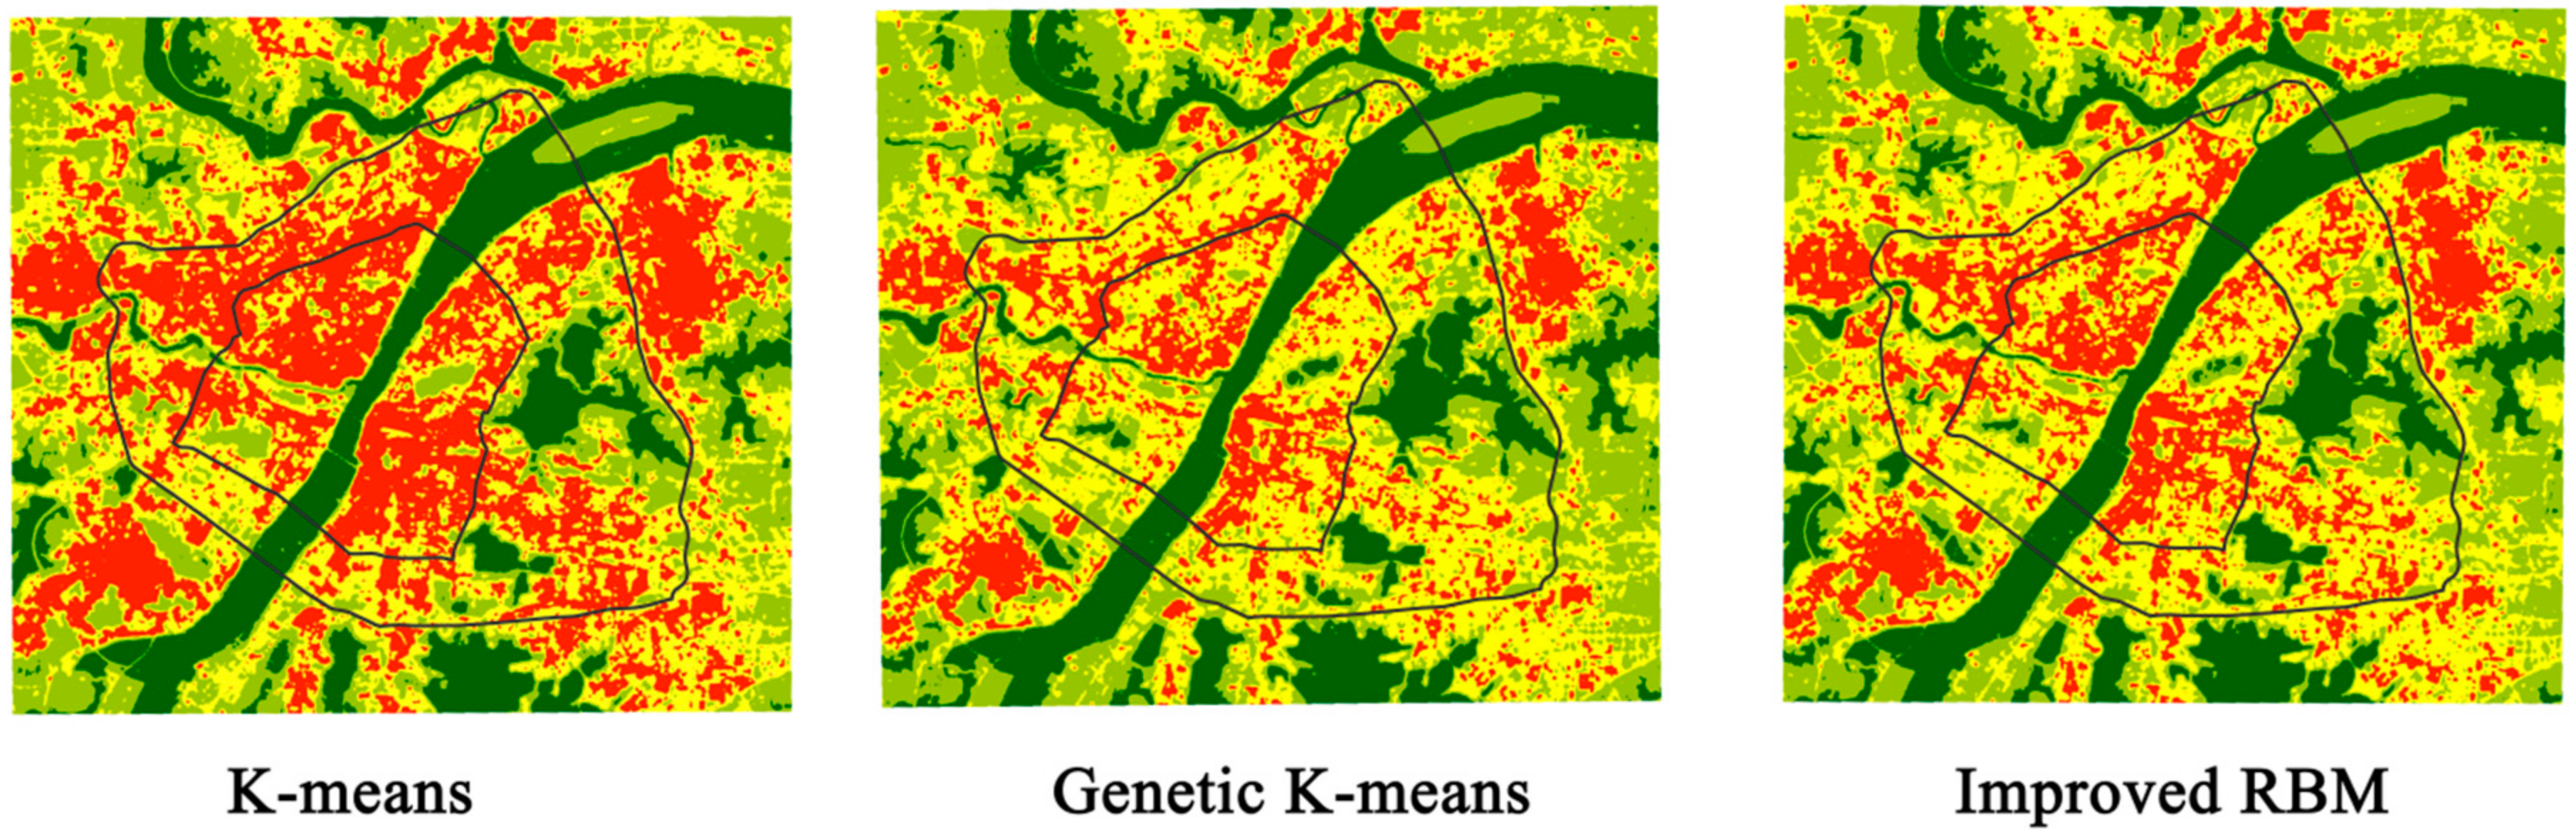
4.3. Comparison of Identification Results
5. Discussion
6. Conclusions
- (1)
- The largest heat island area is that of the heat island level in Wuhan. Regarding the hottest areas that can be seen, most of the “heat” comes from the industrial building area; secondary heat sources are mainly distributed in dense, commercial areas and residential areas. Heavy industry production companies, steel mills and other enterprises in production projects produce a lot of heat. From the heat island spatial distribution map, the distribution of water and green space can also be clearly seen; the impact of the distribution of water and green space on urban surface light temperature is very obvious. Around the several large lakes and urban parks of the main city of Wuhan, a green island center of Wuhan is formed.
- (2)
- For the RBM identification algorithm, the total accuracy was 93.31%, the kappa coefficient was 0.8861, and the test time was 0.72 s. The algorithm had a good classification effect, and the computational efficiency was higher than that of the K-means clustering algorithm. Compared with K-means and the genetic K-means, the improved RBM identification algorithm is more obvious in terms of the division of the temperature level within the city, and the boundary of the category is obvious. The clustering effect of the algorithm can determine the spatial distribution of the heat island effect within the city, and this method is more practical than others.
- (3)
- Based on the improved RBM model, this paper analyzed the urban heat island and compared it to those obtained with other methods. The focus of the study the spectral characteristics of surface temperature after inversion, which includes texture features for further feature extraction. This method may be enhanced by adding other methods to complete the feature extraction, such as an automatic encoder method. In the process of RBM learning, it is possible to obtain a positive training sample image and a negative training sample image, through the use of a sliding window, to obtain a better distribution rule of the data.
Acknowledgments
Author Contributions
Conflicts of Interest
Nomenclature
| Lλ | Radiation intensity received by the TM remote sensor |
| DN | Digital number |
| ε | Specific emissivity |
| T | Radiation light temperature |
| A0, A1, A2 | Coefficient of Formula (5) |
| τ | Atmospheric transmittance |
| ω | Water vapor |
| ai, bi | Regression coefficients of TIRS |
| E0, E1, E2, Ci, Di | Procedure parameter |
| k, K | Classification sequence number, number of classifications, respectively |
| m, n | Line sequence number of pixels, column sequence number of pixels, respectively |
| M, N | Maximum number of lines and columns in pixels |
| i, I | Sequence number of X(l), total number of X(l), respectively |
| l, L | Training sample sequence number, total number of training samples, respectively |
| j, J | Sequence number of hidden units, total number of hidden units, respectively |
References
- Stoll, M.J.; Brazel, A.J. Surface-air temperature relationships in the urban environment of Phoenix, Arizona. Phys. Geogr. 1992, 13, 160–179. [Google Scholar]
- Gosling, S.N.; McGregor, G.R.; Paldy, A. Climate change and heat related mortality in six cities part 1: Model construction and validation. Int. J. Biometeorol. 2007, 51, 525–540. [Google Scholar] [CrossRef] [PubMed]
- Imhoff, M.L.; Zhang, P.; Wolfe, R.E.; Bounoua, L. Remote sensing of the urban heat island effect across biomes in the continental USA. Remote Sens. Environ. 2010, 114, 504–513. [Google Scholar] [CrossRef]
- Zhang, Y.; Jiang, P.; Chen, Y.Y. Study on heat island effect in Wuhan city based on land sat TM remote sensing. Ecol. Environ. Sci. 2012, 21, 884–889. (In Chinese) [Google Scholar]
- Grimm, N.B.; Faeth, S.H.; Golubiewski, N.E.; Redman, C.L.; Wu, J.; Bai, X.; Briggs, J.M. Global change and the ecology of cities. Science 2008, 319, 756–760. [Google Scholar] [CrossRef] [PubMed]
- Gosling, S.N.; Lowe, J.A.; McGregor, G.R. Associations between elevated atmospheric temperature and human mortality: A critical review of the literature. Clim. Chang. 2009, 92, 299–3411. [Google Scholar] [CrossRef]
- Buyantuyev, A.; Wu, J. Urban heat islands and landscape heterogeneity: Linking spatiotemporal variations in surface temperatures to land-cover and socioeconomic patterns. Landsc. Ecol. 2010, 25, 17–33. [Google Scholar] [CrossRef]
- Tan, J.G.; Zheng, Y.F.; Tang, X. The urban heat island and its impact on heat waves and human health in Shanghai. Int. J. Biometeorol. 2010, 54, 75–84. [Google Scholar] [CrossRef] [PubMed]
- Clinton, N.; Gong, P. MODIS detected surface urban heat islands and sinks: Global locations and controls. Remote Sens. Environ. 2013, 134, 294–304. [Google Scholar] [CrossRef]
- Voogt, J.A.; Oke, T.R. Thermal remote sensing of urban climates. Remote Sens. Environ. 2003, 86, 370–384. [Google Scholar] [CrossRef]
- Fung, W.Y.; Lam, K.S.; Nichol, J.; Wong, M.S. Derivation of nighttime urban air temperatures using a satellite thermal image. J. Appl. Meteorol. Climatol. 2009, 48, 863–872. [Google Scholar] [CrossRef]
- Rizwan, A.M.; Dennis, L.Y.; Chunho, L.I.U. A review on the generation, determination and mitigation of urban heat island. J. Environ. Sci. 2008, 20, 120–128. [Google Scholar] [CrossRef]
- Peng, B.F.; Shi, Y.S.; Wang, H.F. The impacting mechanism and laws of function of urban heat islands effect: A case study of Shanghai. Acta Geogr. Sin. 2013, 68, 1461–1471. [Google Scholar]
- Ren, Z.; He, X.; Zheng, H.; Zhang, D.; Yu, X.; Shen, G.; Guo, R. Estimation of the relationship between urban park characteristics and park cool island intensity by remote sensing data and field measurement. Forests 2013, 4, 868–886. [Google Scholar] [CrossRef]
- Haashemi, S.; Weng, Q.H.; Darvishi, A.; Alavipanah, S.K. Seasonal variations of the surface urban heat island in a semi-arid city. Remote Sens. 2016, 8, 352. [Google Scholar] [CrossRef]
- Zhou, H.M.; Zhou, C.H.; Ge, W.Q. The surveying on thermal distribution in urban based on GIS and remote sensing. Acta Geogr. Sin.-Chin. Ed. 2001, 56, 197–204. (In Chinese) [Google Scholar]
- Weng, Q.H.; Rajasekar, U.; Hu, X.F. Modeling urban heat islands and their relationship with impervious surface and vegetation abundance by using ASTER images. IEEE Trans. Geosci. Remote Sens. 2011, 49, 4080–4089. [Google Scholar] [CrossRef]
- Xie, Q.J. Analysis on characteristics and influencing factors of urban heat island effect in Wuhan. Resour. Environ. Yangtze Basin 2016, 25, 463–469. (In Chinese) [Google Scholar]
- Li, L.G.; Liu, X.M.; Zhao, X.L.; Wang, H.B.; Wang, X.Y.; Zhang, Y.S. Characteristics of heat island effect in inner and outer suburbs of Shenyang and the relationships with urbanization. J. Appl. Ecol. 2010, 21, 1609–1613. (In Chinese) [Google Scholar]
- Li, L.G.; Wang, H.B.; Jia, Q.Y.; Guo, H.L.; Wang, X.Y.; Zhang, Y.S.; Ai, J.F. Urban heat island intensity and its grading in Liaoning province of Northeast China. J. Appl. Ecol. 2012, 23, 1345–1350. (In Chinese) [Google Scholar]
- Zhang, Y.J.; Alan, T.M.; Turner, B.L. Optimizing green space locations to reduce daytime and nighttime urban heat island effects in Phoenix, Arizona. Landsc. Urban Plan. 2017, 165, 162–171. [Google Scholar] [CrossRef]
- Dos Santos, A.R.; de Oliveira, F.S.; da Silva, A.G.; Gleriani, J.M.; Gonçalves, W.; Moreira, G.L.; Silva, F.G.; Branco, E.R.F.; Moura, M.M.; da Silva, R.G.; et al. Spatial and temporal distribution of urban heat islands. Sci. Total Environ. 2017, 605, 946–956. [Google Scholar] [CrossRef] [PubMed]
- Yokobori, T.; Ohta, S. Effect of land cover on air temperatures involved in the development of an intra-urban heat island. Clim. Res. 2009, 39, 61–73. [Google Scholar] [CrossRef]
- Yan, H.; Fan, S.; Guo, C.; Wu, F.; Zhang, N.; Dong, L. Assessing the effects of landscape design parameters on intra-urban air temperature variability: The case of Beijing, China. Build. Environ. 2014, 76, 44–53. [Google Scholar] [CrossRef]
- Sun, S.M.; Lu, C.Y. Study on monitoring intensity of urban heat island and taking it as an indicator for urban ecosystem by remote sensing. J. Xiamen Univ. Nat. Sci. 2002, 41, 70–73. (In Chinese) [Google Scholar]
- Ainai, M.A. Remote sensing information model and geographic mathematics. Acta Sci. Nat. Univ. Pekin. 2001, 37, 558–562. [Google Scholar]
- Xu, H.Q.; Chen, B.Q. An image processing technique for the study of urban heat island changes using different seasonal remote sensing data. Remote Sens. Technol. Appl. 2003, 18, 129–133. (In Chinese) [Google Scholar]
- Zhang, Z.M.; He, G.J.; Xiao, R.B.; Wang, W.A. A study of the urban heat island changes of Beijing city based on remote sensing. Remote Sens. Inf. 2005, 6, 46–48. (In Chinese) [Google Scholar]
- Yang, W.R.; Li, F.; He, Y. Characteristic change and analysis of urban heat island in Beijing, China, Summer, 2003–2011. Acta Ecol. Sin. 2014, 34, 4390–4399. [Google Scholar]
- Rozenstein, O.; Qin, Z.H.; Derimian, Y.; Karnieli, A. Derivation of land surface temperature for Landsat-8 TIRS using a split window algorithm. Sensors 2014, 14, 5768–5780. [Google Scholar] [CrossRef] [PubMed]
- Zanter, K. Landsat8 (L8) Data Users Handbook. Landsat Science Official Website. Available online: https://landsat.usgs.gov/landsat-8-l8-data-users-handbook (accessed on 20 January 2018).
- Van de Griend, A.A.; Owe, M. On the relationship between thermal emissivity and the normalized difference vegetation index for nature surfaces. Int. J. Remote Sens. 1993, 14, 1119–1131. [Google Scholar] [CrossRef]
- Black, A.; Stephen, H. Relating temperature trends to the normalized difference vegetation index in Las Vegas. GISci. Remote Sens. 2014, 51, 468–482. [Google Scholar] [CrossRef]
- Hinton, G.E.; Osindero, S.; Teh, Y.W. A fast learning algorithm for deep belief nets. Neural Comput. 2006, 18, 1527–1554. [Google Scholar] [CrossRef] [PubMed]
- Zhang, H.Y.; Zhai, H.; Zhang, L.P.; Li, P.X. Spectral-Spatial Sparse Subspace Clustering for Hyperspectral Remote Sensing Images. IEEE Trans. Geosci. Remote Sens. 2016, 54, 3672–3684. [Google Scholar] [CrossRef]
- Tania, S.; Koen, S.; Andreas, M. Analysis of microclimatic diversity and outdoor thermal comfort perceptions in the tropical megacity Dhaka, Bangladesh. Build Environ. 2015, 94, 734–750. [Google Scholar]
- Marcel, I.; Nyuk, H.W.; Steve, K.J. Urban microclimate analysis with consideration of local ambient temperature, external heat gain, urban ventilation, and outdoor thermal comfort in the tropics. Sustain. Cities Soc. 2015, 19, 122–135. [Google Scholar]


| Acquisition Time | Line | Number | Image Type | Thermal Infrared Band Spatial Resolution |
|---|---|---|---|---|
| 23 July 2016 | 123 | 39 | Band 1 Coastal | 30 m |
| Band 2 Blue | 30 m | |||
| Band 3 Green | 30 m | |||
| Band 4 Red | 30 m | |||
| Band 5 NIR (Near infrared) | 30 m | |||
| Band 6 SWIR 1 (Short-wave infrared) | 30 m | |||
| Band 7 SWIR 2 | 30 m | |||
| Band 8 Pan | 15 m | |||
| Band 9 Cirrus | 30 m | |||
| Band 10 TIRS 1 | 100 m | |||
| Band 11 TIRS 2 | 100 m |
| Temperature Range/°C | a10 | b10 | a11 | b11 | ||
|---|---|---|---|---|---|---|
| 0–30 | −59.139 | 0.421 | 0.9991 | −63.392 | 0.457 | 0.9991 |
| 0–40 | −60.919 | 0.428 | 0.9985 | −65.224 | 0.463 | 0.9985 |
| 10–40 | −62.806 | 0.434 | 0.9992 | −67.173 | 0.47 | 0.9992 |
| 10–50 | −64.608 | 0.44 | 0.9986 | −69.022 | 0.476 | 0.9986 |
| Atmospheric Mode | Atmospheric Transmittance Estimation Equation | r2 |
|---|---|---|
| The United States in 1976 standard atmosphere | | 0.9982 0.9947 |
| Mid-latitude summer | | 0.9986 0.9996 |
| Heat Island Level | Area | Area Ratio |
|---|---|---|
| Green island | 21,341 | 16.55% |
| Sub-green island | 37,753 | 29.28% |
| Heat island | 50,525 | 39.19% |
| Strong heat island | 19,304 | 14.97% |
| Identification Model | K-Means Clustering | Genetic K-Means Clustering | Improved RBM Identifier |
|---|---|---|---|
| Total Accuracy | 73.39% | 91.22% | 93.31% |
| Kappa | 0.6725 | 0.8735 | 0.8861 |
| Testing time | 2.87 | 0.91 | 0.72 |
© 2018 by the authors. Licensee MDPI, Basel, Switzerland. This article is an open access article distributed under the terms and conditions of the Creative Commons Attribution (CC BY) license (http://creativecommons.org/licenses/by/4.0/).
Share and Cite
Zhang, Y.; Jiang, P.; Zhang, H.; Cheng, P. Study on Urban Heat Island Intensity Level Identification Based on an Improved Restricted Boltzmann Machine. Int. J. Environ. Res. Public Health 2018, 15, 186. https://doi.org/10.3390/ijerph15020186
Zhang Y, Jiang P, Zhang H, Cheng P. Study on Urban Heat Island Intensity Level Identification Based on an Improved Restricted Boltzmann Machine. International Journal of Environmental Research and Public Health. 2018; 15(2):186. https://doi.org/10.3390/ijerph15020186
Chicago/Turabian StyleZhang, Yang, Ping Jiang, Hongyan Zhang, and Peng Cheng. 2018. "Study on Urban Heat Island Intensity Level Identification Based on an Improved Restricted Boltzmann Machine" International Journal of Environmental Research and Public Health 15, no. 2: 186. https://doi.org/10.3390/ijerph15020186
APA StyleZhang, Y., Jiang, P., Zhang, H., & Cheng, P. (2018). Study on Urban Heat Island Intensity Level Identification Based on an Improved Restricted Boltzmann Machine. International Journal of Environmental Research and Public Health, 15(2), 186. https://doi.org/10.3390/ijerph15020186