Estimation of the Vertical Distribution of Radiocesium in Soil on the Basis of the Characteristics of Gamma-Ray Spectra Obtained via Aerial Radiation Monitoring Using an Unmanned Helicopter

 and
and 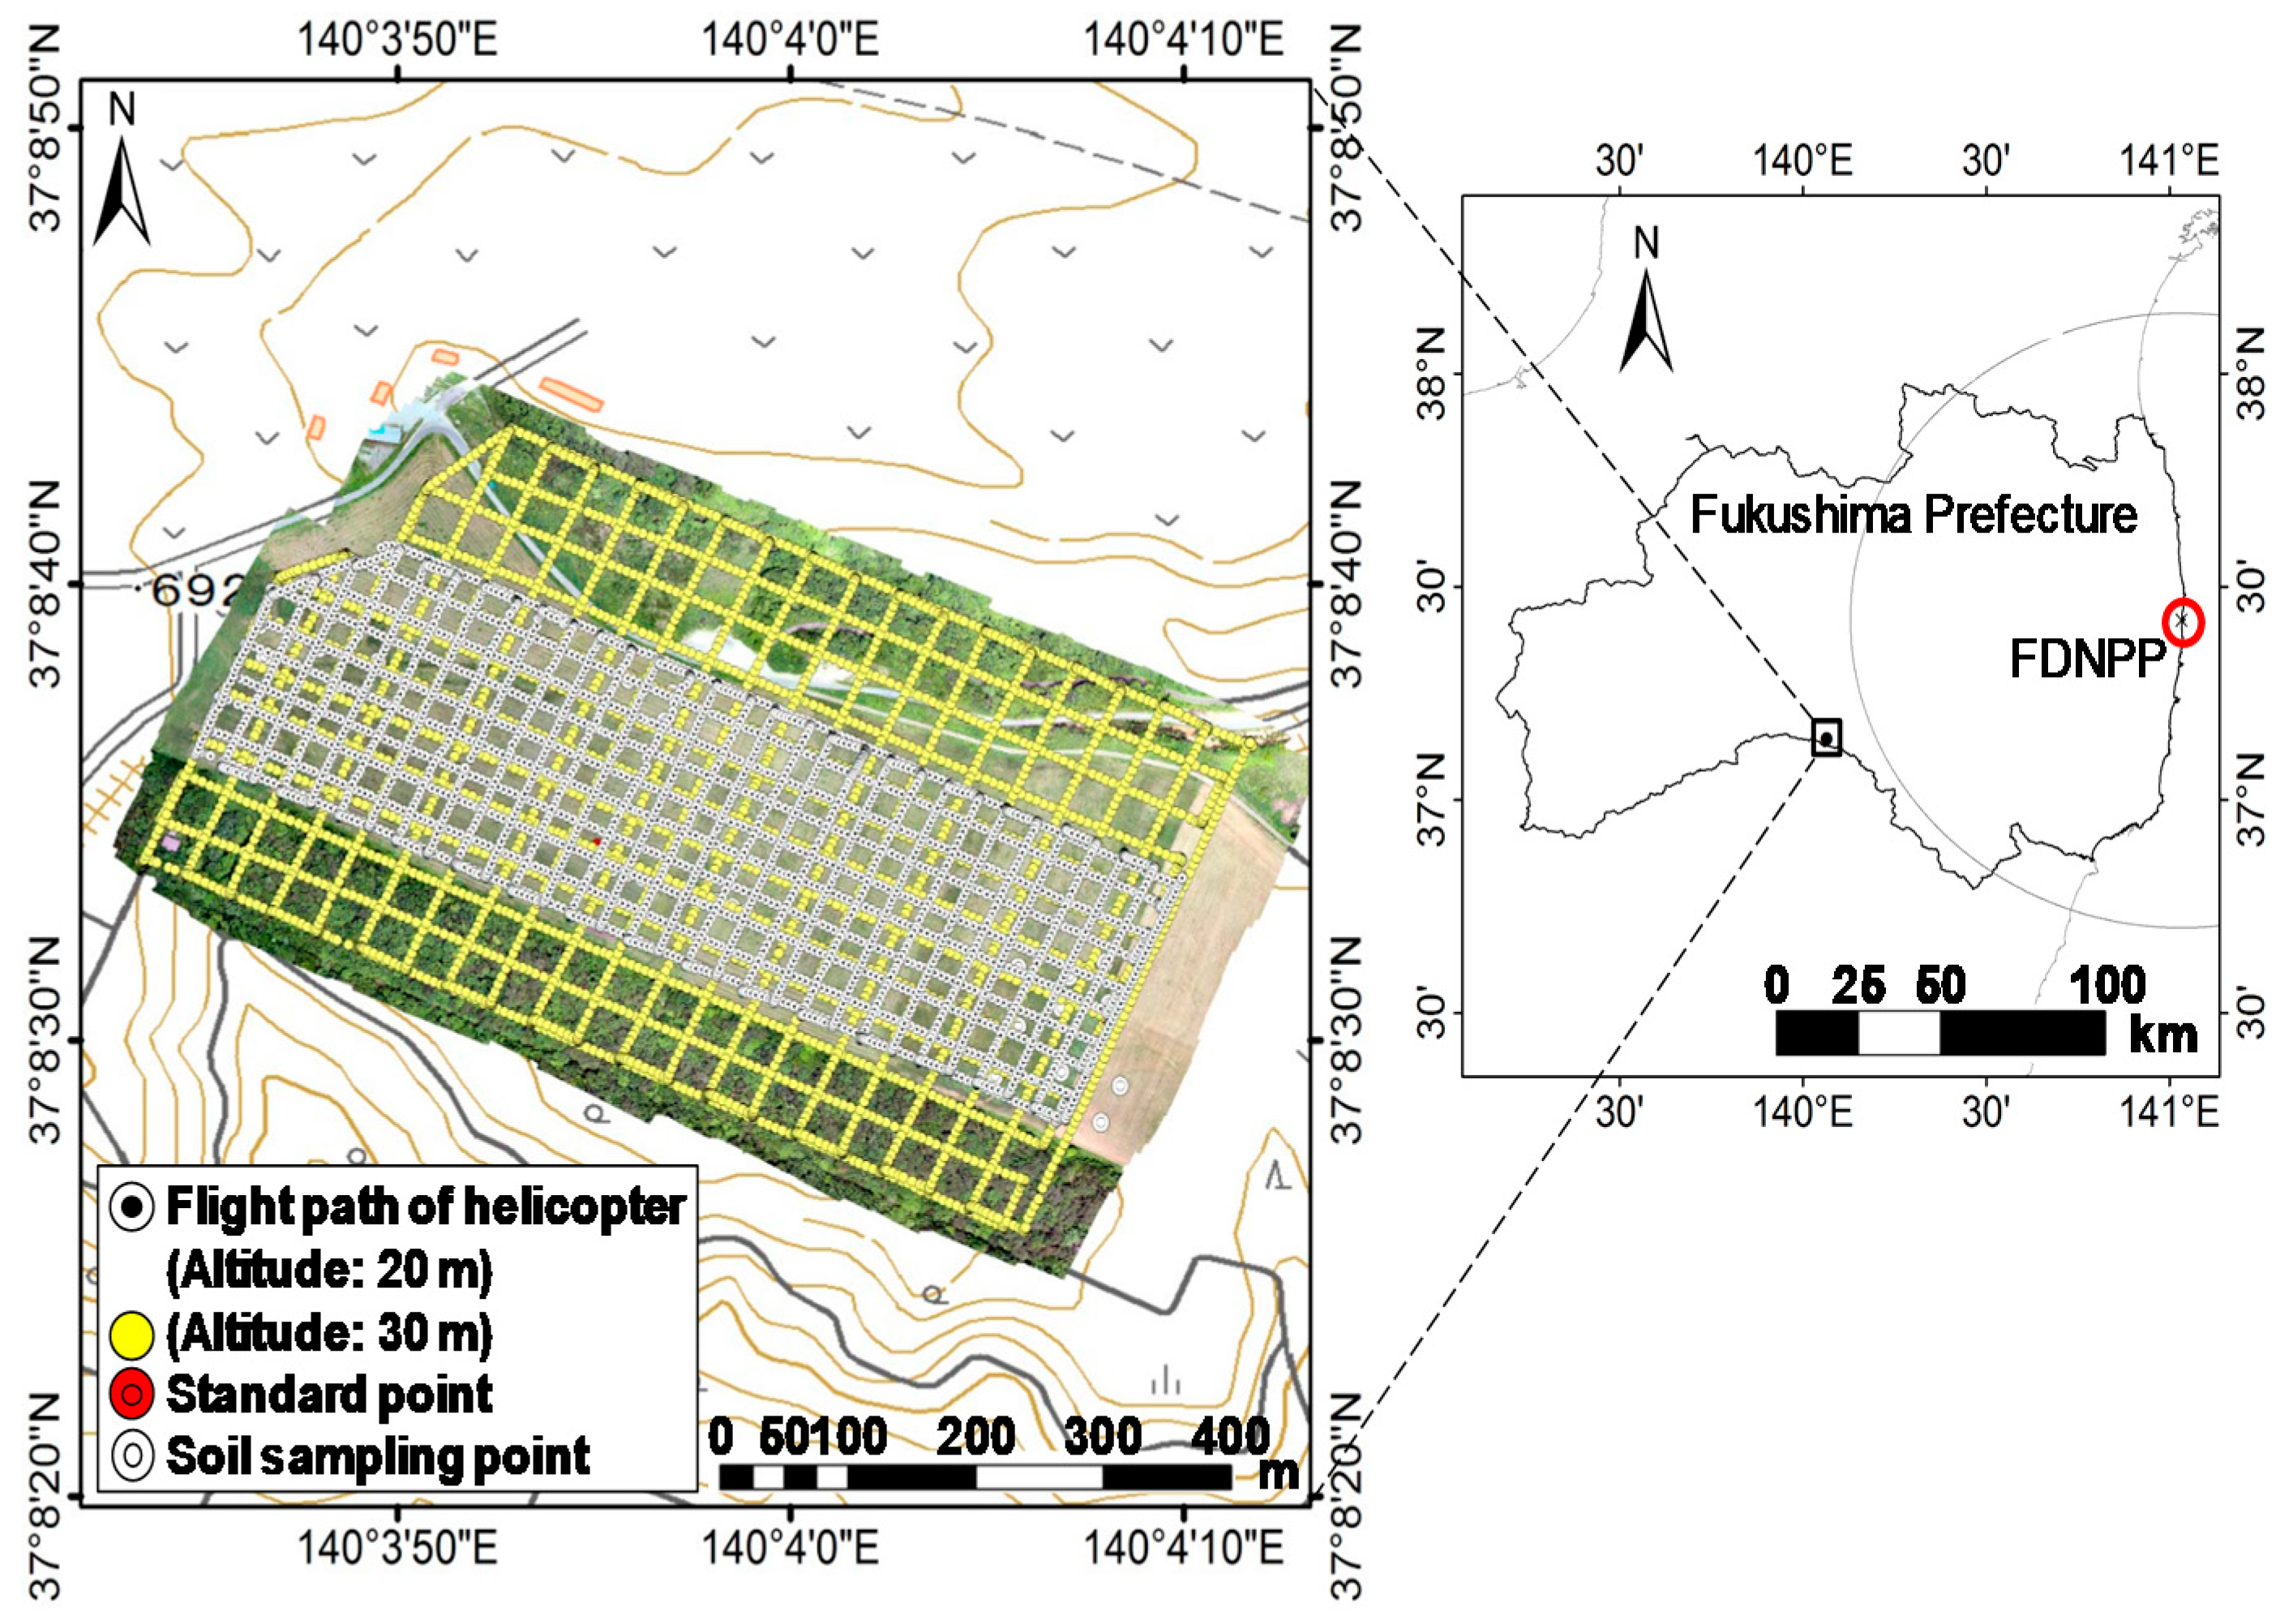
Abstract
:1. Introduction
2. Materials and Methods
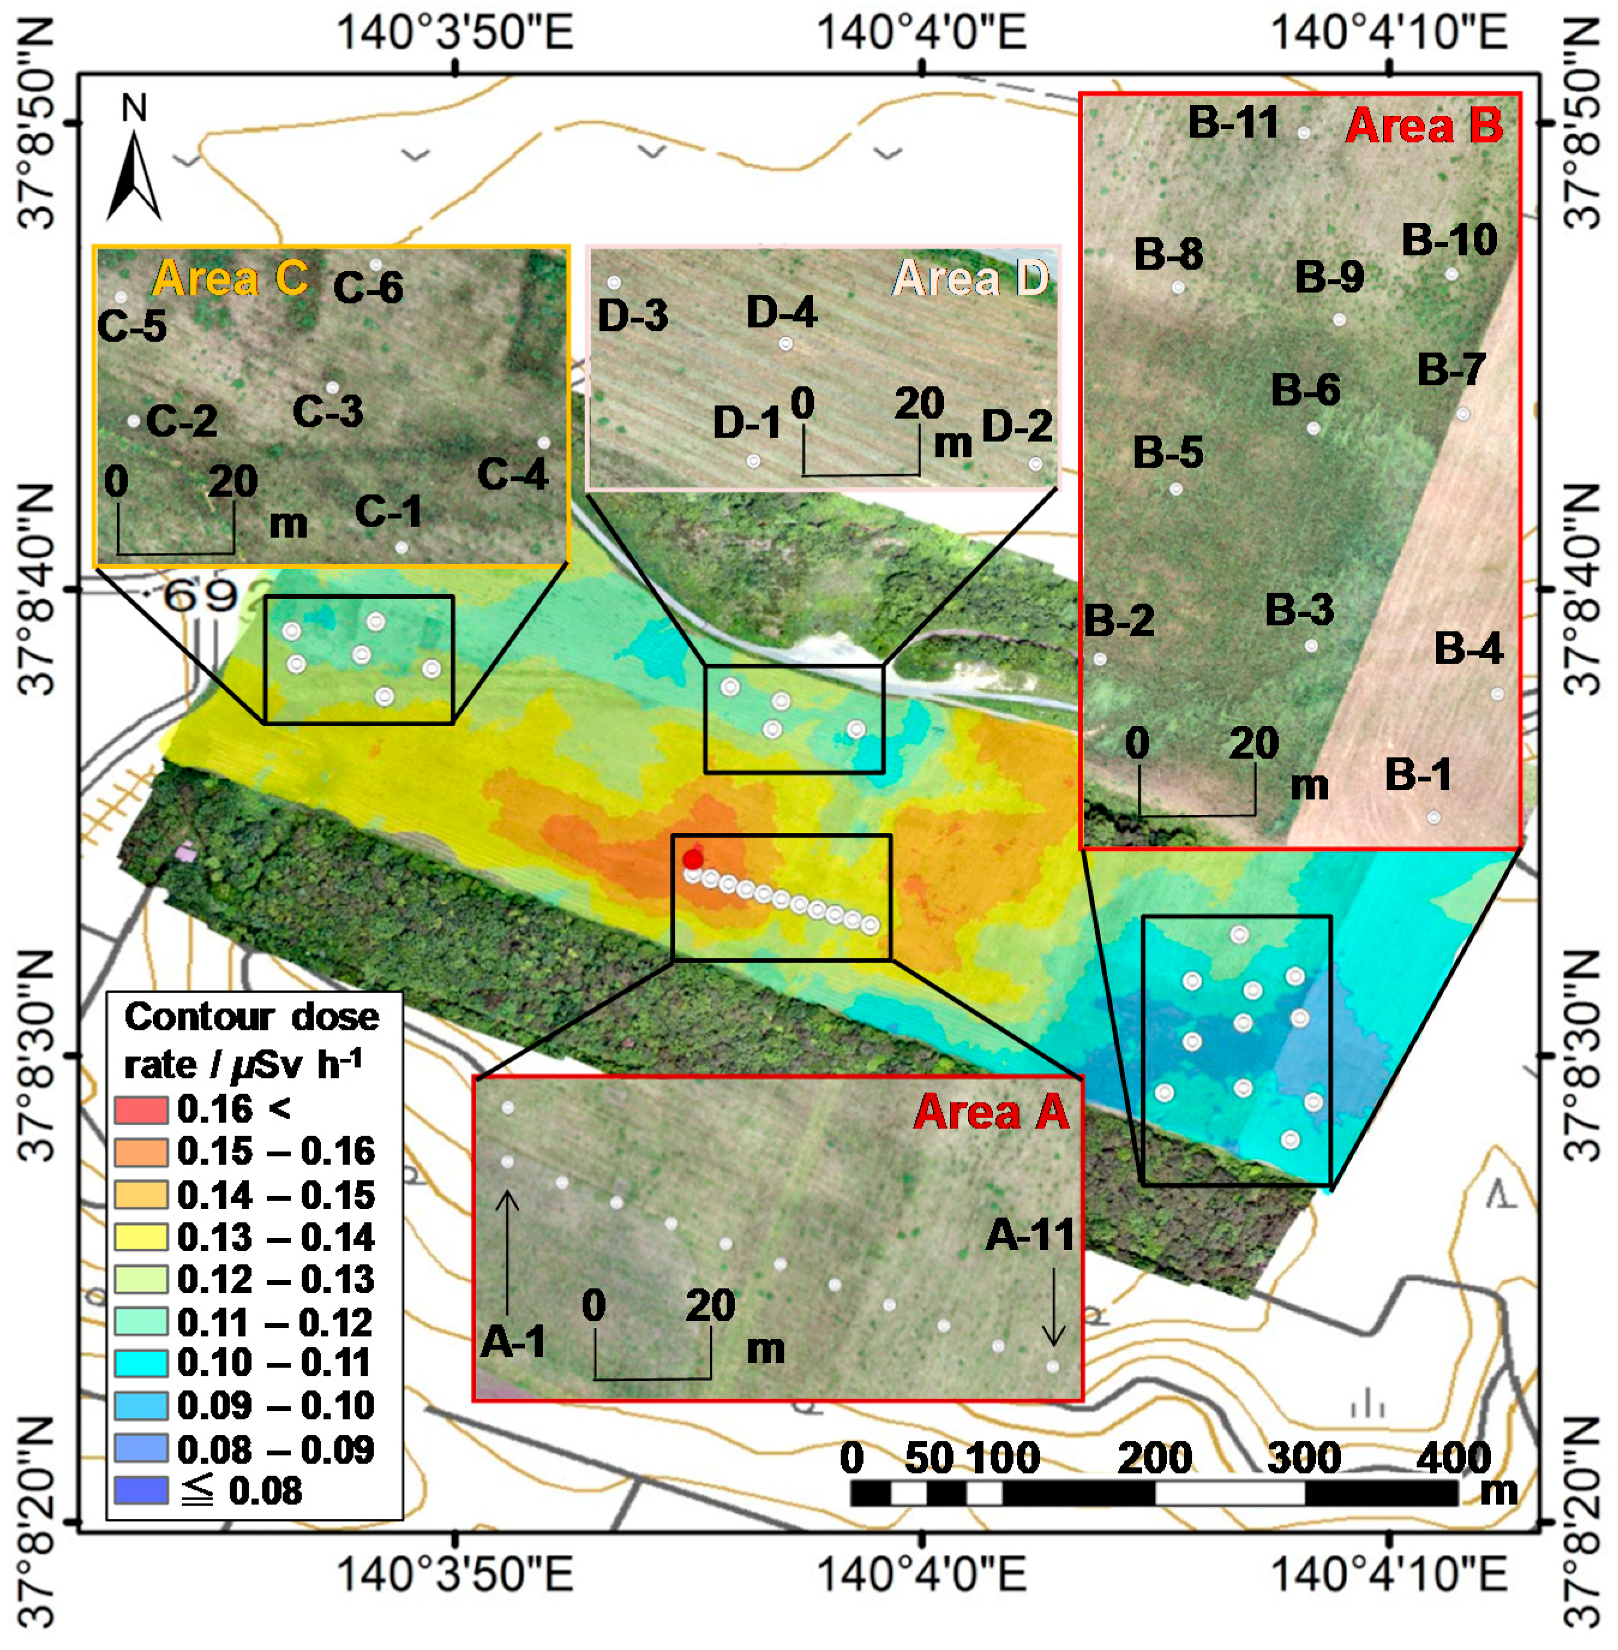
2.1. Study Site and Data Correction Conditions
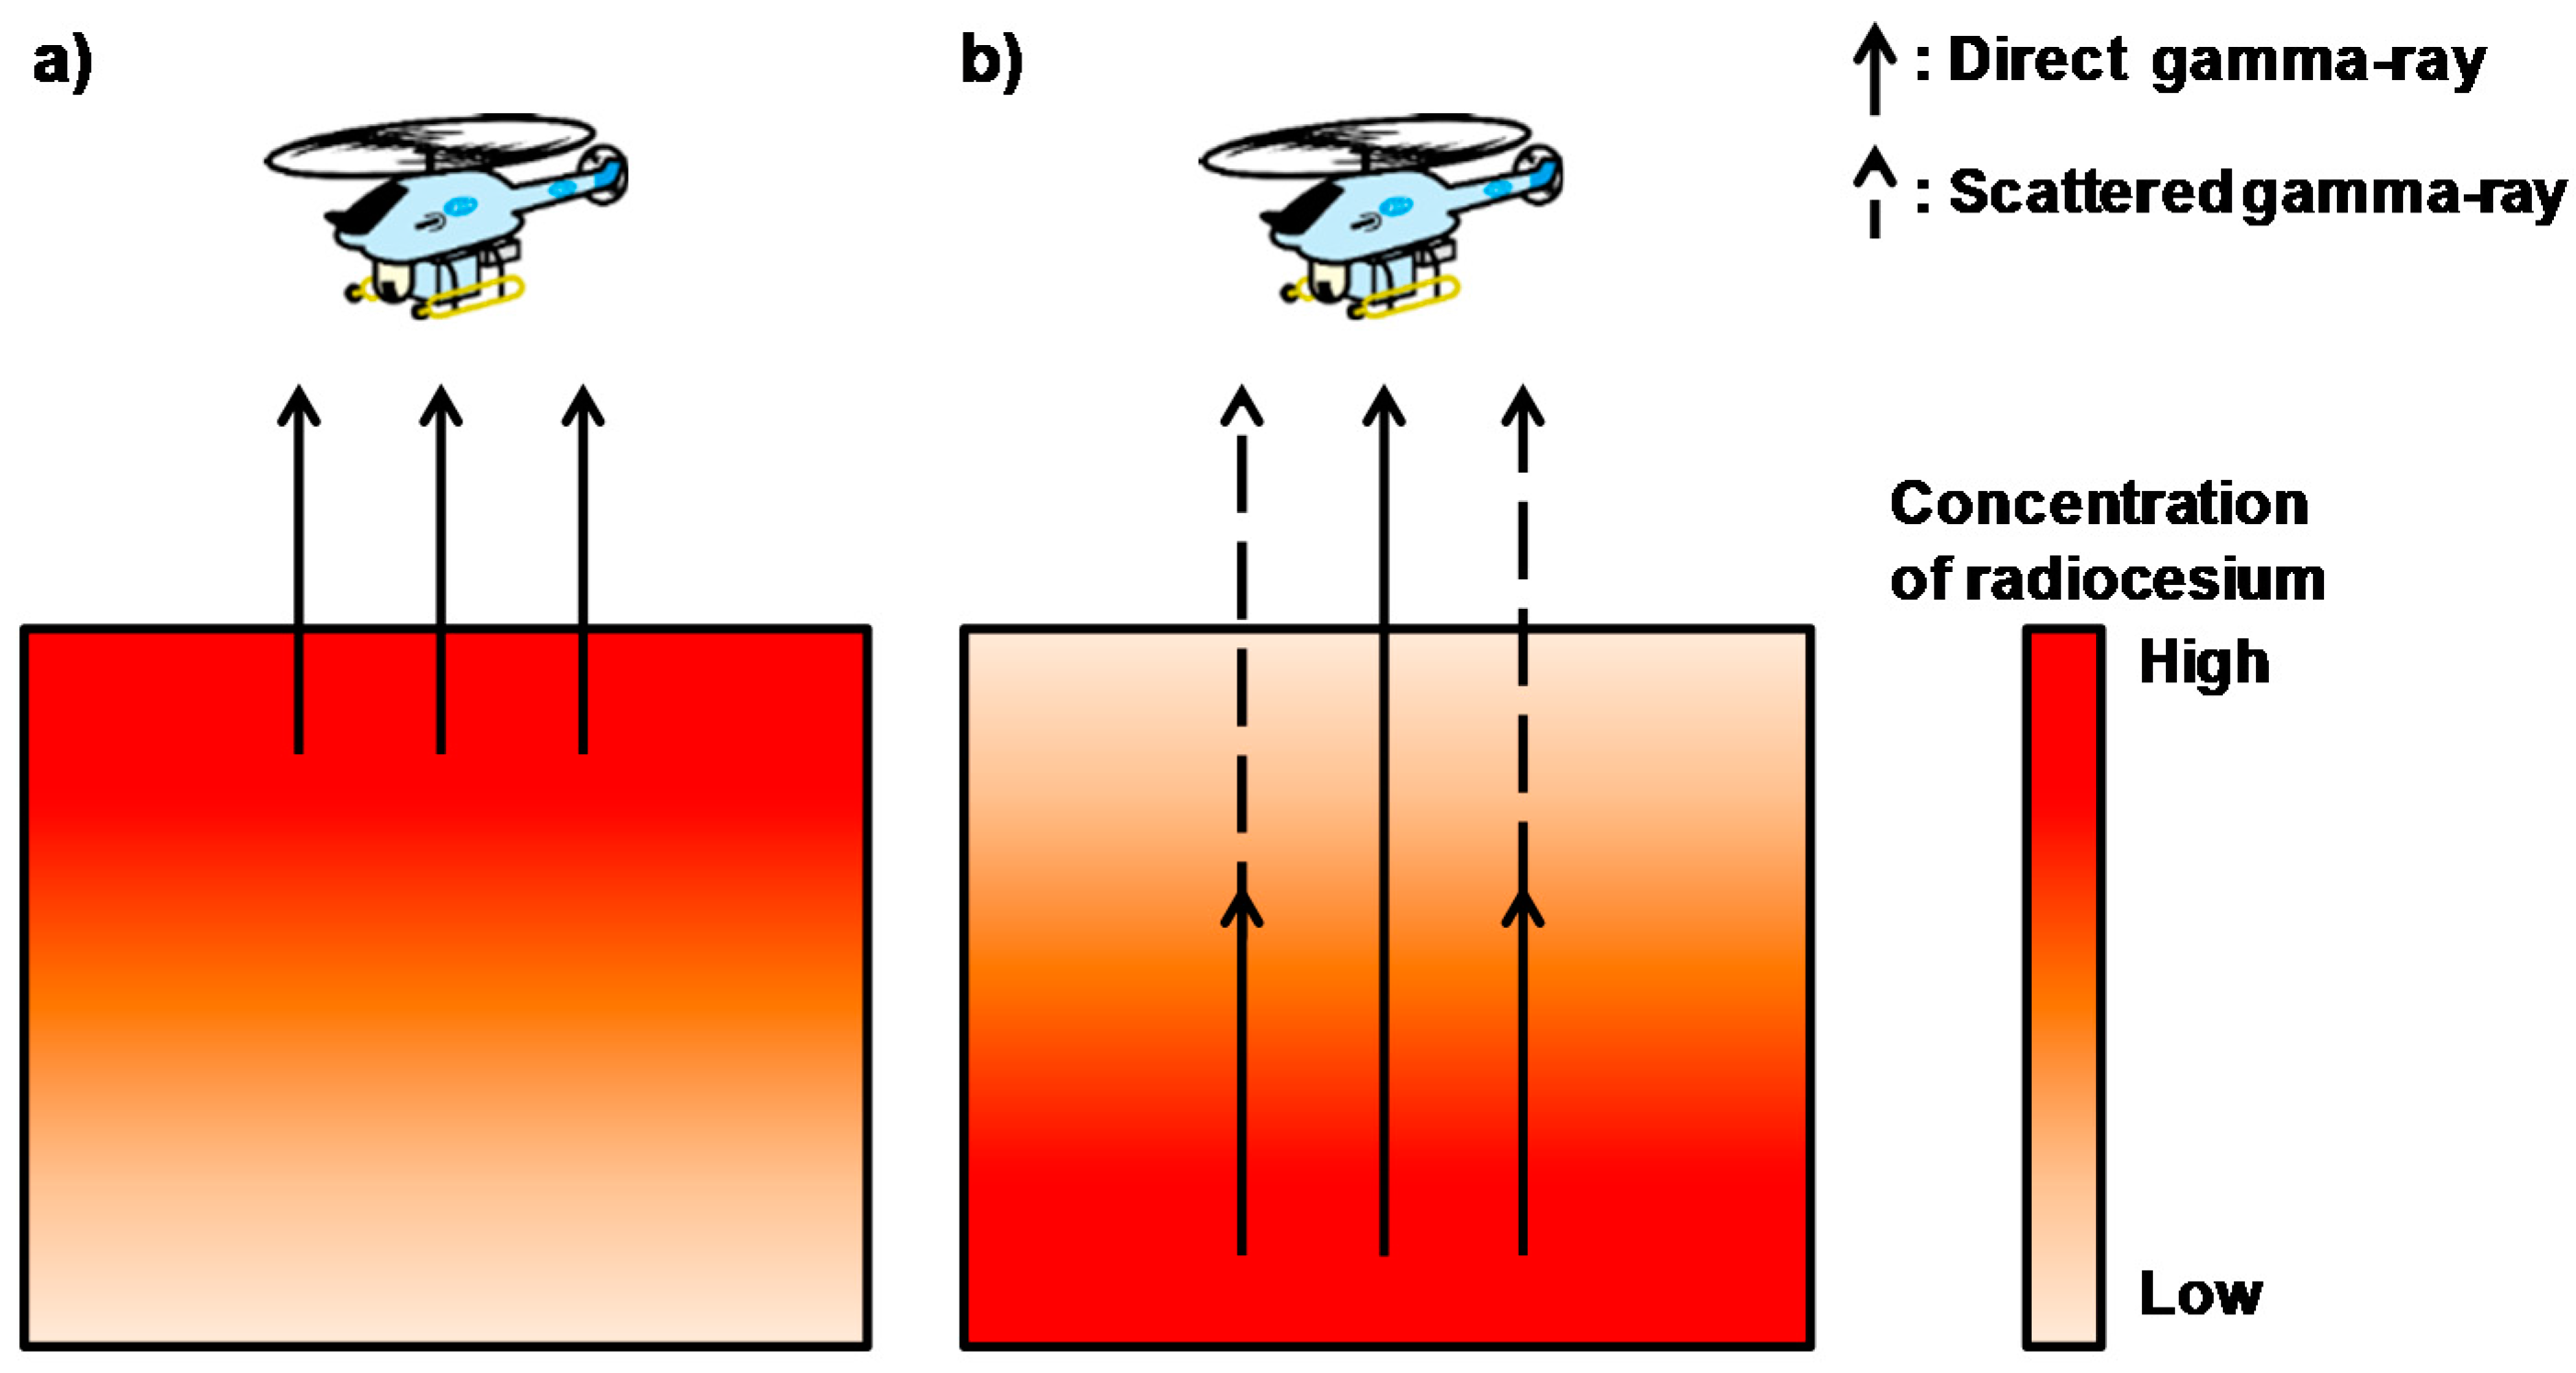
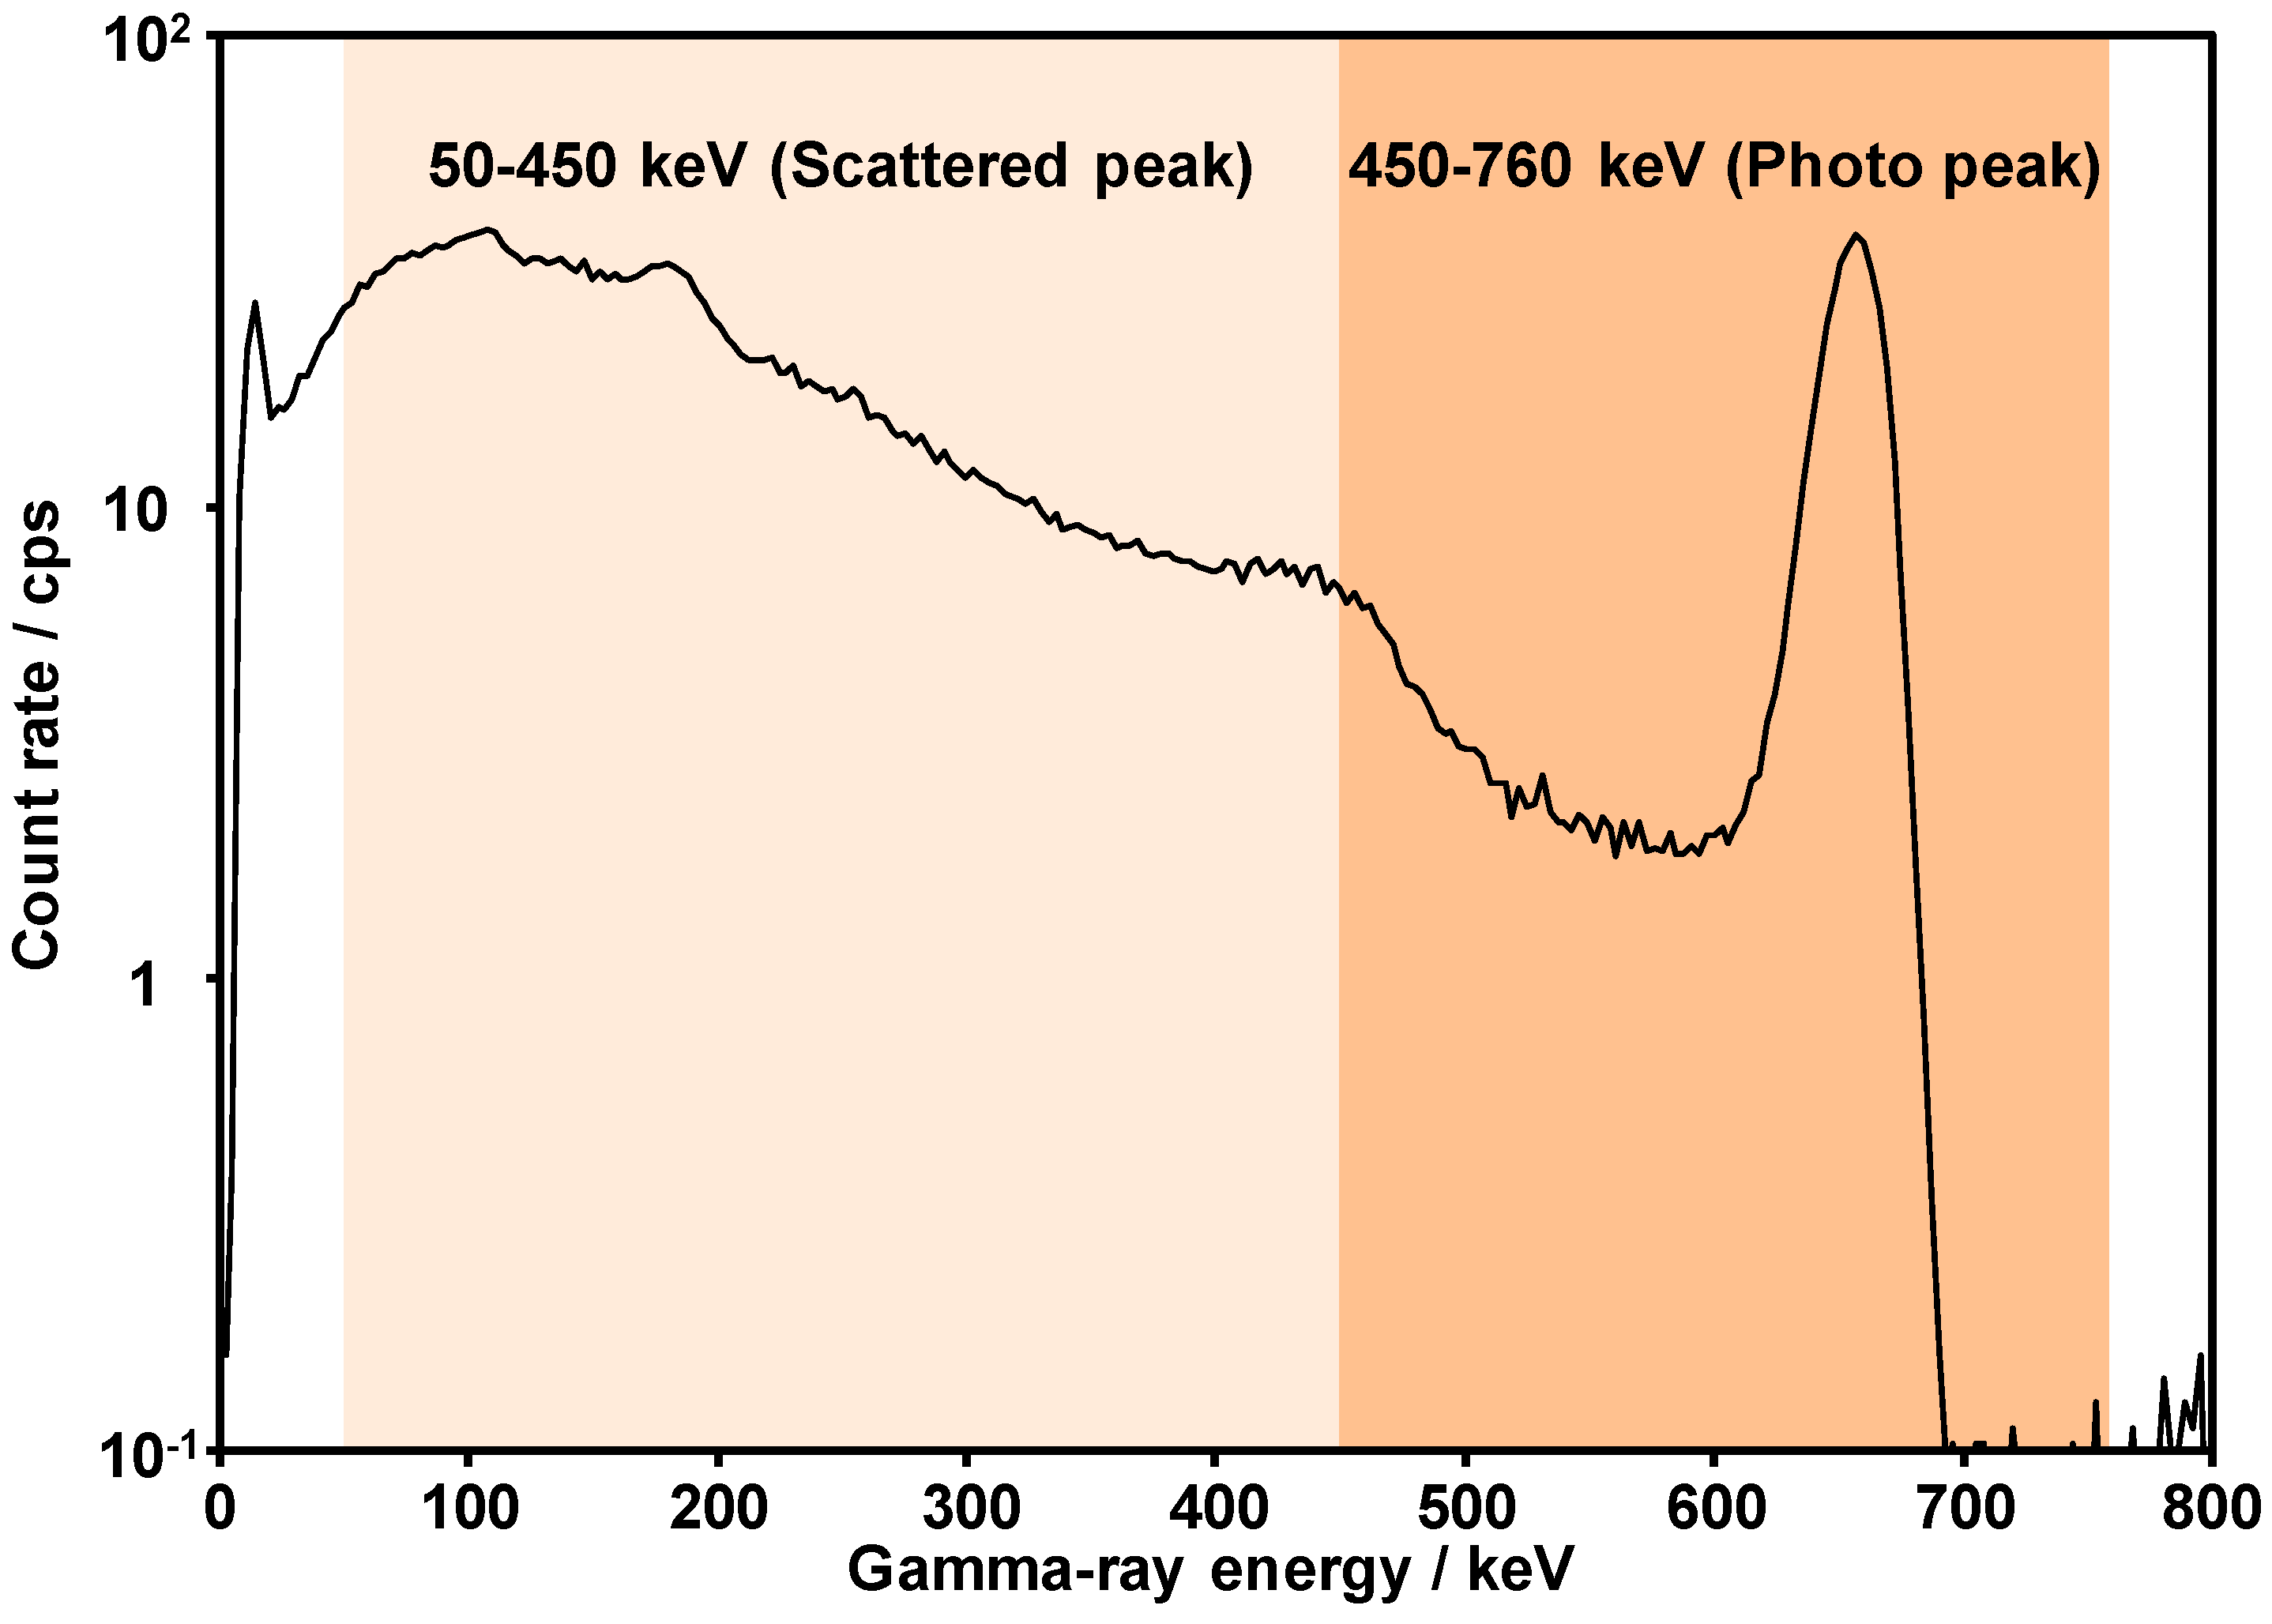
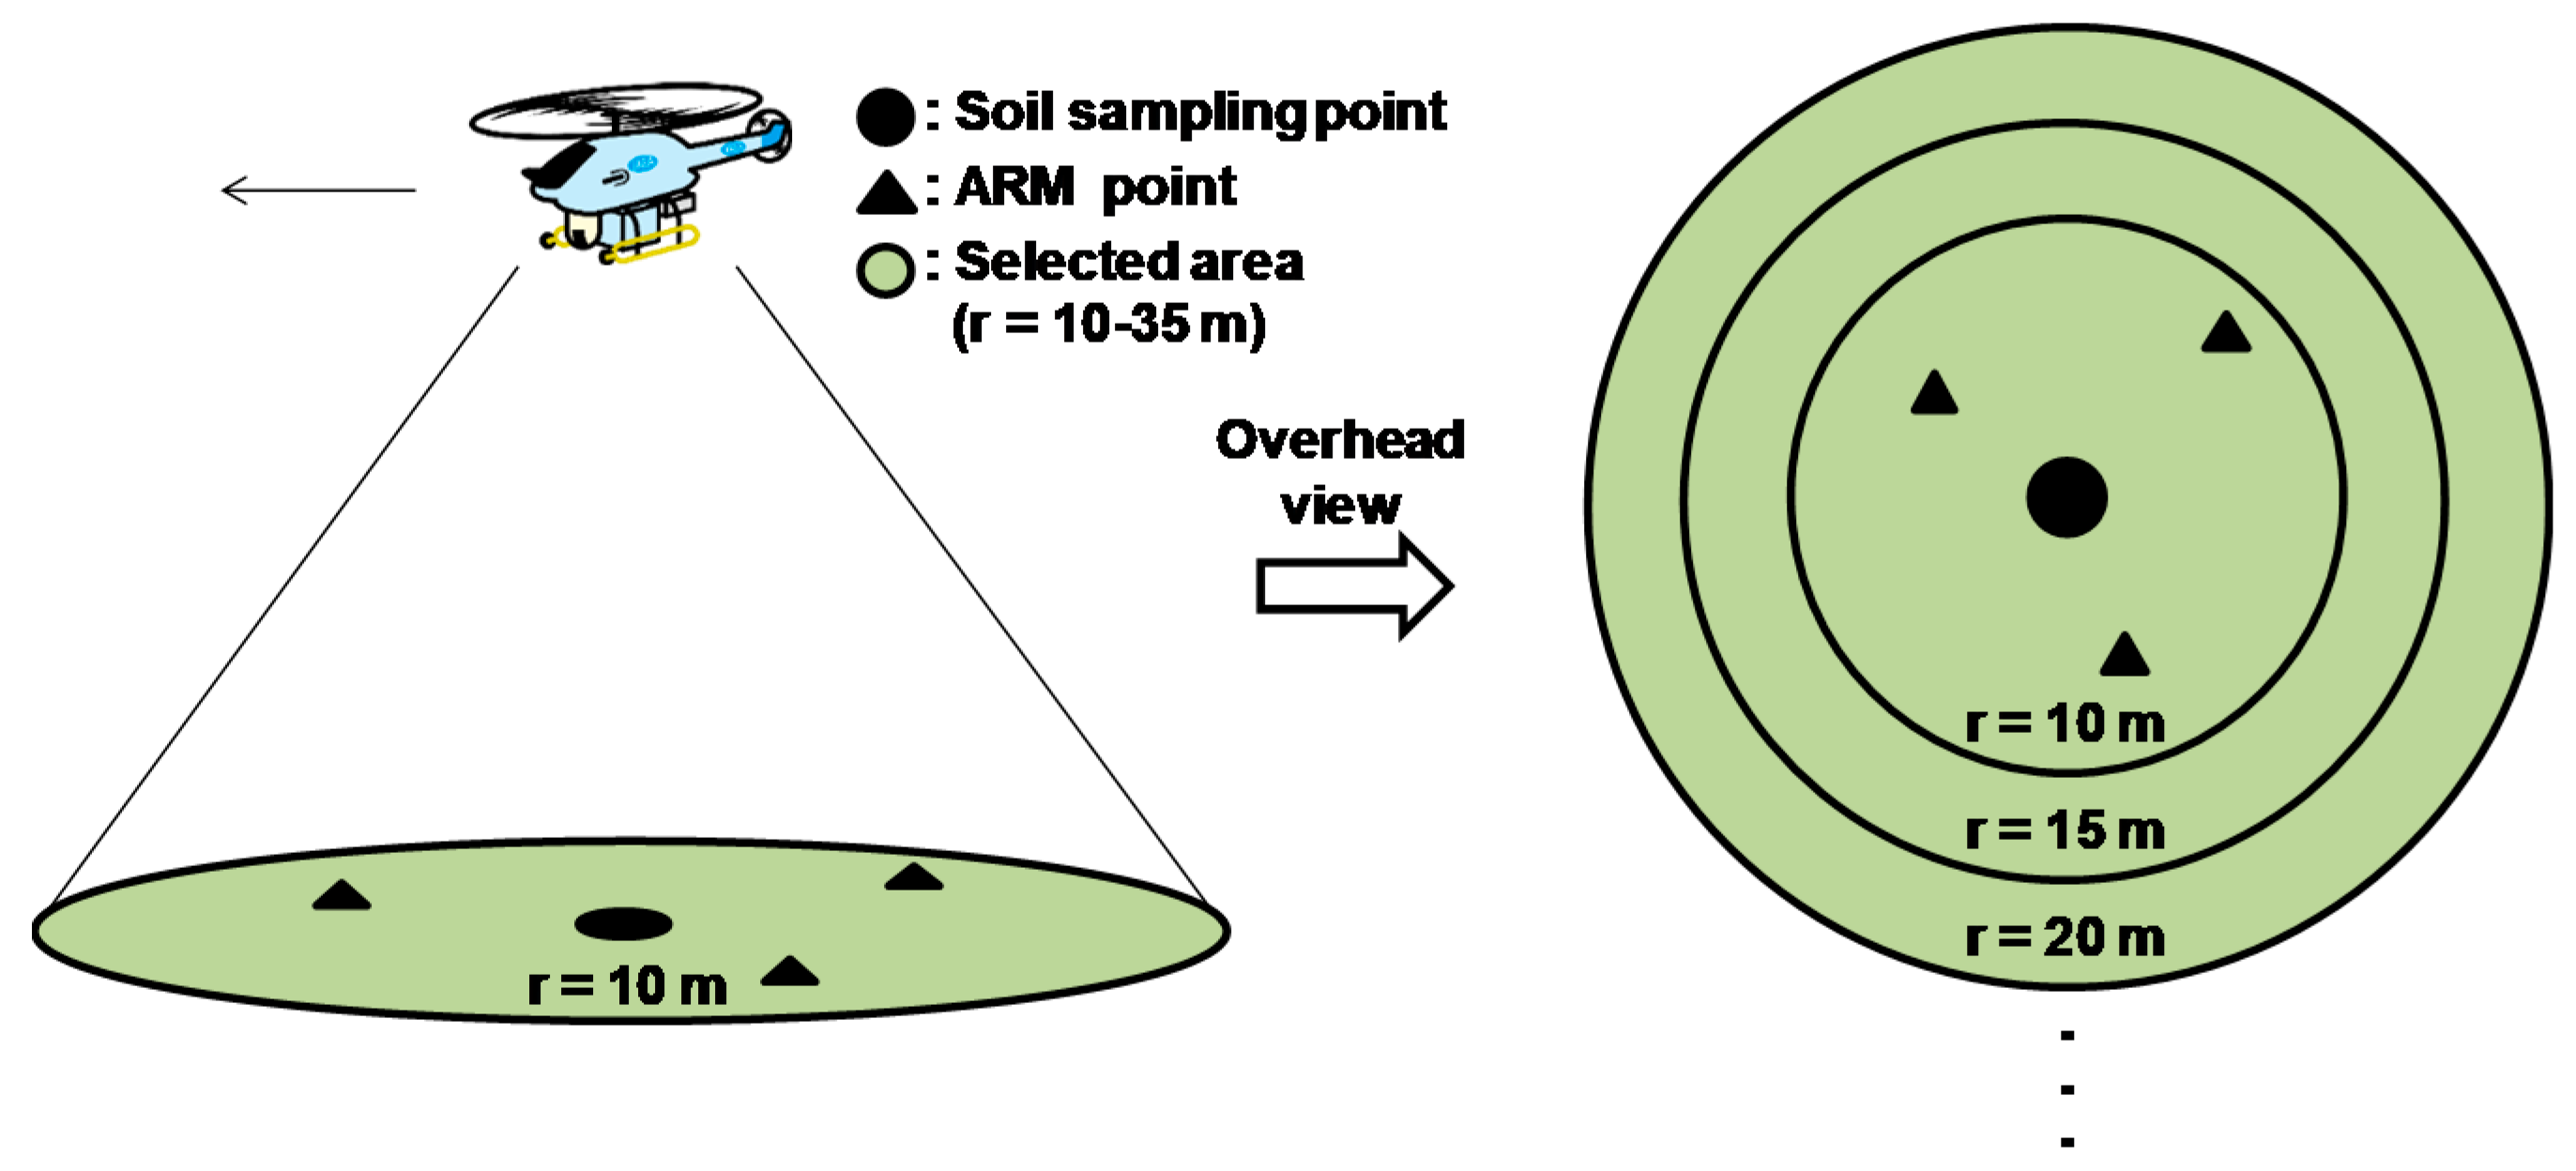
2.2. Analytical Schema of the ARM Data Obtained Using an Unmanned Helicopter
2.3. Quantitative Evaluation of the Vertical Distribution of Radiocesium Using Distribution Parameters
2.4. Calculation of βeff Based on the ARM Results
3. Results
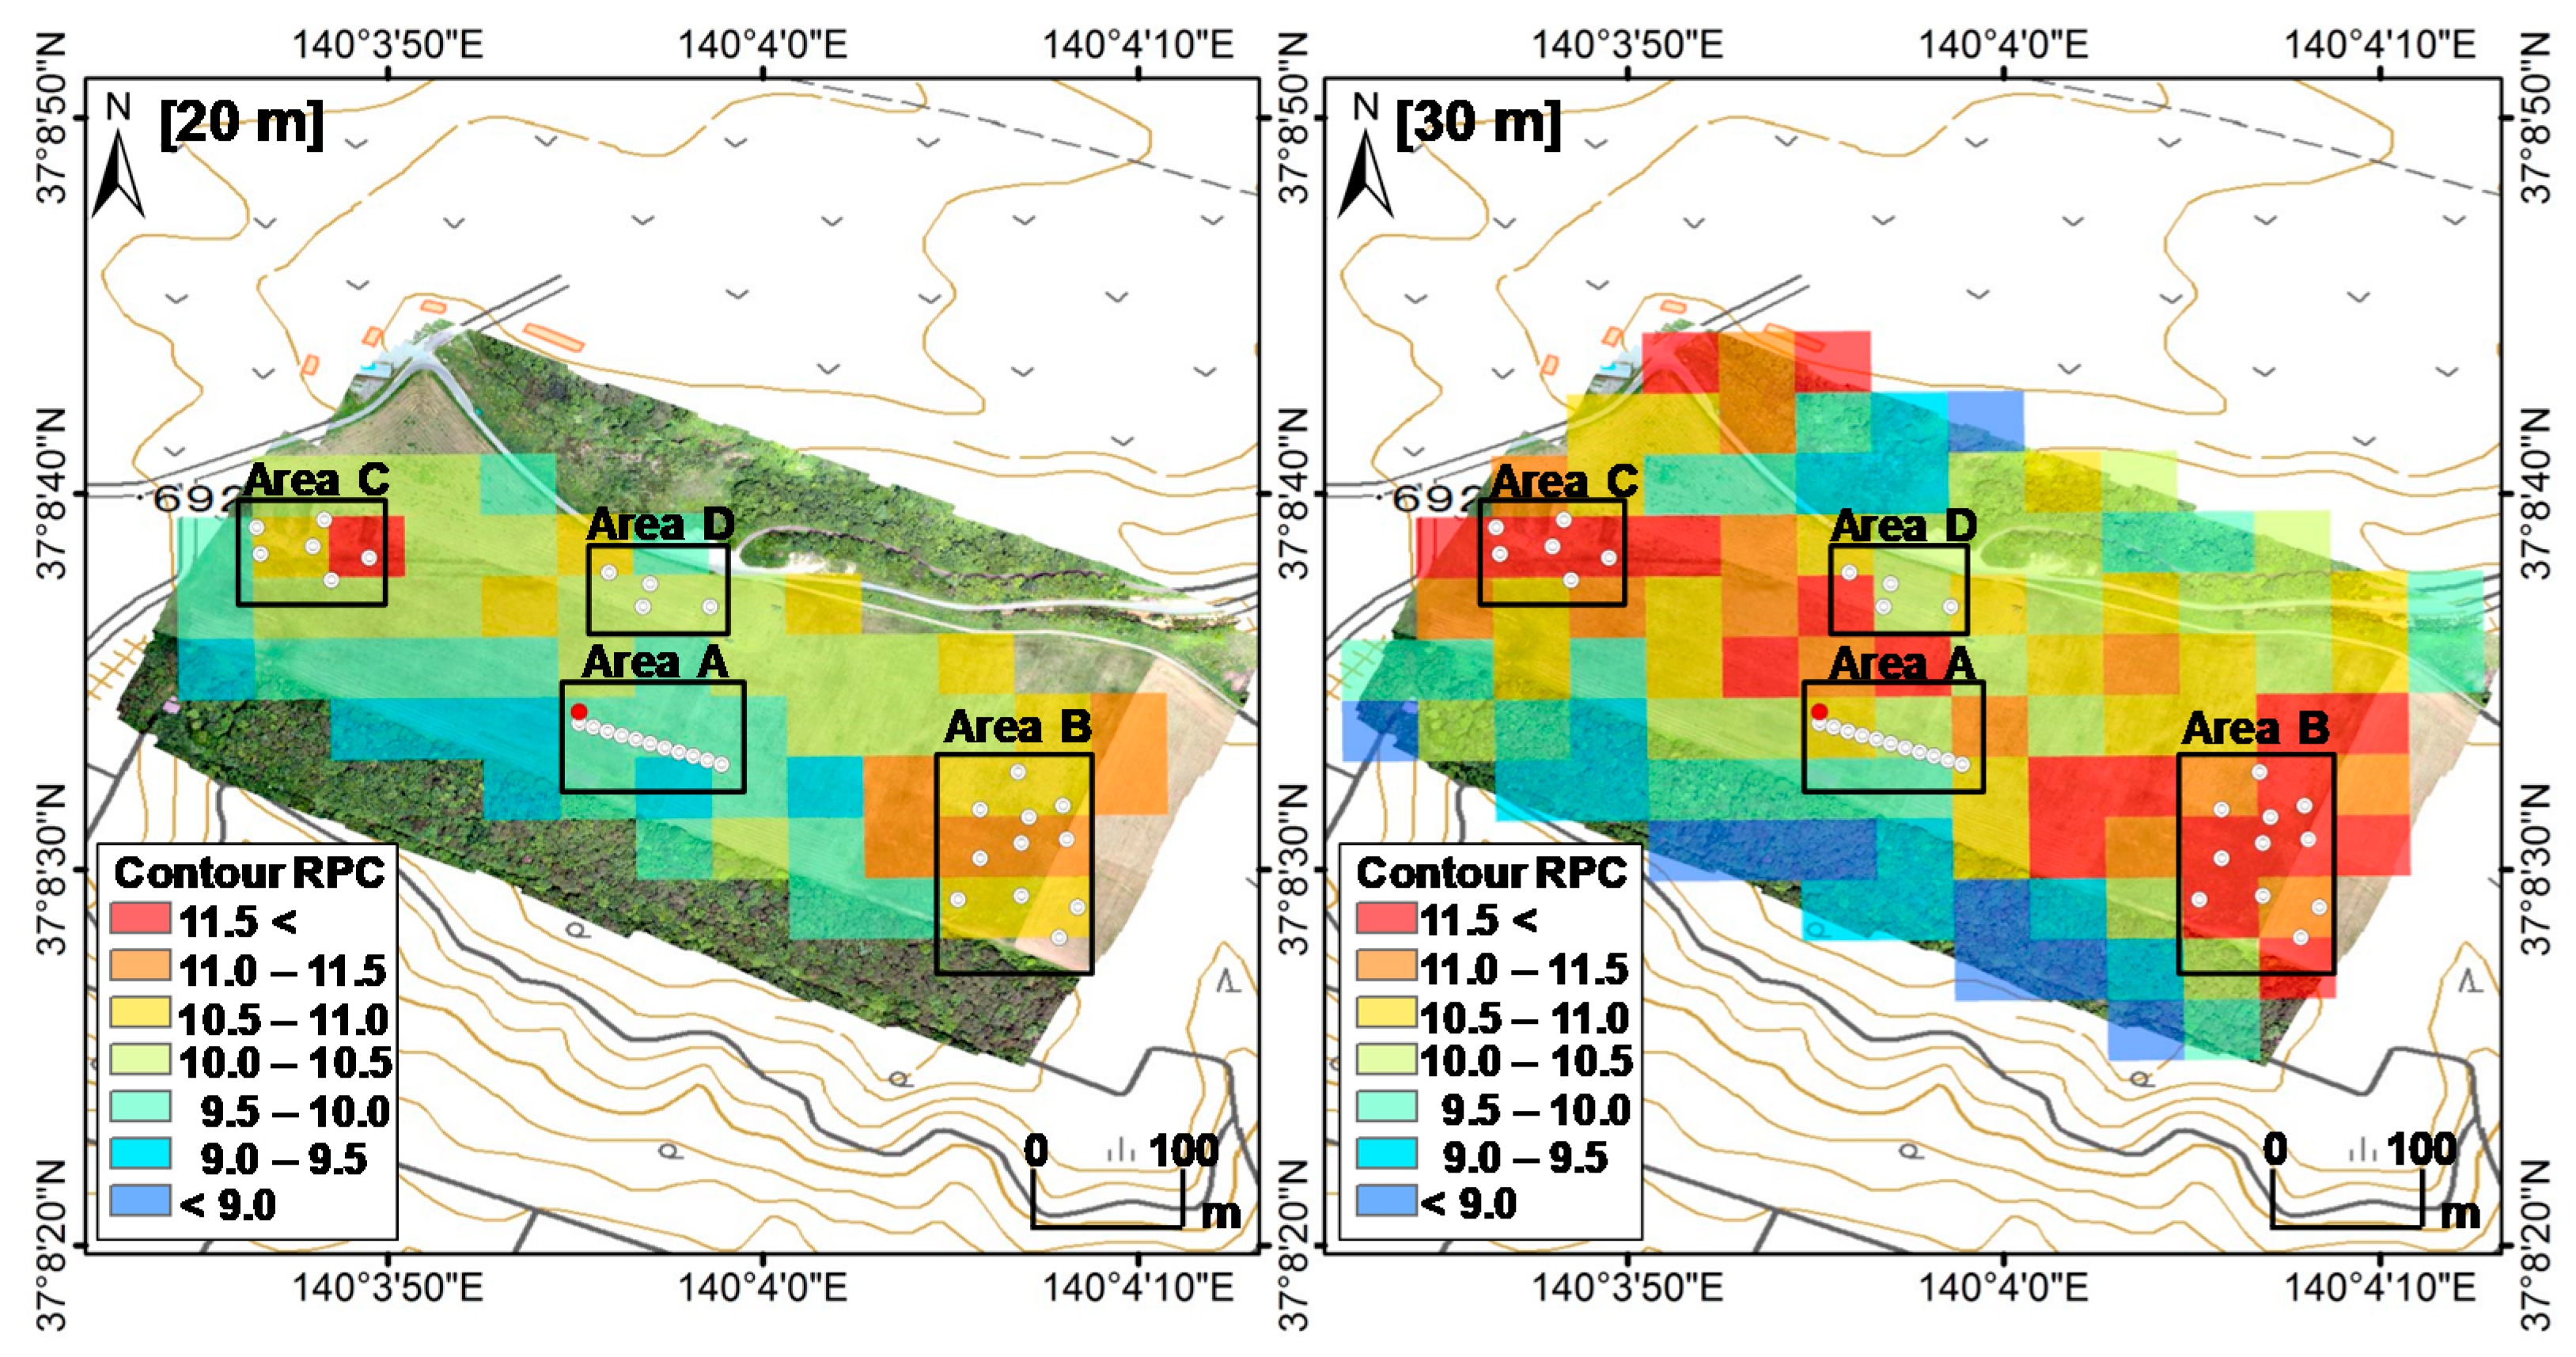
3.1. Distribution of the RPC Obtained via ARM
3.2. Unnatural Vertical Distribution of Radiocesium in Soil Resulting from Inversion Tillage
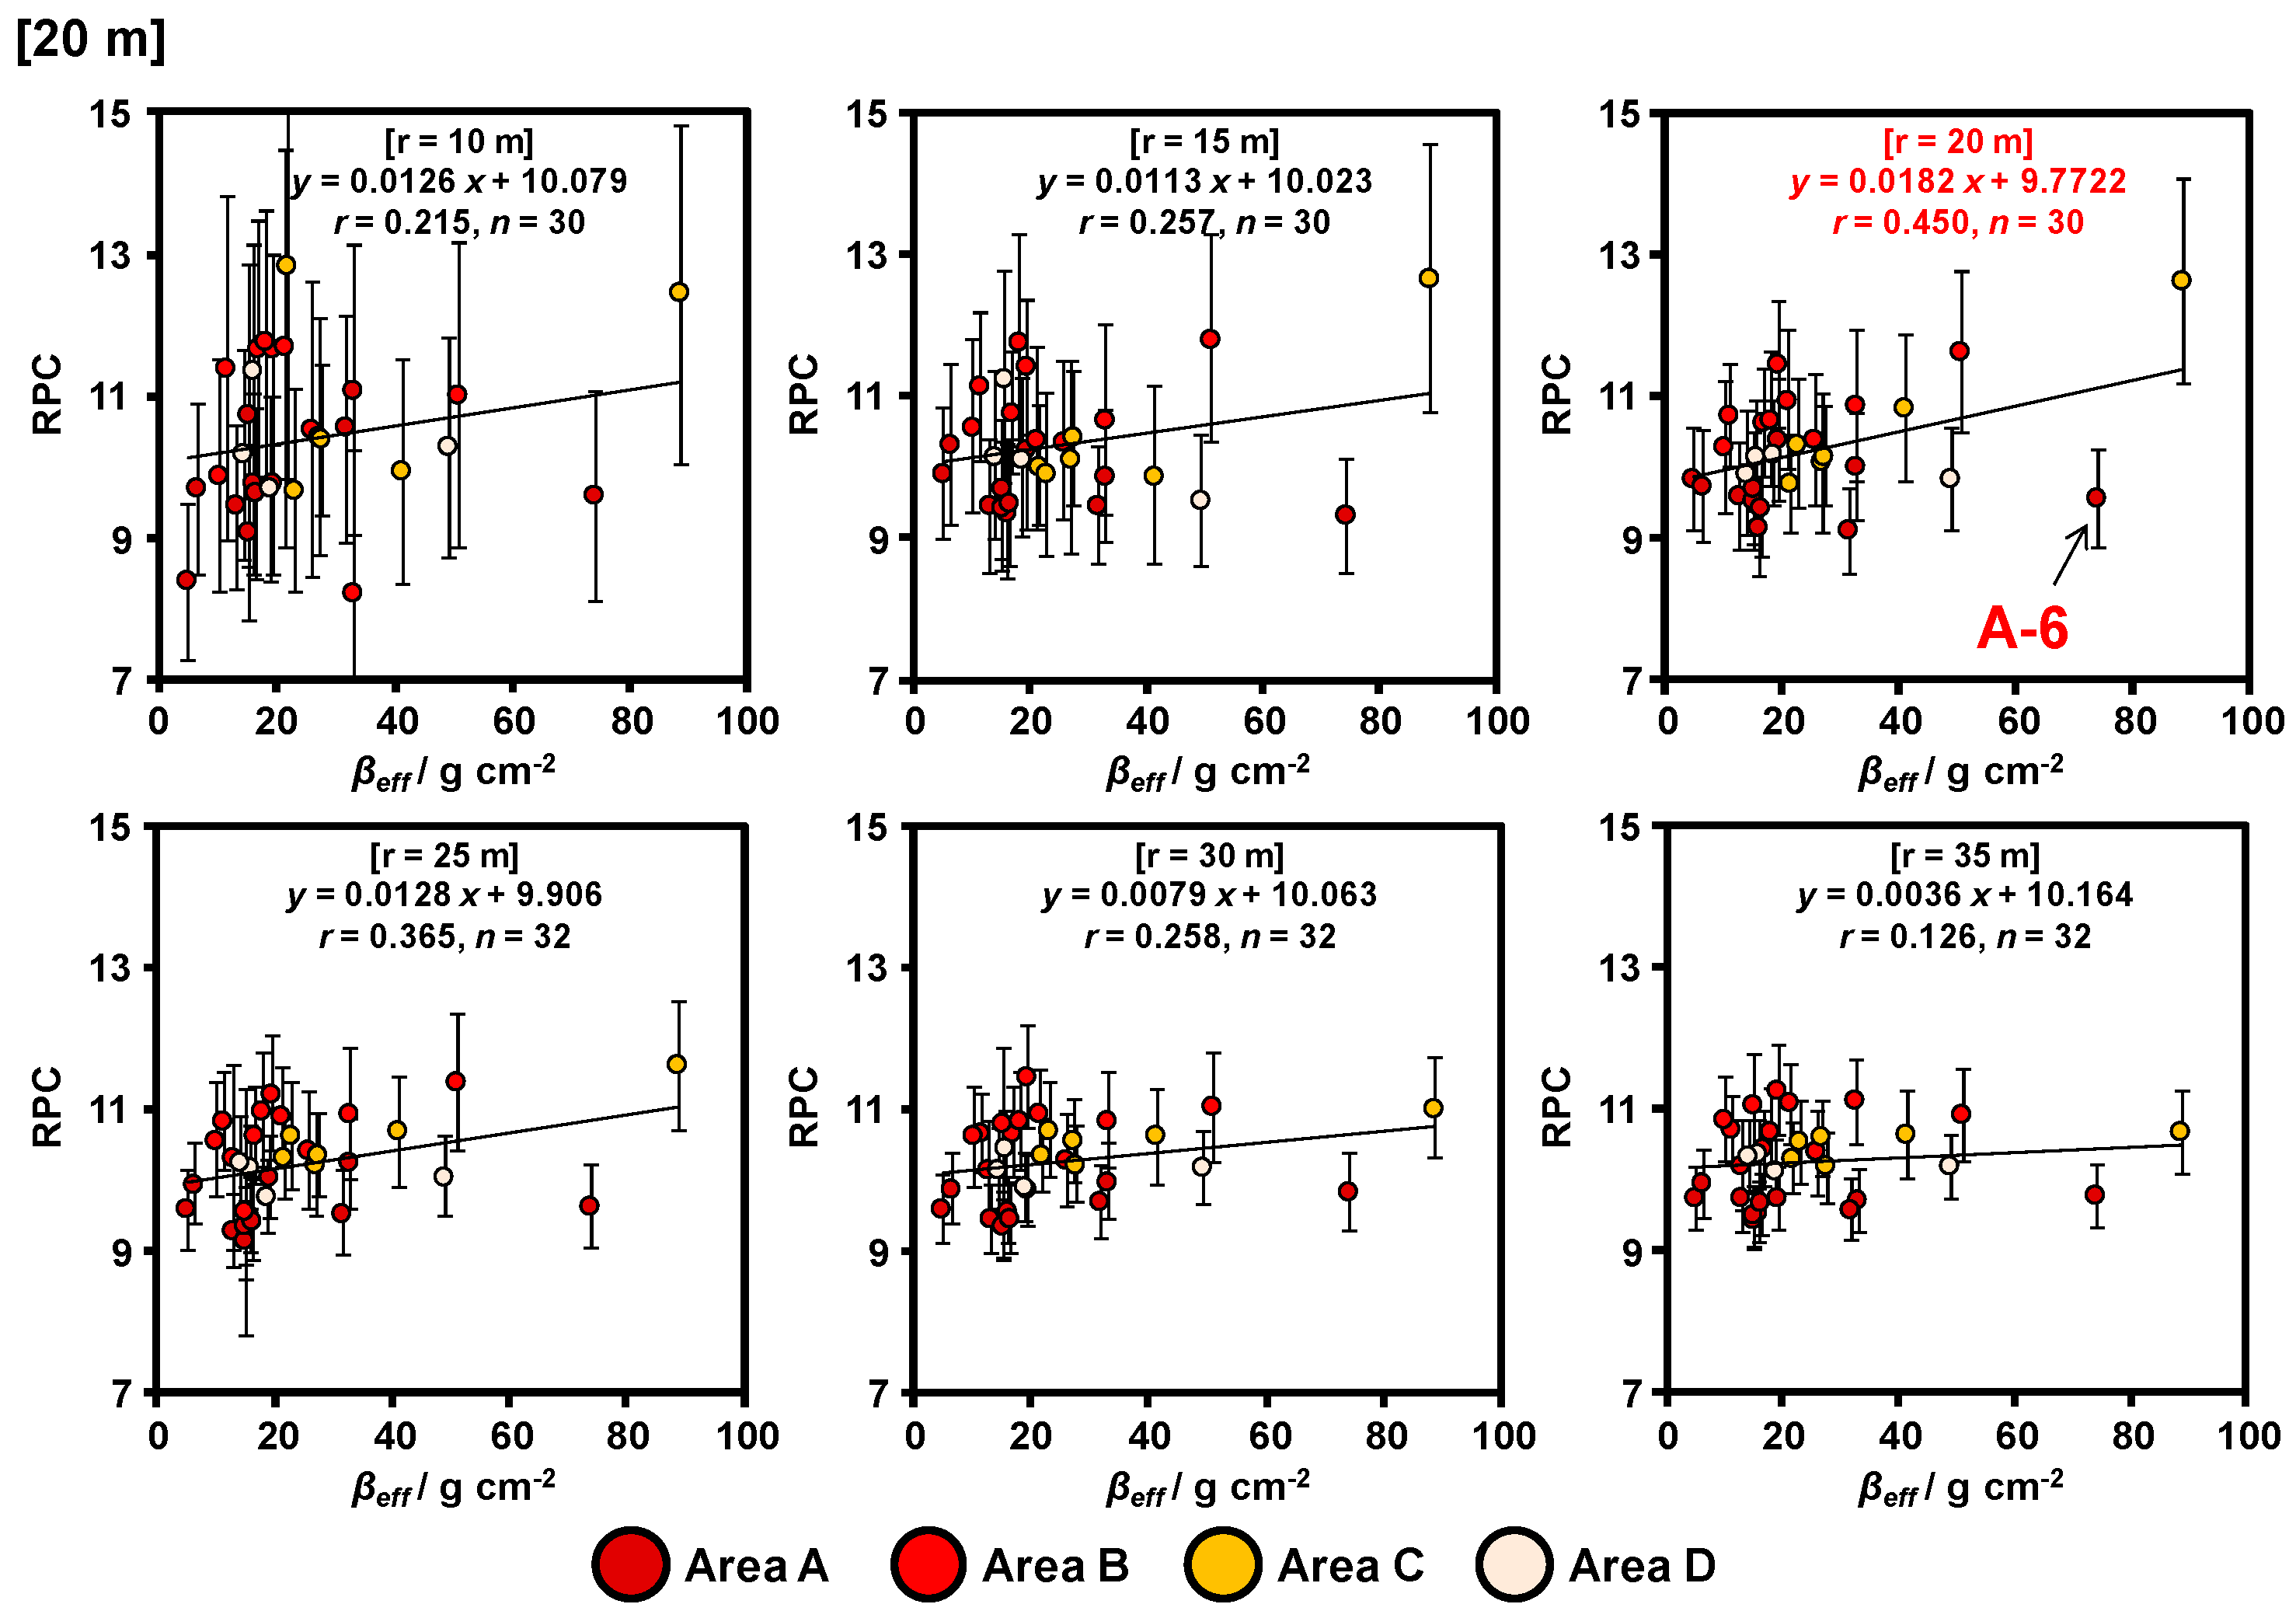
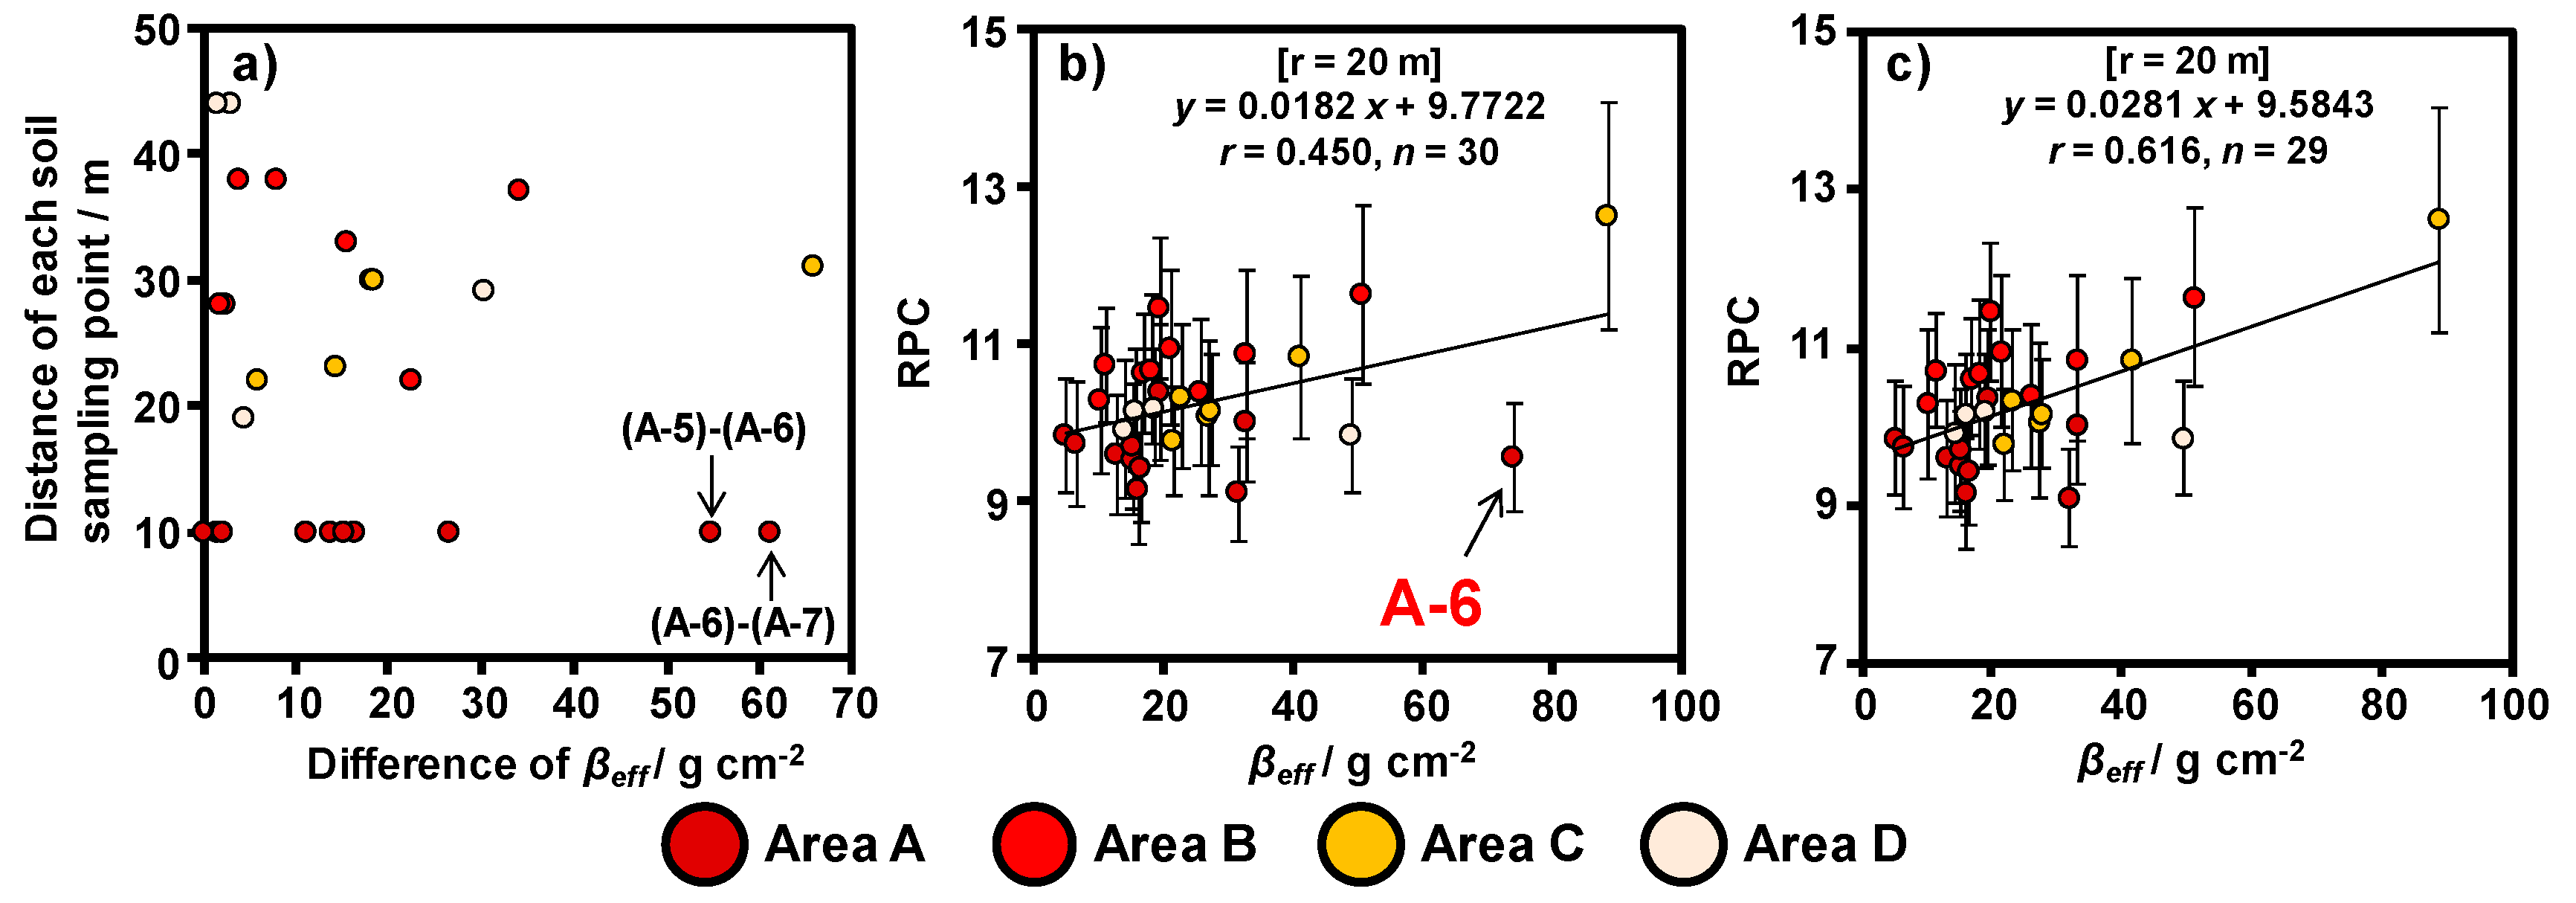
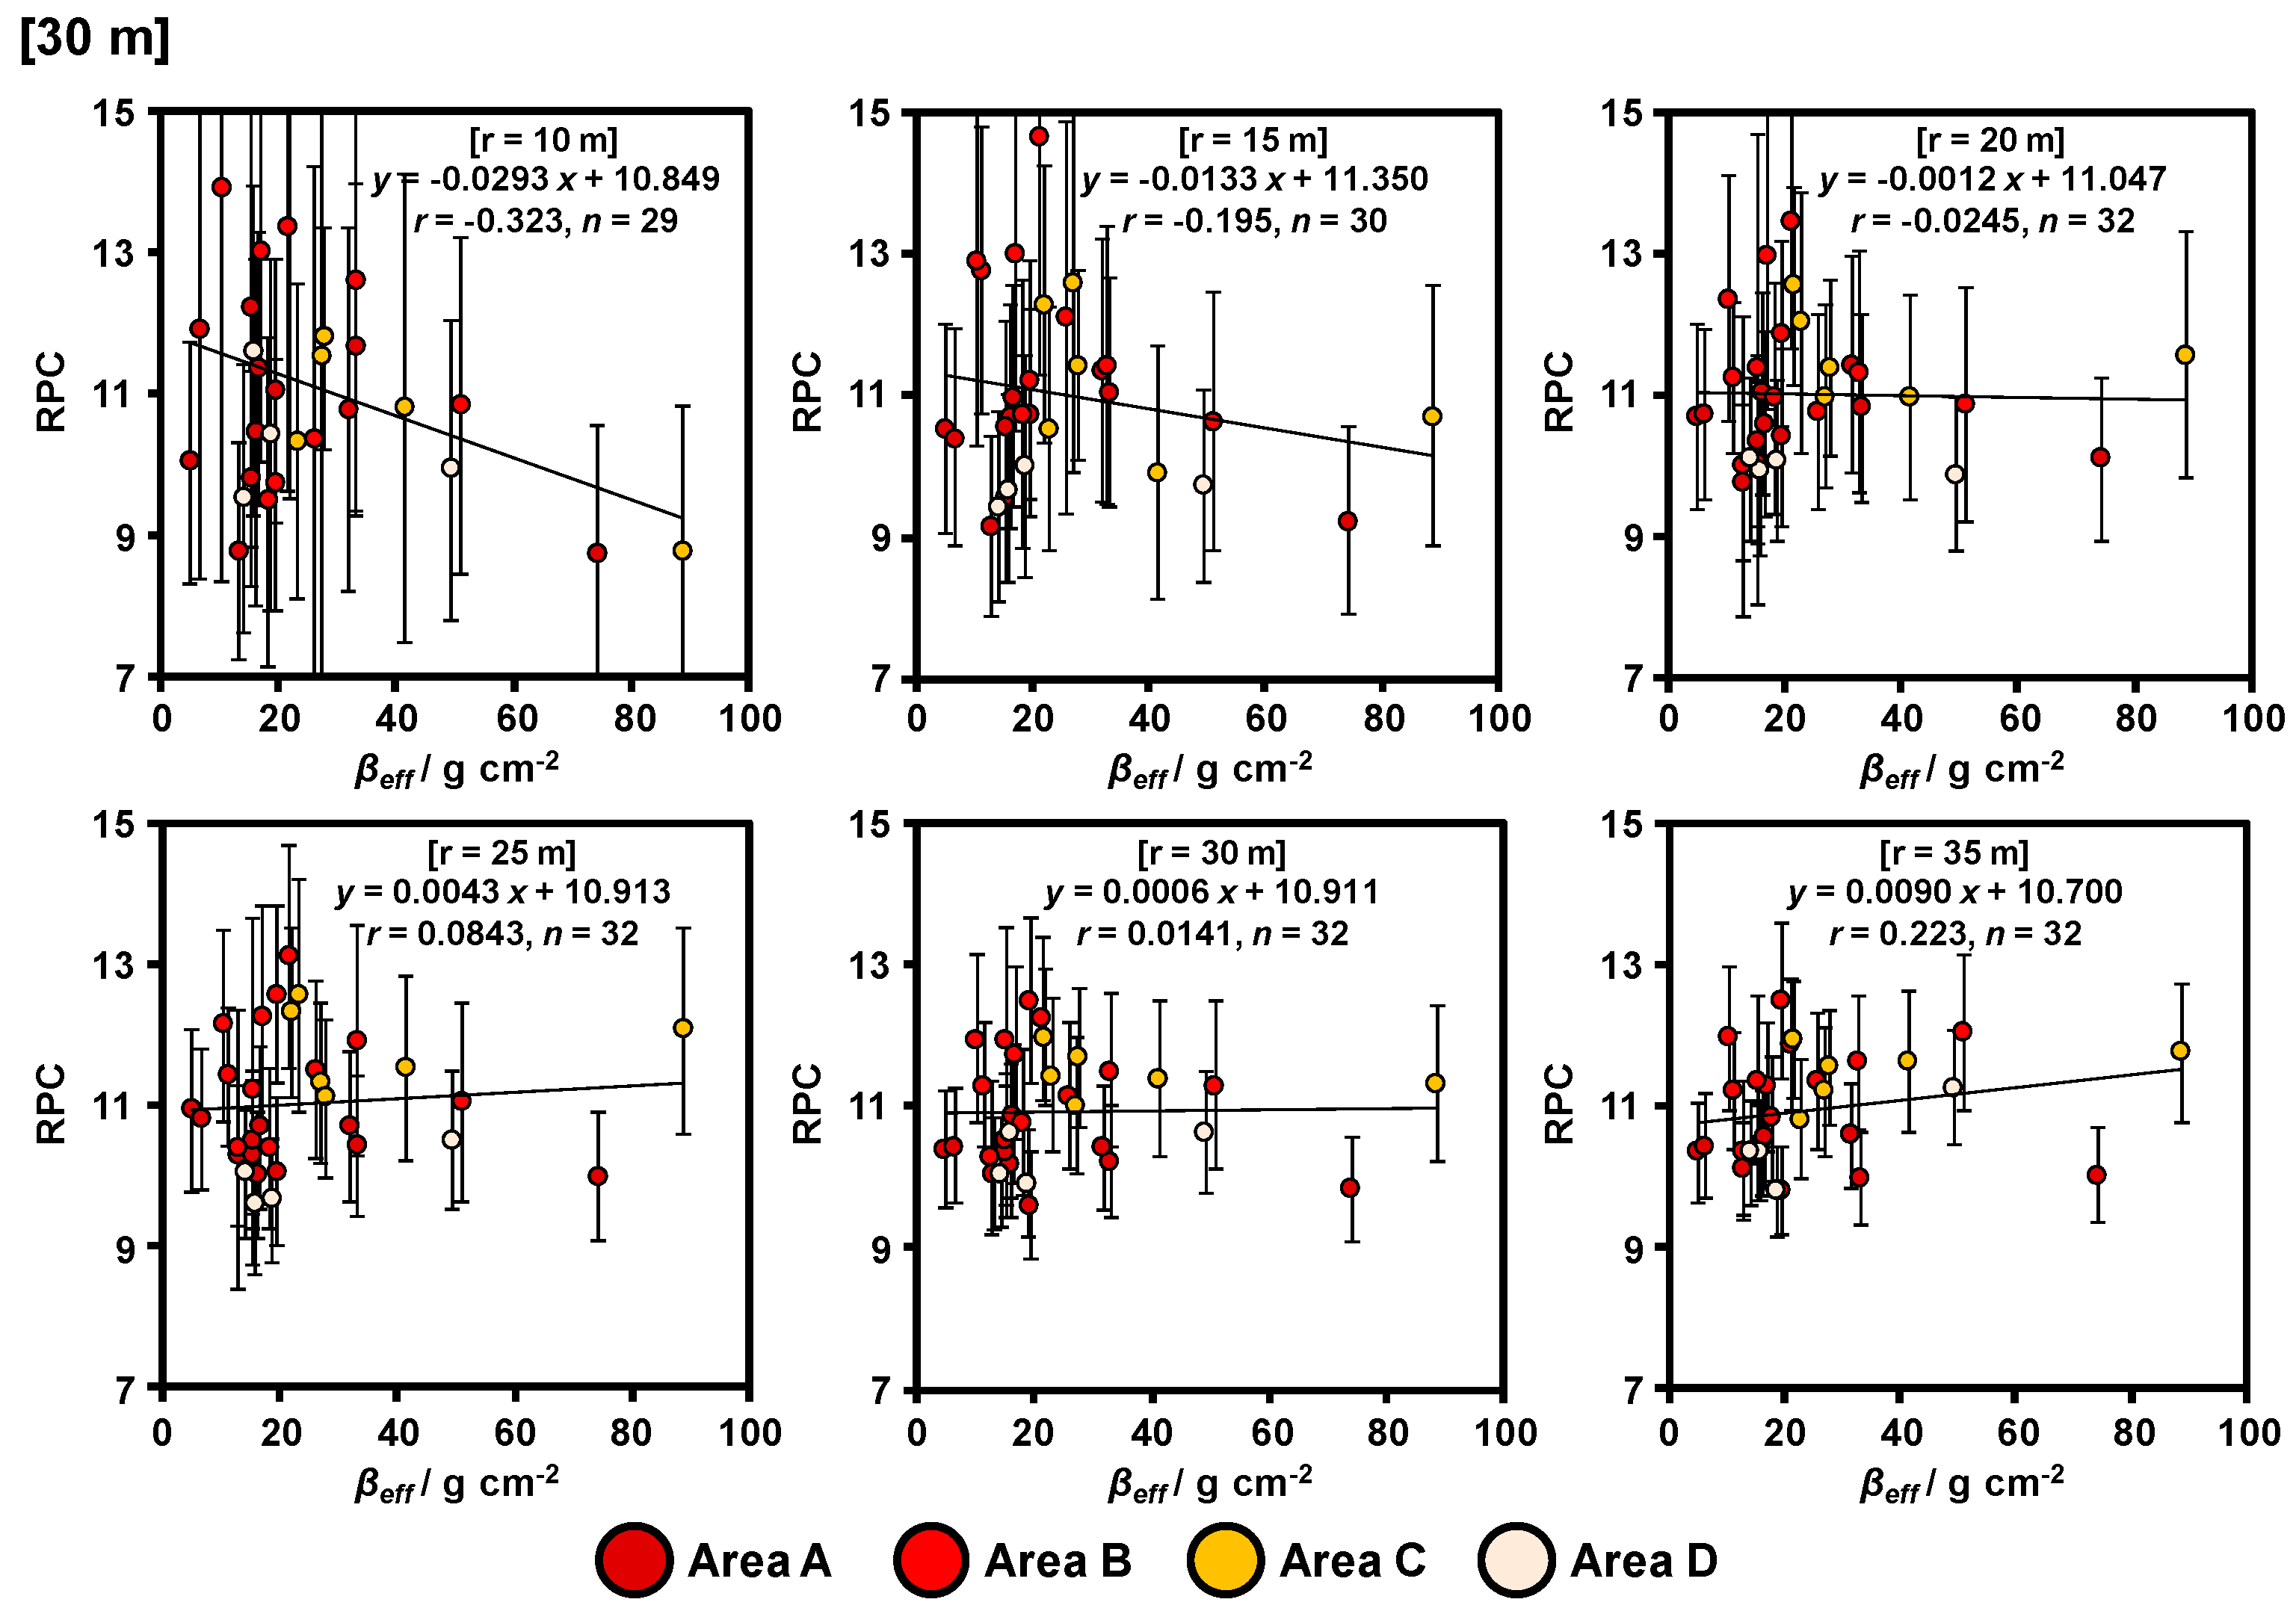
3.3. Relationship between RPC and βeff
4. Discussion
4.1. Estimation of the Valid Range of Gamma Ray
4.2. Consideration of the Horizontal Spread of Radiocesium in the Soil
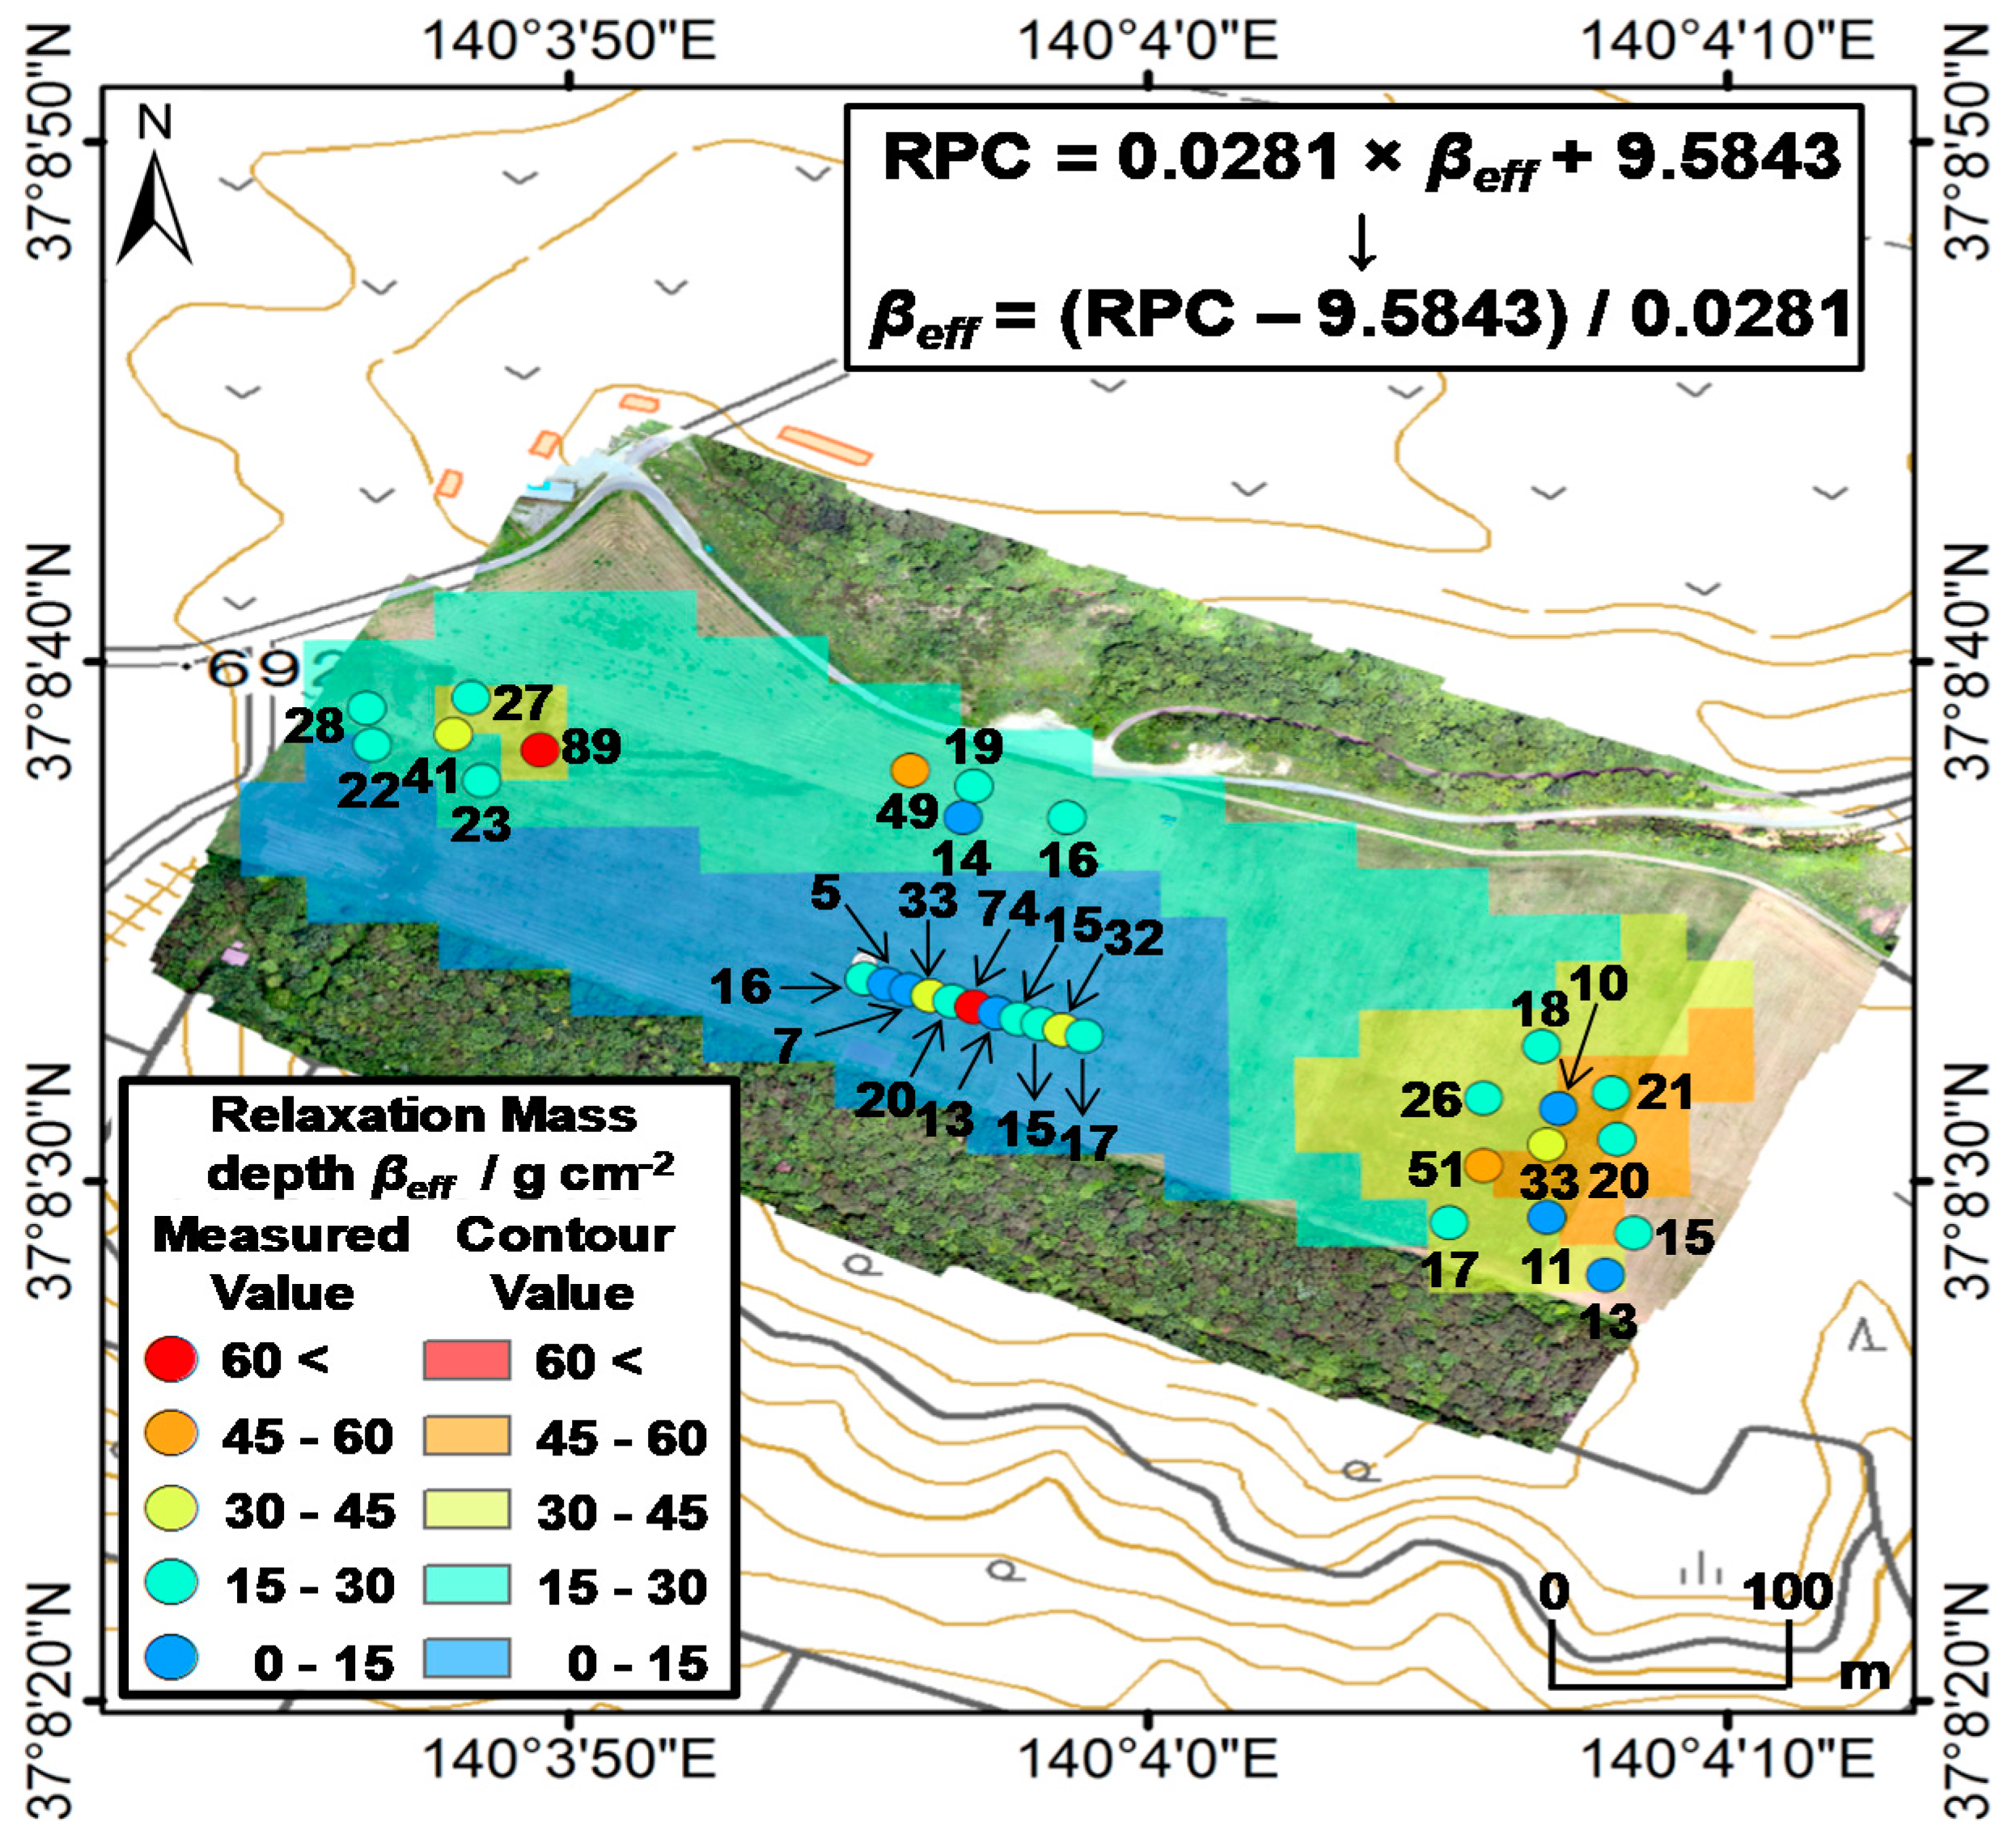
4.3. Horizonal Distribution of βeff Based on the ARM Results
5. Conclusions
Acknowledgments
Author Contributions
Conflicts of Interest
Appendix A

References
- Saito, K.; Tanihata, I.; Fujiwara, M.; Saito, T.; Shimoura, S.; Otsuka, T.; Onda, Y.; Hoshi, M.; Ikeuchi, Y.; Takahashi, F.; et al. Detailed deposition density maps constructed by large-scale soil sampling for gamma-ray emitting radioactive nuclides from the Fukushima Dai-ichi Nuclear Power Plant accident. J. Environ. Radioact. 2015, 139, 308–319. [Google Scholar] [CrossRef] [PubMed]
- Lyons, C.; Colton, D. Aerial measurement system in Japan. Health Phys. 2012, 102, 509–515. [Google Scholar] [CrossRef] [PubMed]
- Blumenthal, D.J. Introduction to the special issue on the U.S. response to the Fukushima accident. Health Phys. 2012, 102, 482–484. [Google Scholar] [CrossRef] [PubMed]
- Sanada, Y.; Sugita, T.; Nishizawa, Y.; Kondo, A.; Torii, T. The aerial radiation monitoring in Japan after the Fukushima Daiichi nuclear power plant accident. Prog. Nucl. Sci. Technol. 2014, 4, 76–80. [Google Scholar] [CrossRef]
- Sanada, Y.; Ishizaki, A.; Nishizawa, Y.; Urabe, Y. Airborne radiation monitoring using a manned helicopter. BUNSEKI KAGAKU 2017, 66, 149–162. [Google Scholar] [CrossRef]
- Ishizaki, A.; Sanada, Y.; Mori, A.; Imura, M.; Ishida, M.; Munakata, M. Investigation of snow cover effects and attenuation correction of gamma ray in aerial radiation monitoring. Remote Sens. 2016, 8, 892. [Google Scholar] [CrossRef]
- Sanada, Y.; Torii, T. Aerial radiation monitoring around the Fukushima Dai-ichi nuclear power plant using an unmanned helicopter. J. Environ. Radioact. 2015, 139, 294–299. [Google Scholar] [CrossRef] [PubMed]
- Sanada, Y.; Orita, T.; Torii, T. Temporal variation of dose rate distribution around the Fukushima Daiichi nuclear power station using unmanned helicopter. Appl. Radiat. Isot. 2016, 118, 308–316. [Google Scholar] [CrossRef] [PubMed]
- Nishizawa, Y.; Yoshida, M.; Sanda, Y.; Torii, T. Distribution of the 134Cs/137Cs ratio around the Fukushima Daiichi nuclear power plant using an unmanned helicopter radiation monitoring system. J. Nucl. Sci. Technol. 2016, 53, 468–474. [Google Scholar] [CrossRef]
- Tanaka, K.; Takahashi, Y.; Sakaguchi, A.; Umeo, M.; Hayakawa, S.; Tanida, H.; Saito, T.; Kanai, Y. Vertical profiles of Iodine-131 and Cesium-137 in soils in Fukushima Prefecture related to the Fukushima Daiichi nuclear power station accident. Geochem. J. 2012, 46, 73–76. [Google Scholar] [CrossRef]
- Fujiwara, T.; Saito, T.; Muroya, Y.; Sawahata, H.; Yamashita, Y.; Nagasaki, S.; Okamoto, K.; Takahashi, H.; Uesaka, M.; Katsumura, Y.; et al. Isotopic ratio and vertical distribution of radionuclides in soil affected by the accident of Fukushima Dai-ichi nuclear power plants. J. Environ. Radioact. 2012, 113, 37–44. [Google Scholar] [CrossRef] [PubMed]
- Ohno, T.; Muramatsu, Y.; Miura, Y.; Oda, K.; Inagawa, N.; Ogawa, H.; Yamazaki, A.; Toyama, C.; Sato, M. Depth profiles of radioactive cesium and iodine released from the Fukushima Daiichi nuclear power plant in different agricultural fields and forests. Geochem. J. 2012, 46, 287–295. [Google Scholar] [CrossRef]
- Kato, H.; Onda, Y.; Teramage, M. Depth distribution of 137Cs, 134Cs, and 131I in soil profile after Fukushima Dai-ichi nuclear power plant accident. J. Environ. Radioact. 2012, 111, 59–64. [Google Scholar] [CrossRef] [PubMed]
- Koarashi, J.; Atrashi-Andoh, M.; Matsunaga, T.; Sato, T.; Nagao, S.; Nagai, H. Factors affecting vertical distribution of Fukushima accident-derived radiocesium in soil under different land-use conditions. Sci. Total Environ. 2012, 431, 392–401. [Google Scholar] [CrossRef] [PubMed]
- Satou, Y.; Sueki, K.; Sasa, K.; Kitagawa, J.; Ikarashi, S.; Kinoshita, N. Vertical distribution and formation analysis of the 131I, 137Cs, 129mTe, and 110mAg from the Fukushima Dai-ichi nuclear power plant in the beach soil. J. Radioanal. Nucl. Chem. 2015, 303, 1197–1200. [Google Scholar] [CrossRef]
- Honda, M.; Matsuzaki, H.; Miyake, Y.; Maejima, Y.; Yamagata, T.; Nagai, H. Depth profile and mobility of 129I and 137Cs in soil originating from the Fukushima Dai-ichi nuclear power plant. J. Environ. Radioact. 2015, 146, 35–43. [Google Scholar] [CrossRef] [PubMed]
- Matsunaga, T.; Koarashi, J.; Atarashi-Andoh, M.; Nagao, S.; Sato, T.; Nagai, H. Comparison of the vertical distributions of Fukushima nuclear accident radiocesium in soil before and after the first rainy season, with physicochemical and mineralogical interpretations. Sci. Total Environ. 2013, 447, 301–314. [Google Scholar] [CrossRef] [PubMed]
- Matsuda, N.; Mikami, S.; Shimoura, S.; Takahashi, J.; Nakano, M.; Shimada, K.; Uno, K.; Hagiwara, S.; Sato, K. Depth profiles of radioactive cesium in soil using a scraper plate over a wide area surrounding the Fukushima Dai-ichi nuclear power plant, Japan. J. Environ. Radioact. 2015, 139, 427–434. [Google Scholar] [CrossRef] [PubMed]
- Takahashi, J.; Tamura, K.; Suda, T.; Matsumura, R.; Onda, Y. Vertical distribution and temporal changes of 137Cs in soil profiles under various land uses after the Fukushima Dai-ichi nuclear power plant accident. J. Environ. Radioact. 2015, 139, 351–361. [Google Scholar] [CrossRef] [PubMed]
- Saito, K.; Jacob, P. Fundamental Data on Environmental Gamma-Ray Fields in the Air Due to Source in the Ground; JAERI-Data/Code 98-001; Japan Atomic Energy Research Institute: Naka, Ibaraki, Japan, 1998; pp. 1–93. [Google Scholar]
- International Commission on Radiation Units and Measurements. Gamma-Ray Spectrometry in the Environment. In ICRU Report; International Commission on Radiation Units and Measurements Inc.: Bethesda, MD, USA, 1994; Volume 53, pp. 1–84. [Google Scholar]


© 2017 by the authors. Licensee MDPI, Basel, Switzerland. This article is an open access article distributed under the terms and conditions of the Creative Commons Attribution (CC BY) license (http://creativecommons.org/licenses/by/4.0/).
Share and Cite
Ochi, K.; Sasaki, M.; Ishida, M.; Hamamoto, S.; Nishimura, T.; Sanada, Y. Estimation of the Vertical Distribution of Radiocesium in Soil on the Basis of the Characteristics of Gamma-Ray Spectra Obtained via Aerial Radiation Monitoring Using an Unmanned Helicopter. Int. J. Environ. Res. Public Health 2017, 14, 926. https://doi.org/10.3390/ijerph14080926
Ochi K, Sasaki M, Ishida M, Hamamoto S, Nishimura T, Sanada Y. Estimation of the Vertical Distribution of Radiocesium in Soil on the Basis of the Characteristics of Gamma-Ray Spectra Obtained via Aerial Radiation Monitoring Using an Unmanned Helicopter. International Journal of Environmental Research and Public Health. 2017; 14(8):926. https://doi.org/10.3390/ijerph14080926
Chicago/Turabian StyleOchi, Kotaro, Miyuki Sasaki, Mutsushi Ishida, Shoichiro Hamamoto, Taku Nishimura, and Yukihisa Sanada. 2017. "Estimation of the Vertical Distribution of Radiocesium in Soil on the Basis of the Characteristics of Gamma-Ray Spectra Obtained via Aerial Radiation Monitoring Using an Unmanned Helicopter" International Journal of Environmental Research and Public Health 14, no. 8: 926. https://doi.org/10.3390/ijerph14080926
APA StyleOchi, K., Sasaki, M., Ishida, M., Hamamoto, S., Nishimura, T., & Sanada, Y. (2017). Estimation of the Vertical Distribution of Radiocesium in Soil on the Basis of the Characteristics of Gamma-Ray Spectra Obtained via Aerial Radiation Monitoring Using an Unmanned Helicopter. International Journal of Environmental Research and Public Health, 14(8), 926. https://doi.org/10.3390/ijerph14080926