
Unintentional Child and Adolescent Drowning Mortality from 2000 to 2013 in 21 Countries: Analysis of the WHO Mortality Database


Abstract
:1. Introduction
2. Methods
2.1. Data Source
2.2. Choice of Age Group
2.3. Classification of Drowning
2.4. Classification of Countries
2.5. Statistical Analysis
2.6. Ethics Statement
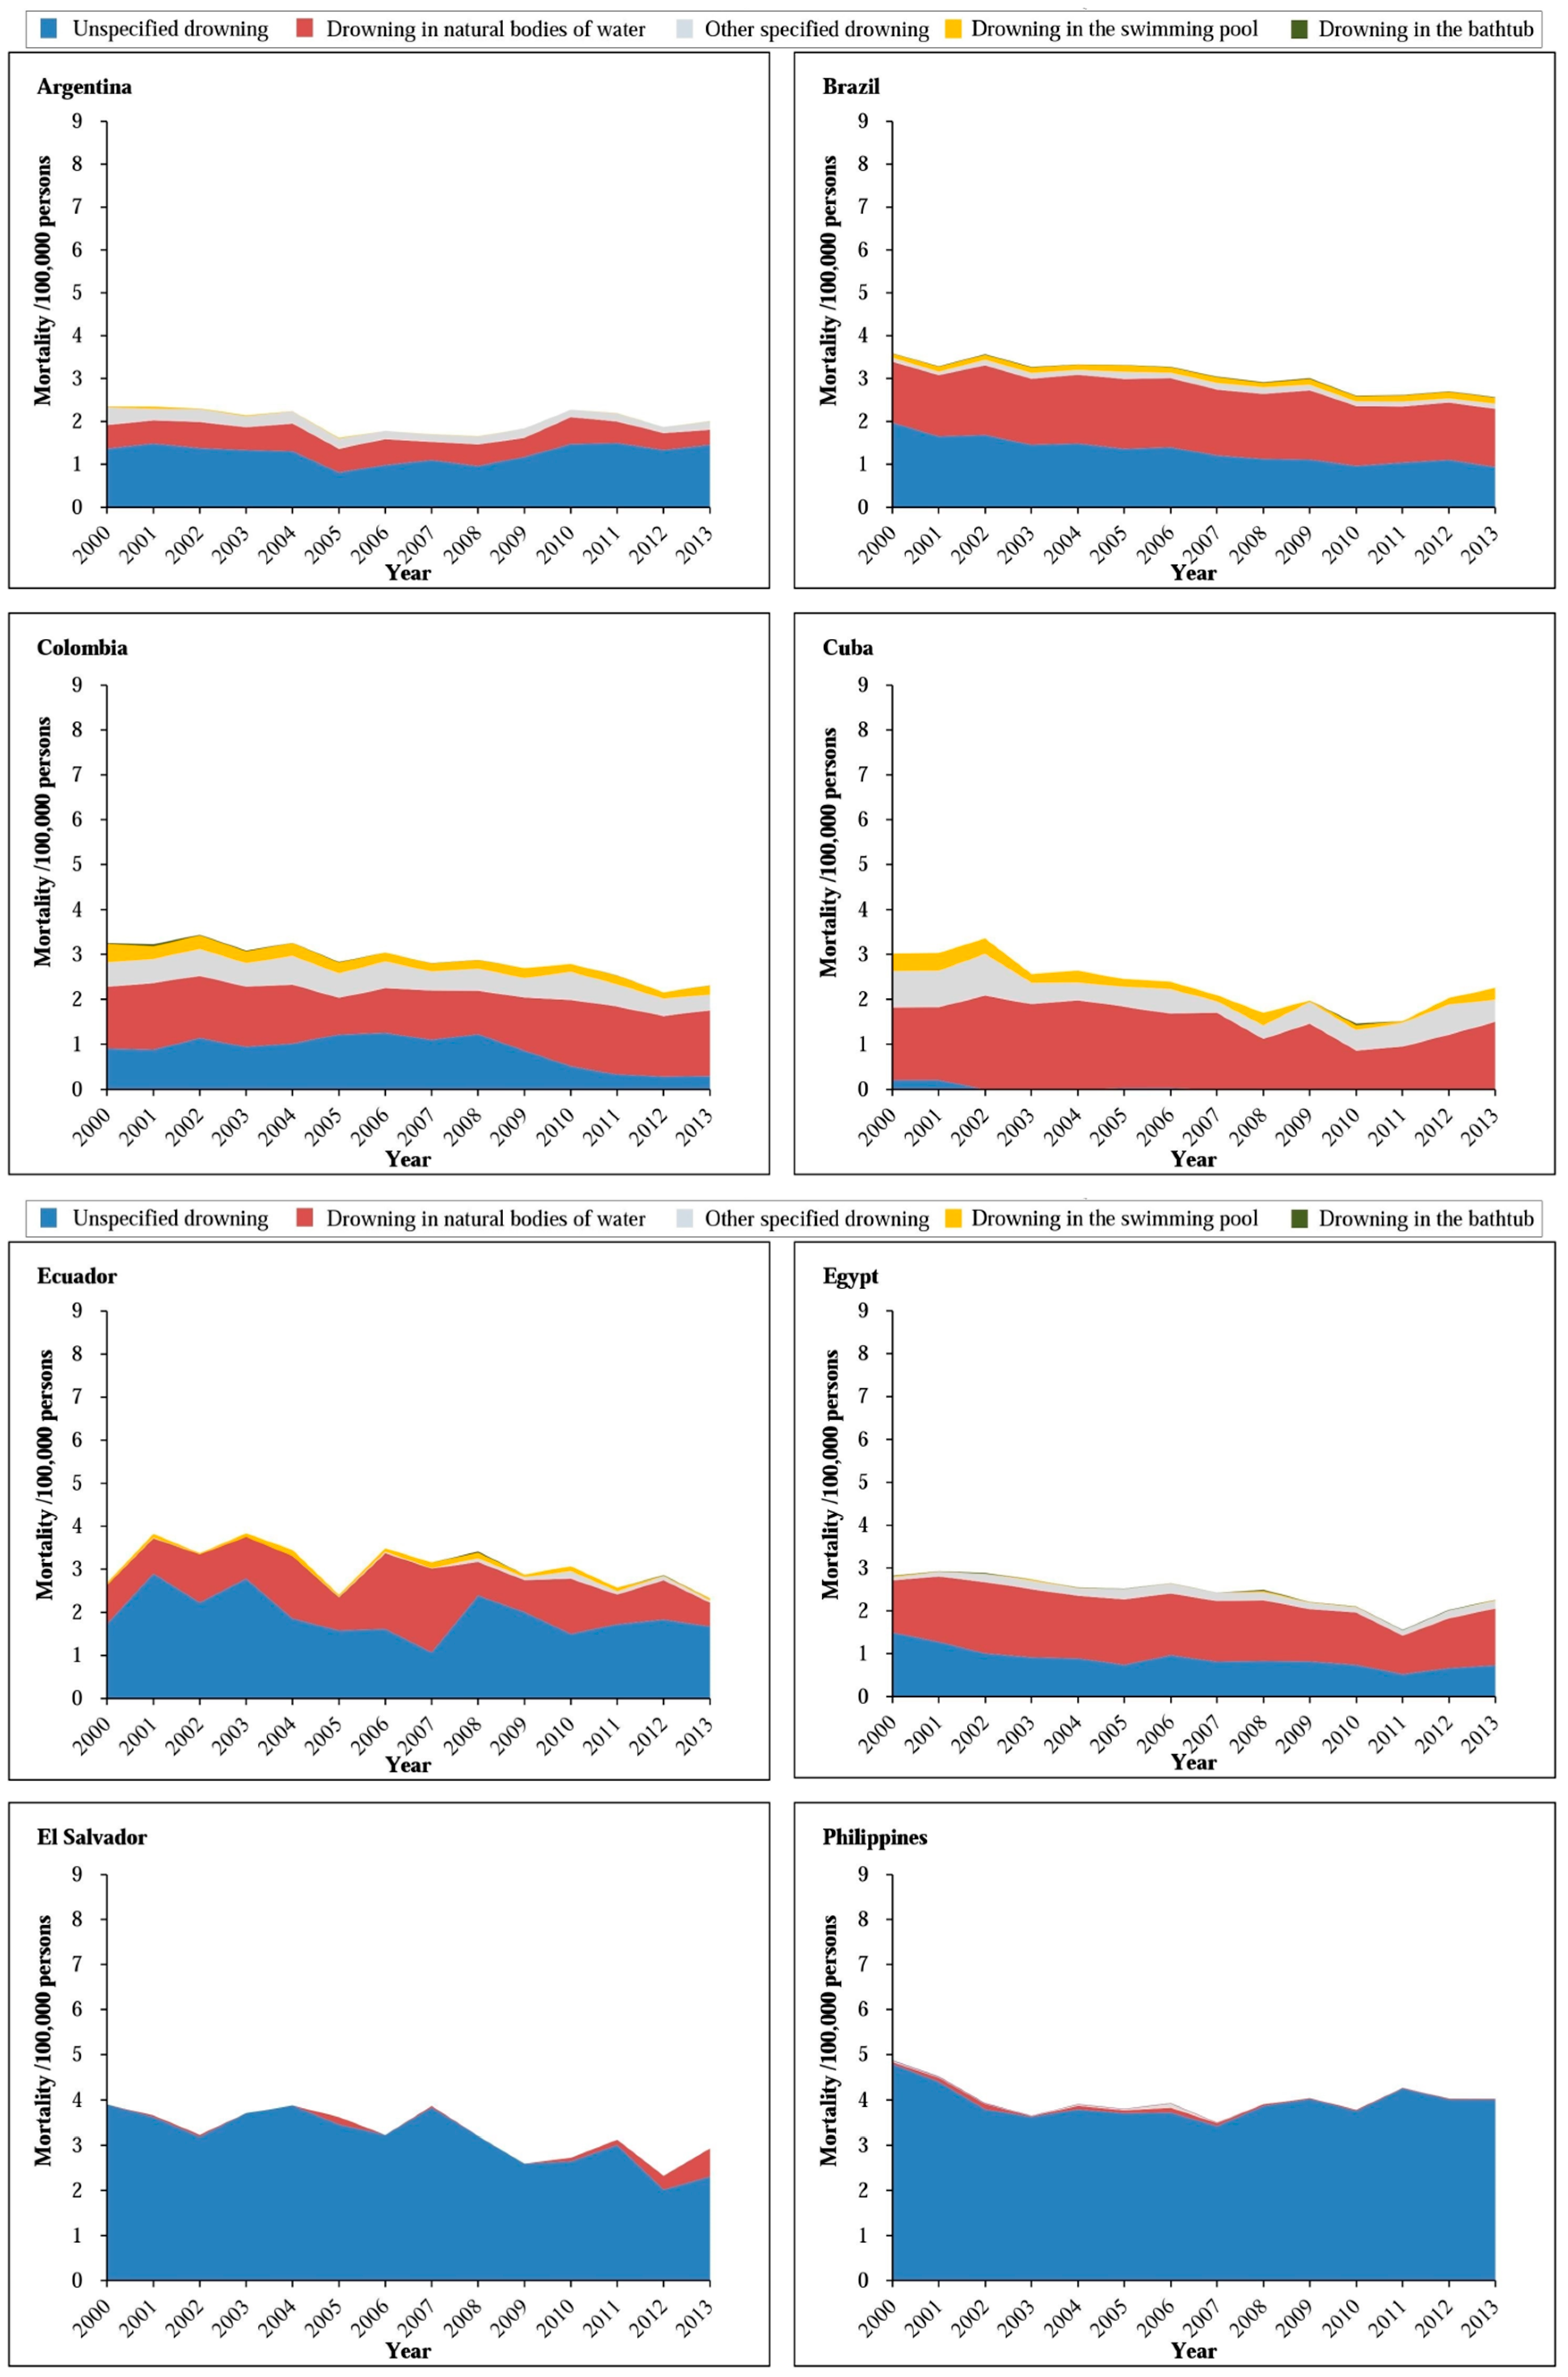
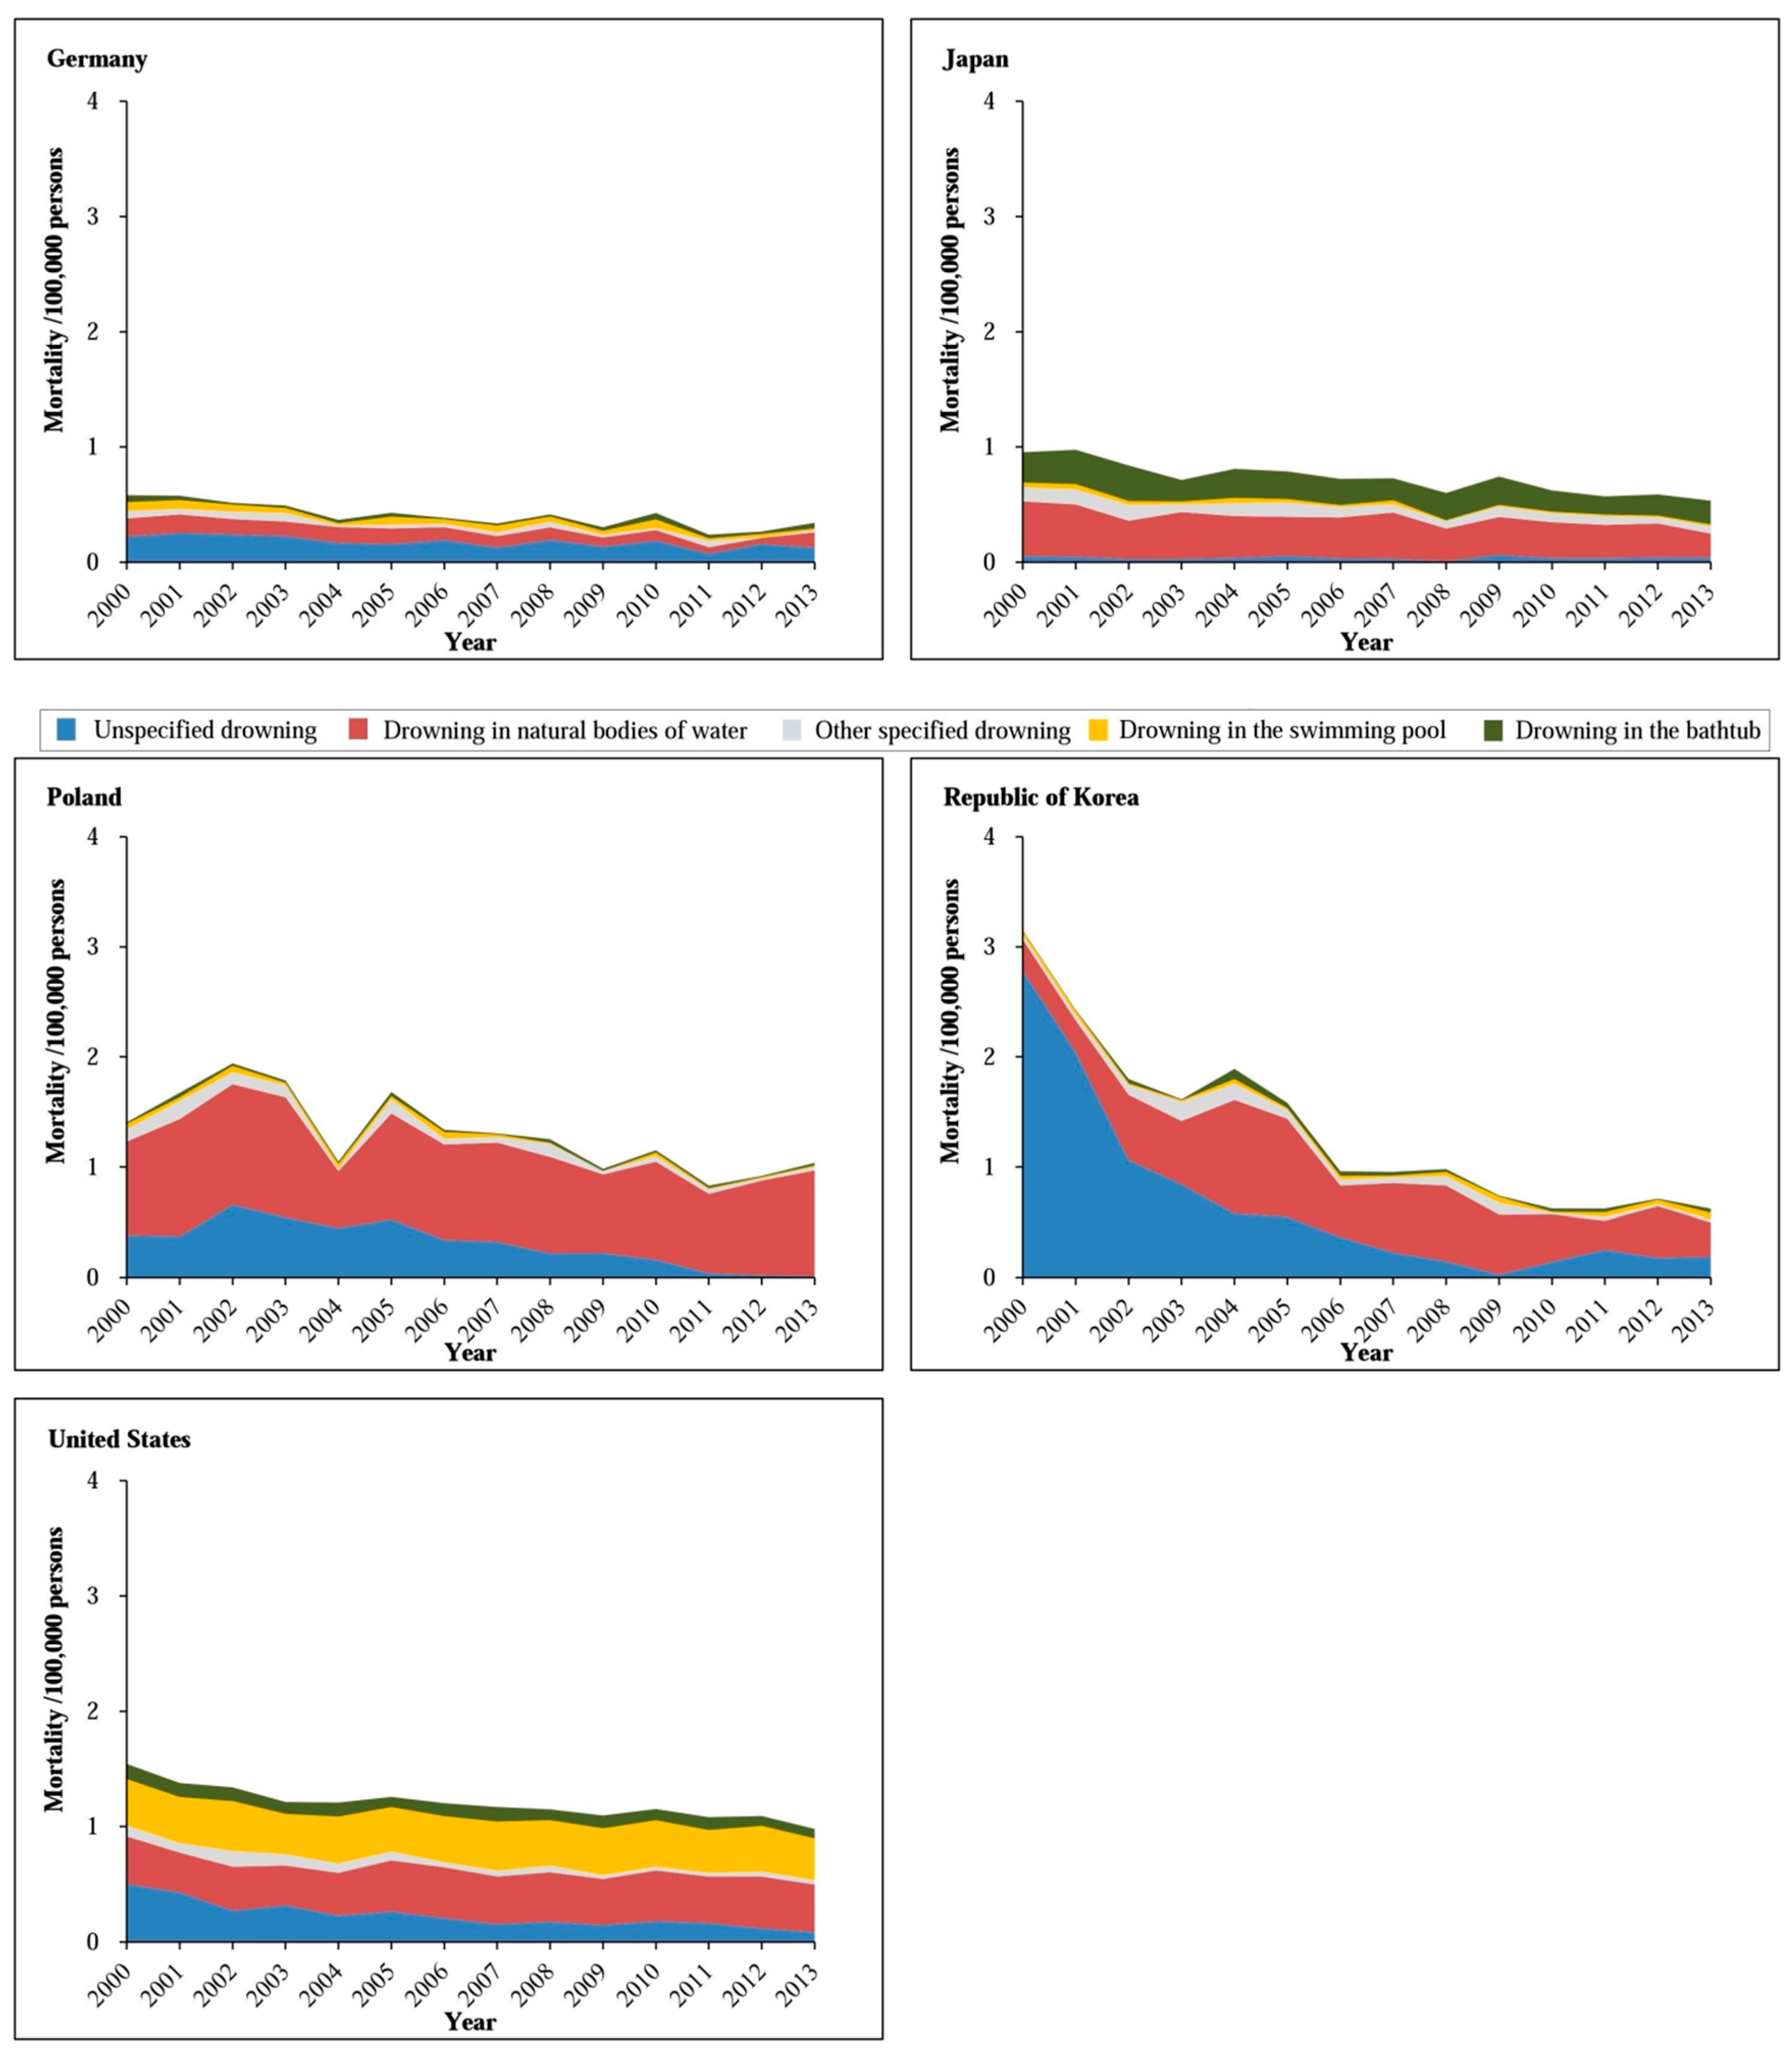
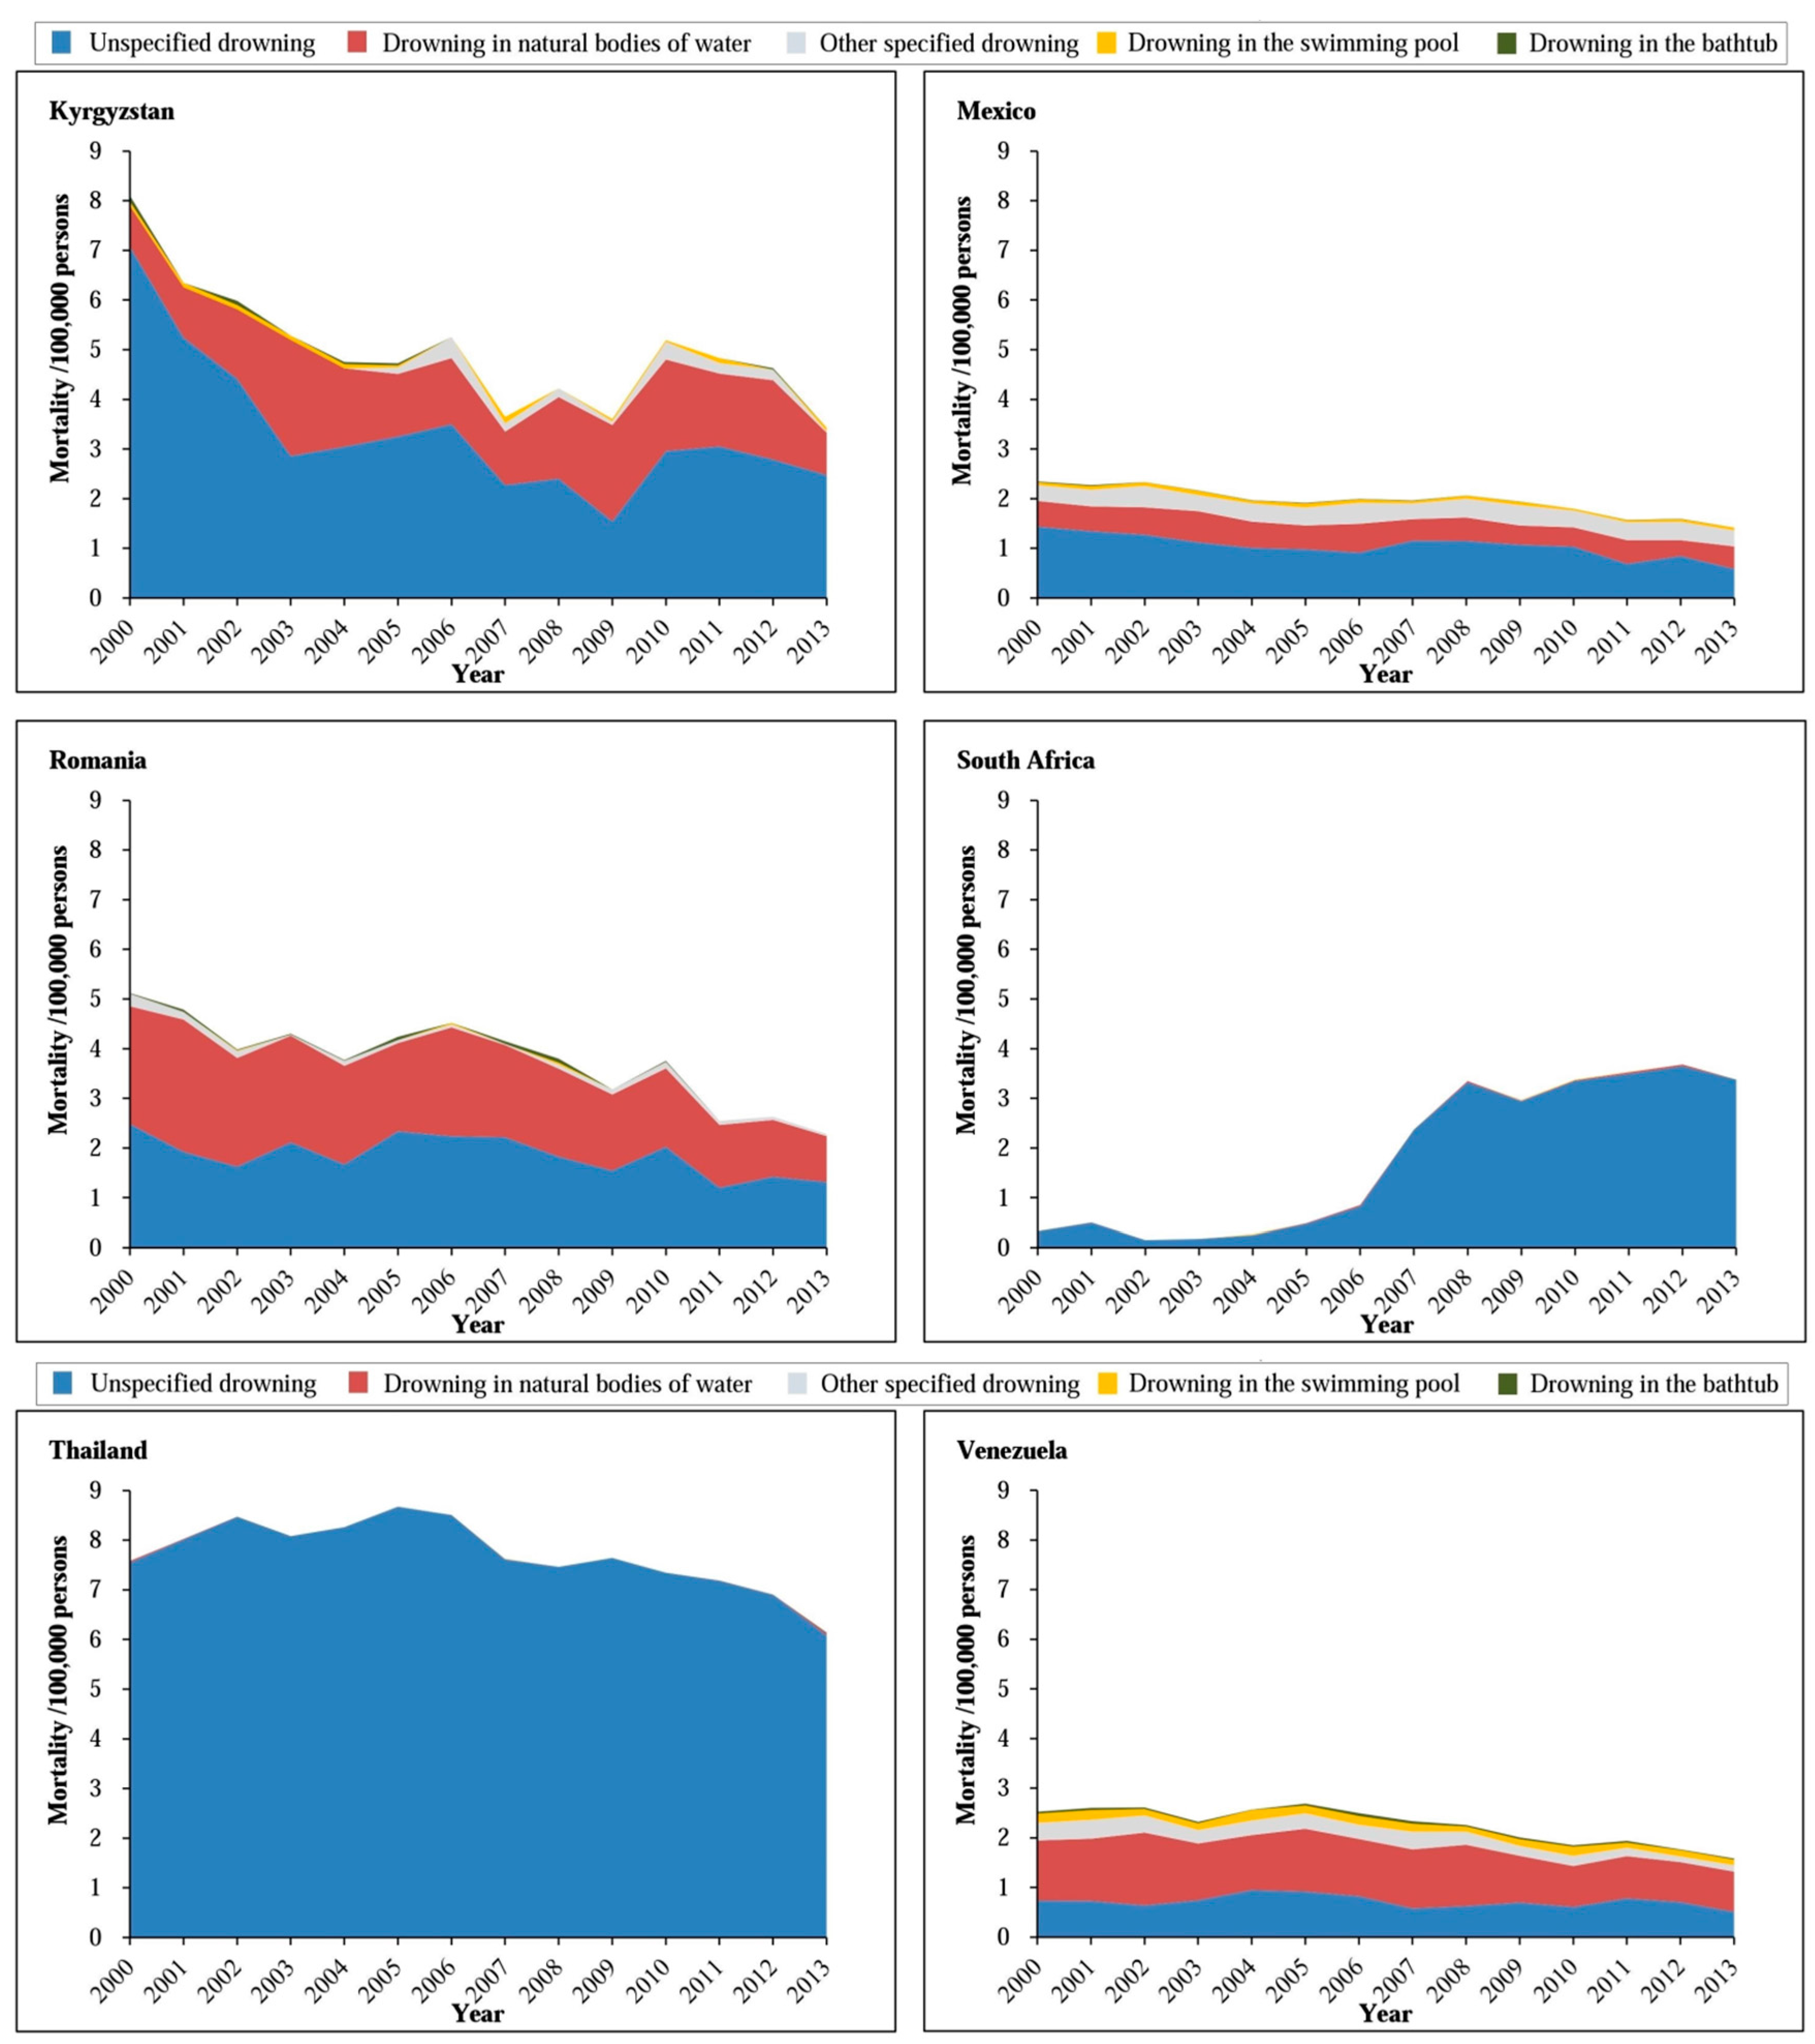
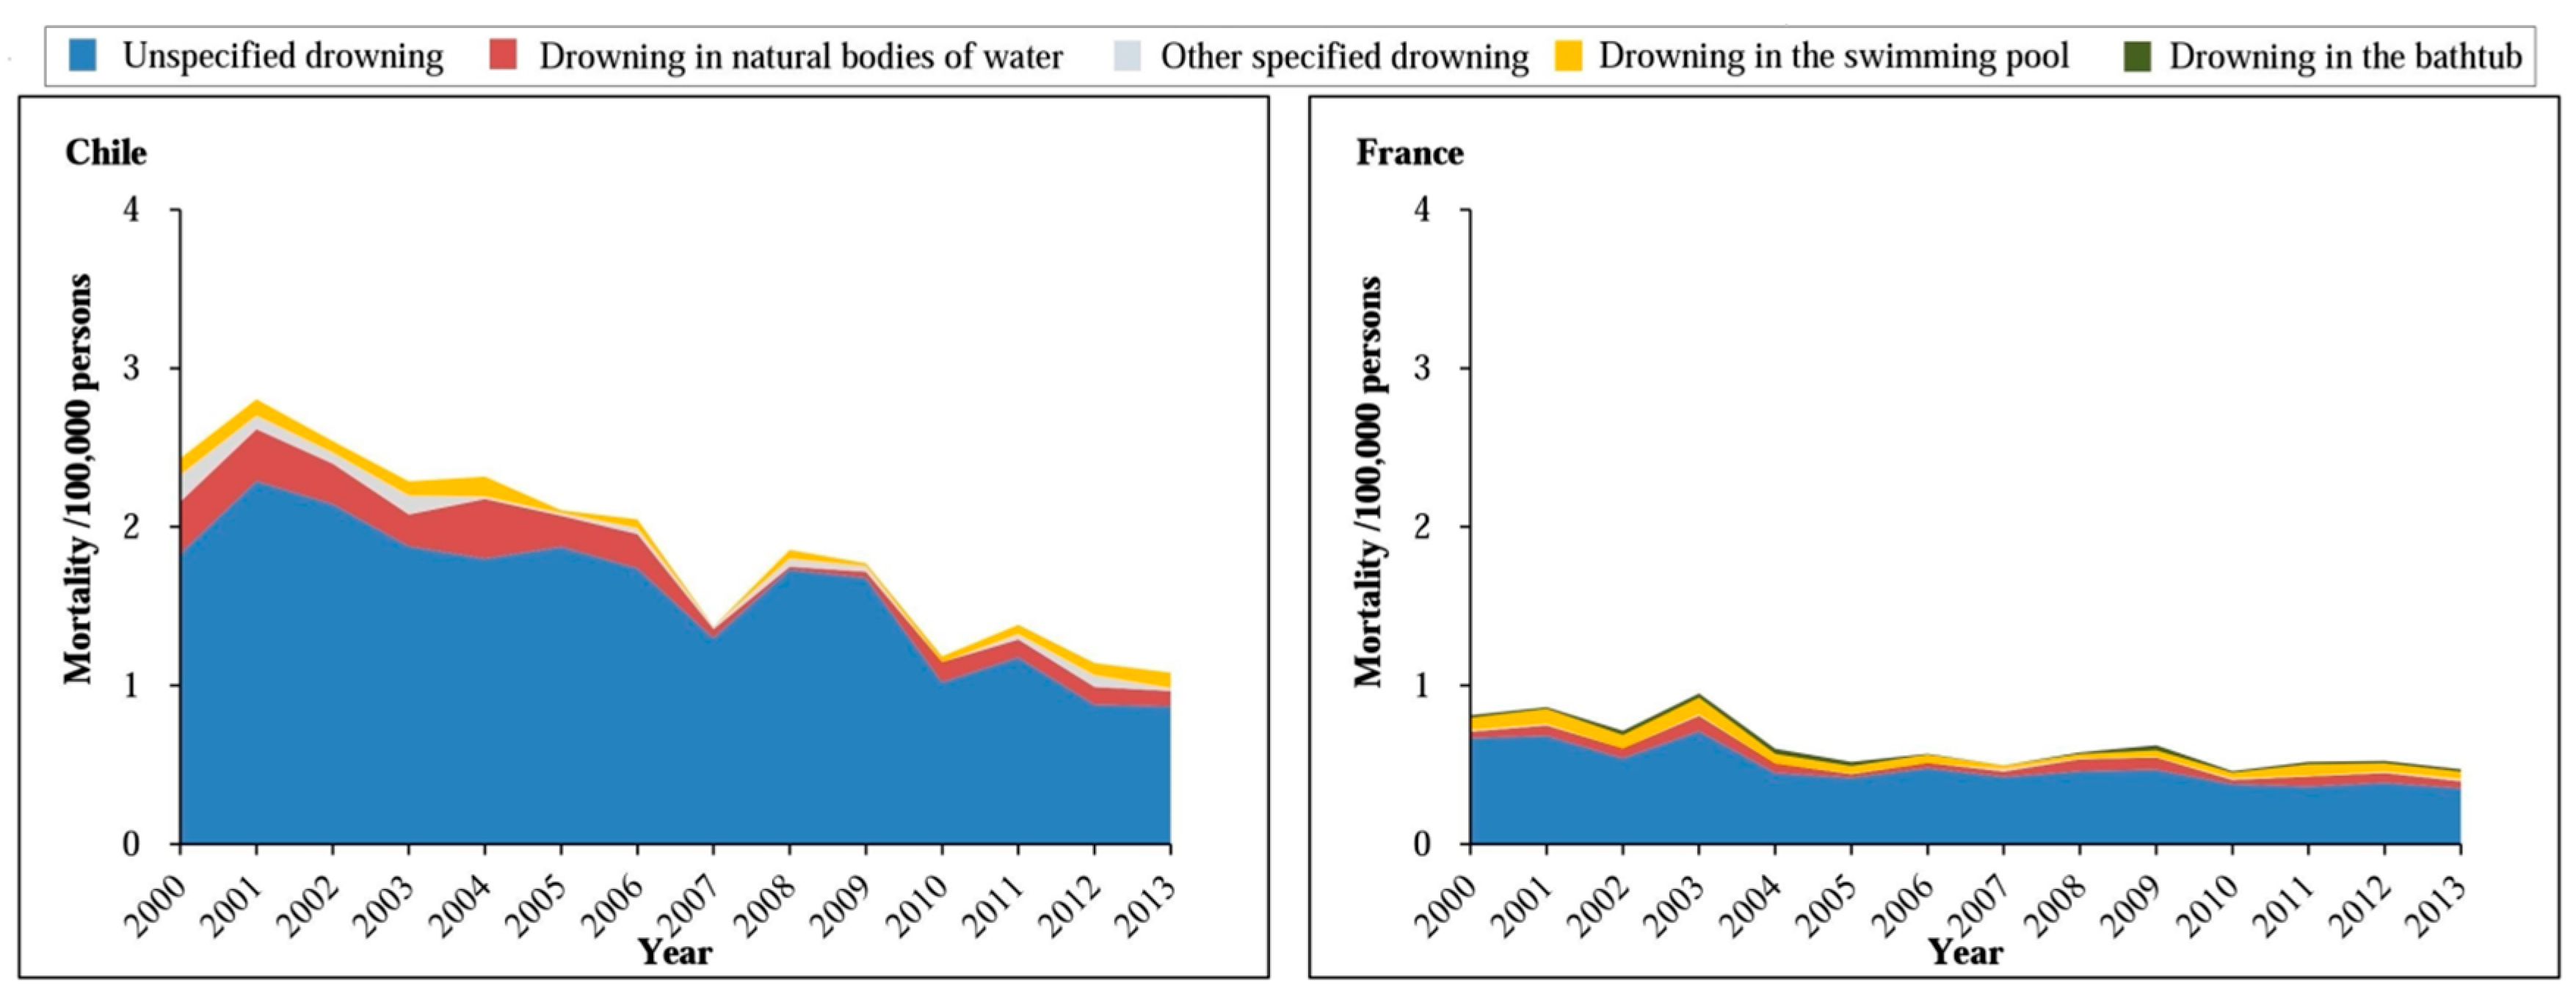
3. Results
4. Discussion
5. Conclusions
Acknowledgments
Author Contributions
Conflicts of Interest
References
- Bhalla, K.; Hu, G.; Baker, T.D.; Baker, S.P. Injuries among children: An unrecognized threat in low- and middle-income countries. In Proceedings of the APHA 140th Annual Meeting & EXPO, San Francisco, CA, USA, 27–31 October 2012. [Google Scholar]
- Zhu, Y.; Xu, G.; Li, H.; Huang, Y.; Ding, K.; Chen, J. Epidemiology and risk factors for nonfatal drowning in the migrant children. Southeast Asian J. Trop. Med. Public Health 2015, 46, 1112–1123. [Google Scholar] [PubMed]
- Institute for Health Metrics and Evaluation (IHME). GBD Compare Data Visualization; IHME, University of Washington: Seattle, WA, USA, 2016. [Google Scholar]
- GBD 2015 Mortality and Causes of Death Collaborators. Global, regional, and national life expectancy, all-cause mortality, and cause-specific mortality for 249 causes of death, 1980–2015: A systematic analysis for the Global Burden of Disease Study 2015. Lancet 2016, 388, 1459–1544. [Google Scholar]
- Huang, Y.; Wu, Y.; Schwebel, D.C.; Zhou, L.; Hu, G. Disparities in under-five child injury mortality between developing and developed countries: 1990–2013. Int. J. Environ. Res. Public Health 2016, 13, 653. [Google Scholar] [CrossRef] [PubMed]
- Dai, D.; Zhang, Y.; Lynch, C.A.; Miller, T.; Shakir, M. Childhood drowning in Georgia: A geographic information system analysis. Appl. Geogr. 2013, 37, 11–22. [Google Scholar] [CrossRef]
- SaberiAnary, S.H.; Sheikhazadi, A.; Ghadyani, M.H. Epidemiology of drowning in Mazandaran province, north of Iran. Am. J. Forensic. Med. Pathol. 2010, 31, 236–242. [Google Scholar] [CrossRef] [PubMed]
- Tyebally, A.; Ang, S.Y. Kids can’t float: Epidemiology of paediatric drowning and near-drowning in Singapore. Singap. Med. J. 2010, 51, 429–433. [Google Scholar]
- Ahlm, K.; Saveman, B.I.; Björnstig, U. Drowning deaths in Sweden with emphasis on the presence of alcohol and drugs—A retrospective study, 1992–2009. BMC Public Health 2013, 13, 216. [Google Scholar] [CrossRef] [PubMed]
- Lin, C.Y.; Wang, Y.F.; Lu, T.H.; Kawach, I. Unintentional drowning mortality, by age and body of water: An analysis of 60 countries. Inj. Prev. 2015, 21, e43–e50. [Google Scholar] [CrossRef] [PubMed]
- Smith, G.S.; The Wet ICE Collaborative Group. International Comparisons of Injury mortality databases: Evaluation of their usefulness for drowning prevention and surveillance. In The International Collaborative Effort on Injury Statistics; DHHS Publication No. (PHS) 96-1252; National Centre for Health Statistics: Hyattsville, MD, USA, 1996; Volume II, pp. 1–29. [Google Scholar]
- World Health Organization. Mortality Database: Cause of Death Query Online. Available online: http://apps.who.int/healthinfo/statistics/mortality/causeofdeath_query/ (accessed on 1 March 2017).
- Murray, C.J.L.; Rajaratnam, J.K.; Marcus, J.; Laakso, T.; Lopez, A.D. What can we conclude from death registration? Improved methods for evaluating completeness. PLoS Med. 2010, 7, e1000262. [Google Scholar]
- World Health Organization. WHO Methods and Data Sources for Country-Level Causes of Death 2000–2015; Global Health Estimates Technical Paper WHO/HIS/IER/GHE/2016.3; World Health Organization: Geneva, Switzerland, 2016. [Google Scholar]
- World Health Organization. WHO Methods and Data Sources for Life Tables 1990–2015; Global Health Estimates Technical Paper WHO/HIS/IER/GHE/2016.2; World Health Organization: Geneva, Switzerland, 2016. [Google Scholar]
- Convention on the Rights of the Child. New York, NY, United Nations, 1989 (A/RES/44/25). Available online: http://www.unhchr.ch/html/menu3/b/k2crc.htm (accessed on 1 March 2017).
- Berk, L.E. Infants, Children, and Adolescents, 5th ed.; Allyn and Bacon Inc.: Boston, MA, USA, 2005. [Google Scholar]
- The World Bank. The Historical Classification by Income. Available online: https://datahelpdesk.worldbank.org/knowledgebase/articles/906519#High_income (accessed on 1 March 2017).
- Ahmad, O.B.; Boschi-Pinto, C.; Lopez, A.D.; Murray, C.J.L.; Lozano, R.; Inoue, M. Age Standardization of Rates: A New WHO Standard, GPE Discussion Paper Series; (GPE Discussion Paper No. 31); World Health Organization: Geneva, Switzerland, 2001. [Google Scholar]
- International Life Saving. Drowning Prevention Strategies: A Framework to Reduce Drowning Deaths in the Aquatic Environment for Nations/Regions Engaged in Lifesaving; International Life Saving Federation: Leuven, Belgium, 2015. [Google Scholar]
- Peden, M.; Oyegbite, K.; Ozanne-Smith, J.; Hyder, A.A.; Branche, C.; Rahman, A.F.; Rivara, F.; Bartolomeos, K. World Report on Child Injury Prevention; World Health Organization: Geneva, Switzerland, 2008. [Google Scholar]
- Quan, L.; Bennett, E.; Branche, C.M. Interventions to prevent drowning. In Handbook of Injury and Violence Prevention; Doll, L.S., Bonzo, S.E., Mercy, J.A., Sleet, D.A., Eds.; Springer: New York, NY, USA, 2007; pp. 81–96. [Google Scholar]
- Meddings, D.; Hyder, A.A.; Ozanne-Smith, J.; Rahman, A. Global Report on Drowning: Preventing a Leading Killer; World Health Organization: Geneva, Switzerland, 2014. [Google Scholar]
- Wallis, B.A.; Watt, K.; Franklin, R.C.; Taylor, M.; Nixon, J.W.; Kimble, R.M. Interventions associated with drowning prevention in children and adolescents: Systematic literature review. Inj. Prev. 2015, 21, 195–204. [Google Scholar] [CrossRef] [PubMed]
- Howland, J.; Hingson, R. Alcohol as a risk factor for drownings: A review of the literature (1950–1985). Accid. Anal. Prev. 1988, 20, 19–25. [Google Scholar] [CrossRef]
- Hyder, A.A.; Borse, N.N.; Blum, L.; Khan, R.; El Arifeen, S.; Baqui, A.H. Childhood drowning in low- and middle-income countries: Urgent need for intervention trials. Paediatr. Child Health 2008, 44, 221–227. [Google Scholar] [CrossRef] [PubMed]
- Meel, B.L. Drowning deaths in Mthatha area of South Africa. Med. Sci. Law 2008, 48, 329–332. [Google Scholar] [CrossRef] [PubMed]
- Sankoh, O.; Byass, P. Cause-specific mortality at INDEPTH Health and Demographic Surveillance System Sites in Africa and Asia: Concluding synthesis. Glob. Health Action 2014, 7, 25590. [Google Scholar] [CrossRef] [PubMed]
- Garenne, M.; Collinson, M.A.; Kabudula, C.W.; Gómez-Olivé, F.X.; Kahn, K.; Tollman, S. Completeness of birth and death registration in a rural area of South Africa: The Agincourt health and demographic surveillance, 1992–2014. Glob. Health Action 2016, 9, 32795. [Google Scholar] [CrossRef] [PubMed]
- Centers for Disease Control and Prevention (CDC). Drowning-United States, 2005–2009. MMWR Morb. Mortal. Wkly. Rep. 2012, 61, 344–347. [Google Scholar]
- Sekii, H.; Ohtsu, T.; Shirasawa, T.; Ochiai, H.; Shimizu, T.; Kokaze, A. Childhood mortality due to unintentional injuries in Japan, 2000–2009. Int. J. Environ. Res. Public Health 2013, 10, 528–540. [Google Scholar] [CrossRef] [PubMed]
- Mizuta, R.; Fujita, H.; Osamura, T.; Kidowaki, T.; Kiyosawa, N. Childhood drownings and near-drownings in Japan. Acta Paediatr. Jpn. 1993, 35, 186–192. [Google Scholar] [CrossRef] [PubMed]
- Grajda, A.; Kułaga, Z.; Gurzkowska, B.; Góźdź, M.; Wojtyło, M.; Litwin, M. Trends in external causes of child and adolescent mortality in Poland, 1999–2012. Int. J. Public Health 2017, 62, 117–126. [Google Scholar] [CrossRef] [PubMed]
- Halik, R.; Poznańska, A.; Seroka, W.; Wojtyniak, B. Accidental drownings in Poland in 2000–2012. Przegl. Epidemiol. 2014, 68, 493–499, 591–594. [Google Scholar] [PubMed]
- Modell, J.H. Prevention of needless deaths from drowning. South. Med. J. 2010, 103, 650–653. [Google Scholar] [CrossRef] [PubMed]


| Country | 2000 | 2013 | Percent Change in Rate | ||
|---|---|---|---|---|---|
| Deaths | Mortality Rate | Deaths | Mortality Rate | ||
| Low- and middle-income countries | |||||
| Argentina | 320 | 2.19 | 184 | 1.19 | −46 ** |
| Brazil | 2657 | 3.59 | 1740 | 2.57 | −28 ** |
| Colombia | 587 | 3.25 | 390 | 2.31 | −29 ** |
| Cuba | 100 | 3.01 | 62 | 2.25 | −25 |
| Ecuador | 165 | 2.69 | 153 | 2.33 | −13 |
| Egypt | 958 | 3.89 | 850 | 2.93 | −25 ** |
| El Salvador | 102 | 3.40 | 75 | 2.34 | −31 |
| Philippines | 1893 | 4.88 | 1684 | 4.03 | −17 ** |
| Kyrgyzstan | 196 | 8.10 | 98 | 3.43 | −58 ** |
| Mexico | 1137 | 2.35 | 711 | 1.42 | −40 ** |
| Romania | 327 | 5.12 | 99 | 2.28 | −55 ** |
| South Africa | 74 | 0.33 | 762 | 3.38 | 924 ** |
| Thailand | 1606 | 7.60 | 1066 | 6.14 | −19 ** |
| Venezuela | 286 | 2.53 | 193 | 1.58 | −38 ** |
| High-income countries | |||||
| Chile | 136 | 2.43 | 58 | 1.08 | −56 ** |
| France | 135 | 0.81 | 81 | 0.47 | −42 ** |
| Germany | 105 | 0.58 | 54 | 0.34 | −41 ** |
| Japan | 262 | 0.95 | 127 | 0.53 | −44 ** |
| Poland | 163 | 1.41 | 87 | 1.04 | −26 * |
| Republic of Korea | 447 | 3.15 | 73 | 0.62 | −80 ** |
| United States | 1314 | 1.54 | 866 | 0.98 | −36 ** |
© 2017 by the authors. Licensee MDPI, Basel, Switzerland. This article is an open access article distributed under the terms and conditions of the Creative Commons Attribution (CC BY) license (http://creativecommons.org/licenses/by/4.0/).
Share and Cite
Wu, Y.; Huang, Y.; Schwebel, D.C.; Hu, G. Unintentional Child and Adolescent Drowning Mortality from 2000 to 2013 in 21 Countries: Analysis of the WHO Mortality Database. Int. J. Environ. Res. Public Health 2017, 14, 875. https://doi.org/10.3390/ijerph14080875
Wu Y, Huang Y, Schwebel DC, Hu G. Unintentional Child and Adolescent Drowning Mortality from 2000 to 2013 in 21 Countries: Analysis of the WHO Mortality Database. International Journal of Environmental Research and Public Health. 2017; 14(8):875. https://doi.org/10.3390/ijerph14080875
Chicago/Turabian StyleWu, Yue, Yun Huang, David C. Schwebel, and Guoqing Hu. 2017. "Unintentional Child and Adolescent Drowning Mortality from 2000 to 2013 in 21 Countries: Analysis of the WHO Mortality Database" International Journal of Environmental Research and Public Health 14, no. 8: 875. https://doi.org/10.3390/ijerph14080875
APA StyleWu, Y., Huang, Y., Schwebel, D. C., & Hu, G. (2017). Unintentional Child and Adolescent Drowning Mortality from 2000 to 2013 in 21 Countries: Analysis of the WHO Mortality Database. International Journal of Environmental Research and Public Health, 14(8), 875. https://doi.org/10.3390/ijerph14080875