Effects of Land Use/Cover Changes and Urban Forest Configuration on Urban Heat Islands in a Loess Hilly Region: Case Study Based on Yan’an City, China


Abstract
:1. Introduction
1.1. Related Research
1.2. Study Objectives
2. Materials and Methods
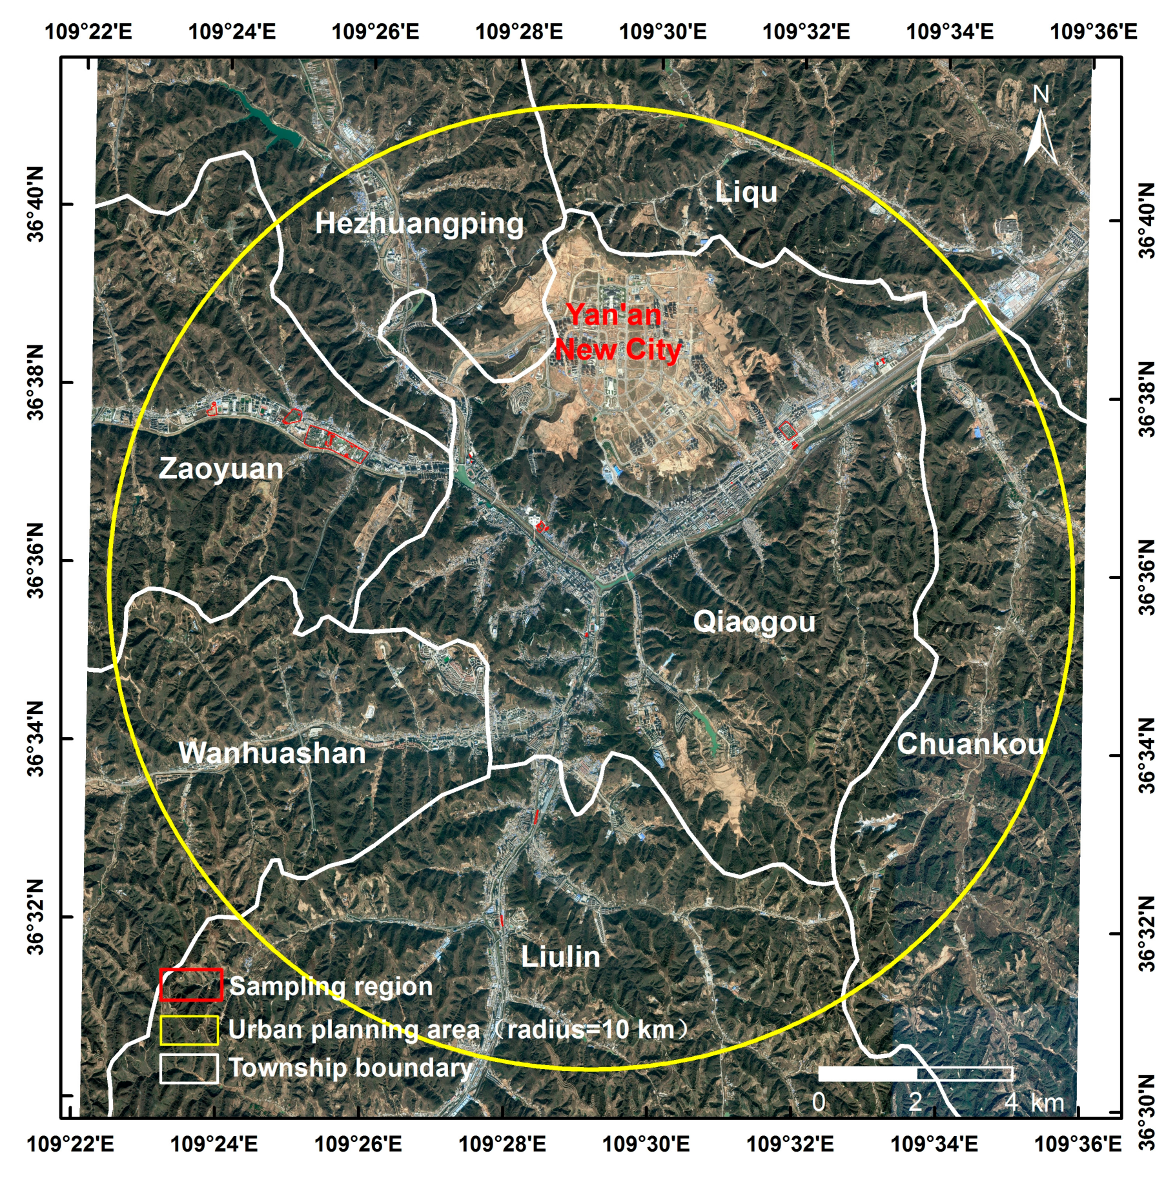
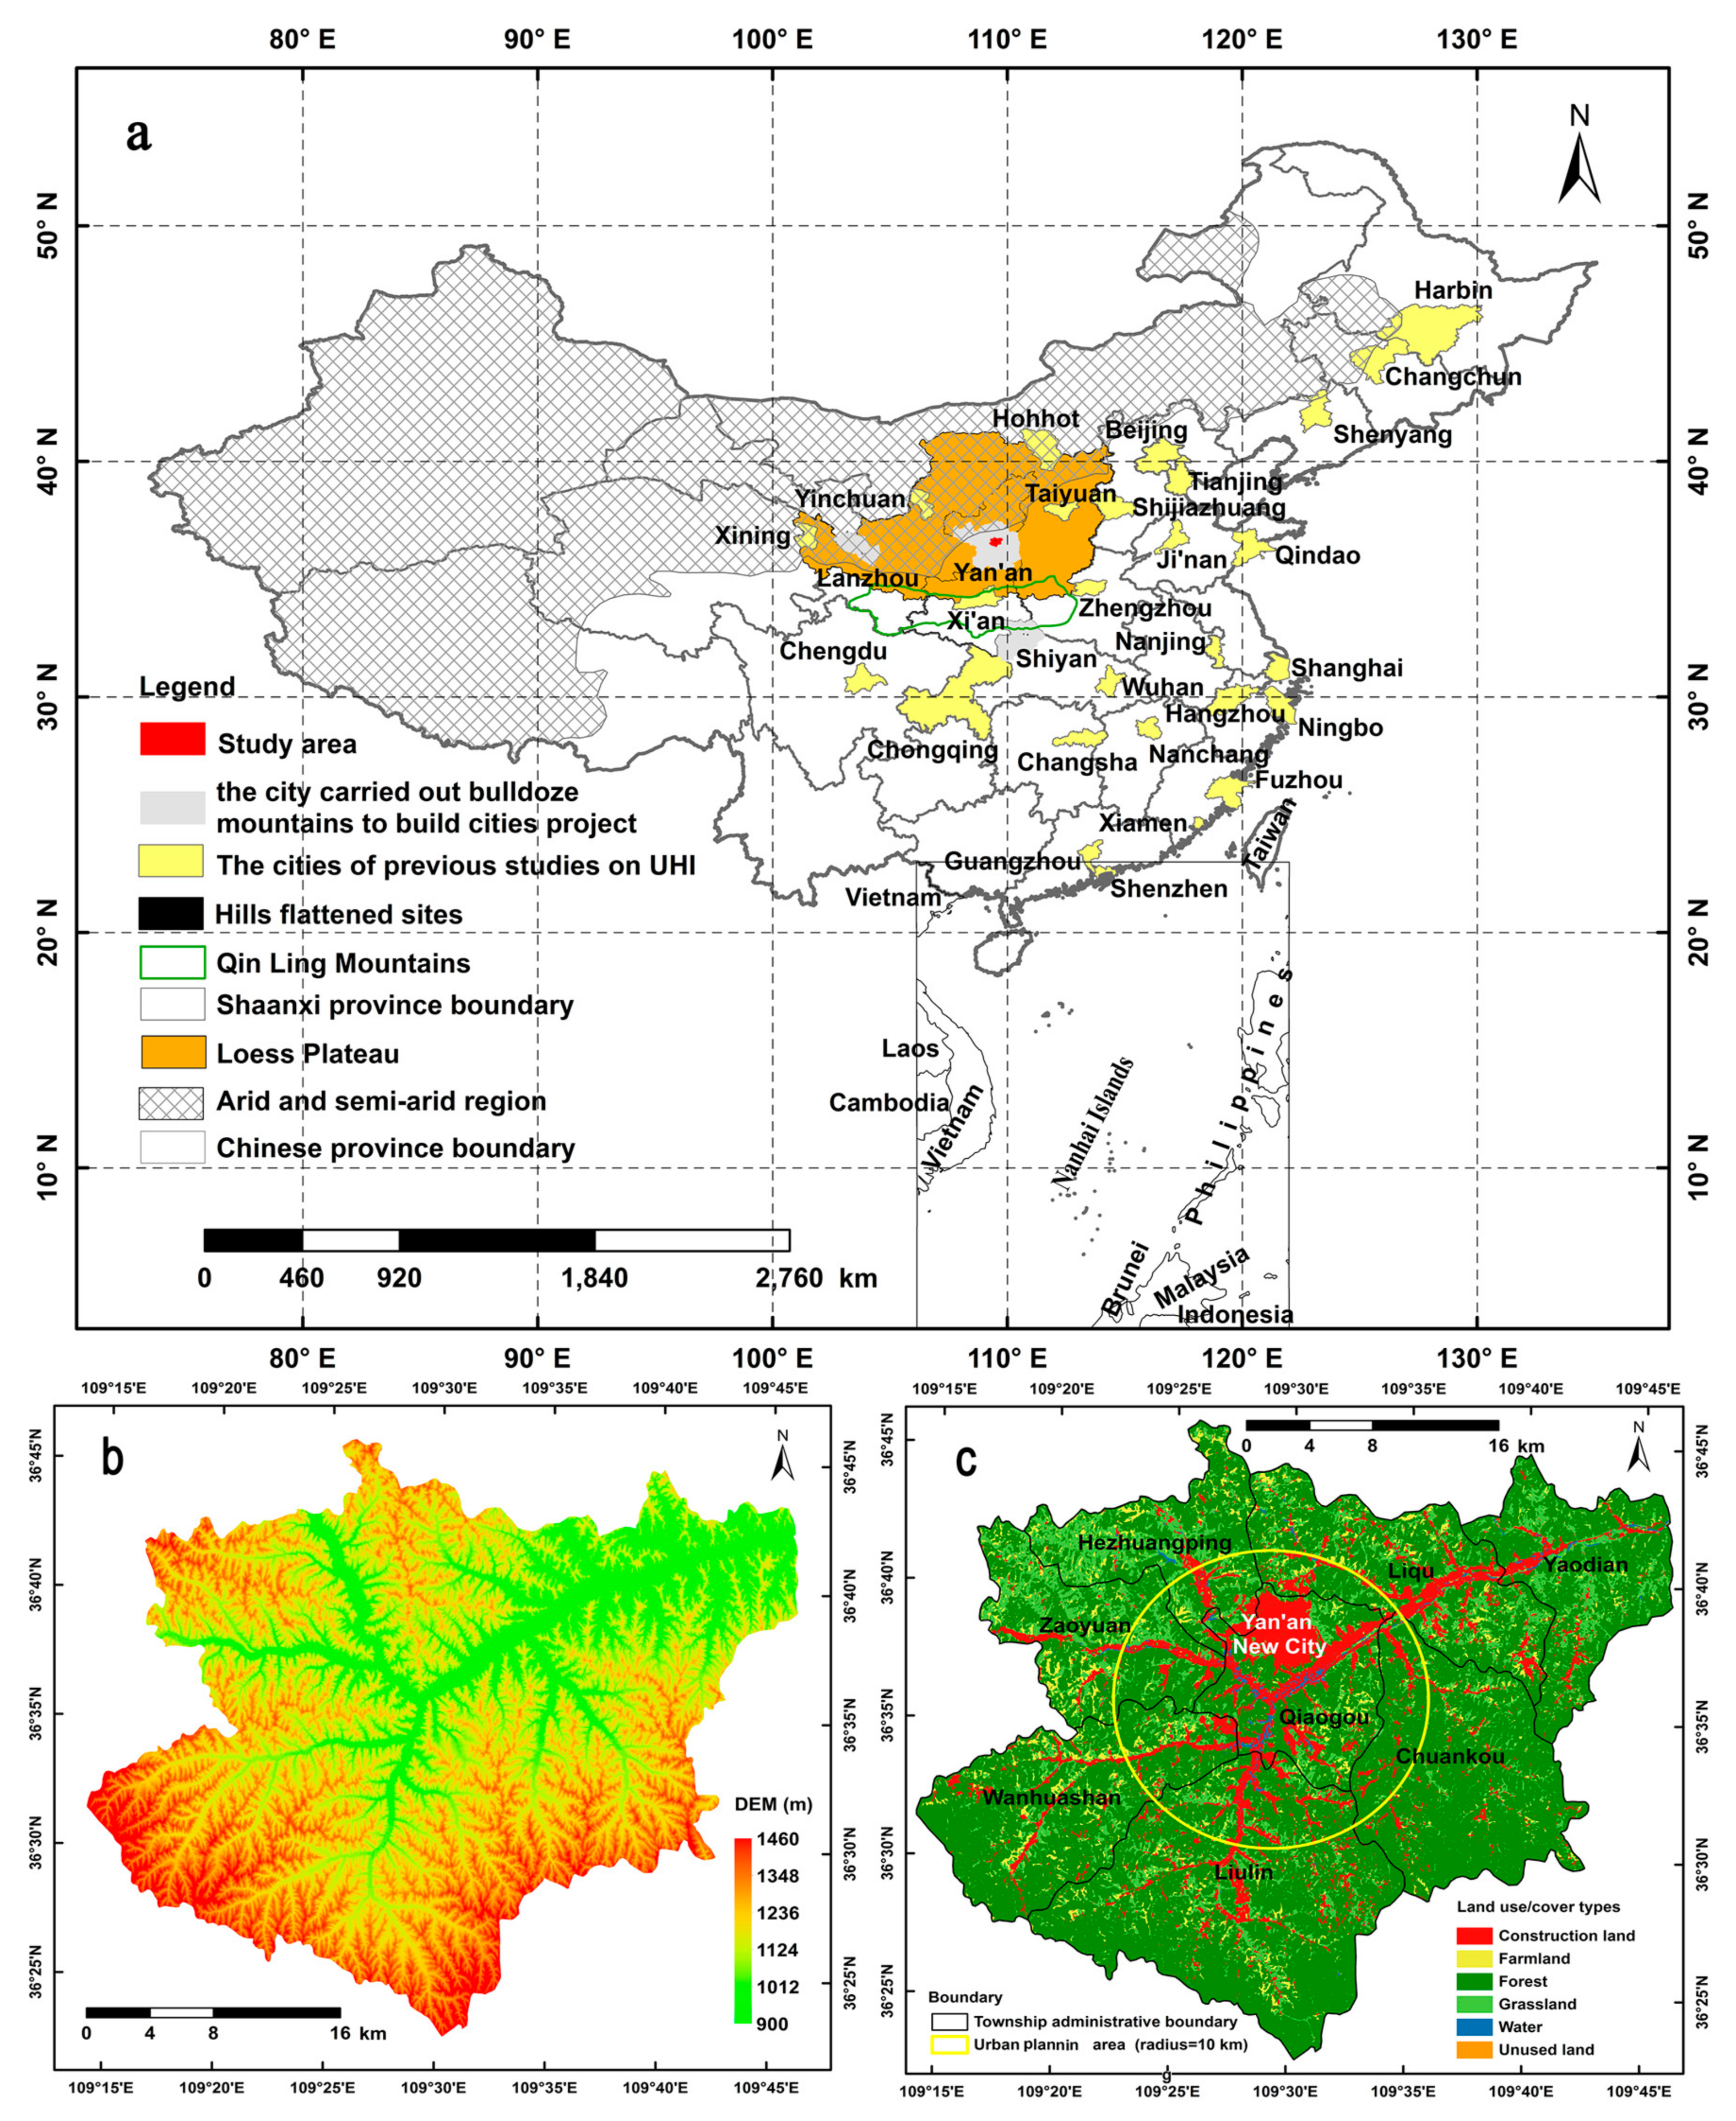
2.1. Study Area
2.2. Data Sources
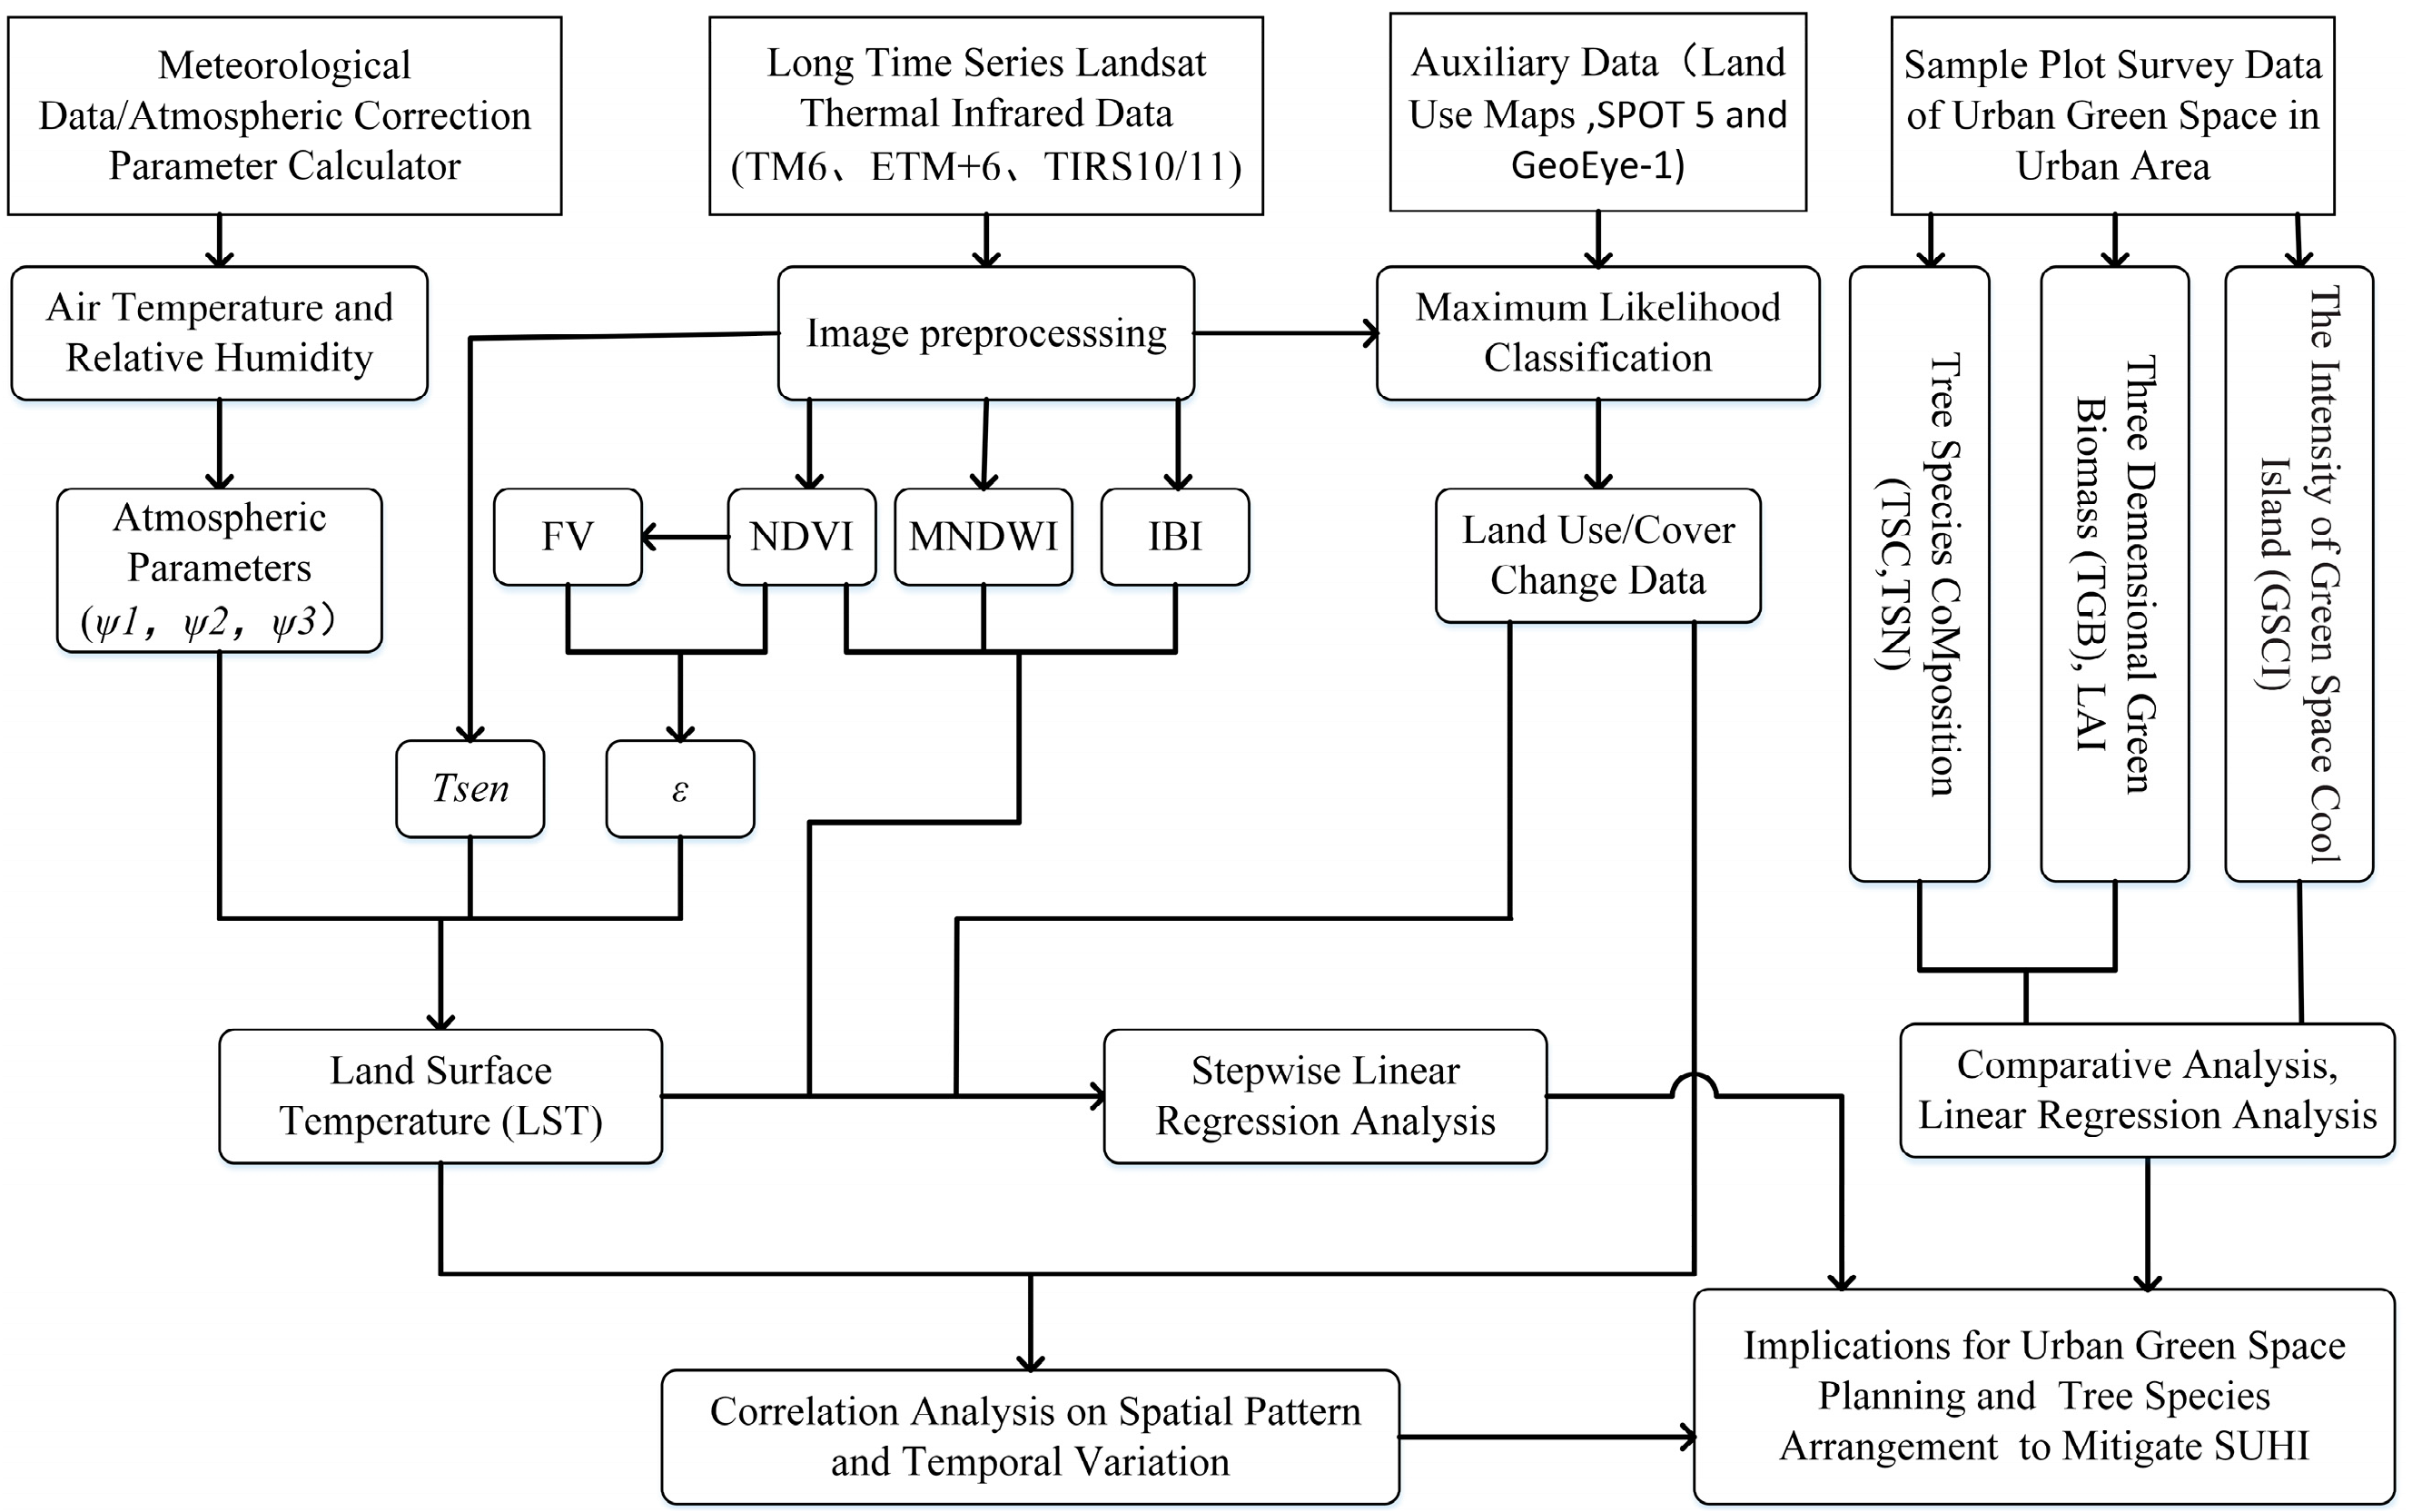
2.3. Methods
2.3.1. Technical Details
2.3.2. Derivation of the Normalized Difference Vegetation Index (NDVI), Index-Based Built-Up Index (IBI), and Modified Normalized Difference Water Index (MNDWI), and LULC Classification
2.3.3. Retrieval of LST and Measurement of Relative SUHIs
LST Inversion
Measurement of the Relative SUHIs
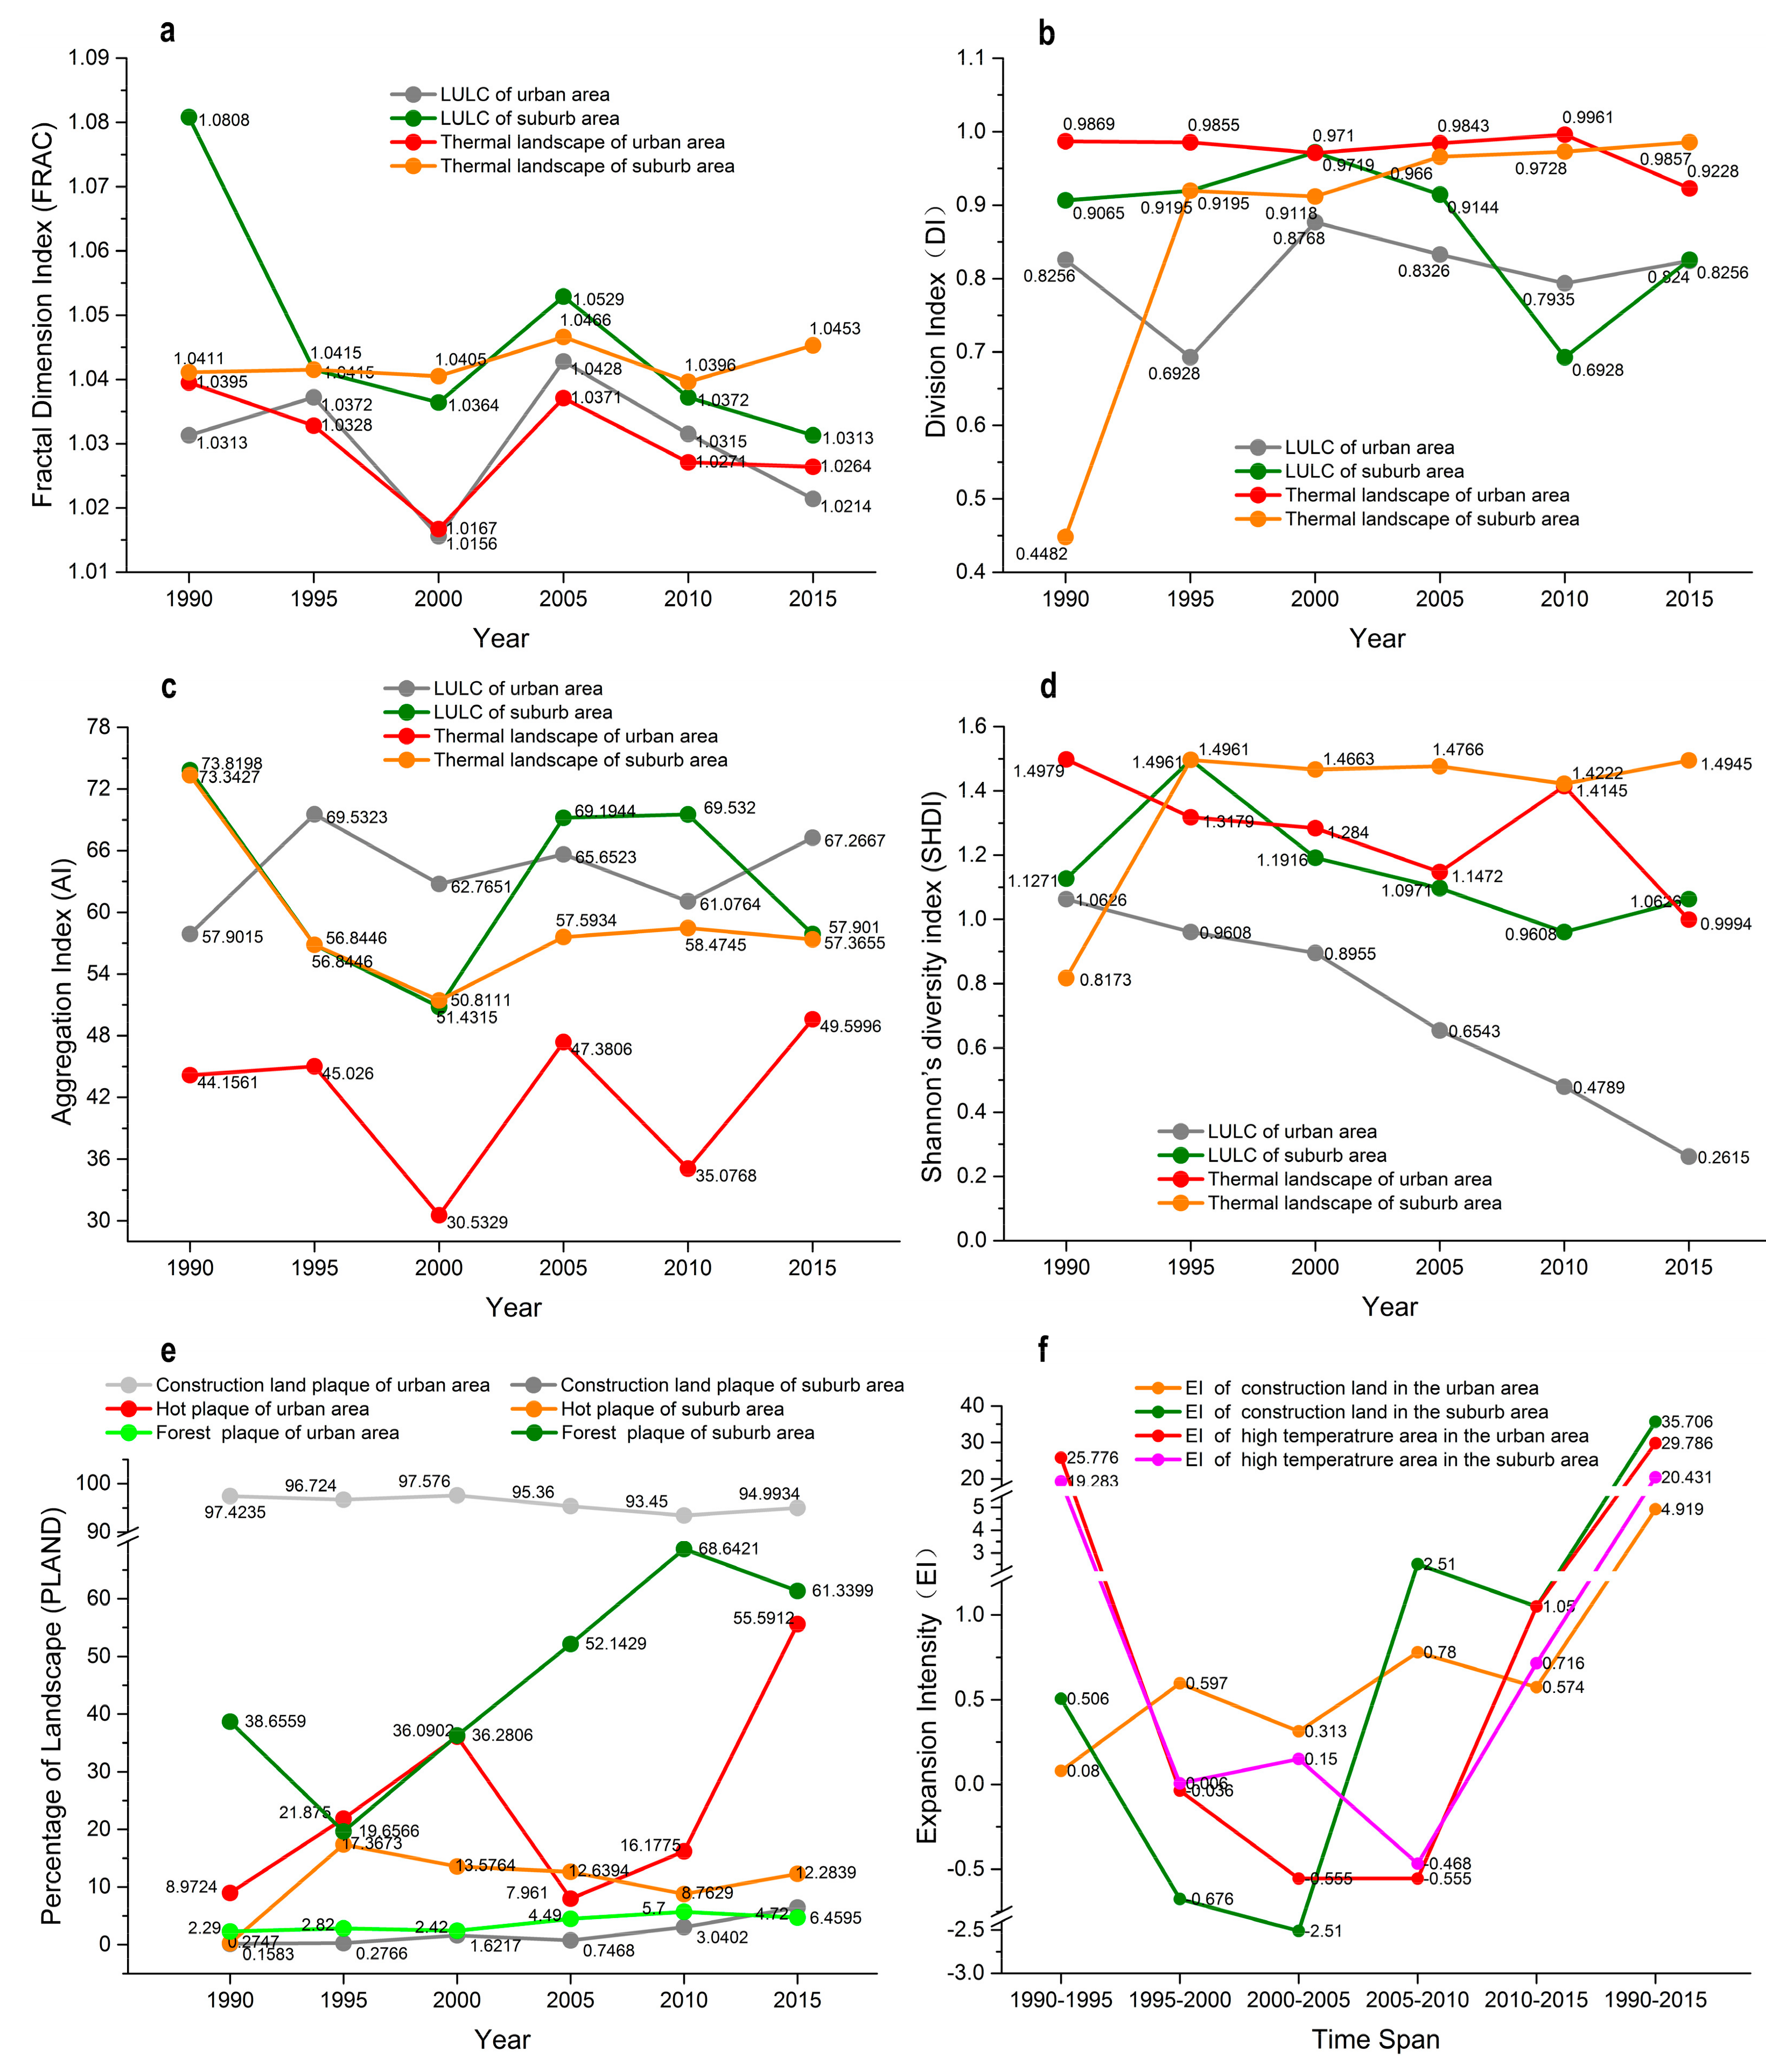
2.3.4. Landscape Pattern Analysis
2.3.5. Surveying and Measurement of SUHI-Related Indicators at the Plot Level
Size and Shape of UGSs
Surveys of UGS Forest Structure and Temperature Measurements
2.3.6. Statistical Analysis
3. Results
3.1. Relationship between UHIs and LUCC at the Regional Level
3.1.1. Characteristics of the Mean Annual and Monthly Air Temperature, and Summer Heat Islands
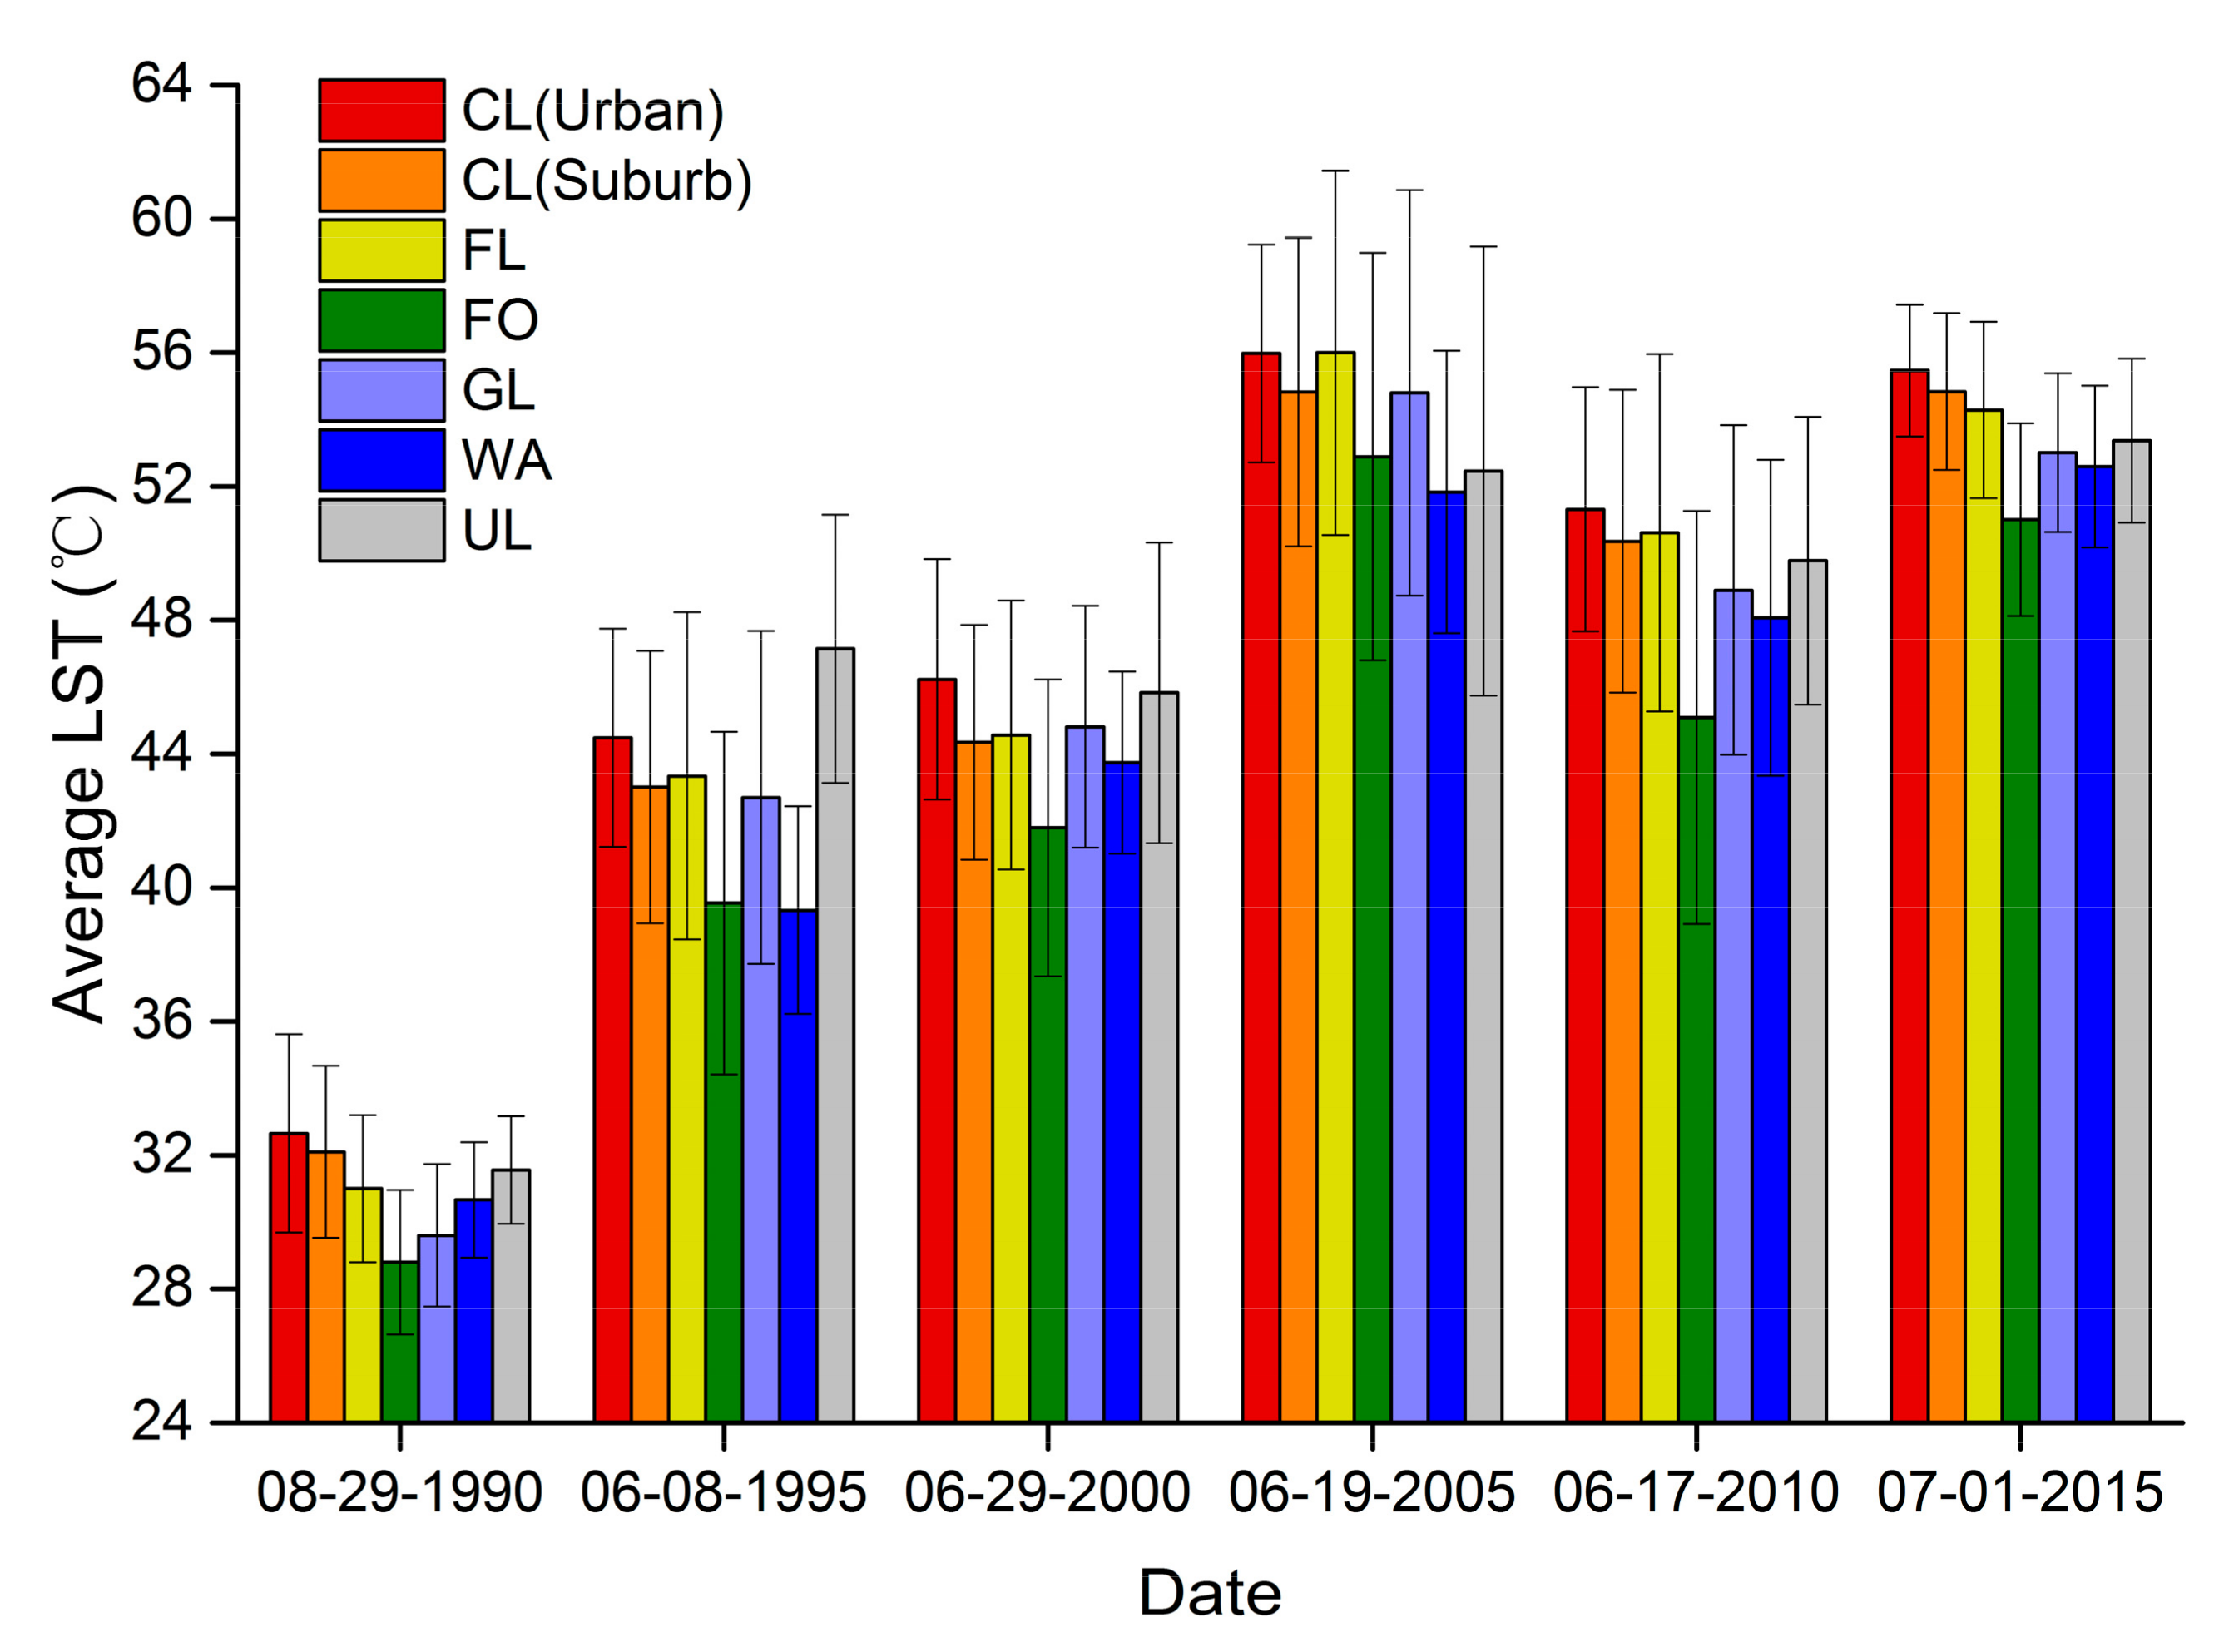
3.1.2. Variations in the LST among Different Land Use Types
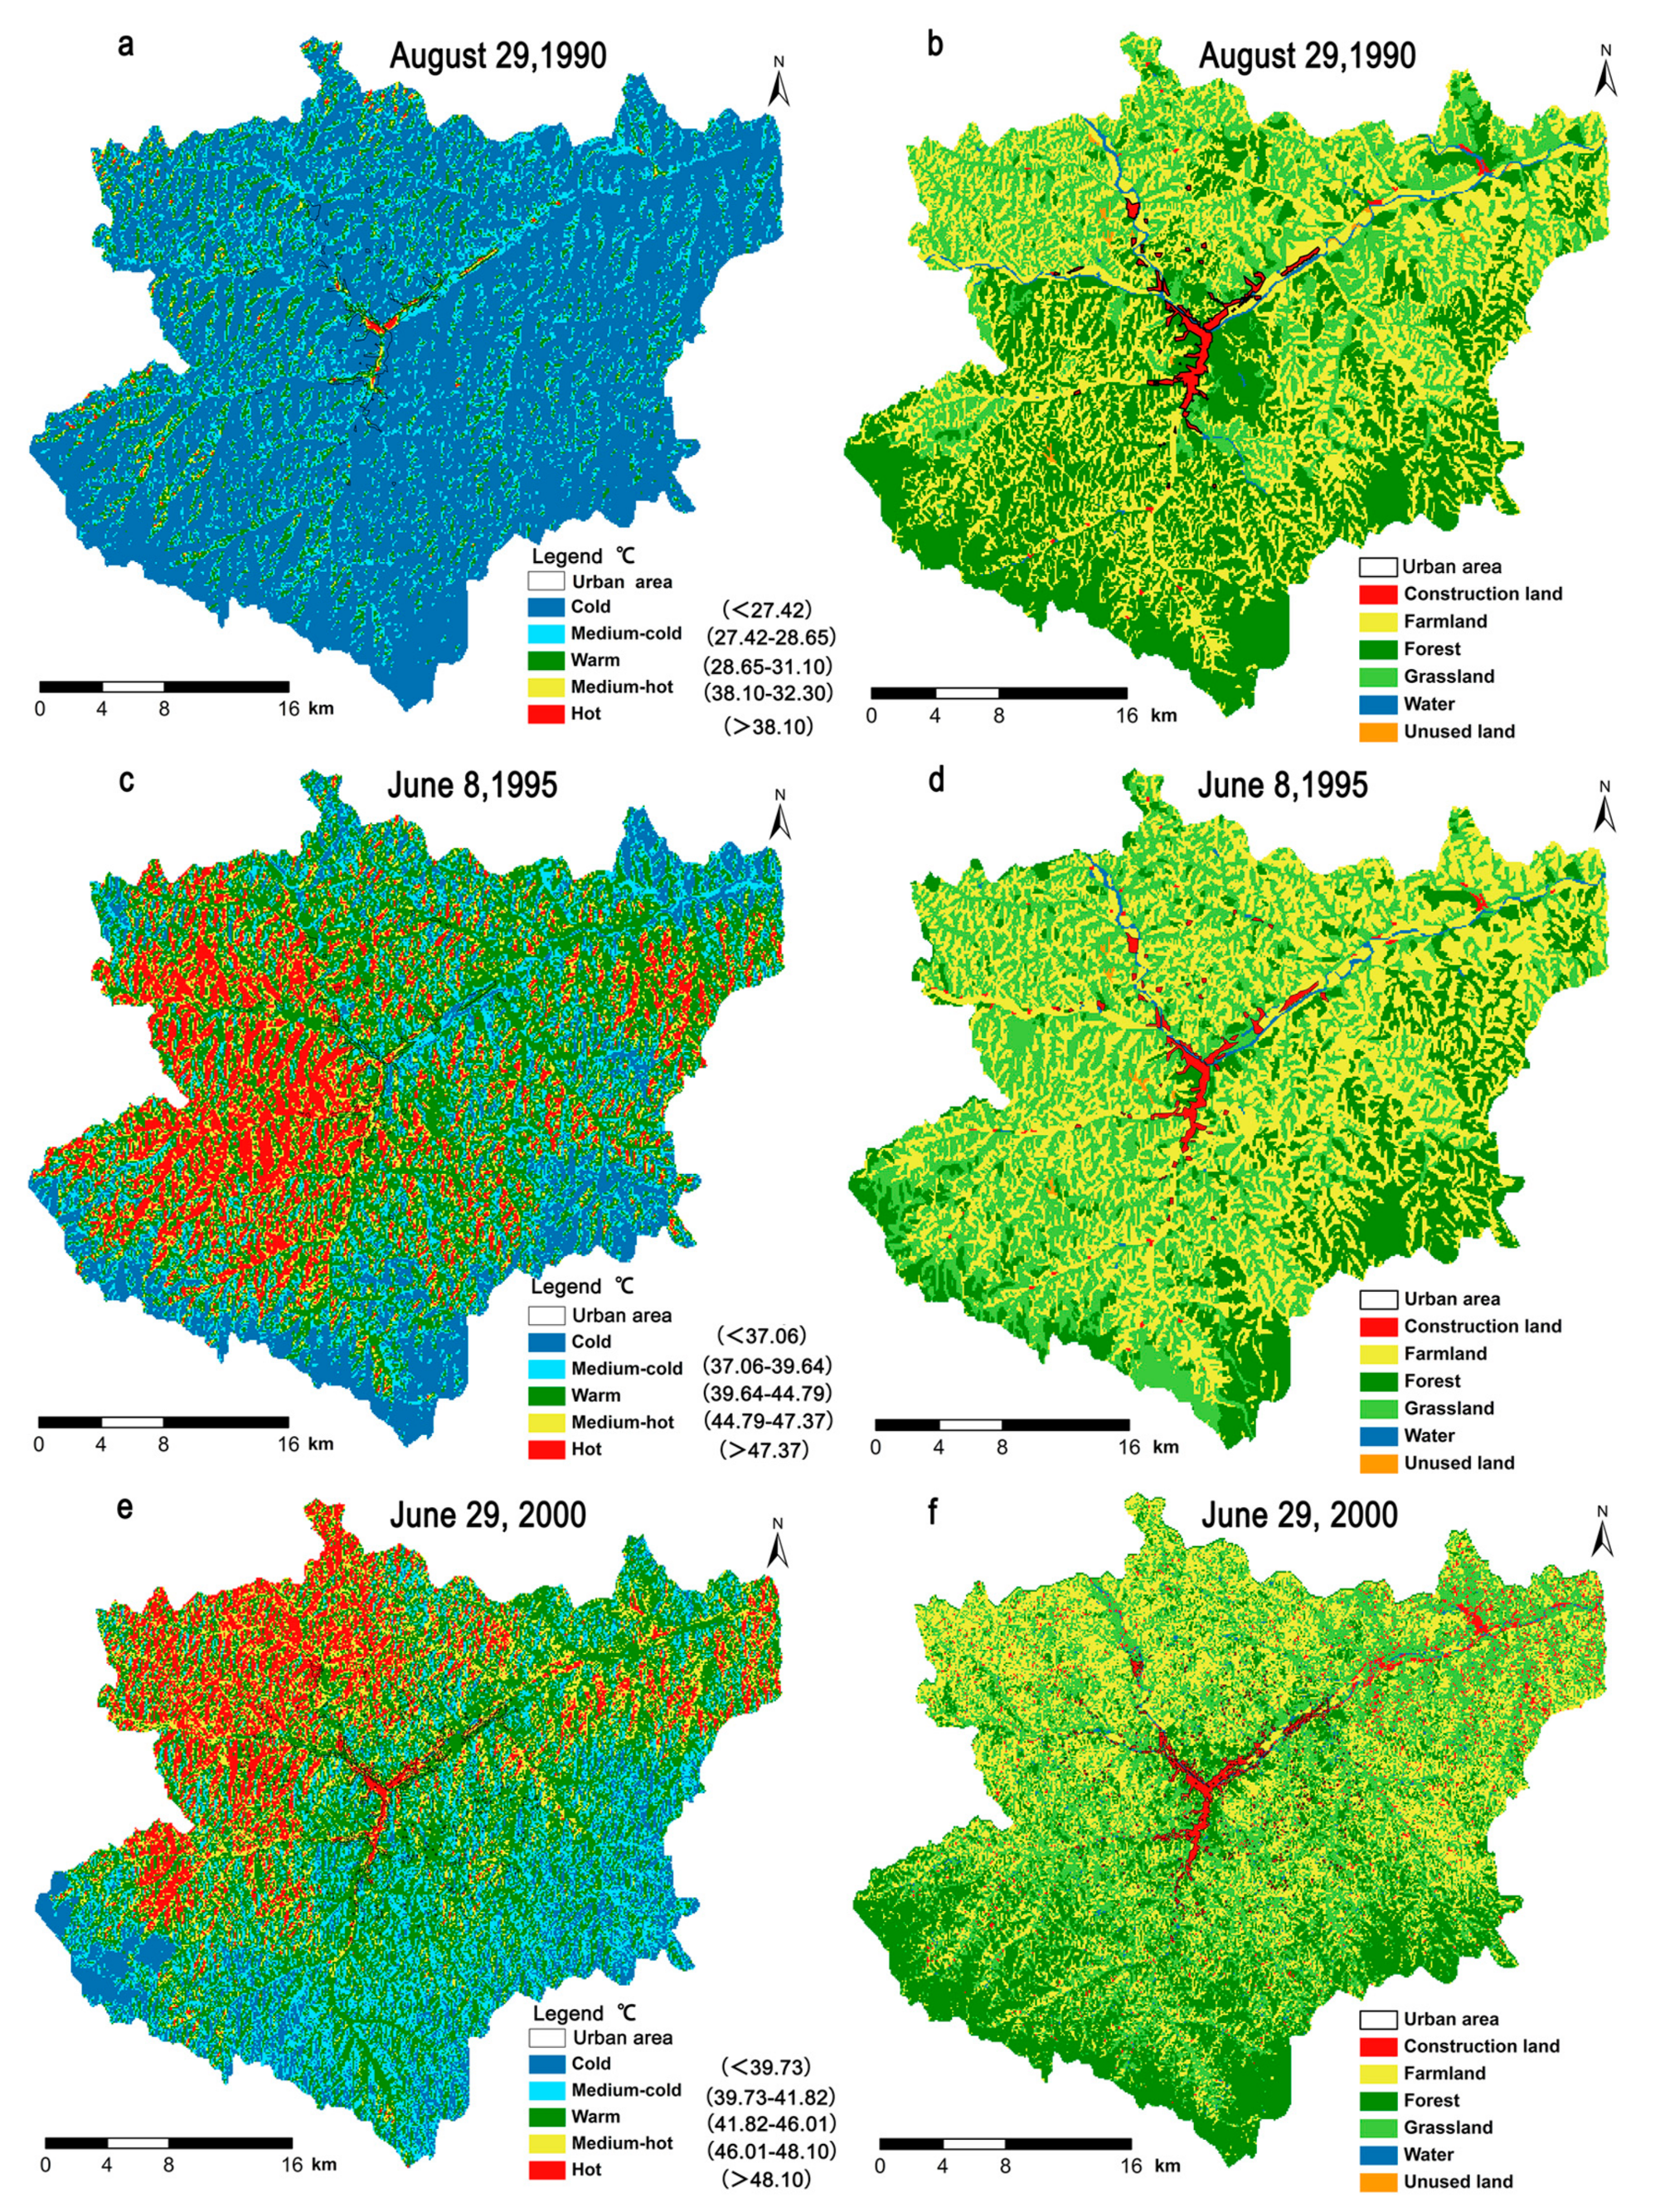
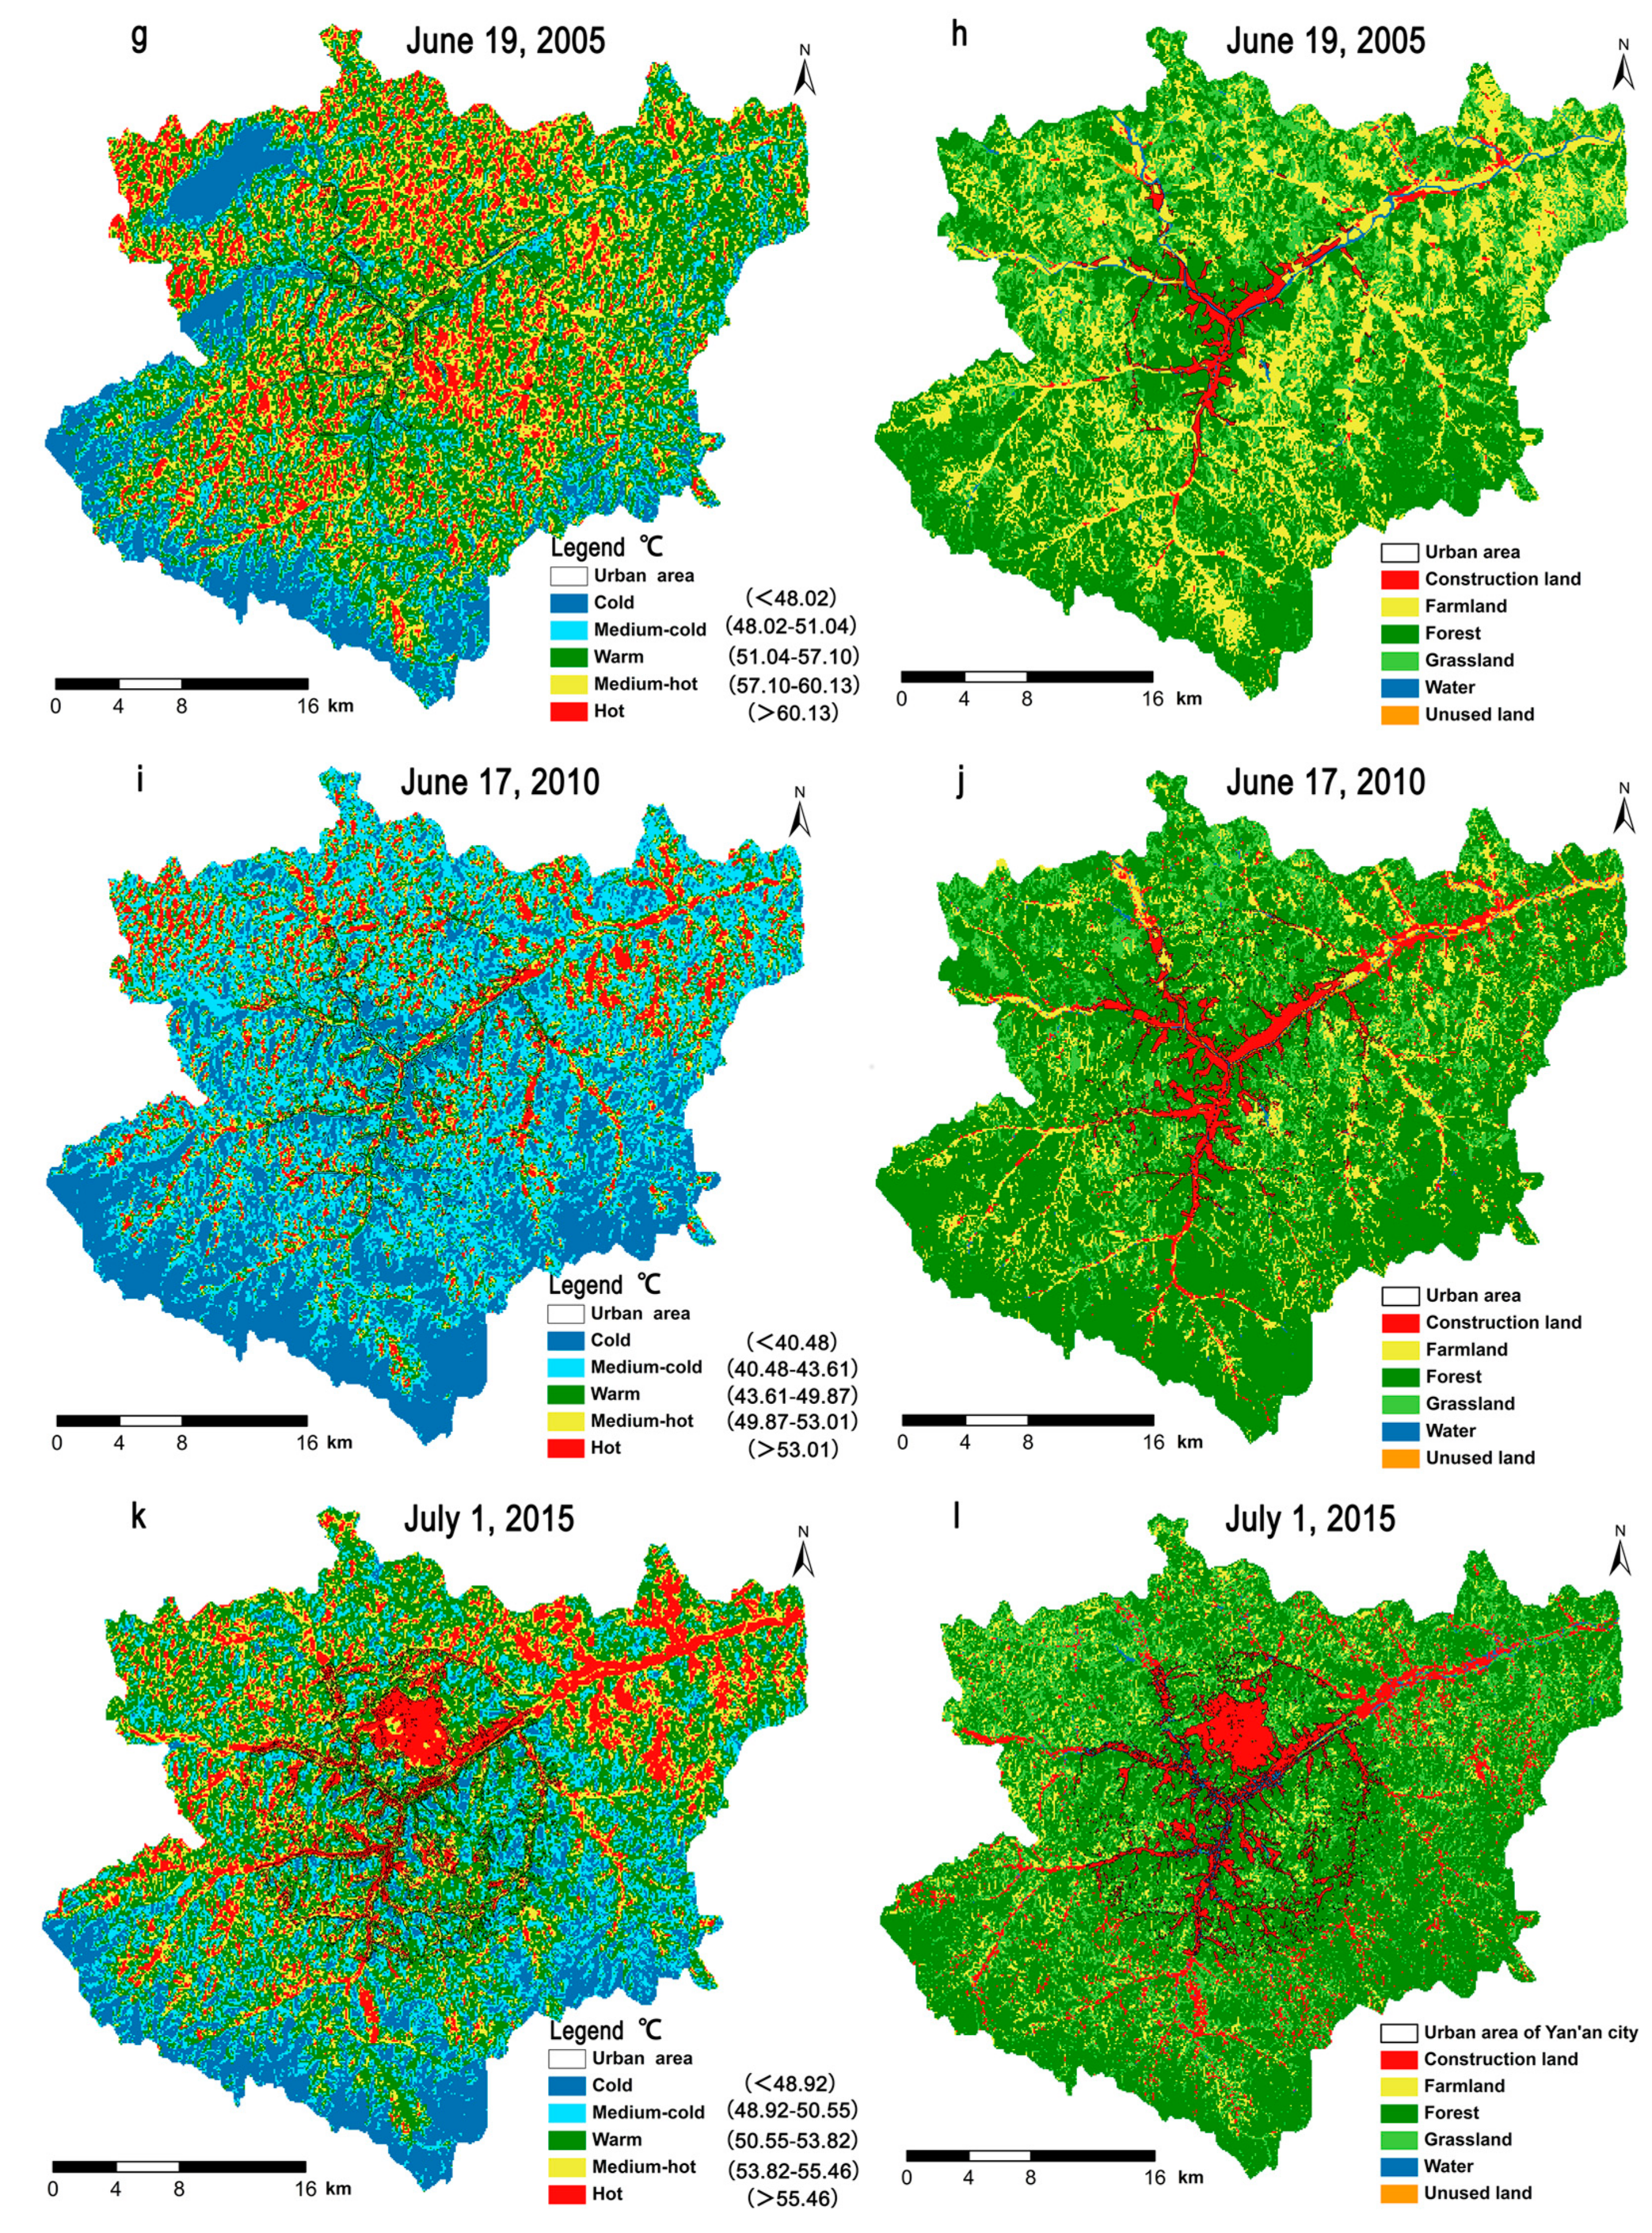
3.1.3. Relationships between the Spatial Distributions of SUHI and LULC
3.1.4. Relationship between SUHI and LULC
3.2. Effects of UGS Size, Shape, and Tree-Layer Structures on GSCI
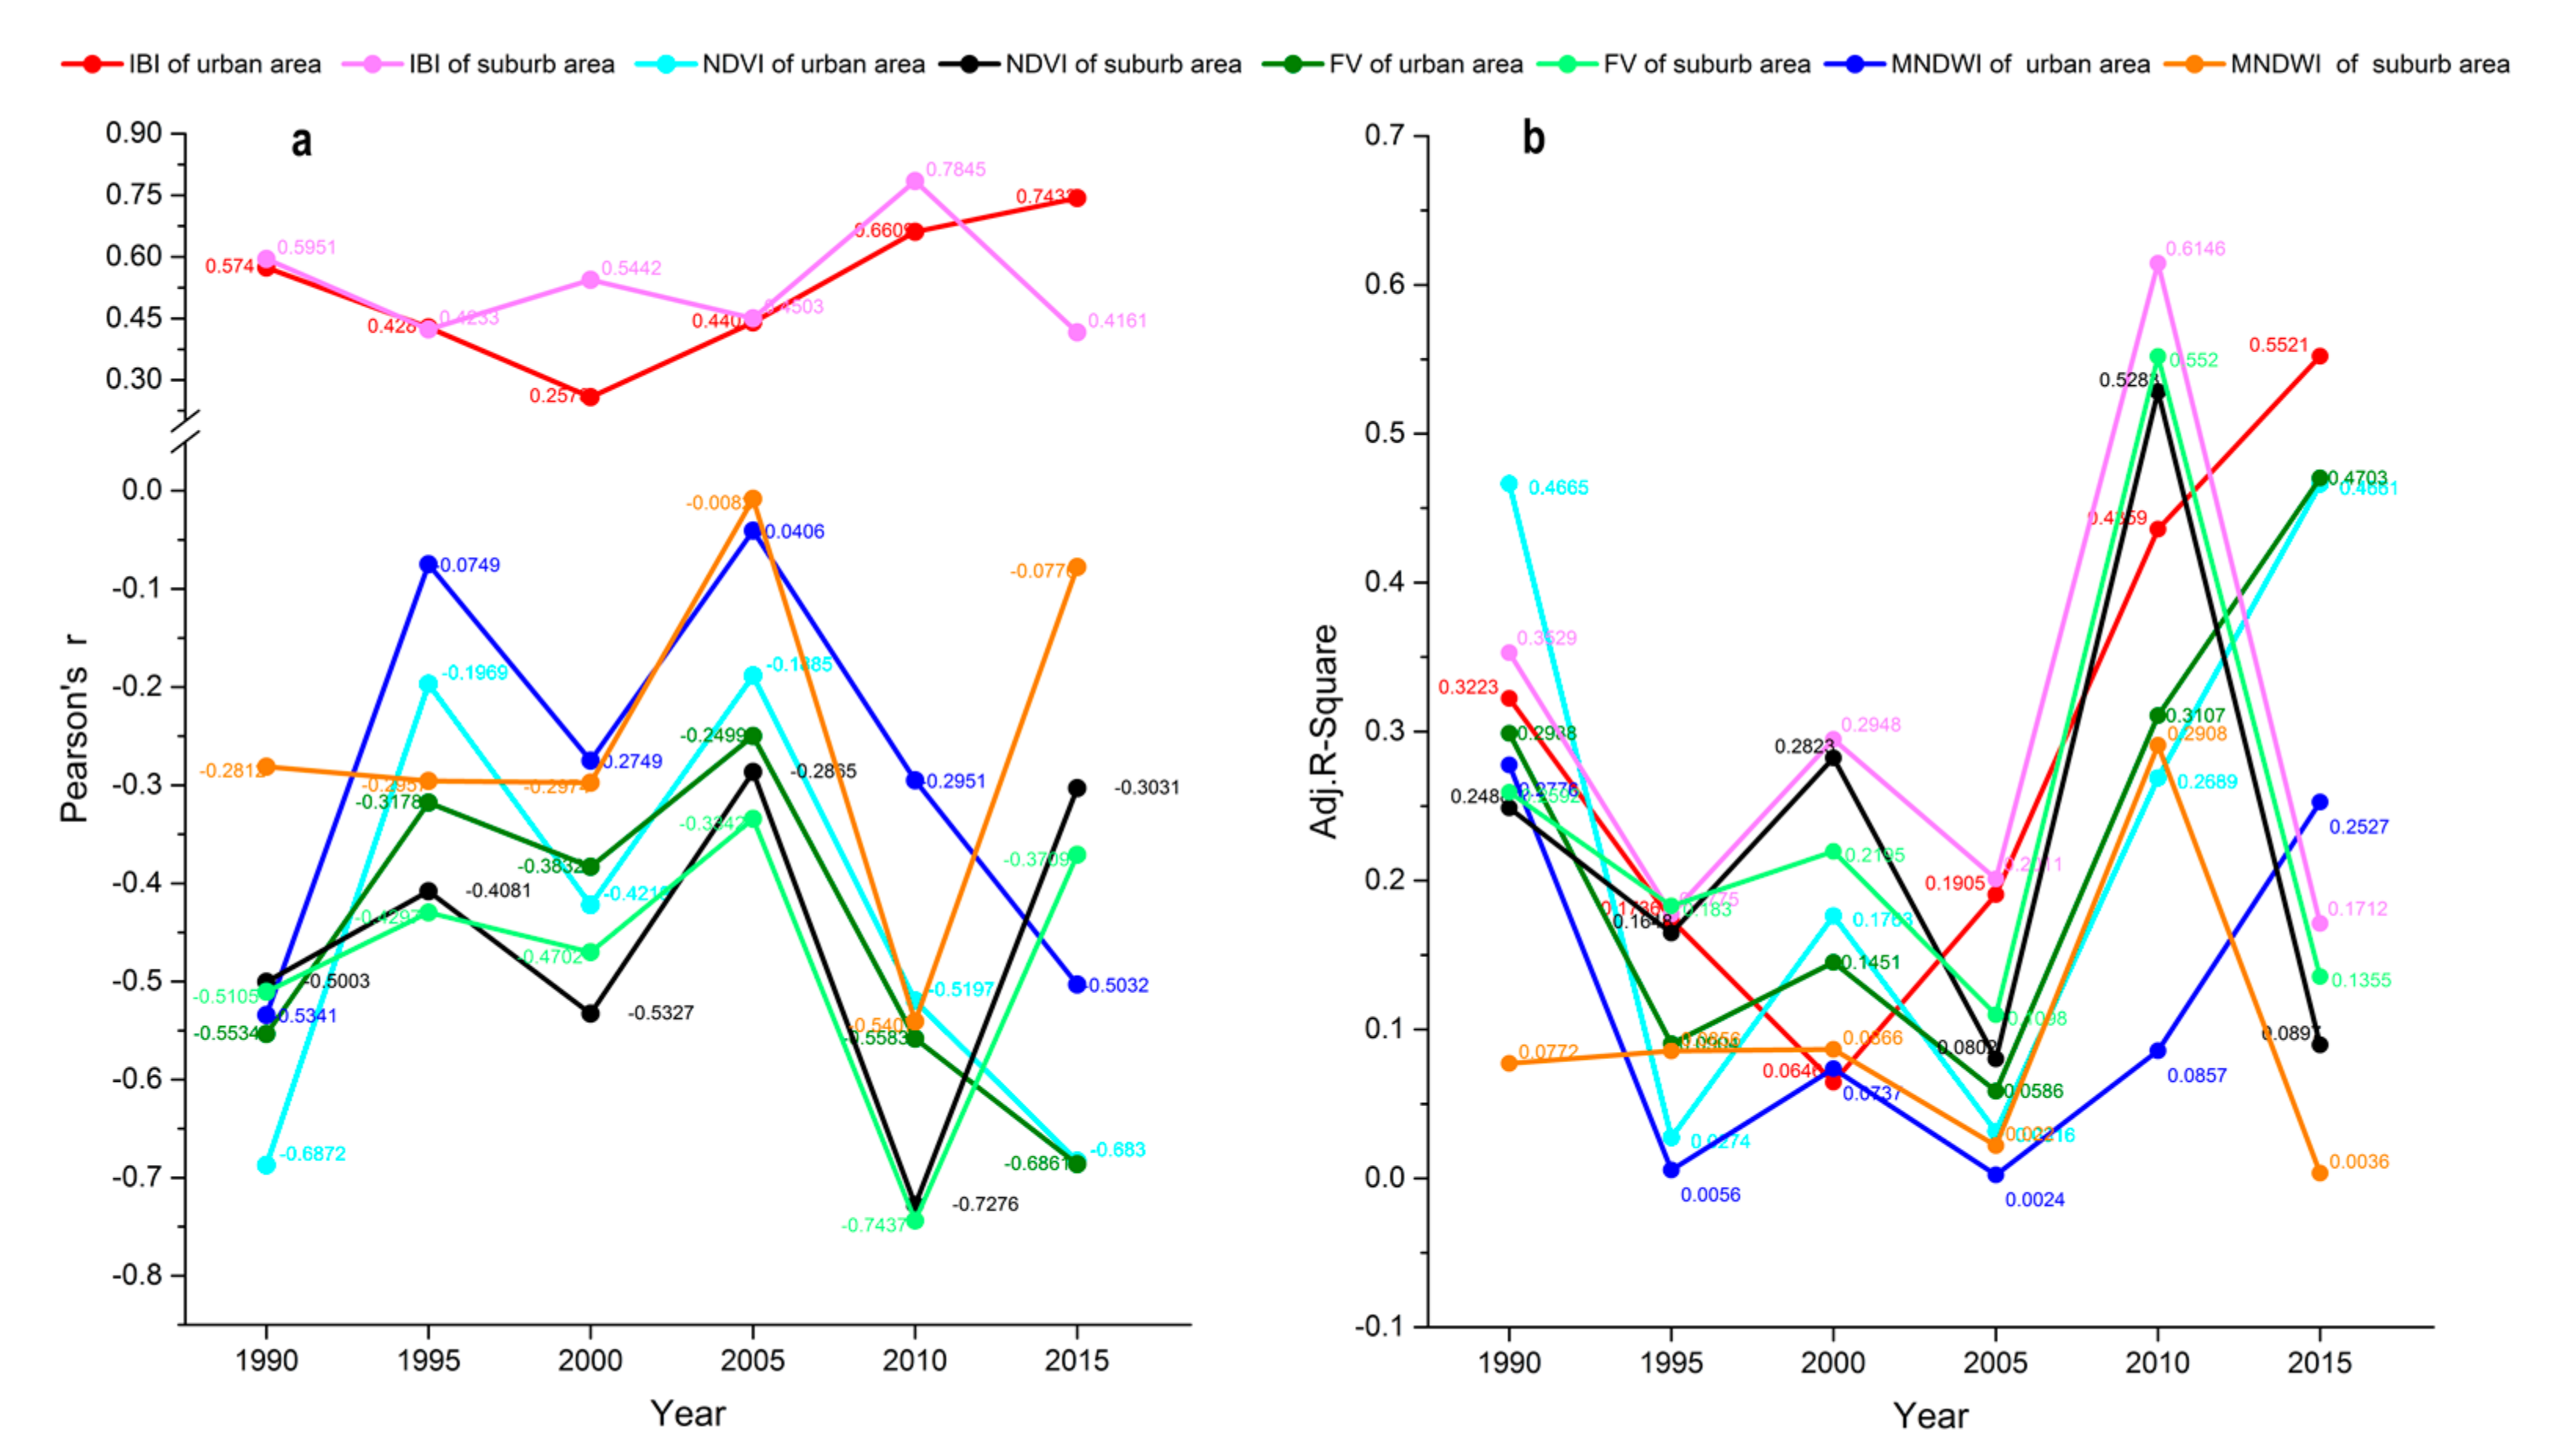
3.3. Temporal-Dynamic Linear Correlation between the Remote Sensing Ground Indexes and LST
4. Discussion
4.1. Main Reasons for the Changes in Vegetation and LST
4.2. Correlations between Different Land Surface Indicators and LST
4.3. Spatial Characteristics of LULC and Variations in Vegetation vs. LST Along the Urban-Rural Gradient
4.4. Major Factors That Influenced the GSCI Intensity
5. Conclusions
Supplementary Materials:
Acknowledgments
Author Contributions
Conflicts of Interest
References
- Cohen, B. Urban growth in developing countries: A review of current trends and a caution regarding existing forecasts. World Dev. 2004, 32, 23–51. [Google Scholar] [CrossRef]
- Angel, S.; Parent, J.; Civco, D.L.; Blei, A.; Potere, D. The dimensions of global urban expansion: Estimates and projections for all countries, 2000–2050. Prog. Plan. 2011, 75, 53–107. [Google Scholar] [CrossRef]
- Li, W.F.; Bai, Y.; Chen, Q.W.; He, K.T.; Ji, X.H.; Han, C.M. Discrepant impacts of land use and land cover on urban heat islands: A case study of Shanghai, China. Ecol. Indic. 2014, 47, 171–178. [Google Scholar] [CrossRef]
- Chen, B.; Chen, G.Q.; Yang, Z.F.; Jiang, M.M. Ecological footprint accounting for energy and resource in China. Energy Policy 2007, 35, 1599–1609. [Google Scholar] [CrossRef]
- Zipper, S.C.; Schatz, J.; Singh, A.; Kucharik, C.J.; Townsend, P.A.; Loheide, S.P. Urban heat island impacts on plant phenology: Intra-urban variability and response to land cover. Environ. Res. Lett. 2016, 11, 054023. [Google Scholar] [CrossRef]
- Howard, L. Climate of London Deduced from Metrological Observations, 3rd ed.; Harvey and Dorton Press: London, UK, 1833. [Google Scholar]
- Oke, T.R. City size and the urban heat island. Atmos. Environ. 1973, 7, 769–779. [Google Scholar] [CrossRef]
- Zhou, D.; Zhang, L.; Hao, L.; Sun, G.; Liu, Y.; Zhu, C. Spatiotemporal trends of urban heat island effect along the urban development intensity gradient in China. Sci. Total Environ. 2016, 544, 617–626. [Google Scholar] [CrossRef] [PubMed]
- Oke, T.R. The energetic basis of the urban heat island. Q. J. R. Meteorol. Soc. 1982, 108, 1–24. [Google Scholar] [CrossRef]
- Taha, H. Urban climates and heat islands: Albedo, evapotranspiration, and anthropogenic heat. Energy Build. 1997, 25, 4. [Google Scholar] [CrossRef]
- Huang, Q.; Lu, Y. The effect of urban heat island on climate warming in the Yangtze River Delta Urban Agglomeration in China. Int. J. Environ. Res. Public Health 2015, 12, 8773–8789. [Google Scholar] [CrossRef] [PubMed]
- Krüger, E.L. Urban heat island and indoor comfort effects in social housing dwellings. Landsc. Urban Plan. 2015, 134, 147–156. [Google Scholar] [CrossRef]
- Santamouris, M.; Cartalis, C.; Synnefa, A.; Kolokotsa, D. On the impact of urban heat island and global warming on the power demand and electricity consumption of buildings—A review. Energy Build. 2015, 98, 119–125. [Google Scholar] [CrossRef]
- Azevedo, J.A.; Chapman, L.; Muller, C.L. Urban heat and residential electricity consumption: A preliminary study. Appl. Geogr. 2016, 70, 59–67. [Google Scholar] [CrossRef]
- Lowe, S.A. An energy and mortality impact assessment of the urban heat island in the US. Environ. Impact Asses. 2016, 56, 139–144. [Google Scholar] [CrossRef]
- Crutzen, P. New Directions: The growing urban heat and pollution “island” effect—Impact on chemistry and climate. Atmos. Environ. 2004, 38, 3539–3540. [Google Scholar] [CrossRef]
- Rohinton, E.; Eduardo, K. Urban heat island and its impact on climate change resilience in a shrinking city: The case of Glasgow, UK. Build. Environ. 2012, 53, 137–149. [Google Scholar]
- Plocoste, T.; Koaly, S.J.; Molinié, J.; Petit, R.H. Evidence of the effect of an urban heat island on air quality near a landfill. Urban Clim. 2014, 10, 745–757. [Google Scholar] [CrossRef]
- Mirzaei, P.A.; Haghighat, F. A procedure to quantify the impact of mitigation techniques on the urban ventilation. Build. Environ. 2012, 47, 410–420. [Google Scholar] [CrossRef]
- Voogt, J.A.; Oke, T.R. Thermal remote sensing of urban climates. Remote Sens. Environ. 2003, 86, 370–384. [Google Scholar] [CrossRef]
- Zhan, W.F.; Ju, W.M.; Hai, S.P.; Ferguson, G.; Quan, J.L.; Tang, C.S.; Guo, Z.; Kong, F.H. Satellite-derived subsurface urban heat island. Environ. Sci. Technol. 2014, 48, 12134–12140. [Google Scholar] [CrossRef] [PubMed]
- Roth, M.; Oke, T.R.; Emery, W.J. Satellite-derived urban heat islands from three coastal cities and the utilization of such data in urban climatology. Int. J. Remote Sens. 1989, 10, 1699–1720. [Google Scholar] [CrossRef]
- Schwarz, N.; Lautenbach, S.; Seppelt, R. Exploring indicators for quantifying surface urban heat islands of European cities with MODIS land surface temperatures. Remote Sens. Environ. 2011, 115, 3175–3186. [Google Scholar] [CrossRef]
- Ren, Z.B.; He, X.Y.; Zheng, H.F.; Zhang, D.; Yu, X.Y.; Shen, G.Q.; Guo, R.C. Estimation of the relationship between urban park characteristics and park cool island intensity by remote sensing data and field measurement. Forests 2013, 4, 868–886. [Google Scholar] [CrossRef]
- Li, X.; Zhou, W.; Ouyang, Z. Relationship between land surface temperature and spatial pattern of greenspace: What are the effects of spatial resolution? Landsc. Urban Plan. 2013, 114, 1–8. [Google Scholar] [CrossRef]
- Streutker, D.R. Satellite-measured growth of the urban heat island of Houston, Texas. Remote Sens. Environ. 2003, 85, 282–289. [Google Scholar] [CrossRef]
- Prata, A.J. Land surface temperature determination from satellites. Adv. Space Res. 1994, 14, 15–26. [Google Scholar] [CrossRef]
- Zhong, L.; Ma, Y.M.; Su, Z.B.; Salama, M.S. Estimation of land surface temperature over the Tibetan Plateau using AVHRR and MODIS data. Adv. Atmos. Sci. 2010, 27, 1110–1118. [Google Scholar] [CrossRef]
- Liu, K.; Su, H.B.; Li, X.K.; Wang, W.M.; Yang, L.J.; Liang, H. Quantifying spatial-temporal pattern of urban heat island in Beijing: An improved assessment using Land Surface Temperature (LST) time series observations from LANDSAT, MODIS, and Chinese new satellite GaoFen-1. IEEE J. Sel. Top. Appl. 2016, 9, 2028–2041. [Google Scholar] [CrossRef]
- Sobrino, J.A.; Jiménez-Muñoza, J.C.; Paolini, L. Land surface temperature retrieval from Landsat TM 5. Remote Sens. Environ. 2004, 90, 434–440. [Google Scholar] [CrossRef]
- Chakraborty, S.D.; Kant, Y.; Mitra, D. Assessment of land surface temperature and heat fluxes over Delhi using remote sensing data. J. Environ. Manag. 2015, 148, 143–152. [Google Scholar] [CrossRef] [PubMed]
- Zhang, Y.S.; Balzter, H.; Zou, C.C.; Xu, H.Q.; Tang, F. Characterizing bi-temporal patterns of land surface temperature using landscape metrics based on sub-pixel classifications from Landsat TM/ETM+. Int. J. Appl. Earth Obs. Geoinform. 2015, 42, 87–96. [Google Scholar] [CrossRef]
- Odindi, J.O.; Bangamwabo, V.; Mutanga, O. Assessing the value of urban green spaces in mitigating multi-seasonal urban heat using MODIS Land Surface Temperature (LST) and Landsat 8 data. Int. J. Environ. Res. 2015, 9, 9–18. [Google Scholar]
- Zhang, Z.M.; He, G.J.; Wang, M.M.; Long, T.F.; Wang, G.Z.; Zhang, X.M.; Jiao, W.L. Towards an operational method for land surface temperature retrieval from Landsat 8 data. Remote Sens. Lett. 2016, 7, 279–288. [Google Scholar] [CrossRef]
- Li, H.; Liu, Q.H.; Du, Y.M.; Jiang, J.X.; Wang, H.S. Evaluation of the NCEP and MODIS atmospheric products for single channel land surface temperature retrieval with ground measurements: A case study of HJ-1B IRS data. IEEE J. Sel. Top. Appl. 2013, 6, 1399–1408. [Google Scholar] [CrossRef]
- Wu, H.; Ye, L.P.; Shi, W.Z.; Clark, K.C. Assessing the effects of land use spatial structure on urban heat islands using HJ-1B remote sensing imagery in Wuhan, China. Int. J. Appl. Earth Obs. 2014, 32, 67–78. [Google Scholar] [CrossRef]
- Zheng, W.F.; Li, X.L.; Yin, L.R.; Wang, Y.L. The retrieved urban LST in Beijing based on TM, HJ-1B. Arab. J. Sci. Eng. 2016, 41, 2325–2332. [Google Scholar] [CrossRef]
- Chen, Y.C.; Chiu, H.W.; Su, Y.F.; Wu, Y.C.; Cheng, K.S. Does urbanization increase diurnal land surface temperature variation? Evidence and implications. Landsc. Urban Plan. 2017, 157, 247–258. [Google Scholar] [CrossRef]
- Connors, J.P.; Galletti, C.S.; Chow, W.T.L. Landscape configuration and urban heat island effects: Assessing the relationship between landscape characteristics and land surface temperature in Phoenix, Arizona. Landsc. Ecol. 2013, 28, 271–283. [Google Scholar] [CrossRef]
- Myint, S.W.; Wentz, E.A.; Brazel, A.J.; Quattrochi, D.A. The impact of distinct anthropogenic and vegetation features on urban warming. Landsc. Ecol. 2013, 28, 959–978. [Google Scholar] [CrossRef]
- Xie, L.T.; Cai, G.Y. Impact of land cover types and components on urban heat. In Proceedings of the International Conference on Intelligent Earth Observing and Applications, Guilin, China, 23 October 2015. [Google Scholar]
- Zhong, X.K.; Huo, X.; Ren, C.; Labed, J.; Li, Z.L. Retrieving land surface temperature from hyperspectral thermal infrared data using a multi-channel method. Sensors 2016, 16, 687. [Google Scholar] [CrossRef] [PubMed]
- Ren, Z.B.; Zheng, H.F.; He, X.Y.; Zhang, D.; Yu, X.Y. Estimation of the relationship between urban vegetation configuration and land surface temperature with remote sensing. J. Indian Soc. Remote Sens. 2015, 43, 89–100. [Google Scholar] [CrossRef]
- Yang, B.H.; Meng, F.; Ke, X.L.; Ma, C.X. The impact analysis of water body landscape pattern on urban heat island: A case study of Wuhan city. Adv. Meteorol. 2015, 2015, 1–7. [Google Scholar] [CrossRef]
- Feyisa, G.L.; Dons, K.; Meilby, H. Efficiency of parks in mitigating urban heat island effect: An example from Addis Ababa. Landsc. Urban Plan. 2014, 123, 87–95. [Google Scholar] [CrossRef]
- Melaas, E.K.; Wang, J.A.; Miller, D.L.; Friedl, M.A. Interactions between urban vegetation and surface urban heat islands: A case study in the Boston metropolitan region. Environ. Res. Lett. 2016, 11, 054020. [Google Scholar] [CrossRef]
- Coseo, P.; Larsen, L. How factors of land use/land cover, building configuration, and adjacent heat sources and sinks explain urban heat islands in Chicago. Landsc. Urban Plan. 2014, 125, 117–129. [Google Scholar] [CrossRef]
- Yuan, F.; Bauer, M.E. Comparison of impervious surface area and normalized difference vegetation index as indicators of surface urban heat island effects in Landsat imagery. Remote Sens. Environ. 2007, 106, 375–386. [Google Scholar] [CrossRef]
- Weng, Q.H.; Lu, D.S.; Schubring, J. Estimation of land surface temperature-vegetation abundance relationship for urban heat island studies. Remote Sens. Environ. 2004, 89, 467–483. [Google Scholar] [CrossRef]
- Zhang, X.X.; Wu, P.F.; Chen, B. Relationship between vegetation greenness and urban heat island effect in Beijing City of China. Procedia Environ. Sci. 2010, 2, 1438–1450. [Google Scholar] [CrossRef]
- Chen, X.L.; Zhao, H.; Li, P.X.; Yin, Z.Y. Remote sensing image-based analysis of the relationship between urban heat island and land use/cover changes. Remote Sens. Environ. 2006, 104, 133–146. [Google Scholar] [CrossRef]
- Wang, C.Y.; Myint, S.W.; Wang, Z.H.; Song, J.Y. Spatio-temporal modeling of the urban heat island in the Phoenix Metropolitan area: Land use change implications. Remote Sens. 2016, 8, 185. [Google Scholar] [CrossRef]
- Li, J.X.; Song, C.H.; Cao, L.; Zhu, F.G.; Meng, X.L.; Wu, J.G. Impacts of landscape structure on surface urban heat islands: A case study of Shanghai, China. Remote Sens. Environ. 2011, 115, 3249–3263. [Google Scholar] [CrossRef]
- Lü, Y.H.; Fu, B.J.; Wei, W.; Yu, X.; Sun, R.H. Major ecosystems in China: Dynamics and challenges for sustainable management. Environ. Manag. 2011, 48, 13–27. [Google Scholar] [CrossRef] [PubMed]
- Lü, Y.H.; Fu, B.J.; Feng, X.M.; Zeng, Y.; Liu, Y.; Chang, R.Y.; Sun, G.; Wu, B.F. A policy-driven large scale ecological restoration: Quantifying ecosystem services changes in the Loess Plateau of China. PLoS ONE 2012, 7, e31782. [Google Scholar] [CrossRef] [PubMed]
- Li, P.Y.; Qian, H.; Wu, J.H. Environment: Accelerate research on land creation. Nature 2014, 510, 29–31. [Google Scholar] [CrossRef] [PubMed]
- National Earth System Science Data Sharing Infrastructure, National Science & Technology Infrastructure of China. Loess Plateau Soil Data Sets. Available online: http://www.geodata.cn/ (accessed on 21 July 2017).
- United States Geological Survey. Landsat Satellite Images. Available online: http://glovis.usgs.gov/ (accessed on 21 July 2017).
- Exelis Visual Information Solutions, Inc. ENVI Version 5.1. Available online: http://www.envi.com.br/ (accessed on 21 July 2017).
- Sun, J.B.; Yang, J.Y.; Zhang, C.; Yun, W.J.; Qu, J.Q. Automatic remotely sensed image classification in a grid environment based on the maximum likelihood method. Math. Comput. Model. 2013, 58, 573–581. [Google Scholar] [CrossRef]
- ESRI, Redlands, USA. ESRI ArcGIS Version 10.0. Available online: http://www.esri.com/ (accessed on 21 July 2017).
- Janssen, L.L.F.; Vanderwel, F.J.M. Accuracy assessment of satellite derived land-cover data: A review. Photogramm. Eng. Rem. Sens. 1994, 60, 419–426. [Google Scholar]
- Xu, H.Q. Modification of normalized difference water index (NDWI) to enhance open water features in remotely sensed imagery. Int. J. Remote Sens. 2006, 27, 3025–3033. [Google Scholar] [CrossRef]
- Xu, H.Q. A new index for delineating built-up land features in satellite imagery. Int. J. Remote Sens. 2008, 29, 4269–4276. [Google Scholar] [CrossRef]
- Walawender, J.P.; Szymanowski, M.; Hajto, M.J.; Bokwa, A. Land surface temperature patterns in the urban agglomeration of Krakow (Poland) derived from Landsat-7/ETM+ data. Pure Appl. Geophys. 2014, 171, 913–940. [Google Scholar] [CrossRef]
- Jiménez-Munñoz, J.C.; Sobrino, J.A. A generalized single-channel method for retrieving land surface temperature from remote sensing data. J. Geophys. Res. 2003, 108, 4688. [Google Scholar] [CrossRef]
- Wang, M.M.; He, G.J.; Zhang, Z.M.; Wang, G.Z.; Long, T.F. NDVI-based split-window algorithm for precipitable water vapour retrieval from Landsat-8 TIRS data over land area. Remote Sens. Lett. 2015, 6, 904–913. [Google Scholar] [CrossRef]
- Wong, M.S.; Peng, F.; Zou, B.; Shi, W.Z.; Wilson, G.J. Spatially analyzing the inequity of the Hong Kong urban heat island by socio-demographic characteristics. Int. J. Environ. Res. Public Health 2016, 13, 317. [Google Scholar] [CrossRef] [PubMed]
- Quan, J.L.; Chen, Y.H.; Zhan, W.F.; Wang, J.F.; Voogt, J.; Wang, M.J. Multi-temporal trajectory of the urban heat island centroid in Beijing, China based on a Gaussian volume model. Remote Sens. Environ. 2014, 149, 33–46. [Google Scholar] [CrossRef]
- McGarigal, K.; Cushman, S.A.; Neel, M.C.; Ene, E. FRAGSTATS v3: Spatial Pattern Analysis Program for Categorical Maps. Available online: http://www.umass.edu/landeco/research/fragstats/fragstats.html (accessed on 20 July 2017).
- Chen, A.L.; Lei, Y.; Sun, R.H.; Chen, L.D. How many metrics are required to identify the effects of the landscape pattern on land surface temperature? Ecol. Indic. 2014, 45, 424–433. [Google Scholar] [CrossRef]
- Wang, J.L.; Lü, Y.H.; Zeng, Y.; Zhao, Z.J.; Zhang, L.W.; Fu, B.J. Spatial heterogeneous response of land use and landscape functions to ecological restoration: The case of the Chinese loess hilly region. Environ. Earth Sci. 2014, 72, 2683–2696. [Google Scholar] [CrossRef]
- Yang, J.; Sun, J.; Ge, Q.S.; Li, X.M. Assessing the impacts of urbanization-associated green space on urban land surface temperature: A case study of Dalian, China. Urban For. Urban Green. 2017, 22, 1–10. [Google Scholar] [CrossRef]
- Raines, G.L. Description and comparison of geologic maps with FRAGSTATS—A spatial statistics program. Comput. Geosci. UK 2002, 28, 169–177. [Google Scholar] [CrossRef]
- Ran, L.S.; Lu, X.X. Delineation of reservoirs using remote sensing and their storage estimate: An example of the Yellow River basin, China. Hydrol. Process. 2012, 26, 1215–1229. [Google Scholar] [CrossRef]
- Khan, A.; Richards, K.S.; Parker, G.T.; McRobie, A.; Mukhopadhyay, B. How large is the Upper Indus Basin? The pitfalls of auto-delineation using DEMs. J. Hydrol. 2014, 509, 442–453. [Google Scholar] [CrossRef]
- Jonckheere, I.; Fleck, S.; Nackaerts, K.; Muys, B.; Coppin, P.; Weiss, M.; Baret, F. Review of methods for in situ leaf area index determination: Part I. Theories, sensors and hemispherical photography. Agric. For. Meteorol. 2004, 121, 19–35. [Google Scholar] [CrossRef]
- Zhou, J.H.; Sun, T.Z. Study on remote biomass sensing model of three-dimensional green and the estimation of environmental benefits of greenery. Chin. Remote Sens. Environ. 1995, 10, 162–174. [Google Scholar]
- Zhang, X.X.; Hu, Y.H.; Jia, G.S.; Hou, M.T.; Fan, Y.G.; Sun, Z.C.; Zhu, Y.X. Land surface temperature shaped by urban fractions in megacity region. Theor. Appl. Climatol. 2017, 127, 965–975. [Google Scholar] [CrossRef]
- Estoque, R.C.; Murayama, Y.; Myint, S.W. Effects of landscape composition and pattern on land surface temperature: An urban heat island study in the megacities of Southeast Asia. Sci. Total Environ. 2017, 577, 349–359. [Google Scholar] [CrossRef] [PubMed]
- Bokaie, M.; Zarkesh, M.K.; Arasteh, P.D.; Hosseini, A. Assessment of urban heat island based on the relationship between land surface temperature and land use/land cover in Tehran. Sustain. Cities Soc. 2016, 23, 94–104. [Google Scholar] [CrossRef]
- Li, W.F.; Cao, Q.W.; Lang, K.; Wu, J.S. Linking potential heat source and sink to urban heat island: Heterogeneous effects of landscape pattern on land surface temperature. Sci. Total Environ. 2017, 586, 457–465. [Google Scholar] [CrossRef] [PubMed]
- Vidrih, B.; Medved, S. Multiparametric model of urban park cooling island. Urban For. Urban Green. 2013, 12, 220–229. [Google Scholar] [CrossRef]
- Rafiee, A.; Dias, E.; Koomen, E. Local impact of tree volume on nocturnal urban heat island: A case study in Amsterdam. Urban For. Urban Green. 2016, 16, 50–61. [Google Scholar] [CrossRef]


| Serial Number | Data | Acquisition Date and Time (GMT) | Spatial Resolution | Utility |
|---|---|---|---|---|
| 1 | SPOT-5 | 9 September 2003; 03:40:49 9 September 2003; 03:40:57 | 2.5 m 2.5 m | Land use/cover classification of satellite imagery |
| 2 | GeoEye-1 | 2009 | 1.65 m | |
| 3 | Land use map | 1995, 2000 | 1:100,000 | |
| 2011 | 1:10,000 | |||
| 4 | Landsat 5 TM | 29 August 1990; 02:39:18 8 June 1995; 02:25:55 19 June 2005; 03:06:59 17 June 2010; 03:10:03 | 30 m, 120 m | Used for land use/cover type classification, remote sensing and index calculation. Thermal infrared bands used for retrieving land surface temperature values. |
| 5 | Landsat 7 ETM+ | 29 June 2000; 03:11:06 | 30 m, 60 m | |
| 6 | Landsat 8 OLI & TIRS | 1 July 2015; 03:18:49 | 30 m, 100 m | |
| 7 | Boundary map of Yan’an city area | 2011 | Subset related data. |
| Primary Types | Abbreviation | Secondary Types | Code |
|---|---|---|---|
| Construction land | CL | Urban area, rural residential area, other construction land | 1 |
| Farmland | FL | Paddy field, non-paddy field | 2 |
| Forest | FO | Forest, shrubs, sparse forest, other forest | 3 |
| Grassland | GL | Dense grassland, moderately dense grassland, sparse grassland | 4 |
| Water | WA | River, lake, reservoir or pond, beach, bottomland | 5 |
| Unused land | UL | Sandy land, saline land, marsh, bare land, bare rock, other unused land | 6 |
| Thermal Landscape Category (LST Grade/Heat Island Intensity) | LST Division |
|---|---|
| Hot/extremely strong | T(x, y) ≥ m + std |
| Medium-hot/very strong | m + std > T(x, y) ≥ m + 0.5std |
| Warm/moderate | m + 0.5std > T(x, y) ≥ m − 0.5std |
| Medium-cold/weak | m − 0.5std > T(x, y) ≥ m − std |
| Cold/none | T(x, y) < m – std |
| Evaluation Index | Description | Formula |
|---|---|---|
| Fractal dimension index (FRAC) | Ranging between 1 and 2, where a greater value indicates more complex characteristic of the plaque and landscape. A is the total area and P is the perimeter of a patch. | |
| Percentage of landscape (PLAND) | Characteristic of a certain class area relative to the proportion of the total. A is the total area, a is the plaque area, and n is the number of patches. | |
| Aggregation index (AI) | Characterization of the degree of plaque accumulation, ranging between 0 and 100, where a lower value indicates a greater degree of dispersion for the representative. gii is adjacent to a number of patches relative to a class plaque. | |
| Division index (DI) | Measure of the plaque distribution, ranging between 0 and 1, where a value closer to 1 represents a more severe split. A is the total area, ai is the area of the ith plaque, and n is the number of patches. | |
| Shannon’s diversity index (SHDI) | Diversity measure that increases with the number of patch types and as the proportional distribution of the area among patch types becomes more equal. | |
| Expansion intensity (EI) | Measure of the intensity of spatial expansion. Ai + j and Ai are the areas in years i + j and i, respectively. |
| Canopy Shape | Cylinder | Oval | Sphere | Flat Spheroid | Cone | Spherical Fan | Spherical Segment |
|---|---|---|---|---|---|---|---|
| Empirical formula | |||||||
| Tree species | PC, PH, PO, SC, WS | FC, PCa, SM, UP | AV, JF | AM, JR, PU, SJ | CD, GB, MA, PA, PB, PT, RP, ZJ | AP, FS, PS, SJv | AJ, SJp |
| Green Space | Sample Plot Code | Tree Species Composition | TSN | LSI | LAI | TGB (m3) | GSCI (°C) | GSCI Order |
|---|---|---|---|---|---|---|---|---|
| Zaoyuan revolution site | 1 | 3AV + 2PU + 2JR | 3 | 1.062 | 1.44 | 3598.3 | 2.67 | 25 |
| 2 | 5ZJ + 3AV + 3PU | 3 | 1.145 | 1.973 | 4838.1 | 4.98 | 7 | |
| 3 | 15GB + 5UP + 3JF | 3 | 1.117 | 1.081 | 5952.6 | 5.54 | 3 | |
| 4 | 13ZJ + 8SC + 8RP + 3PC + 3MA | 5 | 1.118 | 1.182 | 5110.8 | 4.83 | 11 | |
| Xibeichuan park | 5 | 8PS + 6SM + 5FC + 7AM | 4 | 1.247 | 1.379 | 3596 | 3.21 | 21 |
| 6 | 31PT | 1 | 1.327 | 1.030 | 3472.5 | 2.36 | 26 | |
| 7 | 100PS | 1 | 1.399 | 2.060 | 2188.1 | 2.06 | 27 | |
| 8 | 14 SM | 1 | 1.865 | 2.470 | 10,054.4 | 3.11 | 22 | |
| 9 | 10FC + 16PT | 2 | 1.246 | 2.760 | 6329.6 | 3.98 | 16 | |
| 10 | 4PH + 2PT + 3PB + 1AV | 4 | 1.228 | 1.930 | 8967.1 | 1.87 | 28 | |
| 11 | 63PO | 1 | 2.278 | 0.980 | 23.7 | 0.67 | 34 | |
| 12 | 5SJ + 1AM | 2 | 1.281 | 1.372 | 1088.5 | 1.41 | 30 | |
| 13 | 18PA | 1 | 1.268 | 1.179 | 343.2 | 0.93 | 32 | |
| 14 | 1RP + 5PCa + 4PT + 1SM | 4 | 1.133 | 1.459 | 2176.81 | 1.49 | 29 | |
| 15 | 64GB + 10UP | 2 | 2.774 | 1.297 | 1120.3 | 1.26 | 31 | |
| Yan’an airport green space | 16 | 7SM + 5PT + 3PA + 2SJ + 1JF | 5 | 1.2 | 3.56 | 42,722.4 | 5.43 | 6 |
| 17 | 6PCa + 4SJ + 3SM + 2PH | 4 | 1.134 | 2.93 | 34073.2 | 4.86 | 10 | |
| 18 | 5PA + 4SM + 2PT + 1SJ + 1GB | 5 | 1.202 | 3.24 | 8050.7 | 4.93 | 9 | |
| Yuying park | 19 | 6PT + 4RP + 3PO + 3SJ + 3PCa + 2SC + 2PH + 1PA | 8 | 2.007 | 4.567 | 154,618 | 8.57 | 1 |
| Liulin green belt | 20 | 20PB + 36SJ + 7SM + 4As + 2GB + 1PH + 1PT | 7 | 1.217 | 3.755 | 56,100.4 | 6.39 | 2 |
| Dalitang green space | 21 | 4PCa + 3SJp + 2PT + 1AP + 1SC + 1PS + 1CD | 7 | 1.385 | 2.859 | 5485.7 | 4.16 | 13 |
| Shilipu nursery | 22 | 100RP | 1 | 1.25 | 3.140 | 12,403.3 | 5.44 | 5 |
| 23 | 97JF | 1 | 1.717 | 1.072 | 87.9 | 0.82 | 33 | |
| 24 | 27PH | 1 | 1.807 | 2.980 | 15,246.6 | 5.51 | 4 | |
| Revolutionary memorial hall green space | 25 | 34SM + 7GB + 5PT + 5JF + 4SJ | 5 | 1.098 | 2.804 | 5397.1 | 4.95 | 8 |
| 26 | 13SM + 13SJ + 3JF + 3PT | 4 | 2.211 | 2.651 | 2065.7 | 4.76 | 12 | |
| 27 | 10GB + 10JF + 3SM | 3 | 1.286 | 2.202 | 2964.1 | 4.06 | 14 | |
| Wangjiaping peach park | 28 | 53AP + 1JR | 2 | 1.217 | 1.830 | 2236 | 3.66 | 18 |
| 29 | 3AV | 1 | 1.458 | 2.583 | 2753.3 | 3.29 | 20 | |
| Yan’an university campus | 30 | 11PO + 7SJv + 6SJp + 1AJ | 4 | 1.377 | 2.628 | 1503.1 | 3.32 | 19 |
| 31 | 19JR + 11PCa + 6JF + 4SJ + 4PA + 3AJ | 6 | 1.249 | 2.307 | 28,408.4 | 3.78 | 17 | |
| 32 | 60WS | 1 | 1.284 | 2.941 | 649.5 | 2.96 | 24 | |
| 33 | 22SJp + 19FS + 16PA + 16AP | 4 | 1.575 | 2.786 | 2439.8 | 3.04 | 23 | |
| 34 | 41PO + 36JF + 24PCa + 4PA + 4PO | 5 | 1.137 | 2.138 | 913.1 | 3.99 | 15 | |
| Mean | 1.421 | 2.252 | 12,852.3 | 3.66 | ||||
| Standard deviation | 0.395 | 0.897 | 2814.0 | 1.78 | ||||
| y | x | Model | Domain of Definition | R2 | p-Value |
|---|---|---|---|---|---|
| GSCI | TSN | y = 1.99684 + 0.51597x | 1 ≤ x ≤ 8 | 0.3248 | 0.0003 |
| GSCI | LAI | y = 0.34095 + 1.4719x | 0.980 ≤ x ≤4.567 | 0.5363 | <0.0001 |
| GSCI | LSI | y = 9.4506 − 4.644x | 1.062 ≤ x ≤ 1.717 | 0.1760 | 0.0151 |
| GSCI | LSI | y = 14.2984 − 4.7837x | 1.717< x ≤ 2.774 | 0.1669 | 0.2307 |
| GSCI | TGB | y = –2.9910 + 0.8089lnx | 23.7 ≤ x ≤ 154618 | 0.6051 | <0.0001 |
| GSCILSTm | GSCIAT1.5 | y = 0.5252 + 0.2172x | 0.67 ≤ x ≤ 8.57 | 0.4253 | <0.0001 |
© 2017 by the authors. Licensee MDPI, Basel, Switzerland. This article is an open access article distributed under the terms and conditions of the Creative Commons Attribution (CC BY) license (http://creativecommons.org/licenses/by/4.0/).
Share and Cite
Zhang, X.; Wang, D.; Hao, H.; Zhang, F.; Hu, Y. Effects of Land Use/Cover Changes and Urban Forest Configuration on Urban Heat Islands in a Loess Hilly Region: Case Study Based on Yan’an City, China. Int. J. Environ. Res. Public Health 2017, 14, 840. https://doi.org/10.3390/ijerph14080840
Zhang X, Wang D, Hao H, Zhang F, Hu Y. Effects of Land Use/Cover Changes and Urban Forest Configuration on Urban Heat Islands in a Loess Hilly Region: Case Study Based on Yan’an City, China. International Journal of Environmental Research and Public Health. 2017; 14(8):840. https://doi.org/10.3390/ijerph14080840
Chicago/Turabian StyleZhang, Xinping, Dexiang Wang, Hongke Hao, Fangfang Zhang, and Youning Hu. 2017. "Effects of Land Use/Cover Changes and Urban Forest Configuration on Urban Heat Islands in a Loess Hilly Region: Case Study Based on Yan’an City, China" International Journal of Environmental Research and Public Health 14, no. 8: 840. https://doi.org/10.3390/ijerph14080840
APA StyleZhang, X., Wang, D., Hao, H., Zhang, F., & Hu, Y. (2017). Effects of Land Use/Cover Changes and Urban Forest Configuration on Urban Heat Islands in a Loess Hilly Region: Case Study Based on Yan’an City, China. International Journal of Environmental Research and Public Health, 14(8), 840. https://doi.org/10.3390/ijerph14080840