
Association by Spatial Interpolation between Ozone Levels and Lung Function of Residents at an Industrial Complex in South Korea

 , ,
, ,
Abstract
:1. Introduction
2. Materials and Methods
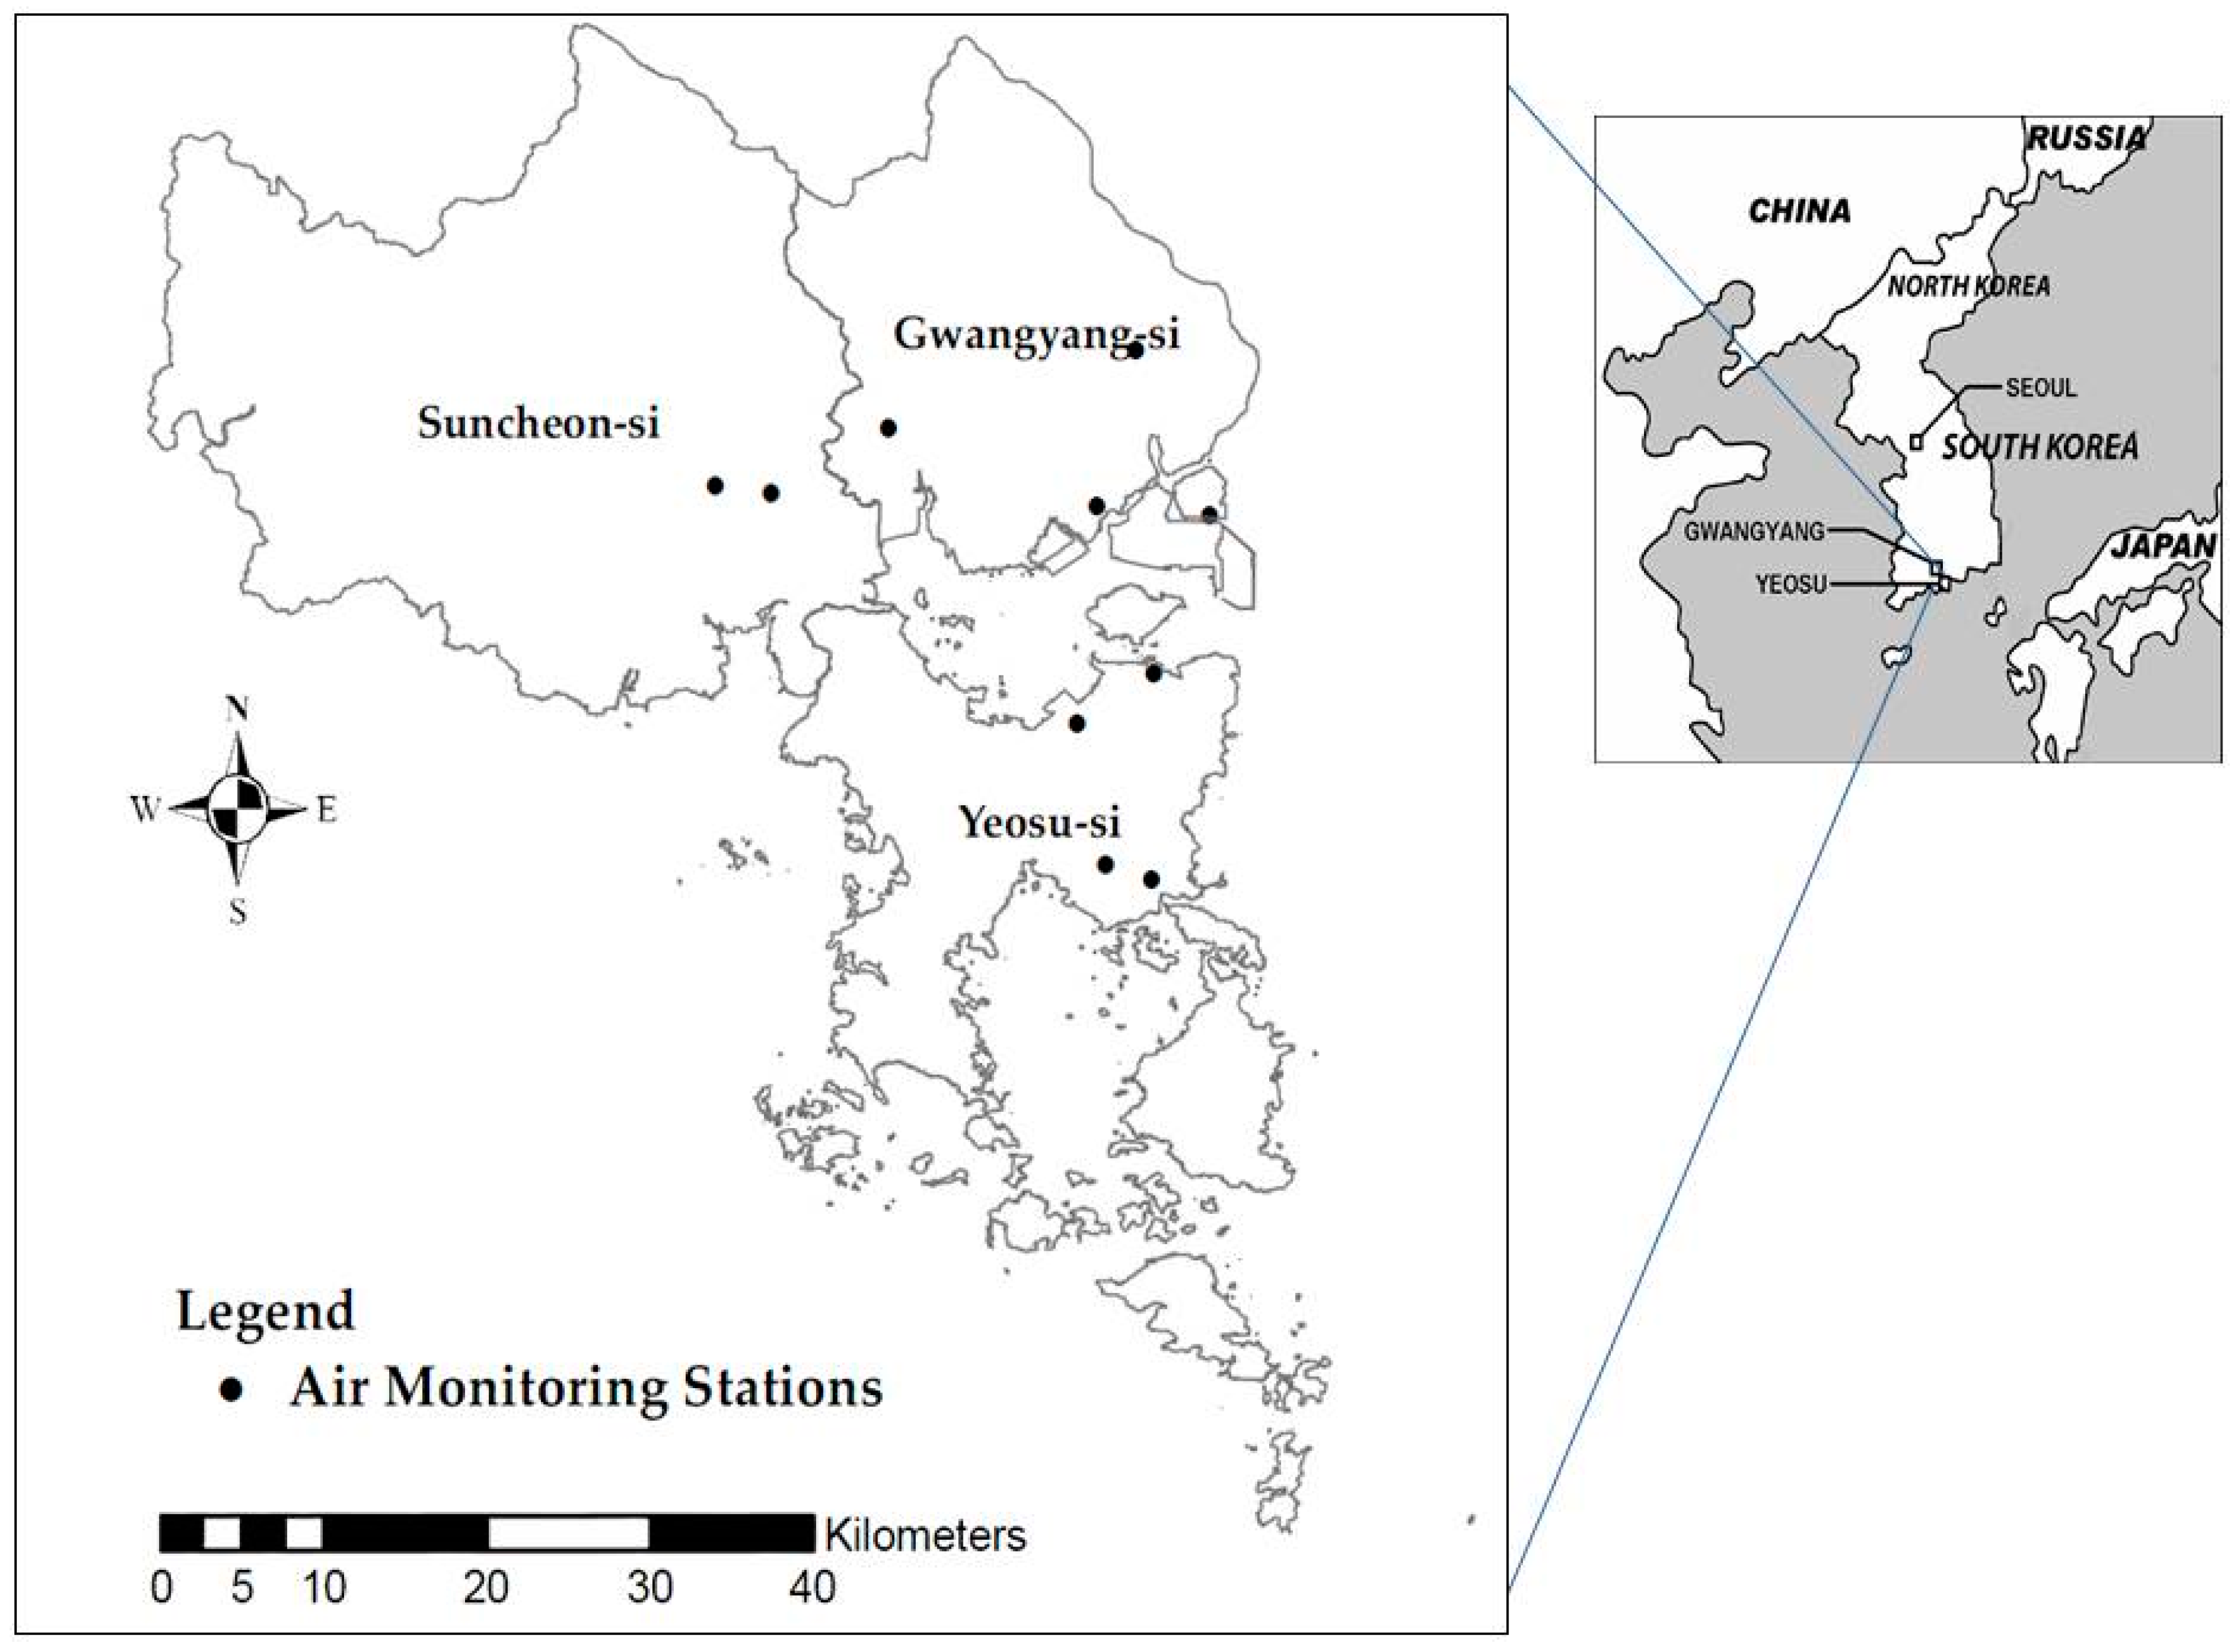
2.1. Study Area and Subjects
2.2. Ambient Ozone Exposure Estimation
2.3. Cross-Validation
2.4. Lung Function Tests
2.5. Statistical Analysis
3. Results
4. Discussion
5. Conclusions
Acknowledgments
Author Contributions
Conflicts of Interest
References
- NRC. National Research Council, Exposure Science in the 21st Century: A Vision and A Strategy; National Academy Press: Washington, DC, USA, 2012. [Google Scholar]
- Bell, M.L. The use of ambient air quality modeling to estimate individual and population exposure for human health research: A case study of ozone in the Northern Georgia Region of the United States. Environ. Int. 2006, 32, 586–593. [Google Scholar] [CrossRef] [PubMed]
- Bell, M.L.; McDermott, A.; Zeger, S.L.; Samet, J.M.; Dominici, F. Ozone and short-term mortality in 95 U.S. urban communities, 1987–2000. JAMA 2004, 292, 2372–2378. [Google Scholar] [PubMed]
- Pope, I.C.; Burnett, R.T.; Thun, M.J.; Calle, E.E.; Krewski, D.; Ito, K.; Thurston, G.D. Lung cancer, cardiopulmonary mortality, and long-term exposure to fine particulate air pollution. JAMA 2002, 287, 1132–1141. [Google Scholar] [CrossRef] [PubMed]
- Peng, R.D.; Bell, M.L. Spatial misalignment in time series studies of air pollution and health data. Biostatistics 2010, 11, 720–740. [Google Scholar] [CrossRef] [PubMed]
- Bravo, M.A.; Bell, M.L. Spatial heterogeneity of PM10 and O3 in São Paulo, Brazil, and implications for human health studies. J. Air Waste Manag. Assoc. 2011, 61, 69–77. [Google Scholar] [CrossRef] [PubMed]
- Dadvand, P.; Ostro, B.; Figueras, F.; Foraster, M.; Basagana, X.; Valentin, A.; Martinez, D.; Beelen, R.; Cirach, M.; Hoek, G.; et al. Residential proximity to major roads and term low birth weight: The roles of air pollution, heat, noise, and road-adjacent trees. Epidemiology 2014, 25, 518–525. [Google Scholar] [CrossRef] [PubMed]
- Allen, R.W.; Criqui, M.H.; Roux, A.V.D.; Allison, M.; Shea, S.; Detrano, R.; Sheppard, L.; Wong, N.D.; Stukovsky, K.H.; Kaufman, J.D. Fine particulate matter air pollution, proximity to traffic, and aortic atherosclerosis. Epidemiology 2009, 20, 254–264. [Google Scholar] [CrossRef] [PubMed]
- Pinichka, C.; Bundhamcharoen, K.; Shibuya, K. Diseases burden of chronic obstructive pulmonary disease (COPD) attributable to ground-level ozone in Thailand: Estimates based on surface monitoring measurements data. Environ. Health Perspect. Glob. J. Health Sci. 2016, 8, 1–13. [Google Scholar] [CrossRef] [PubMed]
- Chan, T.-C.; Chen, M.-L.; Lin, I.-F.; Lee, C.-H.; Chiang, P.-H.; Wang, D.-W.; Chuang, J.-H. Spatiotemporal analysis of air pollution and asthma patient visits in Taipei, Taiwan. Int. J. Health Geogr. 2009. [Google Scholar] [CrossRef] [PubMed]
- Kerckhoffs, J.; Wang, M.; Meliefste, K.; Malmqvist, E.; Fischer, P.; Jnassen, N.A.; Beelen, R.; Hoek, G. A national fine spatial scale land-use regression model for ozone. Environ. Res. 2015, 140, 440–448. [Google Scholar] [CrossRef] [PubMed]
- Wang, M.; Gehring, U.; Hoek, G.; Keuken, M.; Jonkers, S.; Beelen, R.; Eeftens, M.; Postma, D.S.; Brunekreef, B. Air pollution and lung function in Dutch children: A comparison of exposure estimates and associations based on land use regression and dispersion exposure modeling approaches. Environ. Health Perspect. 2015, 123, 847–851. [Google Scholar] [CrossRef] [PubMed]
- Berke, O. Exploratory disease mapping: Kriging the spatial risk function from regional count data. Int. J. Health Geogr. 2004, 3, 1–11. [Google Scholar] [CrossRef] [PubMed][Green Version]
- Brus, D.J.; Heuvelink, G.B. Optimization of sample patterns for universal kriging of environmental variables. Geoderma 2007, 138, 86–95. [Google Scholar] [CrossRef]
- Amann, M. Health Risks of Ozone from Long-Range Transboundary Air Pollution; WHO Regional Office Europe: Copenhagen, Denmark, 2008. [Google Scholar]
- Bell, M.L.; Goldberg, R.; Hogrefe, C.; Kinney, P.L.; Knowlton, K.; Lynn, B.; Rosenthal, J.; Rosenzweig, C.; Patz, J.A. Climate change, ambient ozone, and health in 50 U.S. cities. Clim. Chang. 2007, 82, 61–76. [Google Scholar] [CrossRef]
- Seo, J.; Youn, D.; Kim, J.; Lee, H. Extensive spatio-temporal analyses of surface ozone and related meteorological variables in South Korea for 1999–2010. Atmos. Chem. Phys. Discuss. 2014, 14, 1191–1238. [Google Scholar] [CrossRef]
- Tomczak, M. Spatial interpolation and its uncertainty using automated anisotropic inverse distance weighting (IDW)-cross-validation/jackknife approach. J. Geogr. Inf. Decis. Anal. 1998, 2, 18–30. [Google Scholar]
- Wong, D.W.; Yuan, L.; Perlin, S.A. Comparison of spatial interpolation methods for the estimation of air quality data. J. Expo. Sci. Environ. Epidemiol. 2004, 14, 404–415. [Google Scholar] [CrossRef] [PubMed]
- Haylock, M.; Hofstra, N.; Klein Tank, A.; Klok, E.; Jones, P.; New, M. A European daily high-resolution gridded data set of surface temperature and precipitation for 1950–2006. J. Geophys. Res. 2008. [Google Scholar] [CrossRef]
- Liao, D.; Peuquet, D.J.; Duan, Y.; Whitsel, E.A.; Dou, J.; Smith, R.L.; Lin, H.-M.; Chen, J.-C.; Heiss, G. GIS approaches for the estimation of residential-level ambient PM concentrations. Environ. Health Perspect. 2006, 114, 1374–1380. [Google Scholar] [CrossRef] [PubMed]
- Barrero, M.; Grimalt, J.O.; Cantón, L. Prediction of daily ozone concentration maxima in the urban atmosphere. Chemom. Intell. Lab. Syst. 2006, 80, 67–76. [Google Scholar] [CrossRef]
- Wilson, J.G.; Kingham, S.; Sturman, A.P. Intraurban variatons of PM10 air pollution in Christchurch, New Zealand: Implications for epidemiological studies. Sci. Total Environ. 2005, 16, 727–736. [Google Scholar]
- American Thoracic Society. Standardization of spirometry, 1994 update. Am. J. Respir. Crit. Care Med. 1995, 152, 1107–1136. [Google Scholar]
- Jerrett, M.; Burnett, R.T.; Ma, R.; Pope III, C.A.; Krewski, D.; Newbold, K.B.; Thurston, G.; Shi, Y.; Finkelstein, N.; Calle, E.E. Spatial analysis of air pollution and mortality in Los Angeles. Epidemiology 2005, 16, 727–736. [Google Scholar] [CrossRef] [PubMed]
- Marshall, J.D.; Nethery, E.; Brauer, M. Within-urban variability in ambient air pollution: Comparison of estimation methods. Atmos. Environ. 2008, 42, 1359–1369. [Google Scholar] [CrossRef]
- Pikhart, H.; Bobak, M.; Gorynski, P.; Wojtyniak, B.; Danova, J.; Celko, M.A.; Kriz, B.; Briggs, D.; Elliott, P. Outdoor sulphur dioxide and respiratory symptoms in Czech and Polish school children: A small-area study (SAVIAH). Int. Arch. Occup. Environ. Health 2001, 74, 574–578. [Google Scholar] [CrossRef] [PubMed]
- Son, J.-Y.; Bell, M.L.; Lee, J.-T. Individual exposure to air pollution and lung function in Korea: Spatial analysis using multiple exposure approaches. Environ. Res. 2010, 110, 739–749. [Google Scholar] [CrossRef] [PubMed]
- Kim, S.-Y.; Sheppard, L.; Kim, H. Health effects of long-term air pollution: Influence of exposure prediction methods. Epidemiology 2009, 20, 442–450. [Google Scholar] [CrossRef] [PubMed]
- KMOE. Environmental review. In Ministry of Environment; KOREA: Sejong-City, Korea, 2013. [Google Scholar]
- Beelen, R.; Hoek, G.; Pebesma, E.; Vienneau, D.; de Hoogh, K.; Briggs, D.J. Mapping of background air pollution at a fine spatial scale across the European Union. Sci. Total Environ. 2009, 407, 1852–1867. [Google Scholar] [CrossRef] [PubMed]
- Chen, C.-H.; Chan, C.-C.; Chen, B.-Y.; Cheng, T.-J.; Guo, Y.-L. Effect of particulate air pollution and ozone on the lung function in non-asthmatic children. Environ. Res. 2015, 137, 40–48. [Google Scholar] [CrossRef] [PubMed]
- Hwang, B.-F.; Chen, Y.-H.; Lin, Y.-T.; Wu, X.-T.; Lee, Y.-L. Relationship between exposure to fine particulates and ozone and reduced lung function in children. Environ. Res. 2015, 137, 382–390. [Google Scholar] [CrossRef] [PubMed]
- Amadeo, B.; Robert, C.; Rondeau, V.; Mounouchy, M.A.; Cordeau, L.; Birembaux, X.; Citadelle, E.; Gotin, J.; Gouranton, M.; Marcin, G.; et al. Impact of close-proximity air pollution on lung function in schoolchildren in the French West Indies. BMC Public Health 2015. [Google Scholar] [CrossRef] [PubMed]
- Rojas-Martinez, R.; Perez-Padilla, R.; Olaiz-Fernandez, G.; Mendoza-Alvarado, L.; Moreno-Macias, H.; Fortoul, T.; McDonnell, W.; Loomis, D.; Romieu, I. Lung function growth in children with long-term exposure to air pollutants in Mexico City. Am. J. Respir. Crit. Care Med. 2007, 176, 377–384. [Google Scholar] [CrossRef] [PubMed]
- Chang, Y.-K.; Wu, C.-C.; Lee, L.-T.; Lin, R.S.; Yu, Y.-H.; Chen, Y.-C. The short-term effects of air pollution on adolescent lung function in Taiwan. Chemosphere 2012, 87, 26–30. [Google Scholar] [CrossRef] [PubMed]
- Pinkerton, K.E.; Balmes, J.R.; Fanucchi, M.V.; Rom, W.N. Ozone, a malady for all ages. Am. J. Respir. Crit. Care Med. 2007, 176, 107–108. [Google Scholar] [CrossRef] [PubMed]
- Finn, P.W.; Gozal, D.; Moss, M.; Ewart, G.; Moore, N.; du Melle, F. Commnets from the American Thoracic Society Presented by Mary B. Rice MD before the House Committee on Science, Space and Technology on EPA’s Proposed Ozone National Ambient Air Quality Standard 17 March 2015. Avaiable online: http://docs.house.gov/meetings/SY/SY00/20150317/103159/HHRG-114-SY00-Wstate-RiceM-20150317.pdf (accessed on 11 July 2016).
- Selgrade, M.J.K.; Lemanske, R.F., Jr.; Gilmour, M.I.; Neas, L.M.; Ward, M.D.; Henneberger, P.K.; Weissman, D.N.; Hoppin, J.A.; Dietert, R.R.; Sly, P.D. Induction of asthma and the environment: What we know and need to know. Environ. Health Perspect. 2006, 114, 615–619. [Google Scholar] [CrossRef] [PubMed]
- Li, S.; Williams, G.; Jalaludin, B.; Baker, P. Panel studies of air pollution on children’s lung function and respiratory symptoms: A literature review. J. Asthma 2012, 49, 895–910. [Google Scholar] [CrossRef] [PubMed]
- White, N.; van der Walt, A.; Ravenscroft, G.; Roberts, W.; Ehrlich, R. Meteorologically estimated exposure but not distance predicts asthma symptoms in schoolchildren in the environs of a petrochemical refinery: A cross-sectional study. Environ. Health 2009. [Google Scholar] [CrossRef] [PubMed]
- Smargiassi, A.; Kosatsky, T.; Hicks, J.; Plante, C.; Armstrong, B.; Villeneuve, P.J.; Goudreau, S. Risk of asthmatic episodes in children exposed to sulfur dioxide stack emissions from a refinery point source in Montreal, Canada. Environ. Health Perspect. 2009, 117, 653–659. [Google Scholar] [CrossRef] [PubMed]
- Rusconi, F.; Catelan, D.; Accetta, G.; Peluso, M.; Pistelli, R.; Barbone, F.; di Felice, E.; Munnia, A.; Murgia, P.; Paladini, L. Asthma symptoms, lung function, and markers of oxidative stress and inflammation in children exposed to oil refinery pollution. J. Asthma 2011, 48, 84–90. [Google Scholar] [CrossRef] [PubMed]
- Chau, C.; Tu, E.Y.; Chan, D.; Burnett, J. Estimating the total exposure to air pollutants for different population age groups in Hong Kong. Environ. Int. 2002, 27, 617–630. [Google Scholar] [CrossRef]
- Sexton, K.; Mongin, S.J.; Adgate, J.L.; Pratt, G.C.; Ramachandran, G.; Stock, T.H.; Morandi, M.T. Estimating volatile organic compound concentrations in selected microenvironments using time-activity and personal exposure data. J. Toxicol. Environ. Health 2007, 70, 465–476. [Google Scholar] [CrossRef] [PubMed]
- Yang, W.; Lee, K.; Yoon, C.; Yu, S.; Park, K.; Choi, W. Determinants of residential indoor and transportation activity times in Korea. J. Expo. Sci. Environ. Epidemiol. 2011, 21, 310–316. [Google Scholar] [CrossRef] [PubMed]


| Model | Mean | SD | Min | 25th | 50th | 75th | Max |
|---|---|---|---|---|---|---|---|
| Method 1 | 42.2 | 15.5 | 10.4 | 30.1 | 39.4 | 54.0 | 88.6 |
| Method 2 | 40.9 | 16.6 | 3.7 | 28.9 | 38.9 | 51.8 | 113.8 |
| Method 3 | 41.4 | 15.6 | 3.8 | 29.7 | 39.0 | 52.2 | 113.1 |
| Method 4 | 41.7 | 15.9 | 5.9 | 29.6 | 39.2 | 52.6 | 113.5 |
| Lag Days | Method 1 | Method 2 | Method 3 | Method 4 | ||||
|---|---|---|---|---|---|---|---|---|
| Mean (SD) | Range | Mean (SD) | Range | Mean (SD) | Range | Mean (SD) | Range | |
| 0 day | 59.8 (12.0) | 31.5–85.9 | 56.0 (14.6) | 26.0–85.7 | 57.8 (12.6) | 30.2–93.9 | 58.1 (13.0) | 31.5–97.8 |
| 1 day | 58.1 (11.7) | 35.8–82.8 | 53.9 (13.6) | 26.0–93.9 | 55.4 (12.1) | 30.9–93.4 | 55.7 (12.2) | 30.0–98.2 |
| 2 days | 58.9 (12.2) | 28.3–85.0 | 56.2 (12.3) | 24.0–96.4 | 57.7 (12.5) | 24.0–90.5 | 57.9 (12.3) | 23.9–90.1 |
| 0–1 day | 58.9 (10.6) | 36.7–84.4 | 54.9 (12.7) | 30.0–95.4 | 56.6 (10.8) | 33.5–93.6 | 56.9 (11.0) | 36.3–91.6 |
| 1–2 days | 58.5 (10.7) | 32.0–81.8 | 55.0 (11.2) | 26.8–93.6 | 56.6 (10.9) | 27.9–89.6 | 56.8 (10.8) | 27.3–88.3 |
| 0–2 days | 58.9 (9.8) | 36.2–83.2 | 55.3 (10.7) | 34.1–90.7 | 57.0 (9.8) | 34.7–89.0 | 57.2 (9.9) | 34.7–87.2 |
| Pollutant | Method | RMSE | COD |
|---|---|---|---|
| O3 | Nearest monitor | 10.5 | 0.139 |
| O3 | IDW | 8.75 | 0.113 |
| O3 | Kriging | 7.48 | 0.099 |
| Variables | All | Age 9–14 | Age 15–64 | Age ≥ 65 | |
|---|---|---|---|---|---|
| n | 2283 | 200 | 1419 | 664 | |
| Age (years) | 41.8 ± 25.7 | 12.8 ± 1.23 | 30.7 ± 17.8 | 74.2 ± 5.60 | |
| Gender (%) | Male | 43.1 | 47.5 | 46.5 | 34.5 |
| Female | 56.9 | 52.5 | 53.5 | 65.5 | |
| Height (cm) | 158.7 ± 10.0 | 145.4 ± 8.50 | 162.3 ± 8.57 | 155.2 ± 8.52 | |
| Weight (kg) | 55.6 ± 12.3 | 37.8 ± 9.89 | 57.4 ± 11.6 | 57.1 ± 9.90 | |
| BMI (kg/m2) | 21.9 ± 3.89 | 17.6 ± 3.53 | 21.7 ± 3.70 | 23.6 ± 3.25 | |
| Lung function | FEV1 (L) | 2.37 ± 0.73 | 1.92 ± 0.35 | 2.69 ± 0.66 | 1.82 ± 0.55 |
| FVC (L) | 2.90 ± 0.84 | 2.26 ± 0.42 | 3.23 ± 0.76 | 2.39 ± 0.71 | |
| FEV1/FVC (%) | 81.6 ± 8.76 | 85.5 ± 6.57 | 83.4 ± 7.65 | 76.6 ± 9.48 |
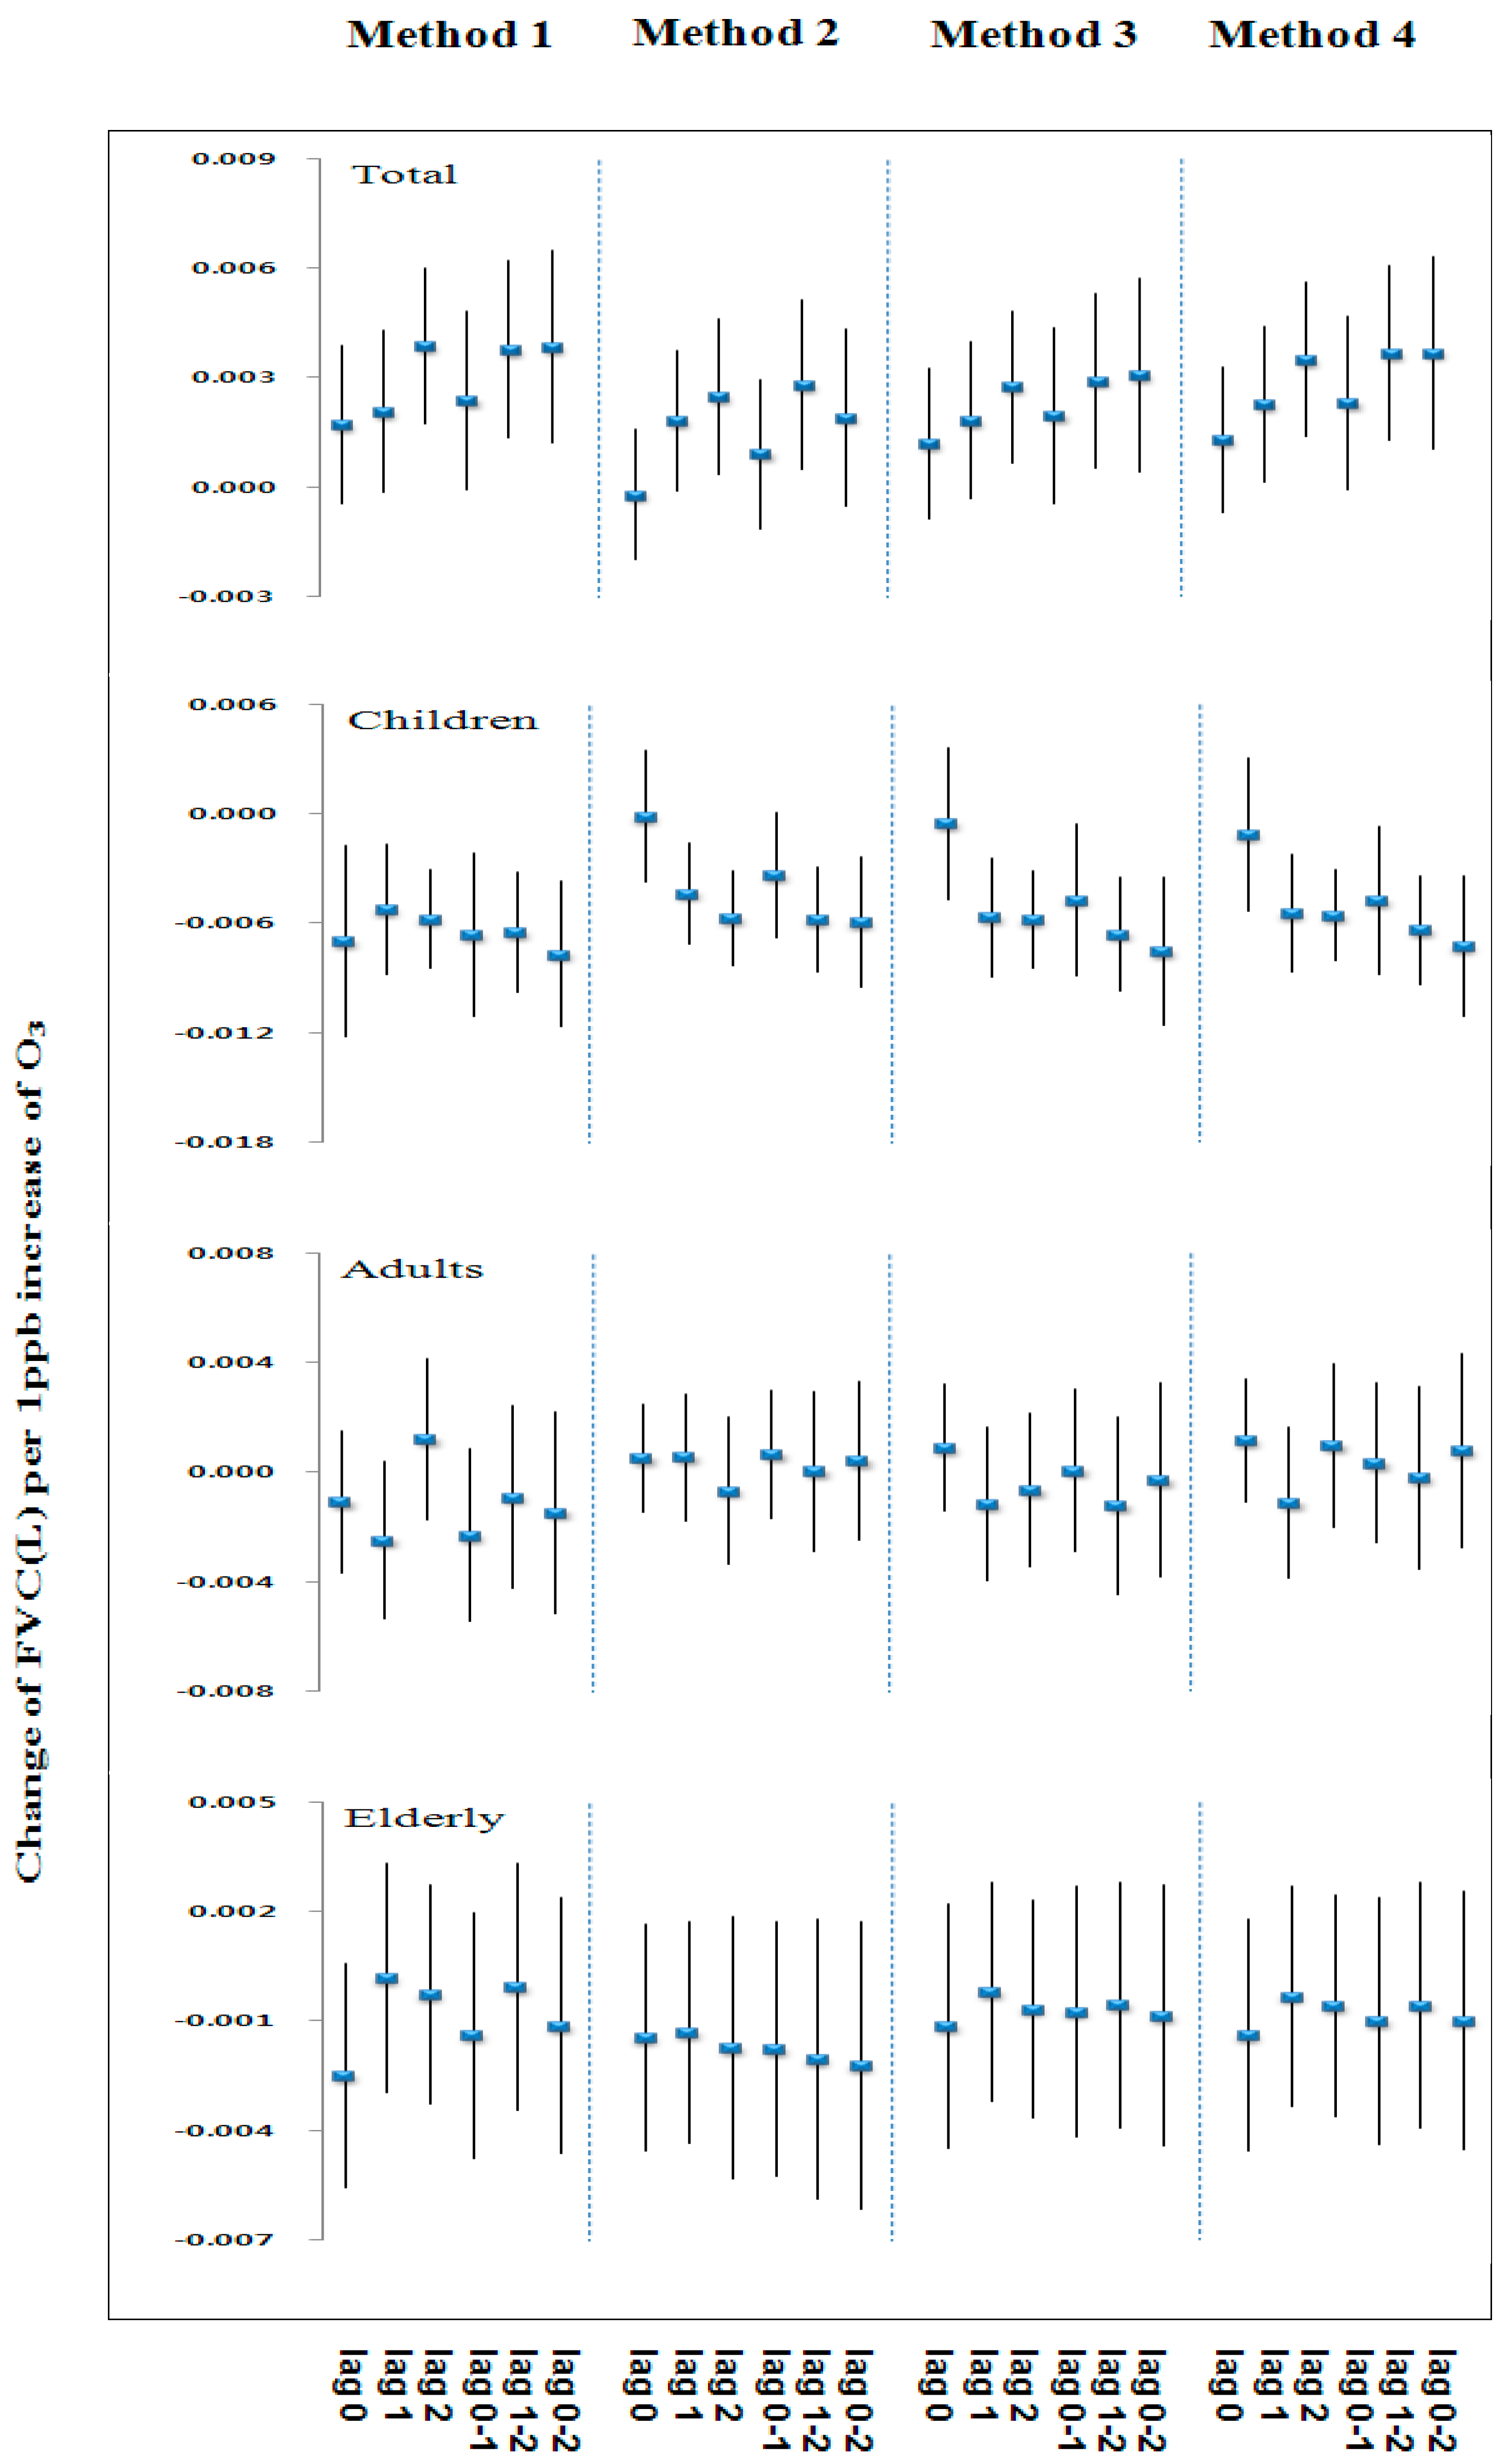
| Lag Day | Age | FVC (L) | |||||||
|---|---|---|---|---|---|---|---|---|---|
| Method 1 | Method 2 | Method 3 | Method 4 | ||||||
| β | (95% CI) | β | (95% CI) | β | (95% CI) | β | (95% CI) | ||
| 0 day | 9–14 | −0.12 | (−0.21, −0.03) * | −0.00 | (−0.07, 0.07) | −0.01 | (−0.07, 0.06) | −0.02 | (−0.10, 0.06) |
| 15–64 | −0.02 | (−0.06, 0.03) | 0.01 | (−0.03, 0.05) | 0.01 | (−0.02, 0.05) | 0.02 | (−0.02, 0.07) | |
| ≥65 | −0.04 | (−0.10, 0.01) | −0.03 | (−0.09, 0.03) | −0.02 | (−0.07, 0.03) | −0.03 | (−0.09, 0.04) | |
| All | 0.03 | (−0.01, 0.07) | −0.00 | (−0.04, 0.03) | 0.02 | (−0.01, 0.05) | 0.03 | (−0.01, 0.06) | |
| 1 day | 9–14 | −0.09 | (−0.15, −0.03) * | −0.08 | (−0.13, −0.03) * | −0.09 | (−0.14, −0.04) * | −0.11 | (−0.17, −0.04) * |
| 15–64 | −0.04 | (−0.09, 0.01) | 0.01 | (−0.03, 0.05) | −0.02 | (−0.06, 0.03) | −0.02 | (−0.08, 0.03) | |
| ≥65 | 0.00 | (−0.05, 0.06) | −0.03 | (−0.08, 0.03) | −0.00 | (−0.05, 0.04) | −0.01 | (−0.07, 0.05) | |
| All | 0.04 | (−0.00, 0.07) | 0.03 | (−0.00, 0.07) | 0.03 | (−0.01, 0.06) | 0.04 | (0.00, 0.09) | |
| 2 days | 9–14 | −0.10 | (−0.15, −0.05) ** | −0.11 | (−0.16, −0.06) ** | −0.09 | (−0.13, −0.05) ** | −0.11 | (−0.16, −0.06) ** |
| 15–64 | 0.02 | (−0.03, 0.07) | −0.01 | (−0.06, 0.04) | −0.01 | (−0.05, 0.03) | 0.02 | (−0.04, 0.08) | |
| ≥65 | −0.01 | (−0.06, 0.05) | −0.03 | (−0.10, 0.04) | −0.01 | (−0.06, 0.04) | −0.01 | (−0.07, 0.05) | |
| All | 0.07 | (0.03, 0.10) | 0.05 | (0.01, 0.09) | 0.04 | (0.01, 0.07) | 0.07 | (0.03, 0.12) | |
| 0–1 day | 9–14 | −0.11 | (−0.19, −0.04) * | −0.06 | (−0.13, 0.00) | −0.07 | (−0.14, −0.01) * | −0.09 | (−0.17, −0.01) * |
| 15–64 | −0.04 | (−0.09, 0.02) | 0.01 | (−0.03, 0.06) | 0.00 | (−0.04, 0.05) | 0.01 | (−0.05, 0.06) | |
| ≥65 | −0.02 | (−0.08, 0.03) | −0.03 | (−0.10, 0.03) | −0.01 | (−0.06, 0.04) | −0.02 | (−0.09, 0.05) | |
| All | 0.04 | (−0.00, 0.08) | 0.02 | (−0.02, 0.06) | 0.03 | (−0.01, 0.07) | 0.05 | (−0.00, 0.09) | |
| 1–2 days | 9–14 | −0.11 | (−0.17, −0.06) ** | −0.11 | (−0.16, −0.06) ** | −0.10 | (−0.15, −0.05) ** | −0.12 | (−0.18, −0.07) ** |
| 15–64 | −0.02 | (−0.07, 0.04) | 0.00 | (−0.05, 0.06) | −0.02 | (−0.07, 0.03) | −0.00 | (−0.07, 0.06) | |
| ≥65 | −0.00 | (−0.060, 0.057) | −0.04 | (−0.11, 0.03) | −0.01 | (−0.06, 0.04) | −0.01 | (−0.08, 0.06) | |
| All | 0.07 | (0.02, 0.11) | 0.05 | (0.01, 0.10) | 0.05 | (0.01, 0.08) | 0.07 | (0.02, 0.12) | |
| 0–2 days | 9–14 | −0.13 | (−0.20, −0.06) ** | −0.11 | (−0.18, −0.04) * | −0.12 | (−0.18, −0.05) ** | −0.14 | (−0.22, −0.07) ** |
| 15–64 | −0.03 | (−0.09, 0.04) | 0.01 | (−0.05, 0.06) | −0.00 | (−0.06, 0.05) | 0.02 | (−0.05, 0.08) | |
| ≥65 | −0.02 | (−0.08, 0.04) | −0.04 | (−0.12, 0.03) | −0.01 | (−0.07, 0.04) | −0.02 | (−0.09, 0.05) | |
| All | 0.07 | (0.02, 0.11) | 0.04 | (−0.01, 0.08) | 0.05 | (0.01, 0.09) | 0.07 | (0.02, 0.12) | |
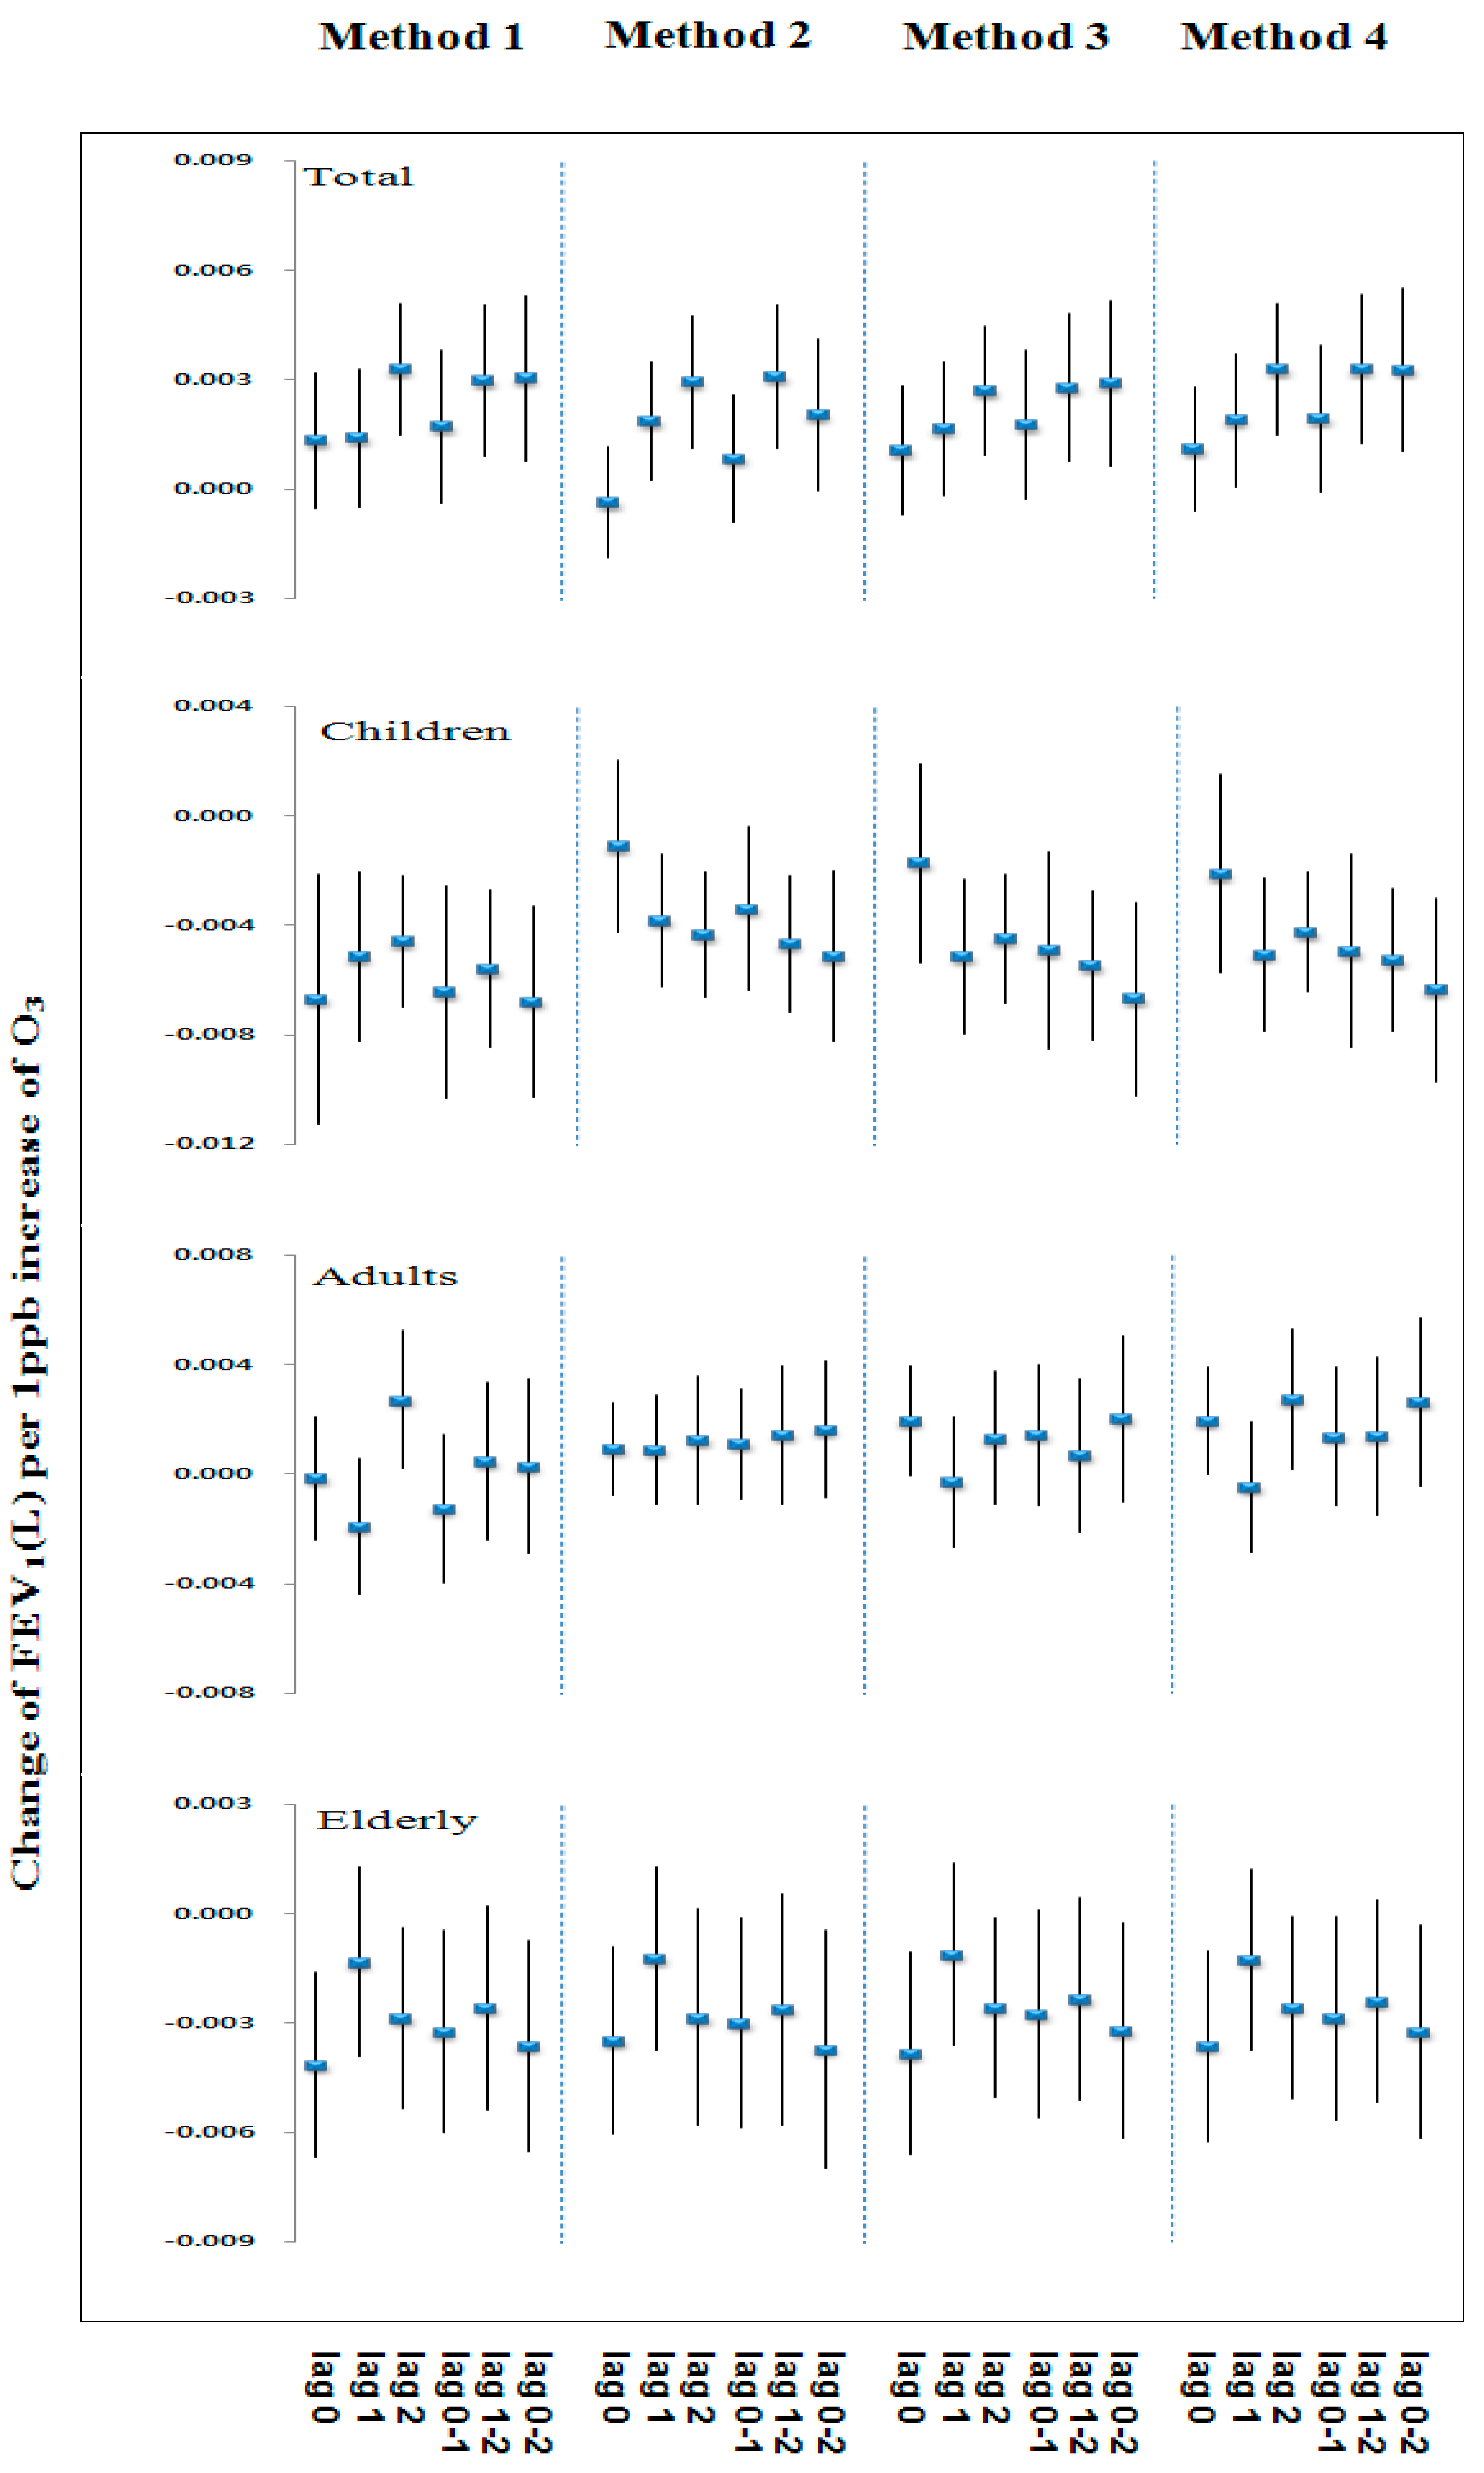
| Lag Day | Age | FEV1 (L) | |||||||
|---|---|---|---|---|---|---|---|---|---|
| Method 1 | Method 2 | Method 3 | Method 4 | ||||||
| β | (95% CI) | β | (95% CI) | β | (95% CI) | β | 95% CI | ||
| 0 day | 9–14 | −0.12 | (−0.20, −0.04) * | −0.02 | (−0.08, 0.04) | −0.03 | (−0.08, 0.03) | −0.04 | (−0.11, 0.03) |
| 15–64 | −0.00 | (−0.04, 0.04) | 0.02 | (−0.01, 0.05) | 0.03 | (−0.00, 0.06) | 0.04 | (0.00, 0.08) | |
| ≥65 | −0.07 | (−0.12, −0.03) * | −0.07 | (−0.11, −0.02) * | −0.06 | (−0.10, −0.02) * | −0.07 | (−0.12, −0.02) * | |
| All | 0.02 | (−0.01, 0.06) | −0.01 | (−0.04, 0.02) | 0.02 | (−0.01, 0.04) | 0.02 | (−0.01, 0.05) | |
| 1 day | 9–14 | −0.09 | (−0.14, −0.04) * | −0.07 | (−0.12, −0.03) * | −0.08 | (−0.12, −0.04) * | −0.10 | (−0.15, −0.04) * |
| 15–64 | −0.03 | (−0.08, 0.01) | 0.02 | (−0.02, 0.06) | −0.00 | (−0.04, 0.03) | −0.01 | (−0.06, 0.04) | |
| ≥65 | −0.02 | (−0.07, 0.02) | −0.02 | (−0.07, 0.03) | −0.02 | (−0.06, 0.02) | −0.02 | (−0.07, 0.02) | |
| All | 0.02 | (−0.01, 0.06) | 0.04 | (0.00, 0.07) | 0.03 | (−0.00, 0.05) | 0.04 | (0.00, 0.07) | |
| 2 days | 9–14 | −0.08 | (−0.12, −0.04) * | −0.08 | (−0.13, −0.04) * | −0.07 | (−0.11, −0.03) * | −0.08 | (−0.13, −0.04) * |
| 15–64 | 0.05 | (0.00, 0.09) | 0.02 | (−0.02, 0.07) | 0.02 | (−0.02, 0.06) | 0.05 | (0.00, 0.10) | |
| ≥65 | −0.05 | (−0.09, −0.01) * | −0.05 | (−0.11, 0.00) | −0.04 | (−0.08, −0.00) * | −0.05 | (−0.10, −0.00) * | |
| All | 0.06 | (0.03, 0.09) | 0.06 | (0.02, 0.09) | 0.04 | (0.01, 0.07) | 0.06 | (0.03, 0.10) | |
| 0–1 day | 9–14 | −0.11 | (−0.18, −0.04) * | −0.06 | (−0.12, −0.01) * | −0.08 | (−0.13, −0.02) * | −0.10 | (−0.16, −0.03) * |
| 15–64 | −0.02 | (−0.07, 0.03) | 0.02 | (−0.02, 0.06) | 0.02 | (−0.02, 0.06) | 0.03 | (−0.02, 0.08) | |
| ≥65 | −0.06 | (−0.10, −0.01) * | −0.06 | (−0.11, −0.00) * | −0.04 | (−0.09, 0.00) | −0.06 | (−0.11, −0.00) * | |
| All | 0.03 | (−0.01, 0.07) | 0.02 | (−0.02, 0.05) | 0.03 | (−0.01, 0.06) | 0.04 | (−0.00, 0.08) | |
| 1–2 days | 9–14 | −0.10 | (−0.15, −0.05) ** | −0.09 | (−0.14, −0.04) * | −0.08 | (−0.13, −0.04) ** | −0.10 | (−0.15, −0.05) ** |
| 15–64 | 0.01 | (−0.04, 0.06) | 0.03 | (−0.02, 0.08) | 0.01 | (−0.03, 0.05) | 0.03 | (−0.03, 0.08) | |
| ≥65 | −0.04 | (−0.09, 0.00) | −0.05 | (−0.11, 0.01) | −0.04 | (−0.08, 0.01) | −0.05 | (−0.10, 0.01) | |
| All | 0.05 | (0.02, 0.09) | 0.06 | (0.02, 0.10) | 0.04 | (0.01, 0.07) | 0.06 | (0.02, 0.10) | |
| 0–2 days | 9–14 | −0.12 | (−0.18, −0.06) ** | −0.10 | (−0.16, −0.04) * | −0.10 | (−0.16, −0.05) * | −0.12 | (−0.19, −0.06) ** |
| 15–64 | 0.01 | (−0.05, 0.06) | 0.03 | (−0.01, 0.08) | 0.03 | (−0.02, 0.08) | 0.05 | (−0.01, 0.11) | |
| ≥65 | −0.06 | (−0.11, −0.01) * | −0.07 | (−0.13, −0.01) * | −0.05 | (−0.09, −0.00) * | −0.06 | (−0.12, −0.01) * | |
| All | 0.05 | (0.01, 0.09) | 0.04 | (−0.00, 0.08) | 0.04 | (0.01, 0.08) | 0.06 | (0.02, 0.11) | |
© 2016 by the authors; licensee MDPI, Basel, Switzerland. This article is an open access article distributed under the terms and conditions of the Creative Commons Attribution (CC-BY) license (http://creativecommons.org/licenses/by/4.0/).
Share and Cite
Jung, S.-W.; Lee, K.; Cho, Y.-S.; Choi, J.-H.; Yang, W.; Kang, T.-S.; Park, C.; Kim, G.-B.; Yu, S.-D.; Son, B.-S. Association by Spatial Interpolation between Ozone Levels and Lung Function of Residents at an Industrial Complex in South Korea. Int. J. Environ. Res. Public Health 2016, 13, 728. https://doi.org/10.3390/ijerph13070728
Jung S-W, Lee K, Cho Y-S, Choi J-H, Yang W, Kang T-S, Park C, Kim G-B, Yu S-D, Son B-S. Association by Spatial Interpolation between Ozone Levels and Lung Function of Residents at an Industrial Complex in South Korea. International Journal of Environmental Research and Public Health. 2016; 13(7):728. https://doi.org/10.3390/ijerph13070728
Chicago/Turabian StyleJung, Soon-Won, Kyoungho Lee, Yong-Sung Cho, Ji-Hee Choi, Wonho Yang, Tack-Shin Kang, Choonghee Park, Geun-Bae Kim, Seung-Do Yu, and Bu-Soon Son. 2016. "Association by Spatial Interpolation between Ozone Levels and Lung Function of Residents at an Industrial Complex in South Korea" International Journal of Environmental Research and Public Health 13, no. 7: 728. https://doi.org/10.3390/ijerph13070728
APA StyleJung, S.-W., Lee, K., Cho, Y.-S., Choi, J.-H., Yang, W., Kang, T.-S., Park, C., Kim, G.-B., Yu, S.-D., & Son, B.-S. (2016). Association by Spatial Interpolation between Ozone Levels and Lung Function of Residents at an Industrial Complex in South Korea. International Journal of Environmental Research and Public Health, 13(7), 728. https://doi.org/10.3390/ijerph13070728