
Radionuclides (210Po and 210Pb) and Some Heavy Metals in Fish and Sediments in Lake Bafa, Turkey, and the Contribution of 210Po to the Radiation Dose

Abstract
:1. Introduction
2. Materials and Methods
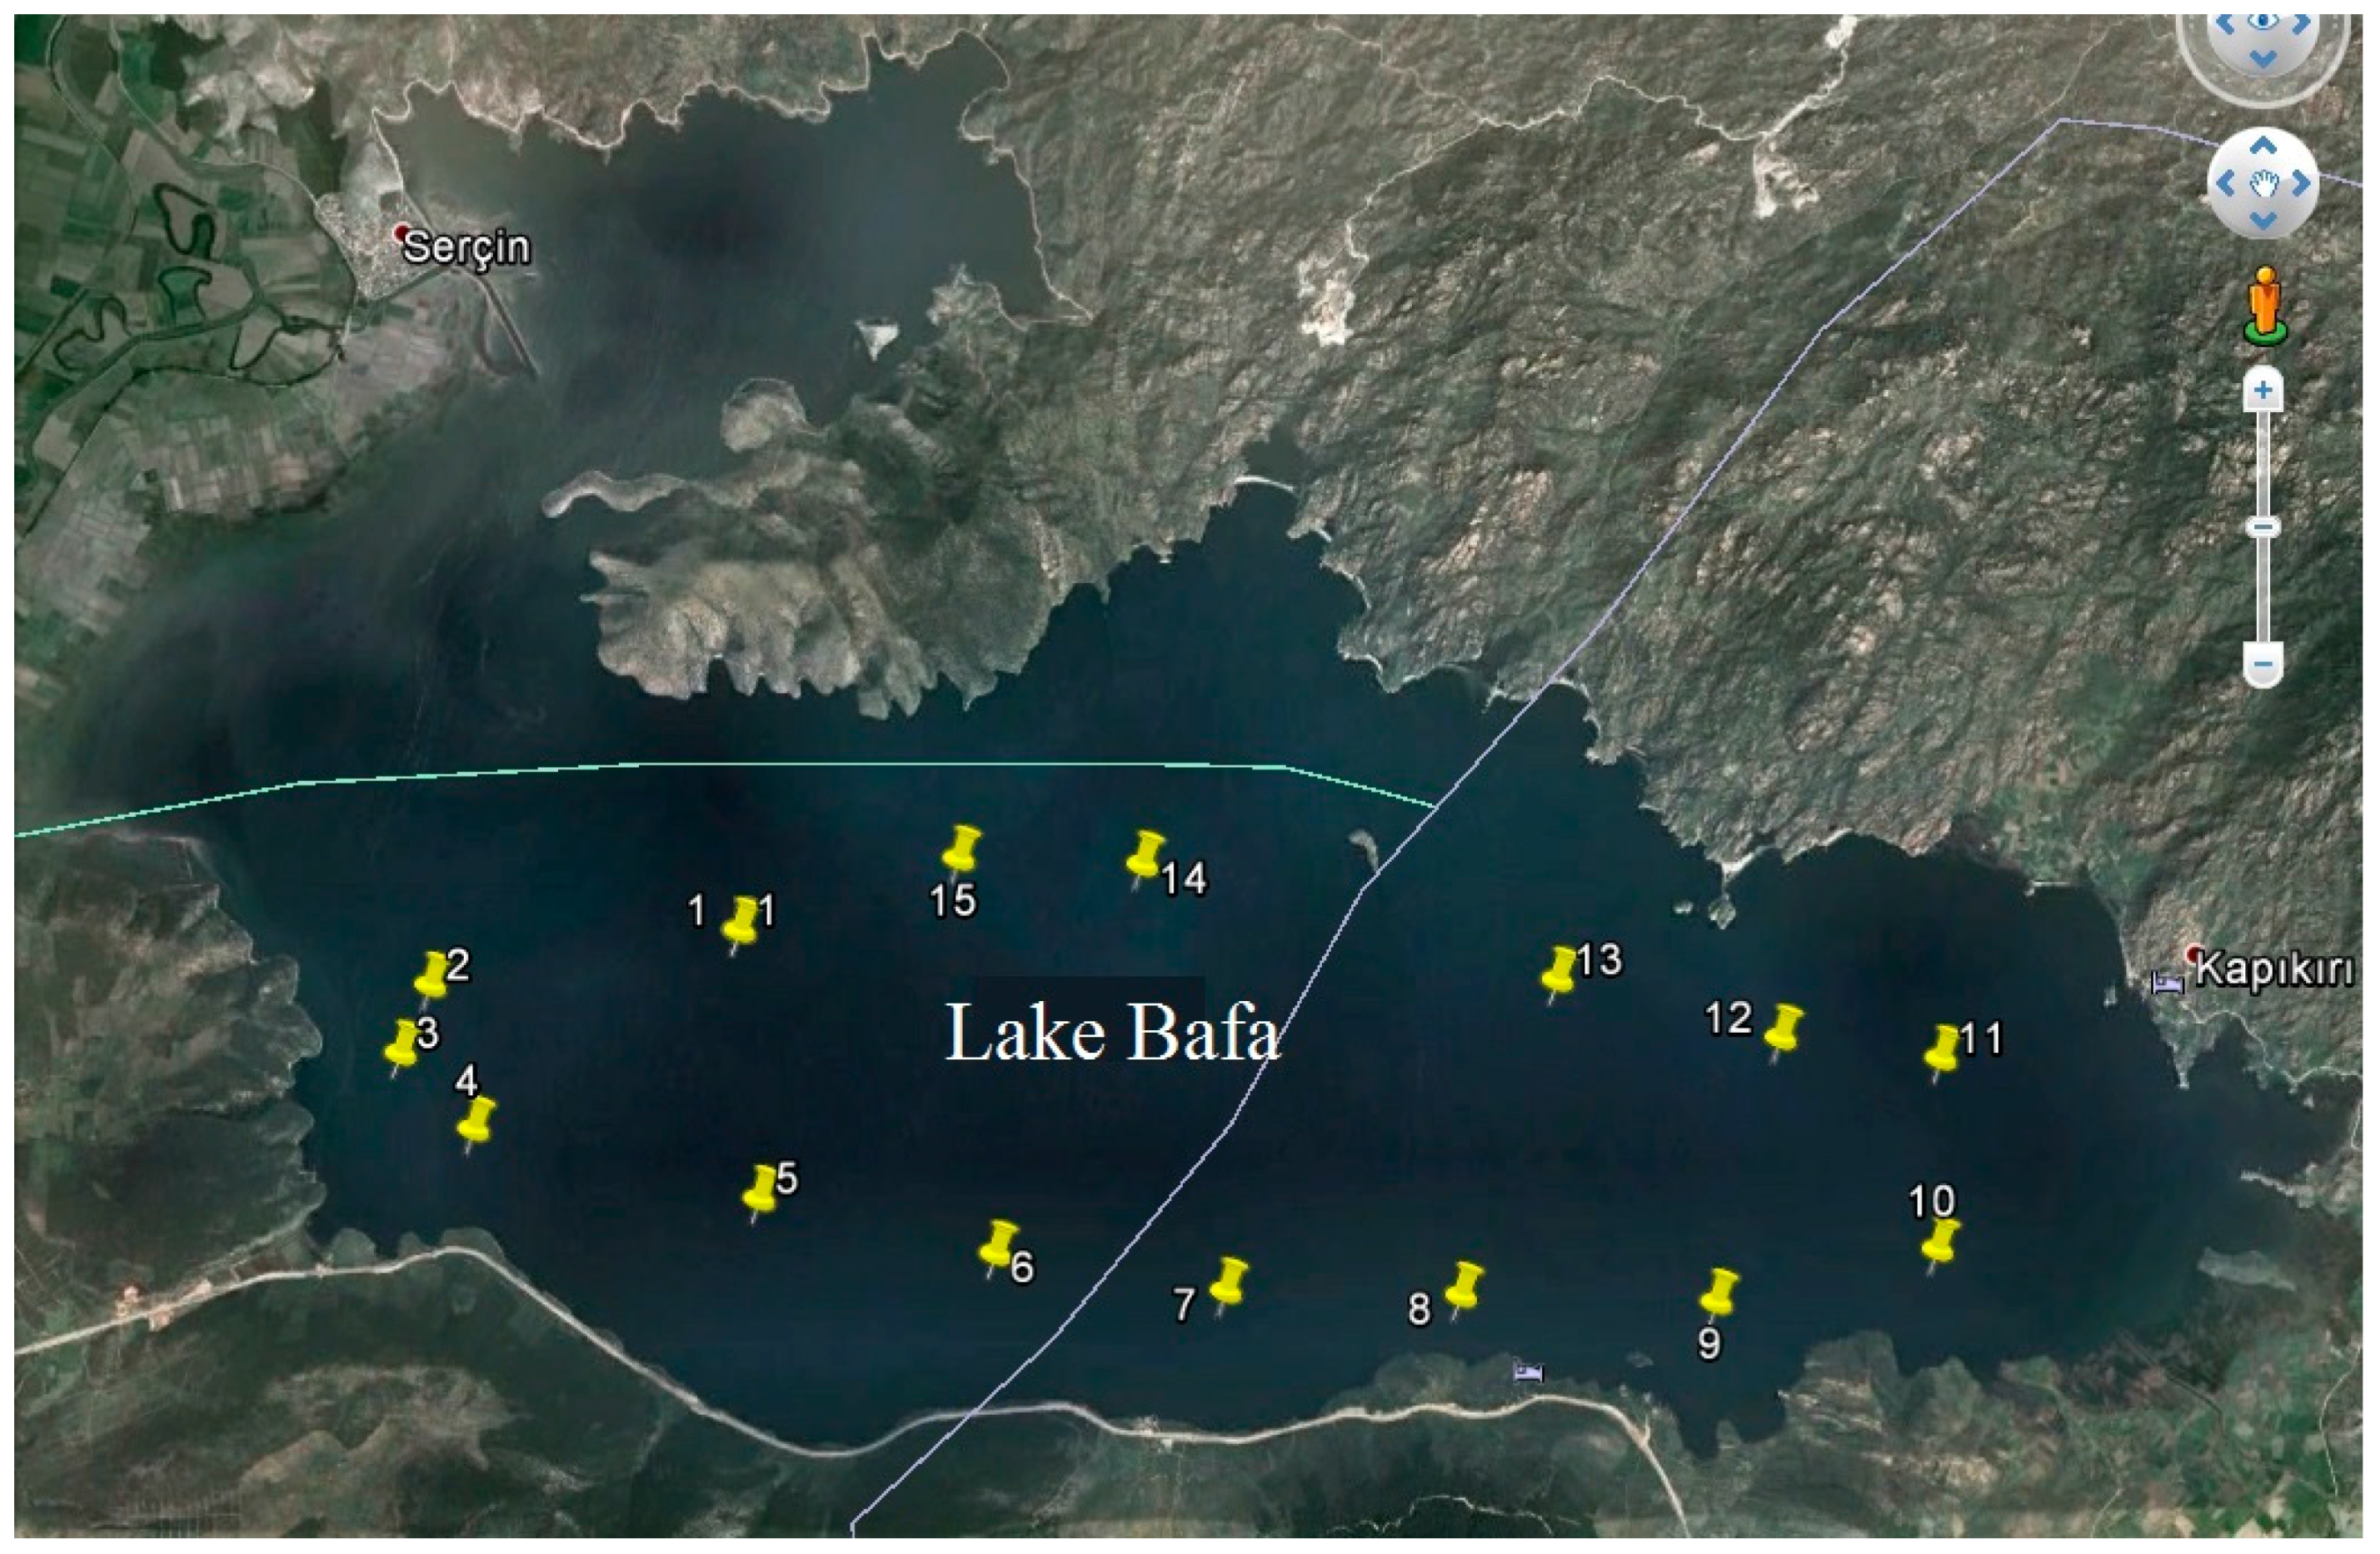
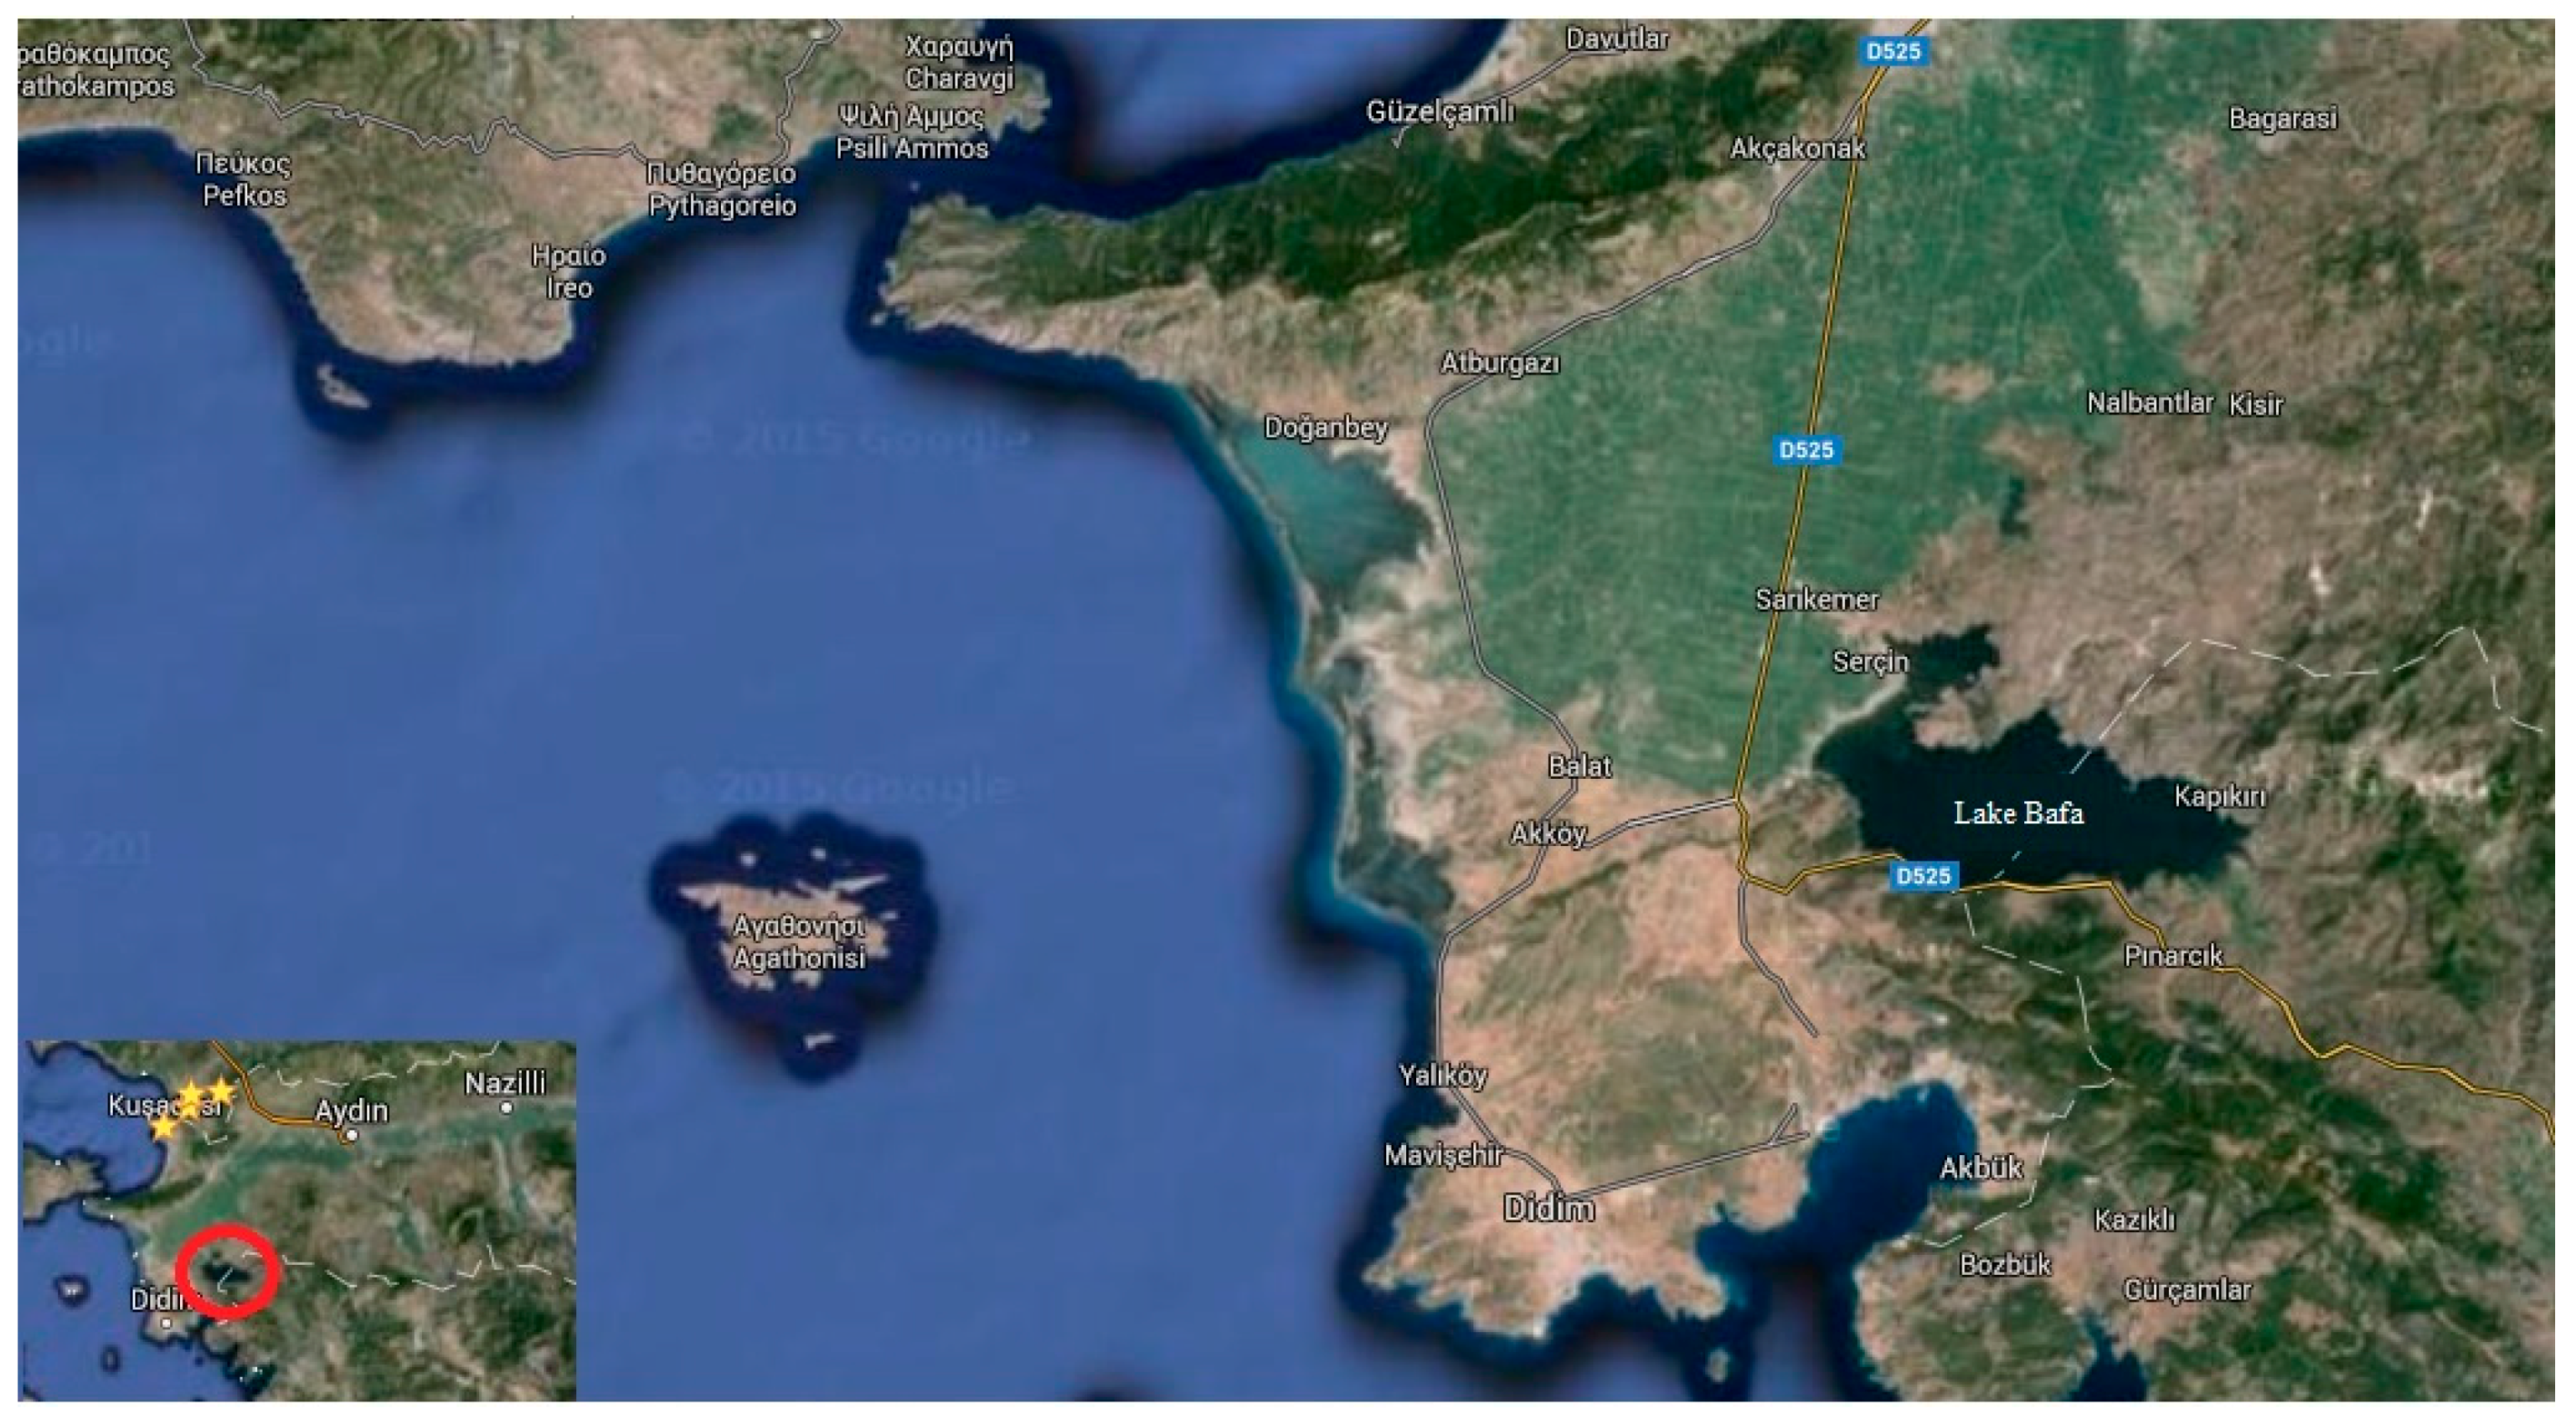
2.1. Study Area
2.2. Sampling
3. Laboratory Analysis
3.1. Alpha Spectrometric Analysis for 210Pb
3.2. Dose Calculations
3.3. Heavy Metal Analysis
4. Results and Discussion
4.1. Fish Samples
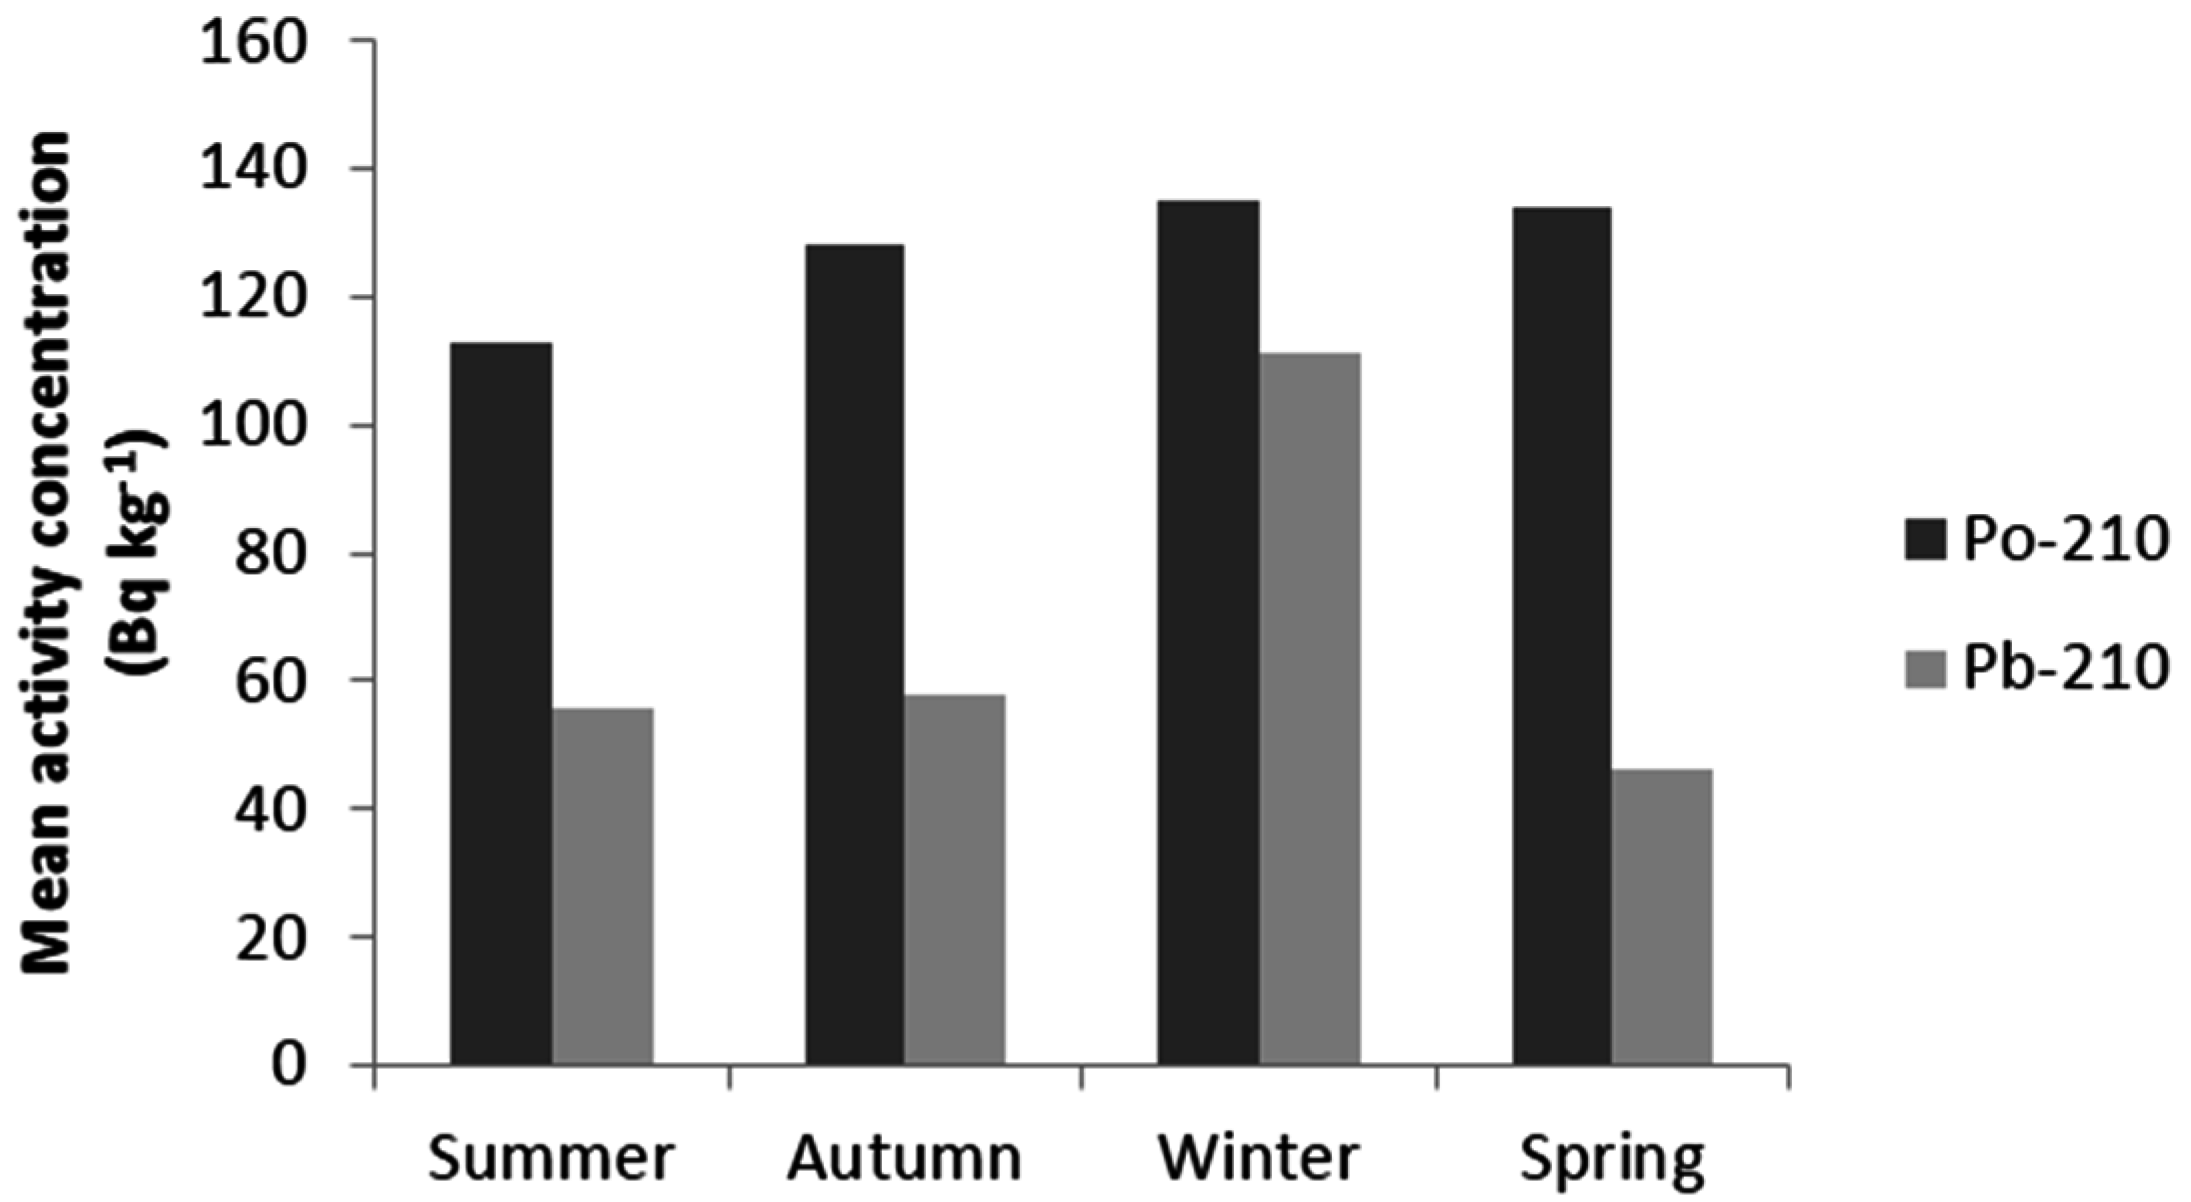
4.2. Surface Sediment
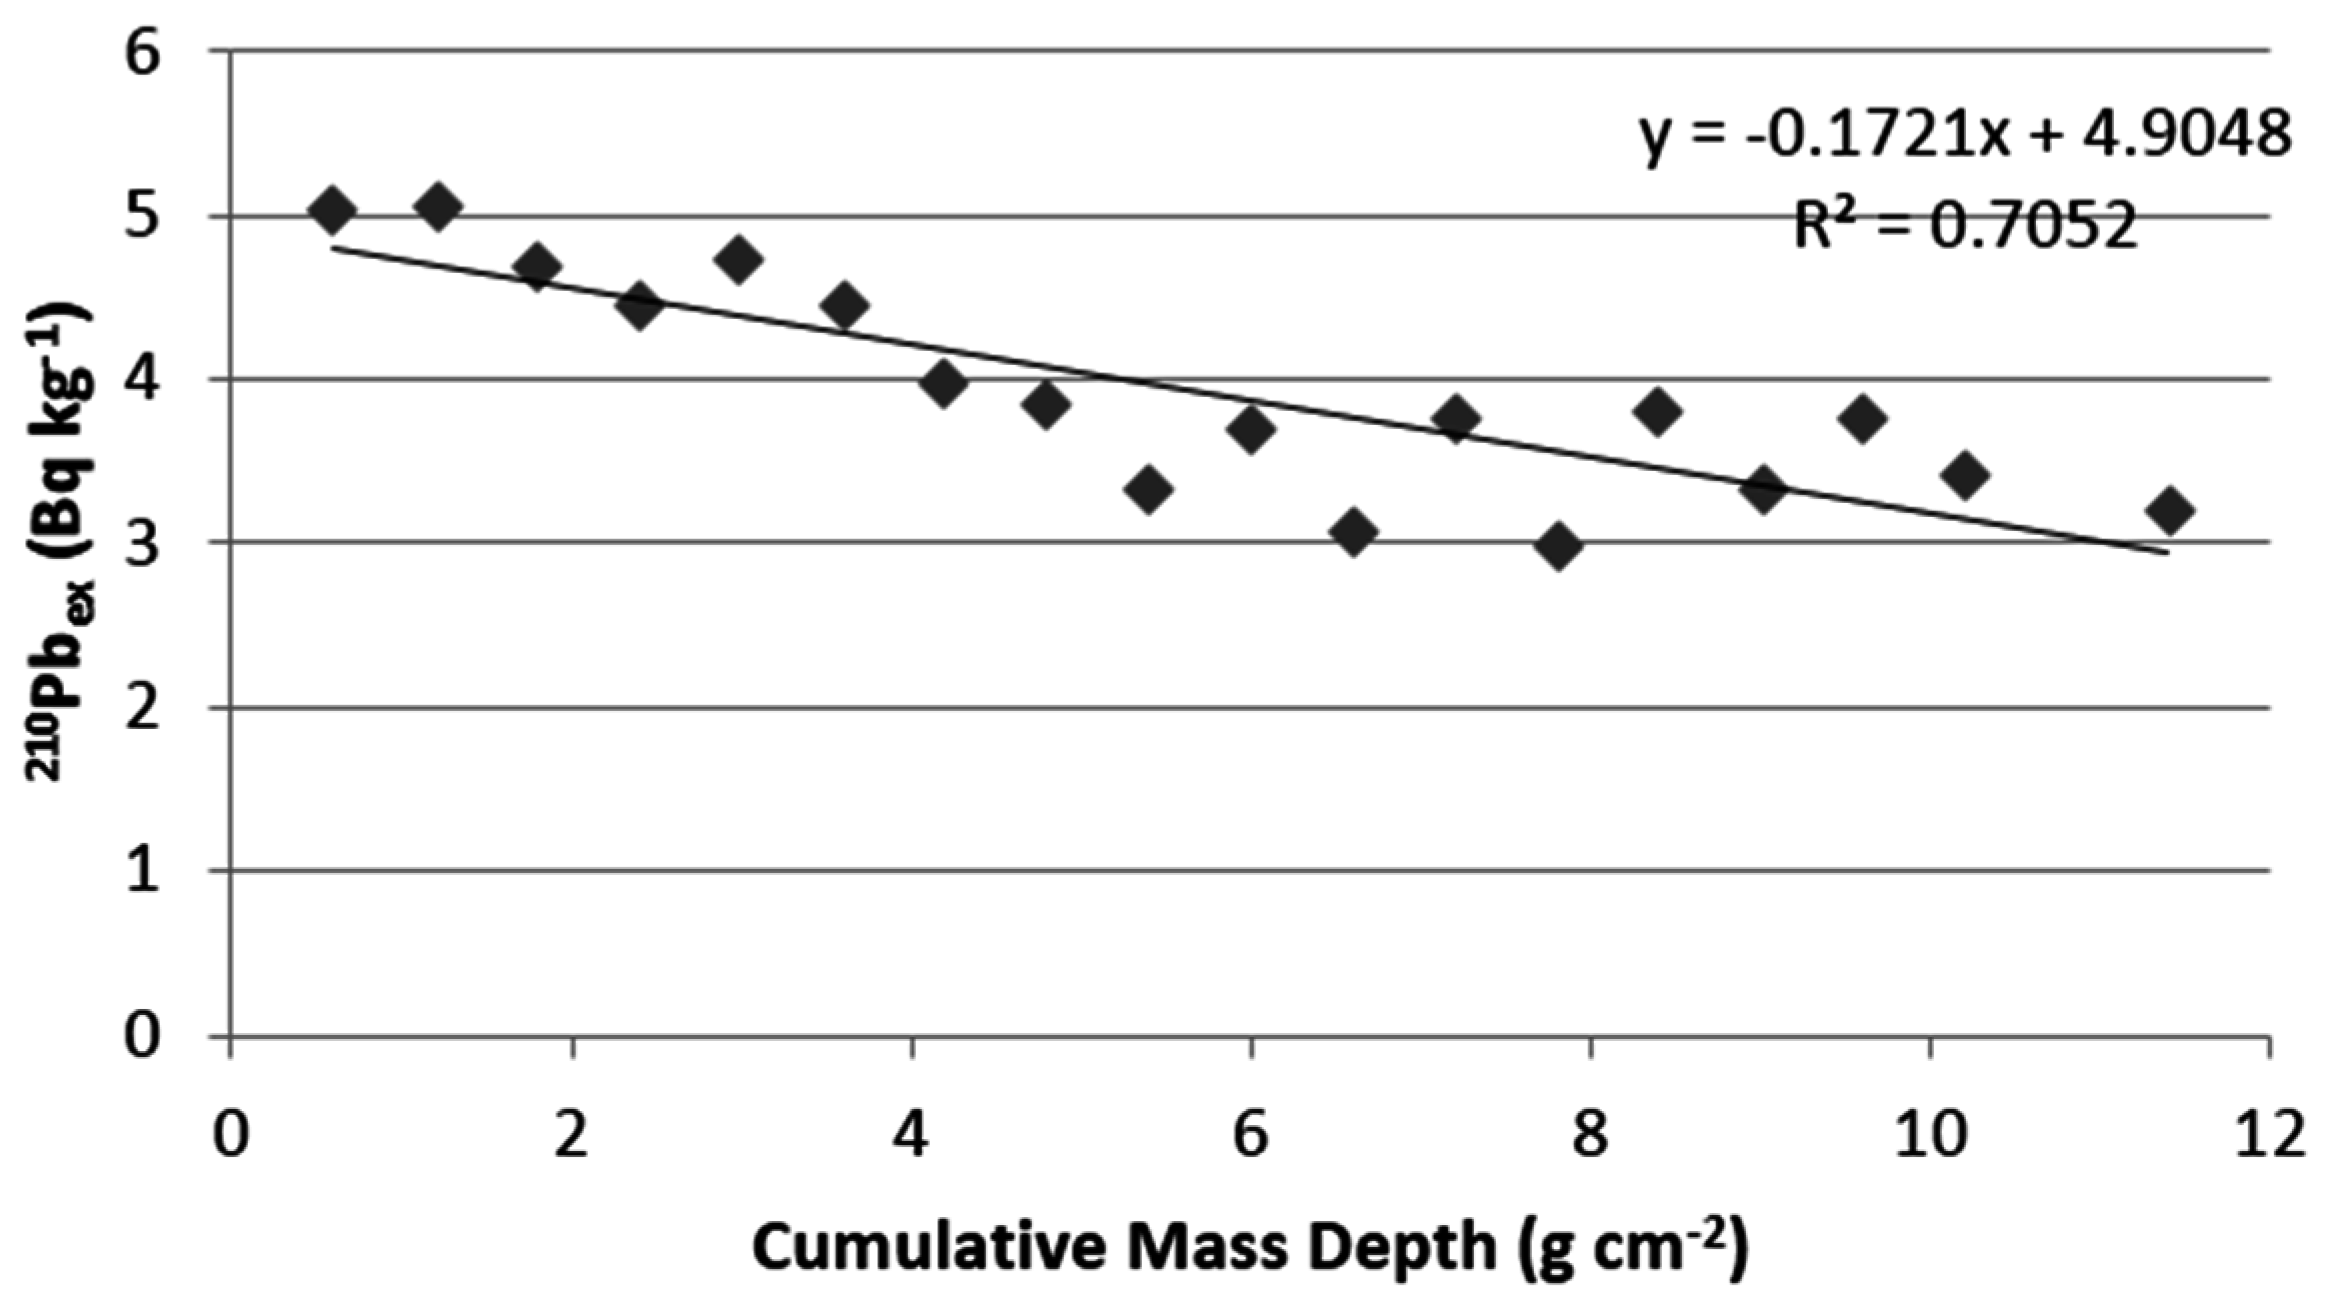
4.3. Core Sample
5. Conclusions
Acknowledgments
Author Contributions
Conflicts of Interest
References
- Kazancı, N.; Dugel, M. Possible Climate Change Impacts on the Benthic Macroinvertebrate Fauna of Büyük Menderes River in the Mediterranean Climate Region of Turkey; Meander, 13: 7–11; Newsletter of the SIL Working Group on the Conservation and Management of Running Waters: Edinburg, TX, USA, 2006. [Google Scholar]
- Hu, X.; Wang, C.; Zou, L. Characteristics of heavy metals and Pb isotopic signatures in sediment cores collected from typical urban shallow lakes in Nanjing, China. J. Environ. Manag. 2011, 92, 742–748. [Google Scholar] [CrossRef] [PubMed]
- Nriagu, J.O. A silent epidemic of environmental metal poisoning? Environ. Pollut. 1988, 50, 139–161. [Google Scholar] [CrossRef]
- Carvalho, F.P. Polonium (210Po) and lead (210Pb) in marine organisms and their transfer in marine food chains. J. Environ. Radioact. 2011, 102, 462–472. [Google Scholar] [CrossRef] [PubMed]
- Singare, P.U.; Bhattacharjee, S.S.; Lokhande, R.S. Analysis of the heavy metal pollutants in sediment samples collected from Thane Creek of Maharashtra, India. Int. J. Sustain. Soc. 2013, 5, 296–308. [Google Scholar] [CrossRef]
- Müllenhoff, M.; Handl, M.; Knipping, M.; Brückner, H. The evolution of Lake Bafa (Western Turkey)—Sedimentological, microfaunal and palynological results. Coastline Rep. 2004, 1, 55–66. [Google Scholar]
- Google Maps. Available online: https://www.google.com.tr/maps/@37.542055,27.1870309,55051m/data=!3m1!1e3?hl=tr (accessed on 12 August 2016).
- Google Maps. Available online: https://www.google.com.tr/maps/@37.5082215,27.4481662,12.75z?hl=tr (accessed on 12 August 2016).
- Cetnar, J. General solution of Bateman equations for nuclear transmutations. Ann. Nucl. Energy 2006, 33, 640–645. [Google Scholar] [CrossRef]
- Fowler, S.W. 210Po in the marine environment with emphasis on its behaviour within the biosphere. J. Environ. Radioact. 2011, 102, 448–461. [Google Scholar] [CrossRef] [PubMed]
- International Atomic Energy Agency (IAEA). Sources of Radioactivity in the Marine Environment and Their Relative Contributions to Overall Dose Assessment from Marine Radioavtivity (MRA DOS); IAEA-TECDOC-838; International Atomic Energy Agency: Vienna, Austria, 1995. [Google Scholar]
- Çatal, E.M.; Uğur, A.; Özden, B.; Filizok, I. 210Po and 210Pb variations in fish species from the Aegean Sea and the contribution of 210Po to the radiation dose. Mar. Pollut. Bull. 2012, 64, 801–806. [Google Scholar] [CrossRef] [PubMed]
- Microwave Digestion of Ashes. Available online: http://www.analiticaweb.com.br/downloads/literaturas/aplication_report_microwave_environment.pdf (accessed on 5 August 2016).
- Sandroni, V.; Smith, C.M.; Donovan, A. Microwave digestion of sediment, soils and urban particulate matter for trace metal analysis. Talanta 2003, 60, 715–723. [Google Scholar] [CrossRef]
- Štrok, M.; Smodis, B. Levels of 210Po and 210Pb in fish and molluscs in Slovenia and the related dose assessment to the population. Chemosphere 2011, 82, 970–976. [Google Scholar] [CrossRef] [PubMed]
- Malta, M.; Oliveira, J.M.; Silva, L.; Carvalho, F.P. Radioactivity from Lisboa urban wastewater discharges in the Tejo River Estuary. J. Integr. Coast. Zone Manag. 2013, 13, 399–408. [Google Scholar] [CrossRef]
- Al-Masri, M.S.; Mamish, S.; Budeir, Y.; Nashwati, A. 210Po and 210Pb concentrations in fish consumed in Syria. J. Environ. Radioact. 2000, 49, 345–352. [Google Scholar] [CrossRef]
- United Nations Scientific Committee on the Effects of Atomic Radiation (UNSCEAR). Ionizing Radiation: Sources and Biological Effects; UNSCEAR: New York, NY, USA, 1982. [Google Scholar]
- Kalantzi, I.; Shimmield, T.M.; Pergantis, S.A.; Papageorgiou, N.; Black, K.D.; Karakassis, I. Heavy metals, trace elements and sediment geochemistry at four Mediterranean fish farms. Sci. Total Environ. 2013, 444, 128–137. [Google Scholar] [CrossRef] [PubMed]
- Cid, B.P.; Boia, C.; Pombo, L.; Rebelo, E. Determination of trace metals in fish species of the Ria de Aveiro (Portugal) by electrothermal atomic absorption spectrometry. Food Chem. 2001, 75, 93–100. [Google Scholar]
- Olmedo, P.; Pla, A.; Hernández, A.F.; Barbier, F.; Ayouni, L.; Gil, F. Determination of toxic elements (mercury, cadmium, lead, tin and arsenic) in fish and shellfish samples. Risk assessment for the consumers. Environ. Int. 2013, 59, 63–72. [Google Scholar] [PubMed]
- Uysal, K.; Emre, Y.; Köse, E. The determination of heavy metal accumulation ratios in muscle, skin and gills of some migratory fish species by inductively coupled plasma-optical emission spectrometry (ICP-OES) in Beymelek Lagoon (Antalya/Turkey). Microchem. J. 2008, 90, 67–70. [Google Scholar] [CrossRef]
- Blasco, J.; Arias, A.M.; Saenz, V. Heavy metals in organisms of the River Guadalquivir estuary: Possible incidence of the Aznalcollar disaster. Sci. Total Environ. 1999, 242, 249–259. [Google Scholar] [CrossRef]
- Usero, J.; Izquierdo, C.; Morillo, J.; Gracia, I. Heavy metals in fish (Solea vulgaris, Anguilla anguilla and Liza aurata) from salt marshes on the southern Atlantic coast of Spain. Environ. Int. 2004, 29, 949–956. [Google Scholar] [CrossRef]
- Uğur, A.; Özden, B.; Filizok, I. Determination of 210Po and 210Pb concentrations in atmospheric deposition in İzmir (Aegean sea-Turkey). Atmos. Environ. 2011, 45, 4809–4813. [Google Scholar] [CrossRef]
- Jin, G.; Onodera, S.; Saito, M.; Maruyama, Y.; Hayakawa, A.; Sato, T.; Ota, Y.; Aritomi, D. Vertical distribution of sediment phosphorus in Lake Hachirogata related to the effect of land reclamation on phosphorus accumulation. Environ. Technol. 2016, 37, 486–494. [Google Scholar] [CrossRef] [PubMed]
- Klump, J.V.; Weckerly, K.; Edgington, D.; Anderson, P.; Szmania, D.; Waples, J.; Eadie, J.D. Historical sedimentation rate determinations in lake Erie. In Proceedings of the Lake Erie Millennium Network Conference, Windsor, ON, Canada, 28 February–2 March 2006; Volume 28.
- National Health and Environmental Effects Research Laboratory Atlantic Ecology Division (AED). Mid-Atlantic Integrated Assessment (MAIA) Estuaries 1997–1998; U.S. Environmental Protection Agency Region III: Philadelphia, PA, USA, 2002; pp. 41–45.
- Scottish Pollutant Release Inventory (SPRI). Nickel. Available online: http://apps.sepa.org.uk/spripa/Pages/SubstanceInformation.aspx?pid=108 (accessed on 12 August 2016).
- Aarkrog, A.; Baxter, M.S.; Bettencourt, A.O.; Bojanowski, R.; Bologa, A.; Charmasson, S.; Cunha, I.; Delfanti, R.; Duran, E.; Holm, E.; et al. A comparison of doses from 137Cs and 210Po in marine food, a major international study. J. Environ. Radioact. 1997, 34, 69–90. [Google Scholar] [CrossRef]
- Pollard, D.; Ryan, T.P.; Dowdall, A. The dose to Irish seafood consumers from 210Po. Radiat. Prot. Dosim. 1998, 75, 139–142. [Google Scholar] [CrossRef]
- Nielsen, S.P.; Bengston, P.; Bojanowsky, R.; Hagel, P.; Herrmann, J.; Ilus, E.; Jakobson, E.; Motiejunas, S.; Panteleev, Y.; Skujina, A.; et al. The radiological exposure of man from radioactivity in the Baltic Sea. Sci. Total Environ. 1999, 237, 133–141. [Google Scholar] [CrossRef]
- Jia, G.; Belli, M.; Sansone, U.; Rosamilia, S.; Blasi, M. 210Pb and 210Po concentrations in the Venice lagoon ecosystem (Italy) and the potential radiological impact to the local public and environment. J. Radioanal. Nucl. Chem. 2003, 256, 513–528. [Google Scholar] [CrossRef]


| Species | Area | Cr | Ni | Pb | Cd | Mn | Fe | Zn | Reference |
|---|---|---|---|---|---|---|---|---|---|
| Seabass (D. labrax) | Aegean Sea 1 | ND | ND | ND | 5.49 | 6.38 | Kalantzi et al. [19] | ||
| Aegean Sea 2 | 0.19 | ND | ND | ND | 5.39 | Kalantzi et al. [19] | |||
| Portugal | 0.0007 | 0.000038 | 0.0062 | 11.24 | Cid et al. [20] | ||||
| Spain | 0.004 | 0.002 | Olmedo et al. [21] | ||||||
| Lake Bafa | 0.42 | 0.72 | 0.12 | 0.01 | 1.28 | 8.71 | 8.53 | This study | |
| Mullet (L. ramada) | Antalya | ND | ND | 0.28 | 7.13 | 12.28 | Uysal et al. [22] | ||
| River Guadalguivir | 0.07–0.26 | 0.03–0.06 | 0–0.003 | 0–0.97 | 5.6–15.1 | 4.4–21.5 | Blasco et al. [23] | ||
| Lake Bafa | 0.21 | 0.78 | 0.14 | 0.03 | 1.0 | 8.26 | 13.6 | This study | |
| Eel (A. anguilla) | Portugal (Sao Jacinto) | 0.200–0.394 | 0.0541–0.0783 | 0.0109–0.0411 | 19.7–23.1 | Cid et al. [20] | |||
| Portugal (Torreira) | 0.157–0.187 | 0.0440–0.0564 | 0.0109–0.0423 | 14.0–21.7 | Cid et al. [20] | ||||
| Portugal (Barra) | 0.387 | 0.0526 | 0.0089 | 20.8 | Cid et al. [20] | ||||
| Portugal (Gafanha) | 0.200 | 0.0744 | 0.0258 | 20.7 | Cid et al. [20] | ||||
| Spain (Bacuta) | 0.209 | 0.016 | 0.09 | 14.1 | 4.93 | 11.4 | Usero et al. [24] | ||
| Spain (Liebre) | 0.143 | 0.015 | 0.05 | 13.1 | 4.11 | 11.0 | Usero et al. [24] | ||
| Spain (San Carlos) | 0.364 | 0.015 | 0.05 | 6.8 | 5.89 | 10.1 | Usero et al. [24] | ||
| Spain (San Juan) | 0.368 | 0.020 | 0.03 | 4.71 | 5.19 | 13.0 | Usero et al. [24] | ||
| Lake Bafa | 0.84 | 1.43 | 0.17 | 0.04 | 2.61 | 11.36 | 29.9 | This study |
| Fish Species | Dose (µSv·y−1) |
|---|---|
| Seabass (D. labrax) | 0.208 |
| Mullet (L. ramada) | 1.169 |
| Eel (A. anguilla) | 0.011 |
| Sample | 210Po:210Pb | |||
|---|---|---|---|---|
| Spring | Summer | Autumn | Winter | |
| 1 | 3.38 | 2.36 | 1.40 | 1.07 |
| 2 | 2.71 | 2.34 | 2.05 | 1.01 |
| 3 | 2.42 | 2.21 | 1.69 | 1.16 |
| 4 | 2.16 | 1.82 | 2.61 | 1.15 |
| 5 | 3.25 | 2.94 | 2.54 | 1.17 |
| 6 | 3.36 | 2.72 | 2.05 | 0.85 |
| 7 | 4.48 | 1.65 | 2.02 | 1.20 |
| 8 | 4.37 | 1.60 | 1.62 | 1.15 |
| 9 | 1.93 | 2.00 | 2.62 | 1.24 |
| 10 | 2.25 | 1.65 | 2.93 | 1.63 |
| 11 | 1.69 | 1.74 | 1.98 | 1.38 |
| 12 | 4.28 | 1.49 | 2.62 | 1.55 |
| 13 | 2.28 | 1.59 | 3.66 | 1.21 |
| 14 | 3.04 | 2.02 | 3.10 | 1.33 |
| 15 | 3.58 | 1.78 | 1.80 | 1.38 |
| Depth (cm) | Cumulative Depth (g·cm−2) | 210Pbex (Bq·kg−1) | Year |
|---|---|---|---|
| 0.6 | 0.45 | 150.66 | 2011 |
| 1.2 | 0.83 | 158.91 | 2008 |
| 1.8 | 1.21 | 107.75 | 2006 |
| 2.4 | 1.61 | 84.74 | 2005 |
| 3.0 | 2.03 | 114.96 | 2002 |
| 3.6 | 2.45 | 85.90 | 2000 |
| 4.2 | 2.88 | 54.10 | 1998 |
| 4.8 | 3.30 | 46.80 | 1997 |
| 5.4 | 3.72 | 27.50 | 1995 |
| 6.0 | 4.14 | 40.77 | 1994 |
| 6.6 | 4.50 | 21.30 | 1992 |
| 7.2 | 4.90 | 43.20 | 1990 |
| 7.8 | 5.31 | 19.75 | 1989 |
| 8.4 | 5.69 | 44.80 | 1987 |
| 9.0 | 6.06 | 27.77 | 1985 |
| 9.6 | 6.43 | 42.26 | 1983 |
| 10.2 | 6.81 | 29.81 | 1980 |
| 11.4 | 7.54 | 24.48 | 1978 |
| 12.6 | 8.33 | 0.00 | 1976 |
| 13.8 | 9.09 | 0.00 | 1974 |
| 15.0 | 9.77 | 18.61 | 1972 |
| 16.2 | 10.47 | 47.66 | 1970 |
| 17.4 | 11.16 | 0.26 | 1966 |
| 18.6 | 11.83 | 0.00 | 1964 |
| 19.8 | 12.48 | 11.96 | 1962 |
| 21.0 | 13.12 | 0.00 | 1959 |
| 22.2 | 13.78 | 0.00 | 1957 |
| 23.4 | 14.46 | 0.00 | 1954 |
| 24.6 | 15.14 | 4.75 | 1951 |
| 25.8 | 15.84 | 8.11 | 1947 |
| 27 | 16.51 | 11.73 | 1943 |
| 28.2 | 17.21 | 0.00 | 1937 |
| 29.4 | 17.86 | 6.73 | 1935 |
| 30.6 | 18.55 | 2.78 | 1928 |
| 31.8 | 19.27 | 13.46 | 1919 |
| 33 | 19.94 | 0.00 | 1905 |
| Depth (cm) | Heavy Metal Concentrations (ppm) | ||||||
|---|---|---|---|---|---|---|---|
| Fe | Zn | Mn | Pb | Cd | Cr | Ni | |
| 1.50 | 36,266.95 | 78.84 | 703.08 | 17.28 | 0.18 | 259.20 | 307.80 |
| 3.00 | 41,345.43 | 89.88 | 759.70 | 12.84 | 0.13 | 267.50 | 334.91 |
| 4.50 | 35,972.55 | 78.20 | 644.00 | 8.28 | 0.09 | 214.36 | 297.16 |
| 6.00 | 38,944.19 | 84.66 | 686.46 | 14.28 | 0.15 | 239.70 | 389.64 |
| 7.50 | 36,515.36 | 79.38 | 685.02 | 13.72 | 0.14 | 222.46 | 393.96 |
| 9.00 | 32,264.89 | 70.14 | 713.42 | 16.03 | 0.17 | 235.47 | 393.79 |
| 13.00 | 31,050.47 | 67.50 | 676.80 | 13.50 | 0.14 | 250.20 | 420.30 |
| 16.00 | 35,107.73 | 76.32 | 779.10 | 19.08 | 0.20 | 288.32 | 457.92 |
| 19.00 | 33,465.51 | 72.75 | 744.96 | 12.61 | 0.13 | 249.29 | 459.78 |
| 26.00 | 31,423.08 | 68.31 | 721.71 | 8.91 | 0.09 | 244.53 | 346.50 |
| Metal | ERL a,b | ERM a,b |
|---|---|---|
| Cadmium (Cd) | 1.2 | 9.6 |
| Chromium (Cr) | 81 | 370 |
| Lead (Pb) | 47 | 220 |
| Nickel (Ni) | 21 | 52 |
| Zinc (Zn) | 150 | 410 |
© 2016 by the authors; licensee MDPI, Basel, Switzerland. This article is an open access article distributed under the terms and conditions of the Creative Commons Attribution (CC-BY) license (http://creativecommons.org/licenses/by/4.0/).
Share and Cite
Manav, R.; Uğur Görgün, A.; Filizok, I. Radionuclides (210Po and 210Pb) and Some Heavy Metals in Fish and Sediments in Lake Bafa, Turkey, and the Contribution of 210Po to the Radiation Dose. Int. J. Environ. Res. Public Health 2016, 13, 1113. https://doi.org/10.3390/ijerph13111113
Manav R, Uğur Görgün A, Filizok I. Radionuclides (210Po and 210Pb) and Some Heavy Metals in Fish and Sediments in Lake Bafa, Turkey, and the Contribution of 210Po to the Radiation Dose. International Journal of Environmental Research and Public Health. 2016; 13(11):1113. https://doi.org/10.3390/ijerph13111113
Chicago/Turabian StyleManav, Ramazan, Aysun Uğur Görgün, and Işık Filizok. 2016. "Radionuclides (210Po and 210Pb) and Some Heavy Metals in Fish and Sediments in Lake Bafa, Turkey, and the Contribution of 210Po to the Radiation Dose" International Journal of Environmental Research and Public Health 13, no. 11: 1113. https://doi.org/10.3390/ijerph13111113
APA StyleManav, R., Uğur Görgün, A., & Filizok, I. (2016). Radionuclides (210Po and 210Pb) and Some Heavy Metals in Fish and Sediments in Lake Bafa, Turkey, and the Contribution of 210Po to the Radiation Dose. International Journal of Environmental Research and Public Health, 13(11), 1113. https://doi.org/10.3390/ijerph13111113