
Prevalence and Correlates of Prehypertension and Hypertension among Adults in Northeastern China: A Cross-Sectional Study

 , ,
, ,
Abstract
:1. Introduction
2. Experimental Section
2.1. Subjects
2.2. Data Collection
2.3. Blood Pressure Measurement and Classification
2.4. Other Variable Measurements and Classification
2.5. Statistical Analysis
3. Results
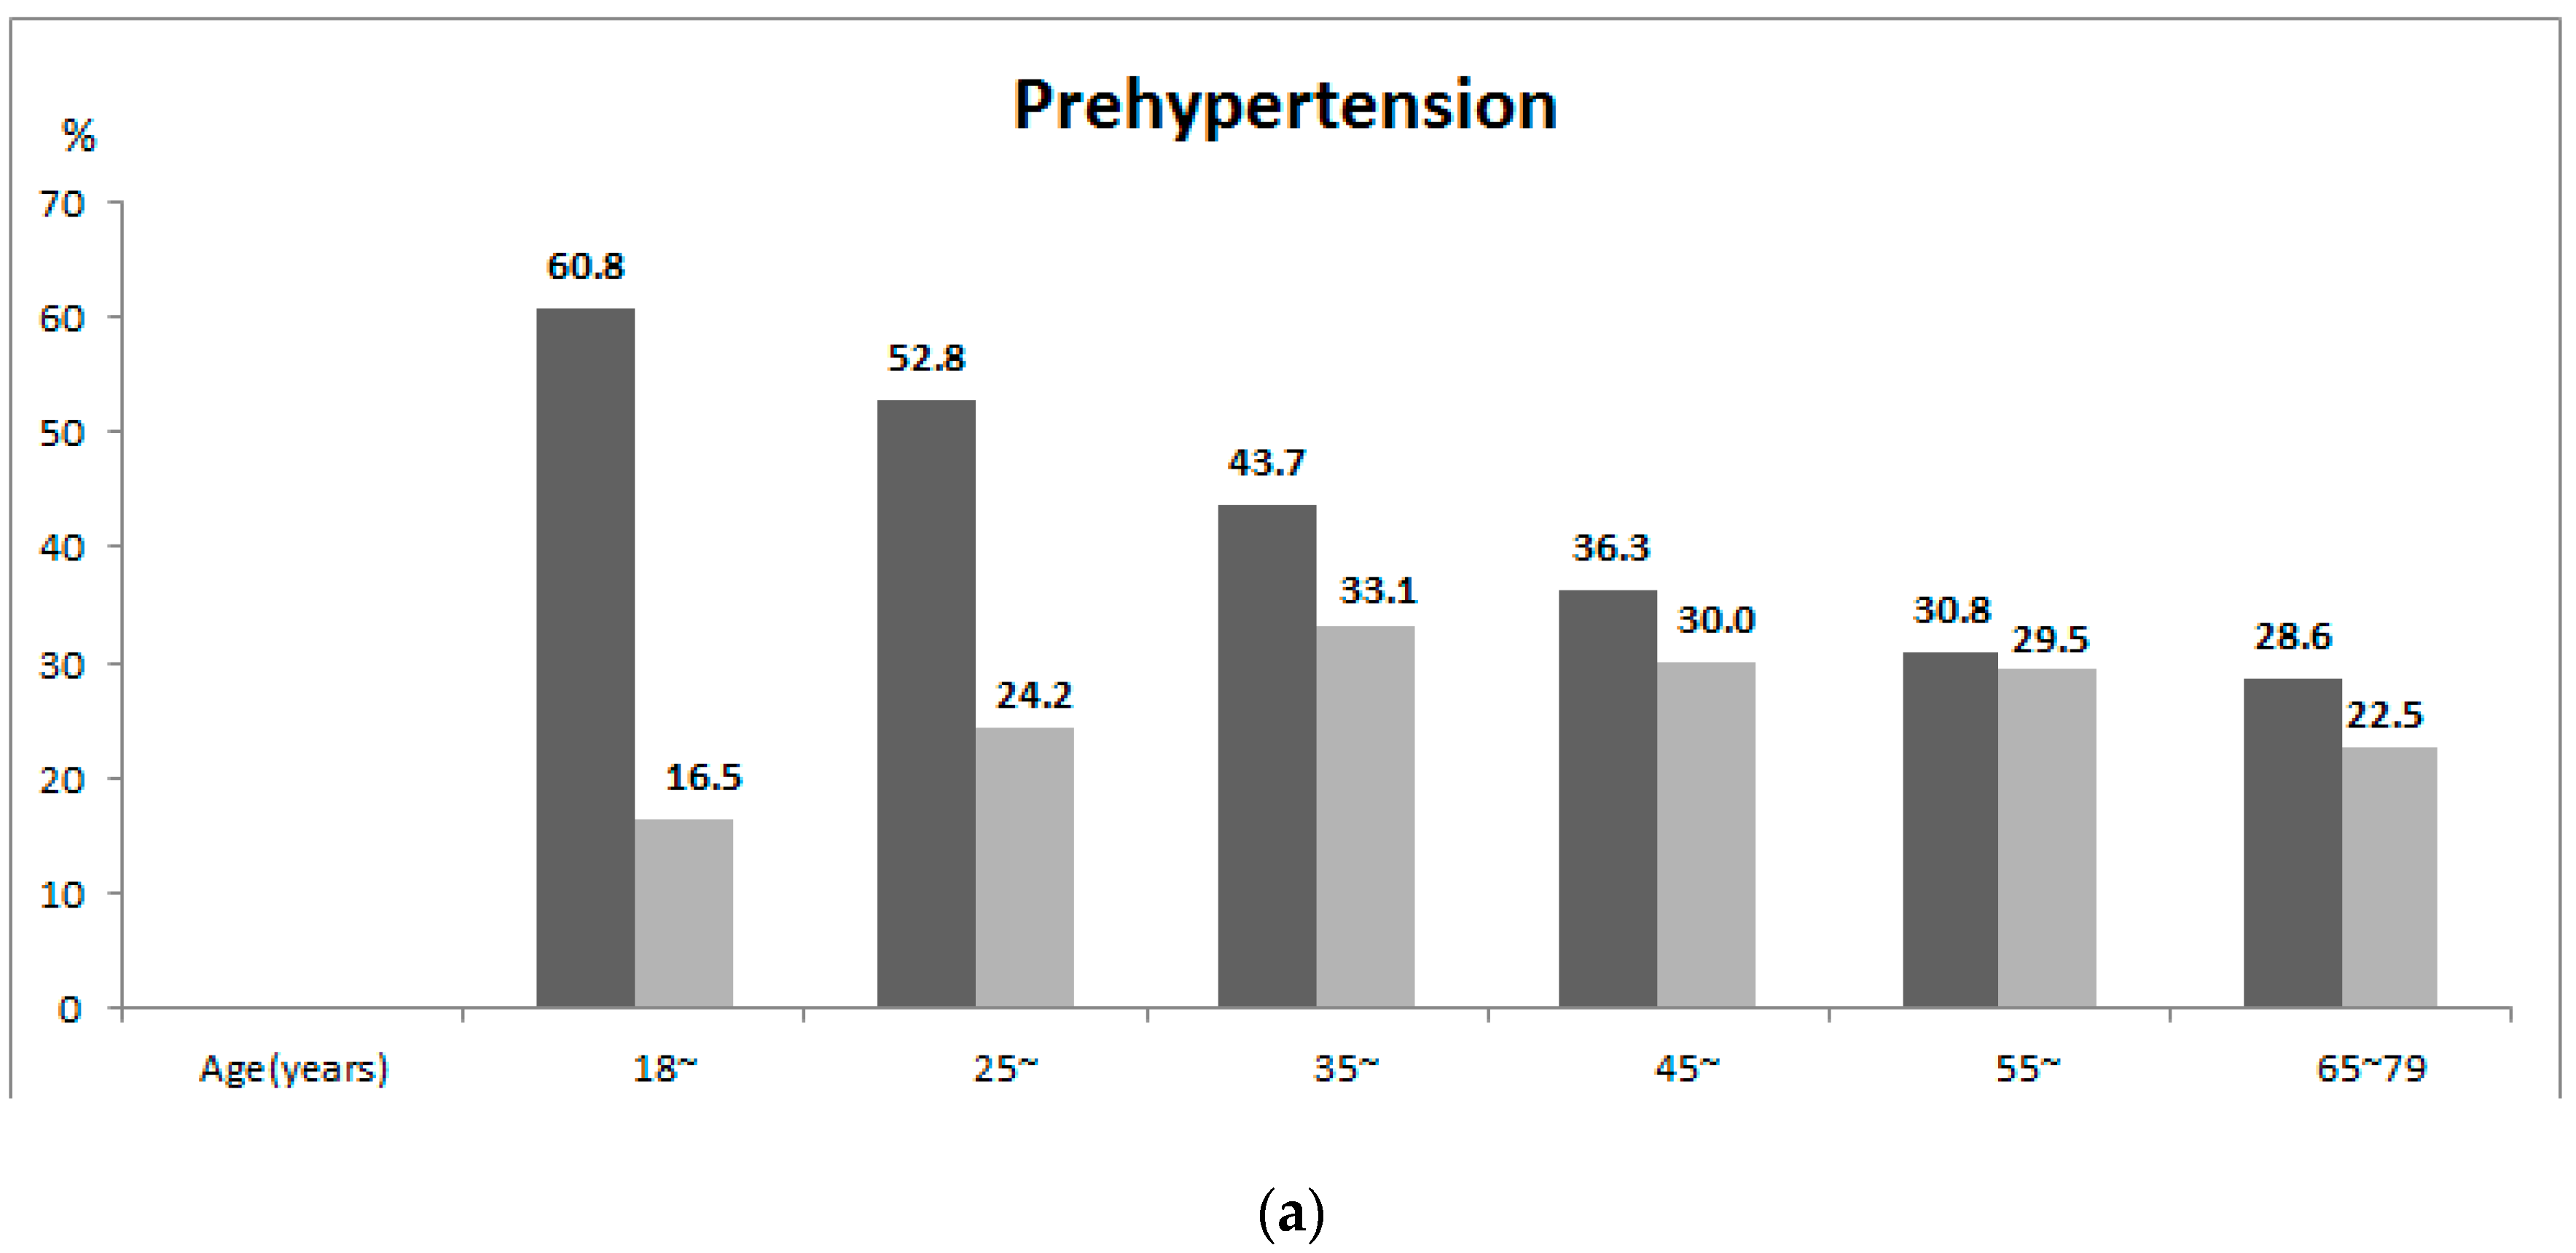
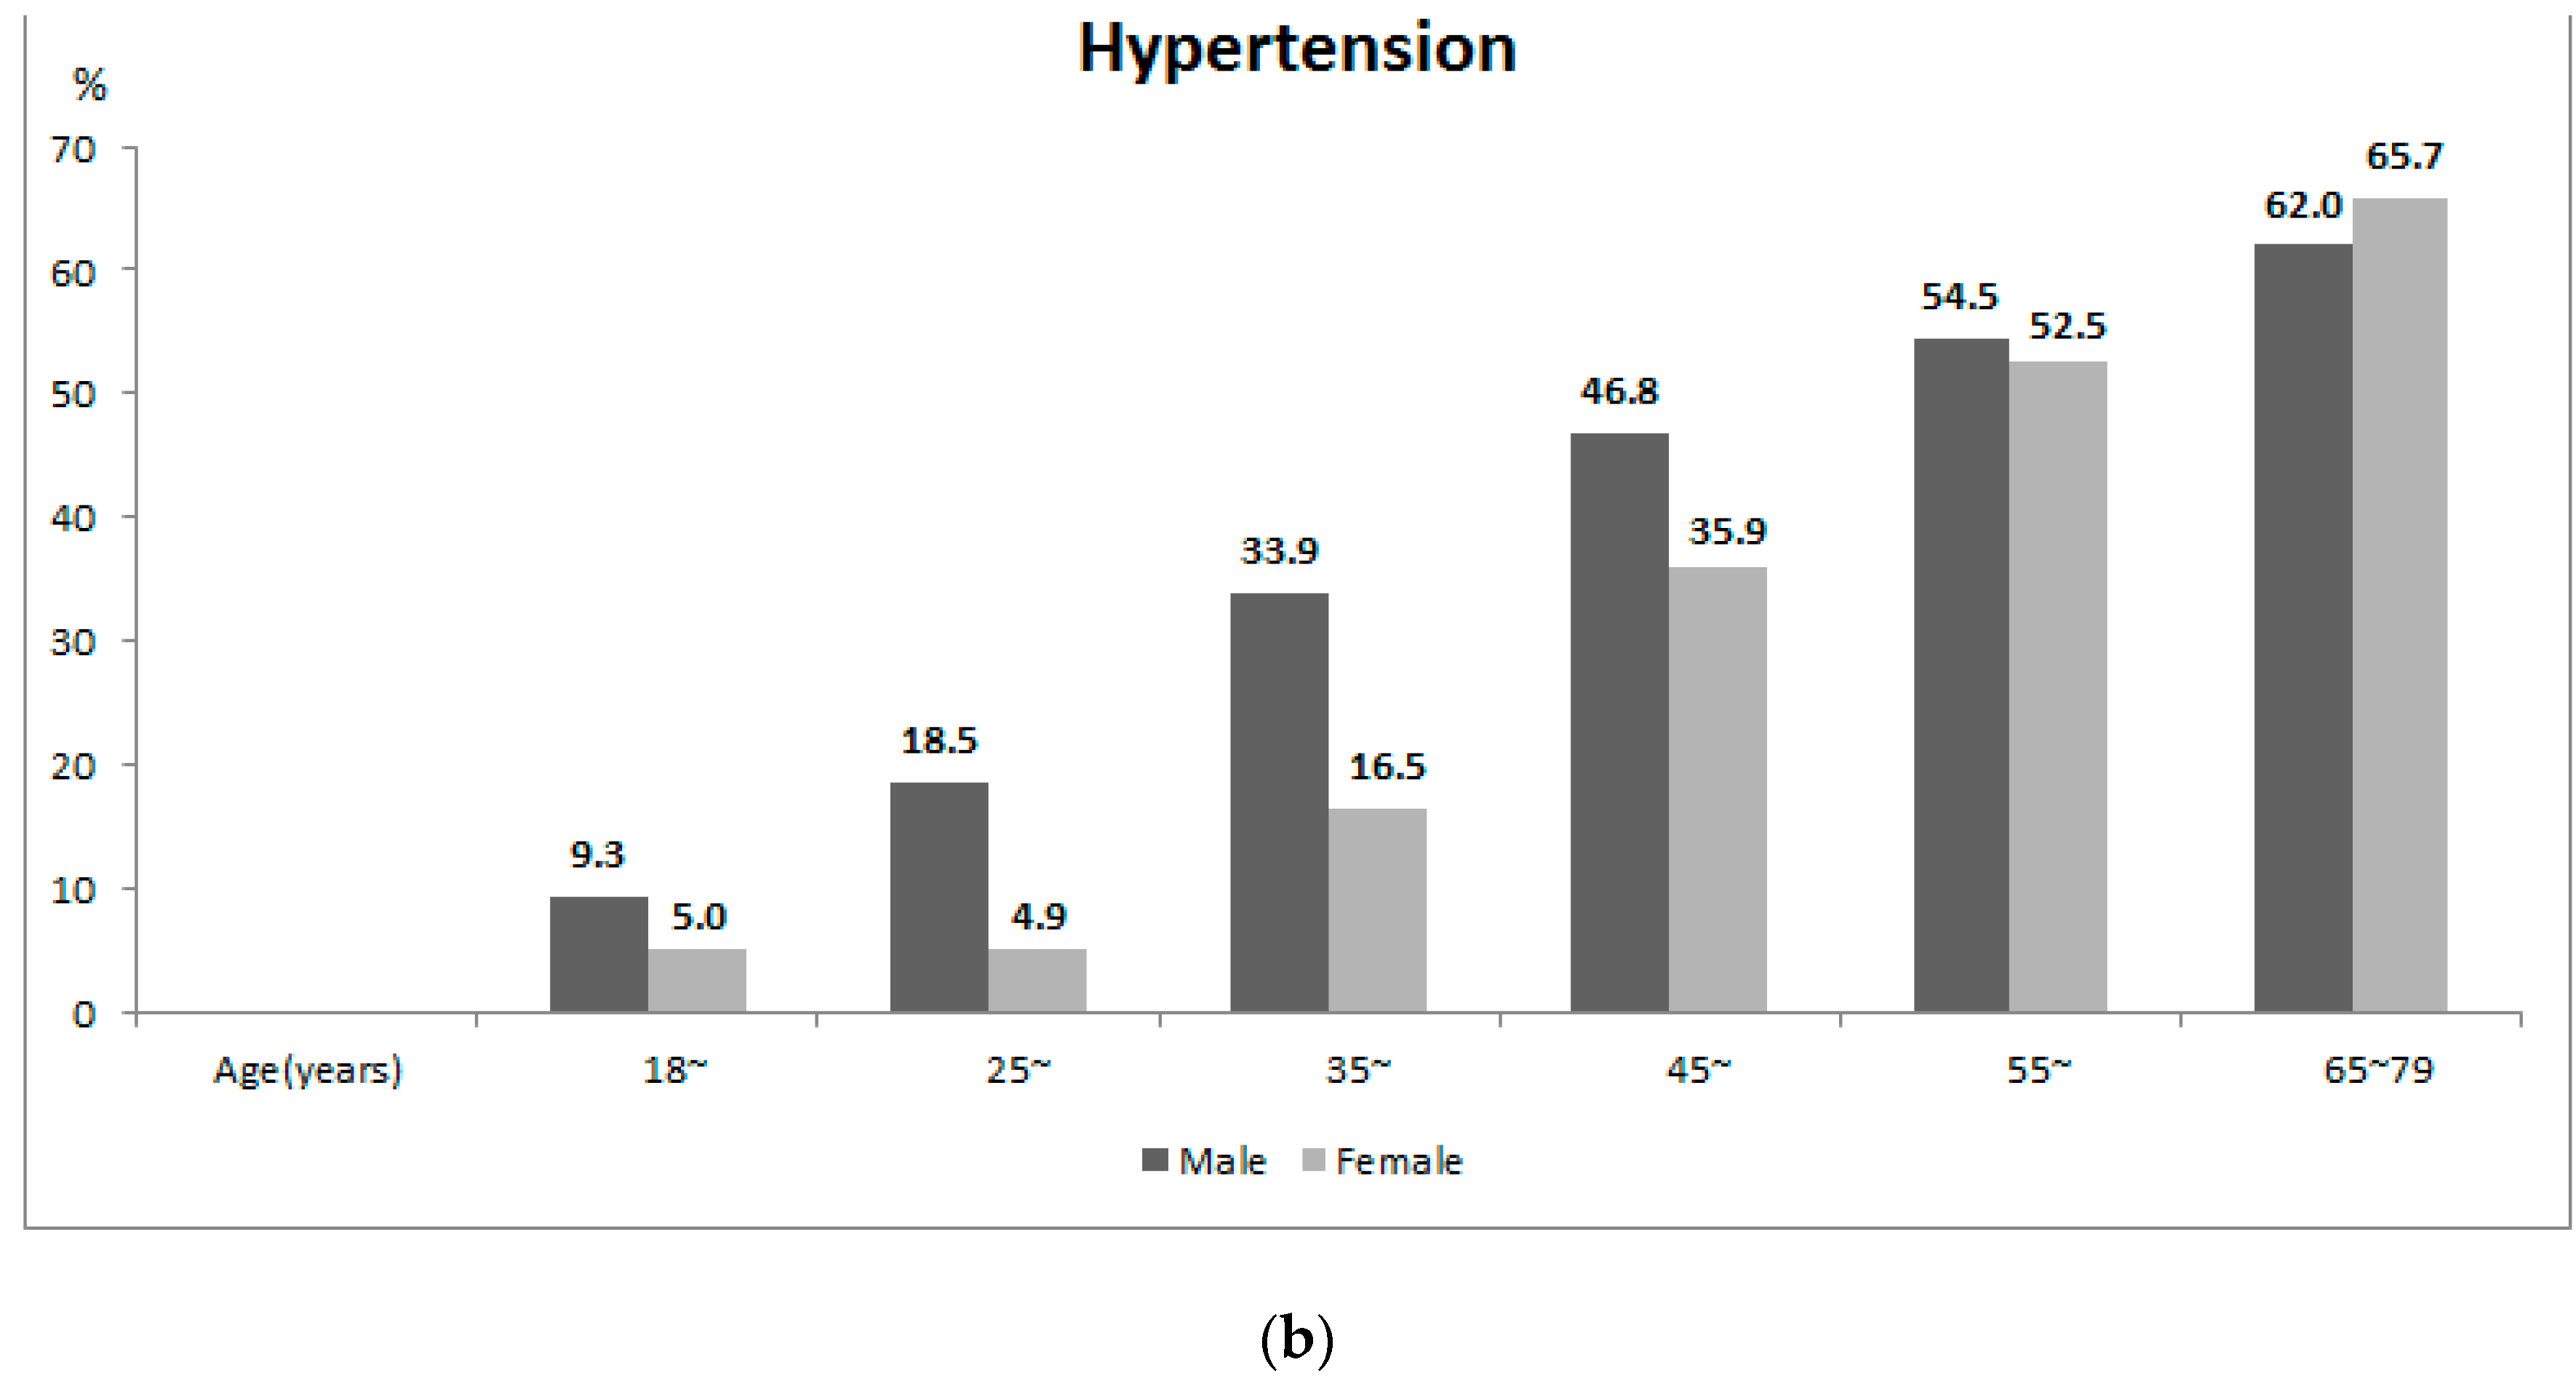
3.1. Prevalence of Prehypertension and Hypertension

| Variables | N | Prehypertension | Hypertension | χ2 | p | ||
|---|---|---|---|---|---|---|---|
| n | PR (95%CI) | n | PR (95%CI) | ||||
| Total | 17,584 | 6036 | 36.0 (35.0–37.0) | 6540 | 30.8 (29.9–31.6) | ||
| Age (years) | |||||||
| 18–24 | 841 | 355 | 39.8 (35.3–44.5) | 71 | 7.1 (5.2–9.7) | 151.734 | <0.001 |
| 25–34 | 2213 | 904 | 40.5 (37.8–43.1) | 261 | 12.6 (10.8–14.7) | ||
| 35–44 | 3964 | 1498 | 38.5 (36.9–40.2) | 955 | 25.4 (23.9–27.0) | ||
| 45–54 | 4822 | 1637 | 34.3 (32.9–35.7) | 1977 | 41.4 (40.0–42.9) | ||
| 55–64 | 3919 | 1182 | 30.1 (28.6–31.7) | 2099 | 53.5 (51.8–55.2) | ||
| 65–79 | 1825 | 460 | 25.5 (22.9–28.3) | 1177 | 63.9 (60.9–66.7) | ||
| Gender | |||||||
| Female | 9488 | 2808 | 27.9 (26.7–29.2) | 3216 | 26.4 (25.3–27.5) | 12.443 | <0.001 |
| Male | 8096 | 3228 | 43.5 (42.0–45.0) | 3324 | 34.9 (33.5–36.2) | ||
| Location | |||||||
| Urban | 8944 | 3032 | 34.9 (33.6–36.2) | 3140 | 30.4 (29.2–31.6) | 0.542 | 0.462 |
| Rural | 8640 | 3004 | 37.3 (35.7–38.8) | 3400 | 31.3 (30.0–32.6) | ||
| Ethnicity | |||||||
| Han | 16,223 | 5565 | 35.9 (34.9–37.0) | 6059 | 30.8 (29.9–31.8) | 0.214 | 0.643 |
| Other | 1361 | 471 | 36.4 (32.8–40.2) | 481 | 29.9 (26.7–33.3) | ||
| Educational status (years) | |||||||
| Primary school or below | 5345 | 1719 | 34.0 (32.3–35.8) | 2394 | 39.8 (38.1–41.5) | 30.972 | <0.001 |
| Middle school | 5010 | 1723 | 35.7 (33.8–37.5) | 1875 | 31.4 (29.8–33.1) | ||
| High school | 4520 | 1613 | 37.2 (35.1–39.3) | 1583 | 29.4 (27.8–31.1) | ||
| Undergraduate and above | 2709 | 981 | 37.0 (34.6–39.6) | 688 | 20.9 (19.0–23.0) | ||
| Marital status | |||||||
| Married | 15,136 | 5170 | 35.3 (34.3–36.3) | 5744 | 32.9 (32.0–33.8) | 37.802 | <0.001 |
| Unmarried | 2448 | 866 | 38.6 (35.6–41.7) | 796 | 22.2 (20.0–24.5) | ||
| Occupation | |||||||
| Manual | 9962 | 3635 | 38.5 (37.2–39.9) | 3479 | 29.0 (27.9–30.1) | 87.142 | <0.001 |
| Brain | 3363 | 1183 | 36.2 (33.8–38.6) | 969 | 22.8 (21.1–24.6) | ||
| Retired/unemployed | 4259 | 1218 | 29.0 (27.2–31.0) | 2092 | 44.3 (42.3–46.3) | ||
| Family income per capita (¥) | |||||||
| <500 | 3586 | 1174 | 34.8 (32.8–36.8) | 1585 | 38.7 (36.8–40.6) | 17.348 | <0.001 |
| 500– | 3683 | 1247 | 35.0 (32.8–37.2) | 1449 | 33.7 (31.7–35.7) | ||
| 1000– | 5868 | 1989 | 35.0 (33.3–36.7) | 2082 | 29.4 (27.9–30.9) | ||
| 2000– | 4447 | 1626 | 38.4 (36.4–40.4) | 1424 | 26.4 (24.8–28.1) | ||
| Variables | Rural, n (%) 2 | Urban, n (%) 2 | χ2 | p |
|---|---|---|---|---|
| Total | 8640 (100.0) | 8944 (100.0) | ||
| Age (years) | 52.164 | 0.002 | ||
| 18–24 | 266 (14.0) | 575 (13.3) | ||
| 25–34 | 817 (18.1) | 1396 (22.1) | ||
| 35–44 | 1868 (24.0) | 2096 (22.6) | ||
| 45–54 | 2532 (20.7) | 2290 (20.0) | ||
| 55–64 | 2271 (15.2) | 1648 (13.4) | ||
| 65–79 | 886 (8.0) | 939 (8.6) | ||
| Gender | 2.905 | 0.229 | ||
| Female | 4723 (49.1) | 4765 (47.8) | ||
| Male | 3917 (50.9) | 4179 (52.2) | ||
| Ethnicity | 22.387 | <0.001 | ||
| Han | 8072 (93.5) | 8151 (91.6) | ||
| Other | 568 (6.5) | 793 (8.4) | ||
| Educational status | 2895.816 | <0.001 | ||
| Primary school or below | 4103 (39.3) | 1242 (10.6) | ||
| Middle school | 2584 (34.2) | 2426 (26.1) | ||
| High school | 1314 (16.4) | 3206 (35.8) | ||
| Undergraduate and above | 639 (10.1) | 2070 (27.5) | ||
| Marital status | 338.080 | <0.001 | ||
| Married | 7853 (86.2) | 7283 (75.0) | ||
| Unmarried | 787 (13.8) | 1661 (25.0) | ||
| Occupation | 809.274 | <0.001 | ||
| Manual | 5984 (67.2) | 3978 (45.7) | ||
| Brain | 1187 (18.0) | 2176 (27.9) | ||
| Retired/unemployed | 1469 (14.8) | 2790 (26.4) | ||
| Family income per capita (¥) | 2385.274 | <0.001 | ||
| <500 | 2862 (26.6) | 724 (6.6) | ||
| 500– | 2353 (27.0) | 1330 (12.6) | ||
| 1000– | 2017 (25.8) | 3851 (43.0) | ||
| 2000– | 1408 (20.5) | 3039 (37.8) | ||
| Drinking | 17.239 | 0.003 | ||
| Yes | 2504 (31.9) | 2932 (34.9) | ||
| No | 6136 (68.1) | 6012 (65.1) | ||
| Salt intake | 3.555 | 0.180 | ||
| Excess | 3283 (39.4) | 3376 (38.0) | ||
| Normal | 5357 (60.6) | 5568 (62.0) | ||
| Nutrition intake | ||||
| Fruit | 311.138 | <0.001 | ||
| ≥2 times/week | 3757 (45.3) | 5245 (58.6) | ||
| <2 times/week | 4883 (54.7) | 3699 (41.4) | ||
| Egg | 54.358 | <0.001 | ||
| ≥2 times/week | 4953 (56.0) | 5674 (61.5) | ||
| <2 times/week | 3687 (44.0) | 3270 (38.5) | ||
| Meat | 223.905 | <0.001 | ||
| ≥2 times/week | 2409 (31.2) | 3528 (42.2) | ||
| <2 times/week | 6231 (68.8) | 516 (57.8) | ||
| Family history | 41.433 | <0.001 | ||
| Yes | 3930 (46.9) | 4610 (51.7) | ||
| No | 4710 (53.1) | 4334 (48.3) | ||
| BMI | 9.465 | 0.089 | ||
| Normal | 5198 (63.8) | 5435 (61.8) | ||
| Overweight | 2869 (29.4) | 2956 (31.6) | ||
| Obesity | 573 (6.8) | 553 (6.6) | ||
| Abdominal obesity | 1.751 | 0.323 | ||
| Yes | 2858 (29.4) | 2875 (30.3) | ||
| No | 5782 (70.6) | 6069 (69.7) | ||
| Hypertriglyceridemia | 6.77 | 0.056 | ||
| Yes | 3713 (38.7) | 3577 (36.7) | ||
| No | 4927 (61.3) | 5367 (63.3) | ||
| Hypercholesterolemia | 14.248 | 0.004 | ||
| Yes | 3061 (29.0) | 3130 (31.6) | ||
| No | 5579 (71.0) | 5814 (68.4) |
3.2. Correlates of Prehypertension and Hypertension
| Characteristics | Prehypertension | Hypertension | ||
|---|---|---|---|---|
| OR (95% CI) | p | OR (95% CI) | p | |
| Age (years) | <0.001 | <0.001 | ||
| 18–24 | 1.000 | 1.000 | ||
| 25–34 | 1.149 (0.914, 1.444) | 0.233 | 2.003 (1.353, 2.963) | 0.001 |
| 35–44 | 1.423 (1.150, 1.762) | 0.001 | 5.237 (3.663, 7.488) | <0.001 |
| 45–54 | 1.881 (1.519, 2.328) | <0.001 | 12.682 (8.898, 18.077) | <0.001 |
| 55–64 | 2.449 (1.956, 3.067) | <0.001 | 24.263 (16.933, 34.767) | <0.001 |
| 65–79 | 3.193 (2.389, 4.269) | <0.001 | 44.597 (30.114, 66.046) | <0.001 |
| Gender (Male/Female) | 3.293 (2.952, 3.674) | <0.001 | 2.787 (2.513, 3.090) | <0.001 |
| Location (Urban/Rural) | 0.849 (0.760, 0.948) | 0.004 | 0.879 (0.793, 0.975) | 0.015 |
| Ethnicity (Other/Han) | 0.998 (0.820, 1.215) | 0.984 | 0.955 (0.788, 1.157) | 0.637 |
| Educational status (years) | <0.001 | <0.001 | ||
| Primary school or below | 1.000 | 1.000 | ||
| Middle school | 0.833 (0.721, 0.963) | 0.013 | 0.628 (0.548, 0.719) | <0.001 |
| High school | 0.857 (0.739, 0.995) | 0.043 | 0.580 (0.506, 0.665) | <0.001 |
| Undergraduate and above | 0.678 (0.579, 0.794) | <0.001 | 0.327 (0.278, 0.385) | <0.001 |
| Marital status (Unmarried/Married) | 0.885 (0.757, 1.036) | 0.129 | 0.617 (0.528, 0.721) | <0.001 |
| Occupation | <0.001 | <0.001 | ||
| Manual | 1.000 | 1.000 | ||
| Brain | 0.743 (0.649, 0.852) | <0.001 | 0.624 (0.546, 0.712) | <0.001 |
| Retired/unemployed | 0.918 (0.796, 1.059) | 0.240 | 1.863 (1.636, 2.122) | <0.001 |
| Family income per capita (¥) | 0.002 | <0.001 | ||
| <500 | 1.000 | 1.000 | ||
| 500– | 0.850 (0.717,1.008) | 0.062 | 0.735 (0.629,0.859) | <0.001 |
| 1000– | 0.750 (0.646,0.871) | <0.001 | 0.567 (0.494,0.651) | <0.001 |
| 2000– | 0.832 (0.714,0.970) | 0.019 | 0.514 (0.446,0.594) | <0.001 |
| Drinking (Yes/No) | 1.963 (1.746,2.208) | <0.001 | 2.030 (1.816,2.270) | <0.001 |
| Salt intake (Excess/Normal) | 1.140 (1.020,1.273) | 0.021 | 1.247 (1.124,1.384) | <0.001 |
| Nutrition intake 1 | ||||
| Fruit 1: ≥ 2 times/week | 0.752 (0.675,0.839) | <0.001 | 0.589 (0.531,0.652) | <0.001 |
| Egg 1: ≥ 2 times/week | 1.297 (1.162,1.448) | <0.001 | 1.397 (1.259,1.550) | <0.001 |
| Meet 1: ≥ 2 times/weeek | 1.199 (1.072,1.340) | <0.001 | 0.963 (0.864,0.072) | 0.486 |
| Family history (Yes/No) | 1.010 (0.906,1.125) | 0.858 | 1.290 (1.165,1.428) | <0.001 |
| BMI | <0.001 | <0.001 | ||
| Normal | 1.000 | 1.000 | ||
| Overweight | 2.217 (1.960,2.508) | <0.001 | 4.552 (4.042,5.125) | <0.001 |
| Obesity | 3.923 (2.829,5.440) | <0.001 | 8.492 (6.307,11.435) | <0.001 |
| Abdominal obesity (Yes/No) | 2.422 (2.114,2.775) | <0.001 | 5.440 (4.789,6.181) | <0.001 |
| Hypertriglyceridemia (Yes/No) | 2.176 (1.939,2.442) | <0.001 | 4.531 (4.062,5.054) | <0.001 |
| Hypercholesterolemia (Yes/No) | 1.828 (1.631,2.050) | <0.001 | 3.473 (3.119,3.867) | <0.001 |
| Characteristics | Prehypertension | Hypertension | ||
|---|---|---|---|---|
| OR (95% CI) | p | OR (95% CI) | p | |
| Age (years) | <0.001 | <0.001 | ||
| 18–24 | 1.000 | 1.000 | ||
| 25–34 | 0.904 (0.718, 1.139) | 0.394 | 1.112 (0.700, 1.764) | 0.653 |
| 35–44 | 1.239 (0.994, 1.544) | 0.057 | 2.833 (1.843, 4.354) | <0.001 |
| 45–54 | 1.538 (1.228, 1.926) | <0.001 | 6.936 (4.496, 10.701) | <0.001 |
| 55–64 | 1.935 (1.518, 2.467) | <0.001 | 14.729 (9.450, 22.957) | <0.001 |
| 65–79 | 2.638 (1.952, 3.565) | <0.001 | 34.613 (21.475, 55.790) | <0.001 |
| Gender (Male/Female) | 3.085 (2.711, 3.510) | <0.001 | 2.383 (2.073, 2.739) | <0.001 |
| Location (Urban/Rural) | 0.828 (0.738, 0.929) | 0.001 | 0.886 (0.777, 1.010) | 0.070 |
| Drinking (Yes/No) | 1.175 (1.022, 1.351) | 0.024 | 1.629 (1.389, 1.910) | <0.001 |
| Fruit 2:≥2times/week | – | – | 0.780 (0.683, 0.890) | <0.001 |
| Egg 2:≥2times/week | 1.188 (1.057, 1.334) | 0.004 | – | – |
| Family history (Yes/No) | – | – | 1.604 (1.407, 1.829) | <0.001 |
| BMI | <0.001 | <0.001 | ||
| Normal | 1.000 | 1.000 | ||
| Overweight | 1.665 (1.428, 1.919) | <0.001 | 2.676 (2.295, 3.121) | <0.001 |
| Obesity | 2.960 (2.045, 4.285) | <0.001 | 5.716 (3.983, 8.203) | <0.001 |
| Abdominal obesity (Yes/No) | 1.228 (1.031, 1.462) | 0.021 | 1.537 (1.299, 1.818) | <0.001 |
| Hypertriglyceridemia (Yes/No) | 1.301 (1.133, 1.493) | <0.001 | 2.015 (1.748, 2.324) | <0.001 |
| Hypercholesterolemia (Yes/No) | 1.261 (1.110, 1.432) | <0.001 | 1.377 (1.198, 1.582) | <0.001 |
4. Discussion
5. Conclusions
Acknowledgments
Author Contributions
Conflicts of Interest
References
- WHO. Global Status Report on Noncommunicable Diseases 2014. Available online: http://apps.who.int/iris/bitstream/10665/148114/1/9789241564854_eng.pdf?ua=1 (accessed on 2 November 2015).
- Danaei, G.; Finucane, M.M.; Lin, J.K.; Singh, G.M.; Paciorek, C.J.; Cowan, M.J.; Farzadfar, F.; Stevens, G.A.; Lim, S.S.; Riley, L.M.; et al. National, regional, and global trends in systolic blood pressure since 1980: Systematic analysis of health examination surveys and epidemiological studies with 786 country-years and 5.4 million participants. Lancet 2011, 377, 568–577. [Google Scholar] [CrossRef]
- Kearney, P.M.; Whelton, M.; Reynolds, K.; Muntner, P.; Whelton, P.K.; He, J. Global burden of hypertension: Analysis of worldwide data. Lancet 2005, 365, 217–223. [Google Scholar] [CrossRef]
- Lenfant, C.; Chobanian, A.V.; Jones, D.W.; Roccella, E.J. Seventh report of the joint national committee on the prevention, detection, evaluation, and treatment of high blood pressure (JNC 7): Resetting the hypertension sails. Hypertension 2003, 41, 1178–1179. [Google Scholar] [CrossRef] [PubMed]
- Vasan, R.S.; Larson, M.G.; Leip, E.P.; Evans, J.C.; O’Donnell, C.J.; Kannel, W.B.; Levy, D. Impact of high-normal blood pressure on the risk of cardiovascular disease. N. Engl. J. Med. 2001, 345, 1291–1297. [Google Scholar] [CrossRef] [PubMed]
- Vasan, R.S.; Larson, M.G.; Leip, E.P.; Kannel, W.B.; Levy, D. Assessment of frequency of progression to hypertension in non-hypertensive participants in the framingham heart study: A cohort study. Lancet 2001, 358, 1682–1686. [Google Scholar] [CrossRef]
- Suri, M.F.; Qureshi, A.I. Prehypertension as a risk factor for cardiovascular diseases. J. Cardiovasc. Nurs. 2006, 21, 478–482. [Google Scholar] [CrossRef] [PubMed]
- Li, Z.; Yao, Y.; Han, W.; Yu, Y.; Liu, Y.; Tao, Y.; Kou, C.; Jiang, L.; Sun, Q.; Yin, Y.; et al. Smoking prevalence and associated factors as well as attitudes and perceptions towards tobacco control in northeast China. Int. J. Environ. Res. Public Health 2015, 12, 8606–8618. [Google Scholar] [CrossRef] [PubMed]
- National Cholesterol Education Program (NCEP) Expert Panel. Third report of the national cholesterol education program (NCEP) expert panel on detection, evaluation, and treatment of high blood cholesterol in adults (adult treatment panel III) final report. Circulation 2002, 106, 3143–3421. [Google Scholar]
- Silva, D.A.; Petroski, E.L.; Peres, M.A. Prehypertension and hypertension among adults in a metropolitan area in southern brazil: Population-based study. Rev. Saude Publica 2012, 46, 988–998. [Google Scholar] [CrossRef] [PubMed]
- Rahmanian, K.; Shojaie, M. The prevalence of pre-hypertension and its association to established cardiovascular risk factors in south of Iran. BMC Res. Notes 2012, 5. [Google Scholar] [CrossRef] [PubMed]
- Li, H.; Xu, T.; Tong, W.; Liu, Y.; Zhao, L.; Zhang, Y. Comparison of cardiovascular risk factors between prehypertension and hypertension in a Mongolian population, Inner Mongolia, China. Circ. J. 2008, 72, 1666–1673. [Google Scholar] [CrossRef] [PubMed]
- Zhang, W.H.; Zhang, L.; An, W.F.; Ma, J.L. Prehypertension and clustering of cardiovascular risk factors among adults in suburban Beijing, China. J. Epidemiol. 2011, 21, 440–446. [Google Scholar] [CrossRef] [PubMed]
- Sun, Z.; Zheng, L.; Wei, Y.; Li, J.; Zhang, X.; Zhang, X.; Liu, S.; Xu, C.; Li, J.; Zhao, F.; et al. Prevalence and risk factors of the rural adult people prehypertension status in Liaoning Province of China. Circ. J. 2007, 71, 550–553. [Google Scholar] [CrossRef] [PubMed][Green Version]
- Guo, X.; Zheng, L.; Li, Y.; Yu, S.; Zhou, X.; Wang, R.; Zhang, X.; Sun, Z.; Sun, Y. Gender-specific prevalence and associated risk factors of prehypertension among rural children and adolescents in Northeast China: A cross-sectional study. Eur. J. Pediatr. 2013, 172, 223–230. [Google Scholar] [CrossRef] [PubMed]
- Okubo, Y.; Sairenchi, T.; Irie, F.; Yamagishi, K.; Iso, H.; Watanabe, H.; Muto, T.; Tanaka, K.; Ota, H. Association of alcohol consumption with incident hypertension among middle-aged and older Japanese population: The ibarakai prefectural health study (IPHS). Hypertension 2014, 63, 41–47. [Google Scholar] [CrossRef] [PubMed]
- Pitsavos, C.; Milias, G.A.; Panagiotakos, D.B.; Xenaki, D.; Panagopoulos, G.; Stefanadis, C. Prevalence of self-reported hypertension and its relation to dietary habits, in adults; a nutrition & health survey in Greece. BMC Public Health 2006, 6. [Google Scholar] [CrossRef]
- Miura, K.; Greenland, P.; Stamler, J.; Liu, K.; Daviglus, M.L.; Nakagawa, H. Relation of vegetable, fruit, and meat intake to 7-year blood pressure change in middle-aged men: The Chicago western electric study. Am. J. Epidemiol. 2004, 159, 572–580. [Google Scholar] [CrossRef] [PubMed]
- Dong, G.H.; Wang, D.; Liu, M.M.; Liu, Y.Q.; Zhao, Y.; Yang, M.; Meng, X.J.; Tian, S.; Meng, X.; Zhang, H.Y. Sex difference of the prevalence and risk factors associated with prehypertension among urban Chinese adults from 33 communities of China: The CHPSNE study. J. Hypertens. 2012, 30, 485–491. [Google Scholar] [CrossRef] [PubMed]
- Lin, Y.; Lai, X.; Chen, G.; Xu, Y.; Huang, B.; Chen, Z.; Zhu, S.; Yao, J.; Jiang, Q.; Huang, H. Prevalence and risk factors associated with prehypertension and hypertension in the Chinese She population. Kidney Blood Press. Res. 2012, 35, 305–313. [Google Scholar] [CrossRef] [PubMed]
- Sung, S.H.; Cheng, H.M.; Wang, K.L.; Yu, W.C.; Chuang, S.Y.; Ting, C.T.; Lakatta, E.G.; Yin, F.C.; Chou, P.; Chen, C.H. White coat hypertension is more risky than prehypertension: Important role of arterial wave reflections. Hypertension 2013, 61, 1346–1353. [Google Scholar] [CrossRef] [PubMed]
- Agarwal, R.; Weir, M.R. Treated hypertension and the white coat phenomenon: Office readings are inadequate measures of efficacy. J. Am. Soc. Hypertens. 2013, 7, 236–243. [Google Scholar] [CrossRef] [PubMed]
© 2015 by the authors; licensee MDPI, Basel, Switzerland. This article is an open access article distributed under the terms and conditions of the Creative Commons by Attribution (CC-BY) license (http://creativecommons.org/licenses/by/4.0/).
Share and Cite
Yang, G.; Ma, Y.; Wang, S.; Su, Y.; Rao, W.; Fu, Y.; Yu, Y.; Kou, C. Prevalence and Correlates of Prehypertension and Hypertension among Adults in Northeastern China: A Cross-Sectional Study. Int. J. Environ. Res. Public Health 2016, 13, 82. https://doi.org/10.3390/ijerph13010082
Yang G, Ma Y, Wang S, Su Y, Rao W, Fu Y, Yu Y, Kou C. Prevalence and Correlates of Prehypertension and Hypertension among Adults in Northeastern China: A Cross-Sectional Study. International Journal of Environmental Research and Public Health. 2016; 13(1):82. https://doi.org/10.3390/ijerph13010082
Chicago/Turabian StyleYang, Guang, Yue Ma, Shibin Wang, Yingying Su, Wenwang Rao, Yingli Fu, Yaqin Yu, and Changgui Kou. 2016. "Prevalence and Correlates of Prehypertension and Hypertension among Adults in Northeastern China: A Cross-Sectional Study" International Journal of Environmental Research and Public Health 13, no. 1: 82. https://doi.org/10.3390/ijerph13010082
APA StyleYang, G., Ma, Y., Wang, S., Su, Y., Rao, W., Fu, Y., Yu, Y., & Kou, C. (2016). Prevalence and Correlates of Prehypertension and Hypertension among Adults in Northeastern China: A Cross-Sectional Study. International Journal of Environmental Research and Public Health, 13(1), 82. https://doi.org/10.3390/ijerph13010082