
Occupants’ Perceptions of Amenity and Efficiency for Verification of Spatial Design Adequacy

Abstract
:1. Introduction
1.1. Problem Statements and Objectives
1.2. Related Theories and Analysis Framework
1.3. Hypotheses
- Hypothesis group 1 demonstrates that the spatial size factors such as width, depth, and height of the space affect the perception of amenity and efficiency. Most previous studies have not clearly described the spatial conditions required in order to satisfy occupants’ amenity and efficiency needs regarding the relationship between the spatial factors and space [35,81,82,83]; Fang described that the unit size and the length of stay were significantly related to residential satisfaction [84]. In human-environment-interaction theory, the pleasure-arousal hypothesis demonstrates that occupants were most attracted to settings that were moderately arousing and maximally pleasurable [52]. Occupants feel pleasantness in agreeable real spatial conditions resulting from agreement with their openness experiences, e.g., a high height and wide width of the space.
- Hypothesis group 2 demonstrates that the spatial shape factors such as the width-to-depth ratio, the height-to-area ratio, and the room shape affect the perception of amenity and efficiency. Most previous studies have not clearly described the spatial conditions required in order to satisfy occupants’ amenity and efficiency needs regarding relationship between the spatial factors and space [35,81,82,83]; Frontczak reported that the amount of space regarding the workspace contributes significantly to the overall satisfaction among the 15 available parameters [16]. In human-environment-interaction theory and social learning theory, occupants observed, processed, and imitated the behaviors, attitudes, and emotional reactions for desirable behaviors [52]. Occupants do not feel stress in agreeable spatial conditions that results from engaging in a certain behavior, e.g., serving guests in a living room.
- Hypothesis group 3 demonstrates that the overall satisfaction of amenity and efficiency is perceived differently in the same space. Occupants’ overall satisfaction of the space will be distinguished between amenity and efficiency. Amenity satisfaction is influenced by the spatial aspects (e.g., ceiling height) that affect the emotional satisfaction; otherwise, the efficiency satisfaction is affected by the spatial aspects, e.g., distance to the outdoor area because it affects the movement for hosting guests.
2. Methods
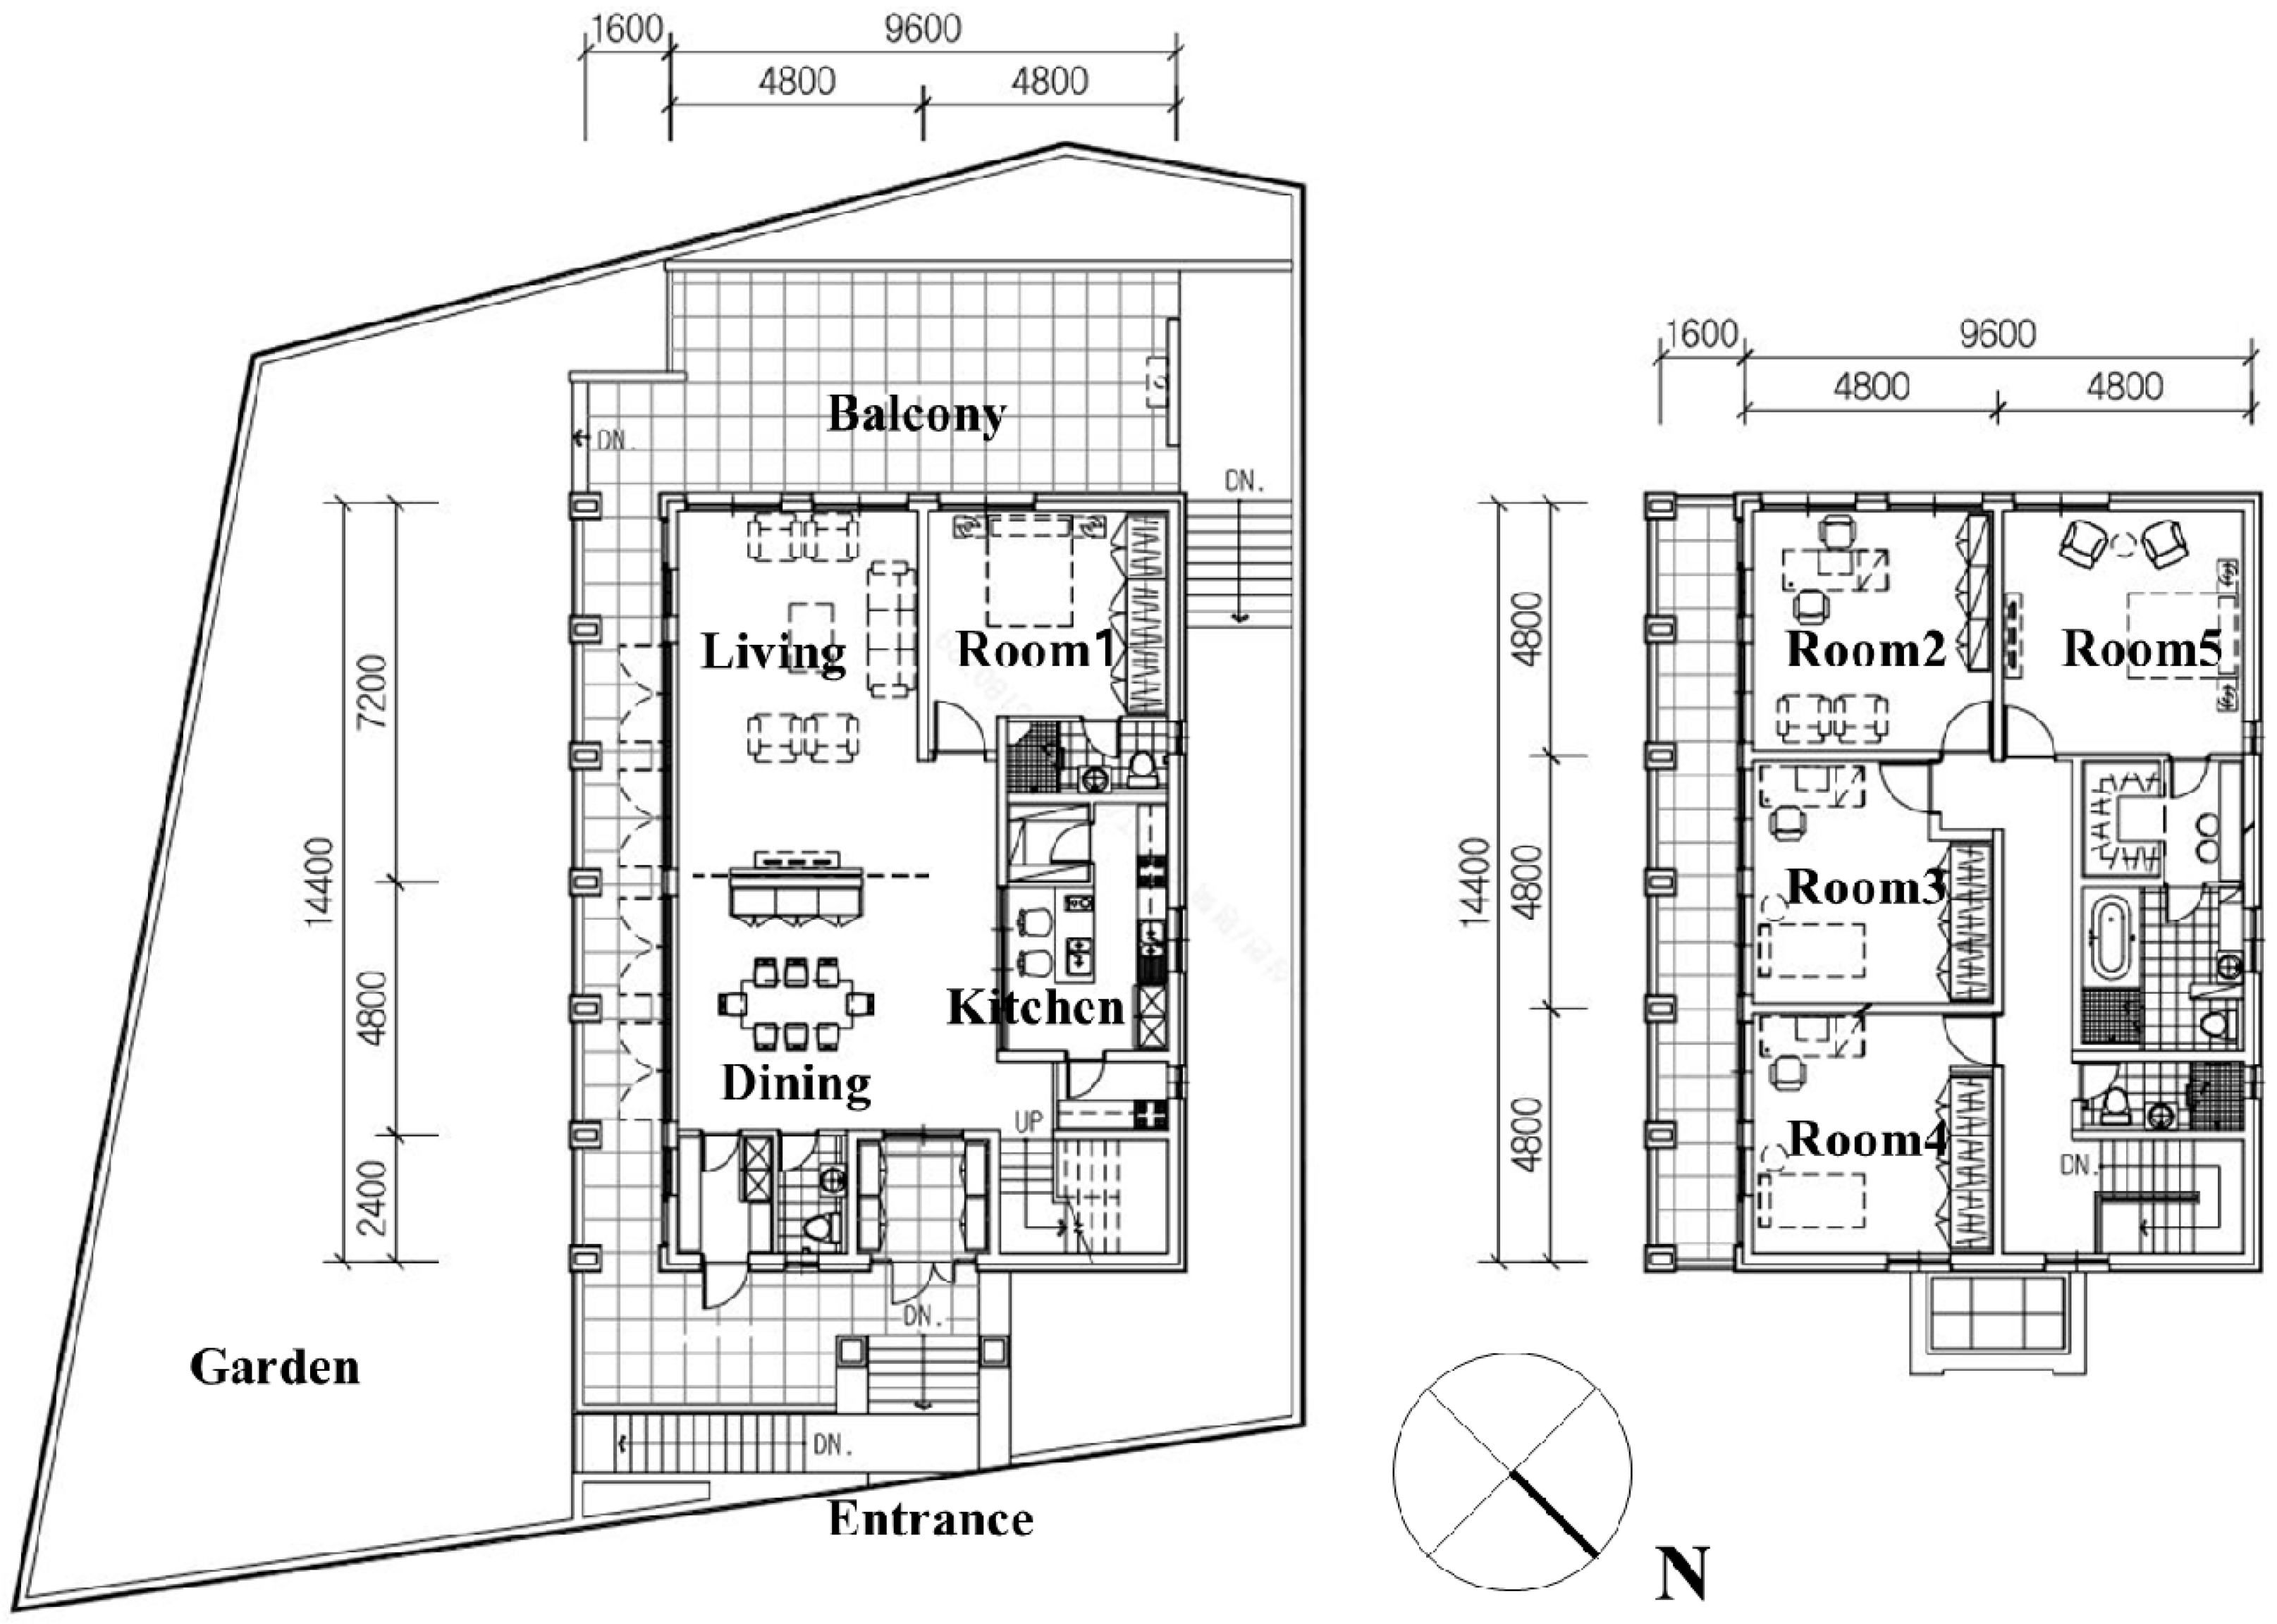
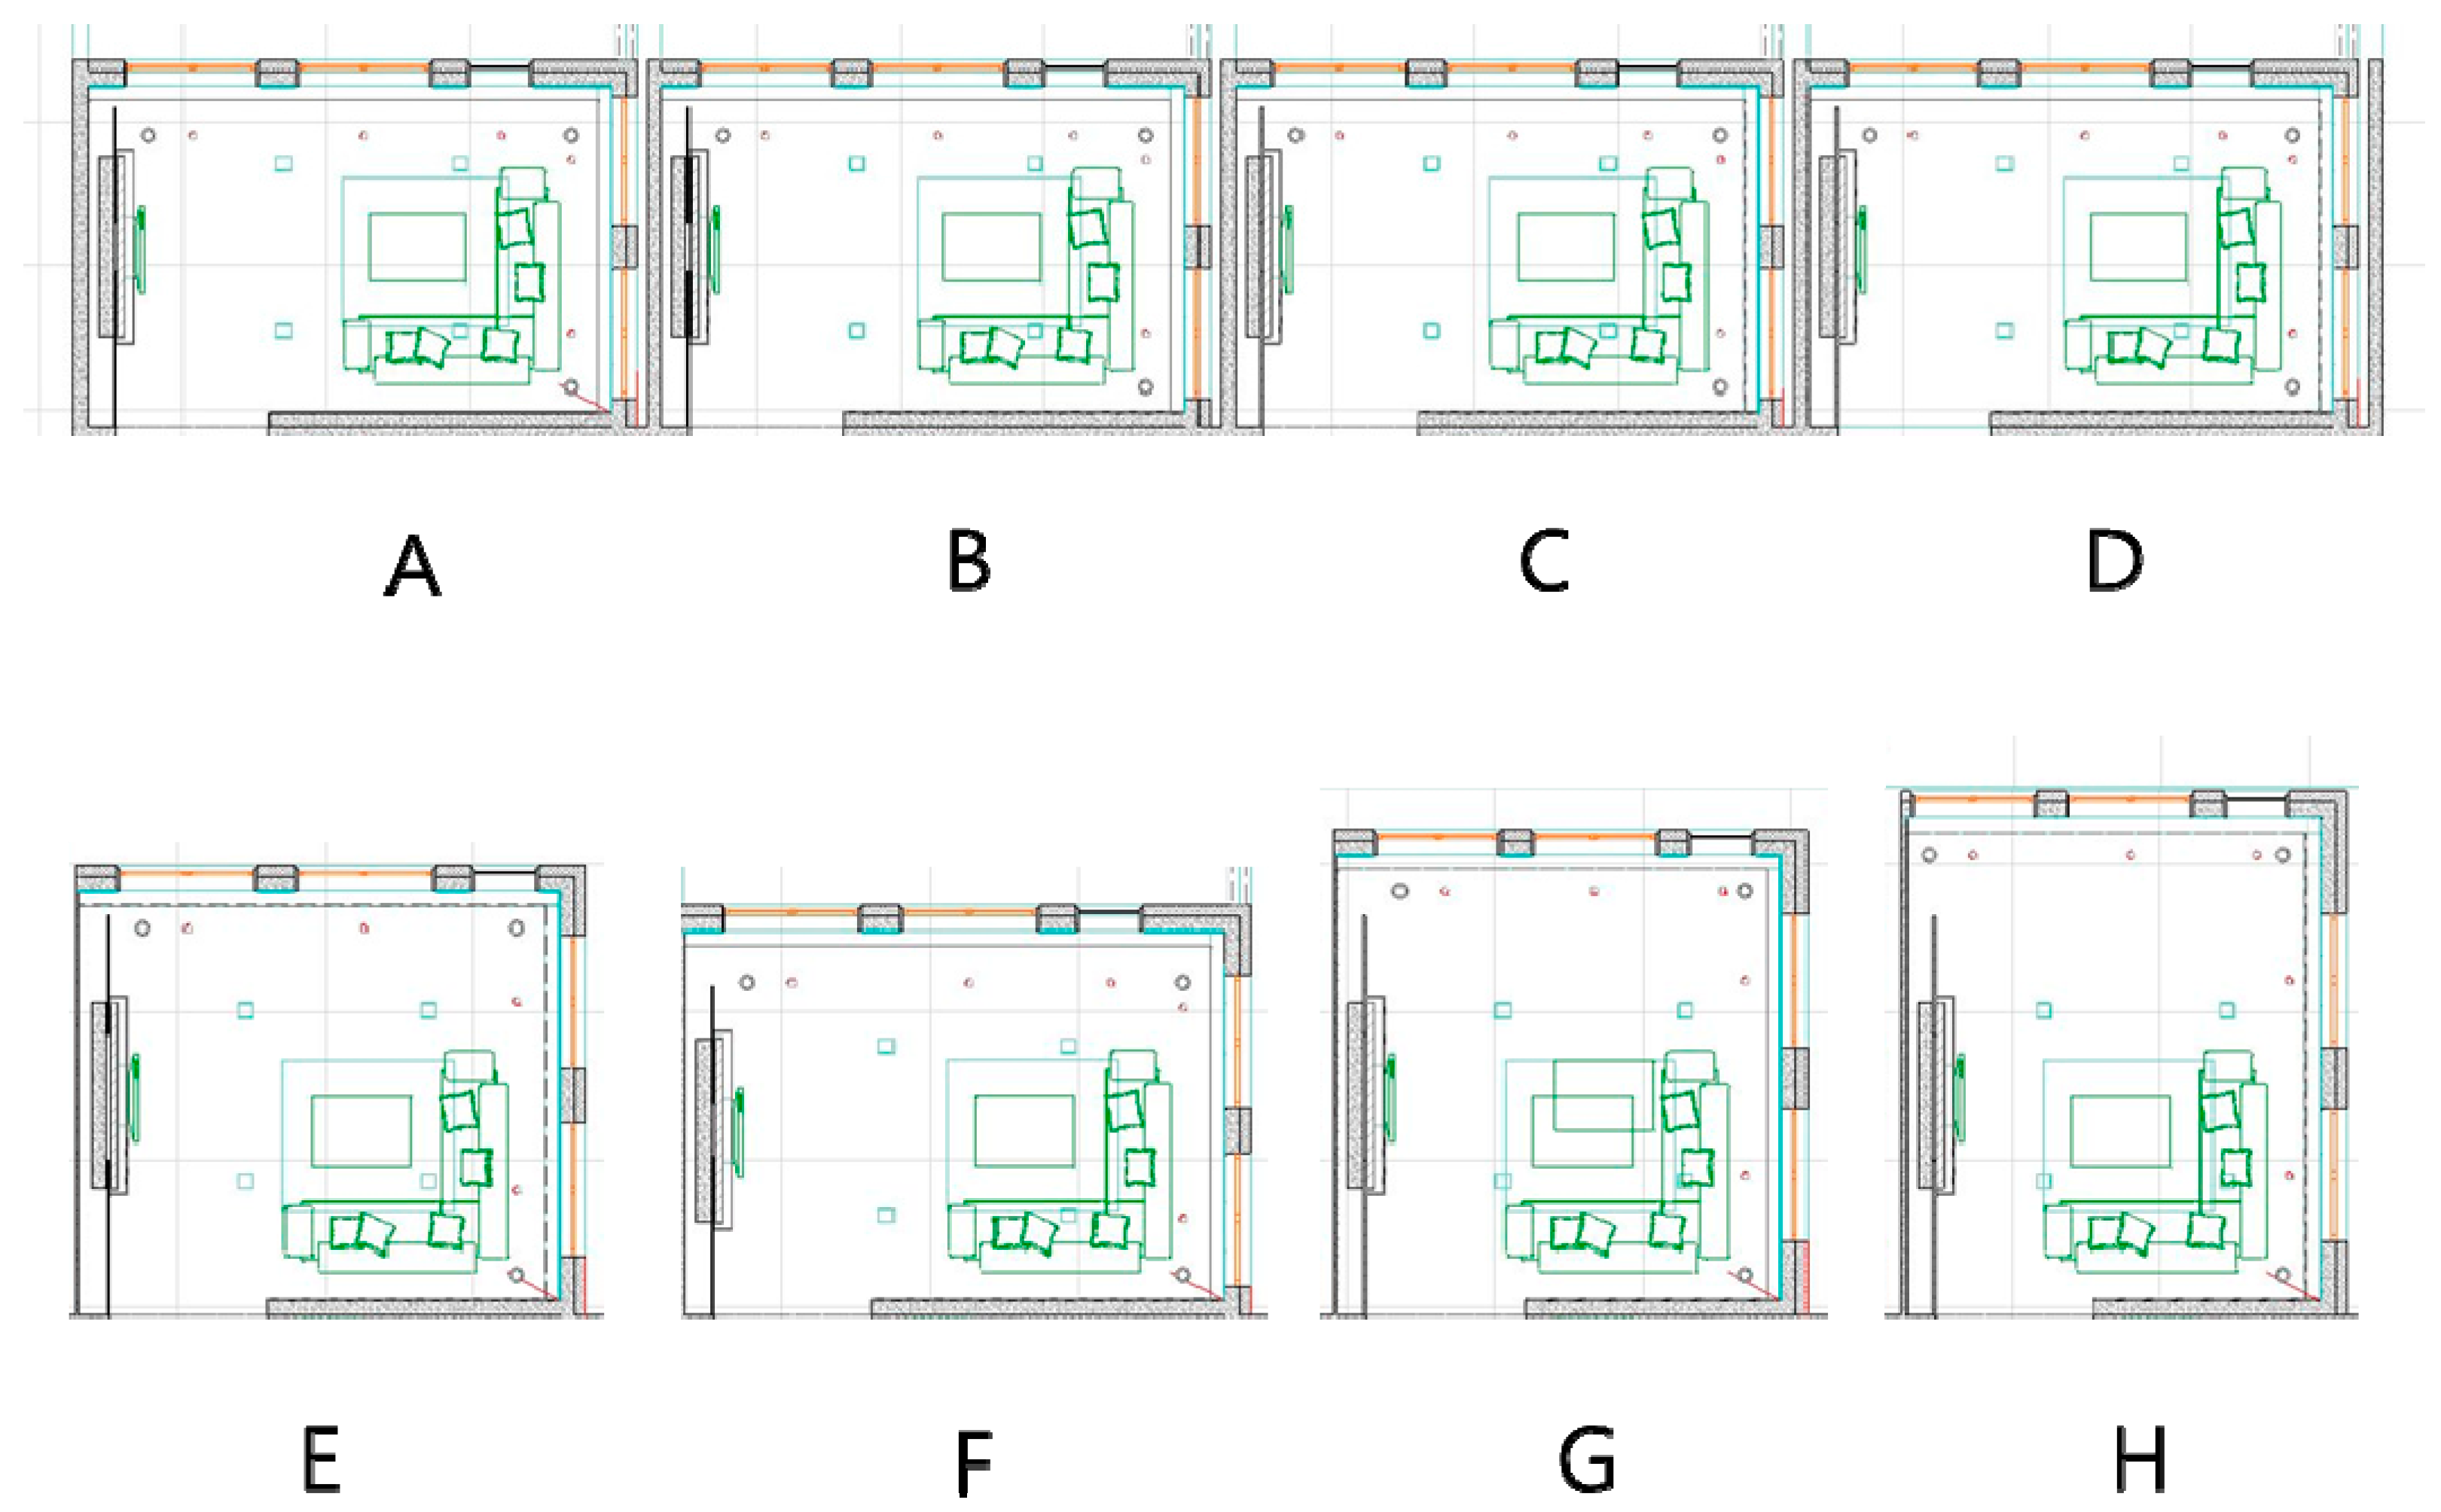
2.1. Space Selection and Spatial Factors

| Category | Space | Width (m) | Depth (m) | Height (m) | Area (m2) | Finishes |
|---|---|---|---|---|---|---|
| I | A (base scenario) | 7.33 | 4.55 | 2.4 | 33.35 | - Floor :brown wood - Wall : light grey paper and wood - Ceiling : medium gray paper |
| B | 7.33 | 4.55 | 2.8 | 33.35 | ||
| C | 7.33 | 4.55 | 2.5 | 33.35 | ||
| D | 7.33 | 4.55 | 2.6 | 33.35 | ||
| II | E (base scenario) | 6.10 | 6.10 | 2.6 | 37.21 | |
| F | 7.25 | 5.13 | 2.6 | 37.21 | ||
| G | 6.50 | 5.72 | 2.6 | 37.21 | ||
| H | 5.60 | 6.64 | 2.6 | 37.21 |
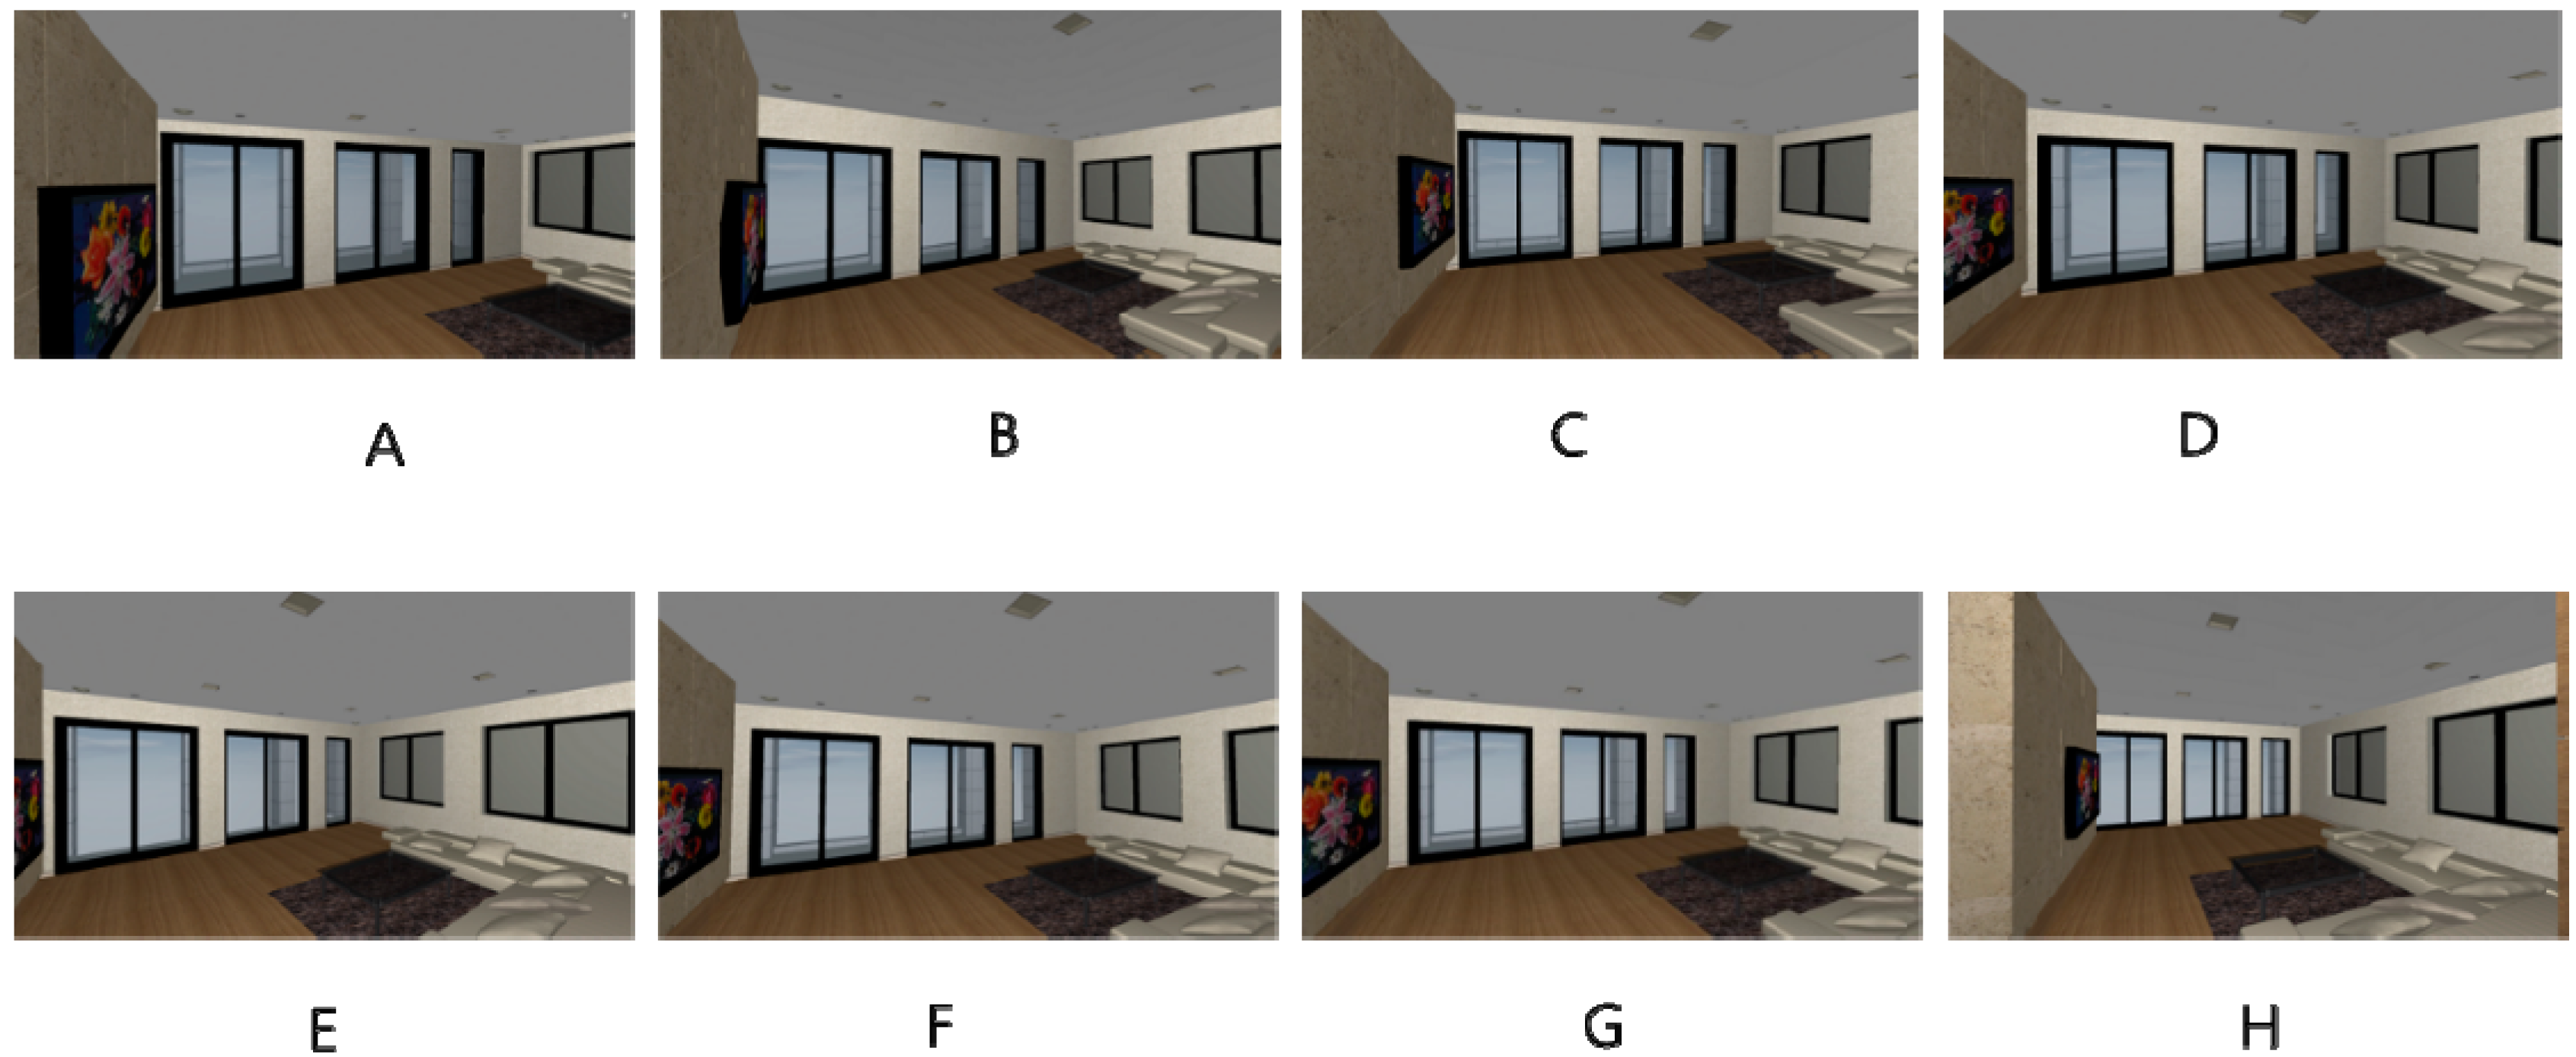
- First group (A–D): The floor area of the living room space was equal for all four alternatives; it was 33.35 m2. However, the ceiling height was varied from 2.4 m to 2.8 m. In this study, the ceiling height of 2.4 m was the lowest acceptable height for occupancy and 2.8 m was the maximum height regulated by the building code. The ceiling height of 2.7 m was not considered because it does not align with the exterior design proportions between the window and exterior finish. Therefore, ceiling heights of 2.4 m, 2.5 m, 2.6 m, and 2.8 m were provided using random assignment. In this group, the variation of the ceiling height is the influential factor that affects the future occupants’ spatial perceptions.
- Second group (E–H): The floor shape of the living room space was varied with changes in the width and depth, but the ceiling height remained equal for all alternatives. The floor area for all four scenarios was 37.21 m2, but different combinations of widths and depths varying from 5.13 m to 7.25 m were used in order to create the same area. A ceiling height of 2.6 was used in this scenario for all rooms. In this group, the variations of the width and depth are the influential factors that affect the spatial perceptions.
2.2. Participants and Questionnaires
| Answer | Scale |
|---|---|
| Strongly agree | 3 |
| Moderately agree | 2 |
| Slightly agree | 1 |
| Neither agree nor disagree | 0 |
| Slightly disagree | −1 |
| Moderately disagree | −2 |
| Strongly disagree | −3 |
| Number | Questions Content | Category |
|---|---|---|
| A1 | How well is your sense of amenity satisfied while walking through this space? | Satisfaction of space |
| A2 | Is the room width conducive to feeling amenity? | spatial size |
| A3 | Is the room depth conducive to feeling amenity? | |
| A4 | Is the room height conducive to feeling amenity? | |
| A5 | Is the room area conducive to feeling amenity? | |
| A6 | Is the ratio of width to depth conducive to feeling amenity? | spatial shape |
| A7 | Is the room shape conducive to feeling amenity? | |
| A8 | Is the ratio of height to area conducive to feeling amenity? | |
| A9 | Is the front window size conducive to feeling amenity? | |
| A10 | Is the right window size conducive to feeling amenity? | |
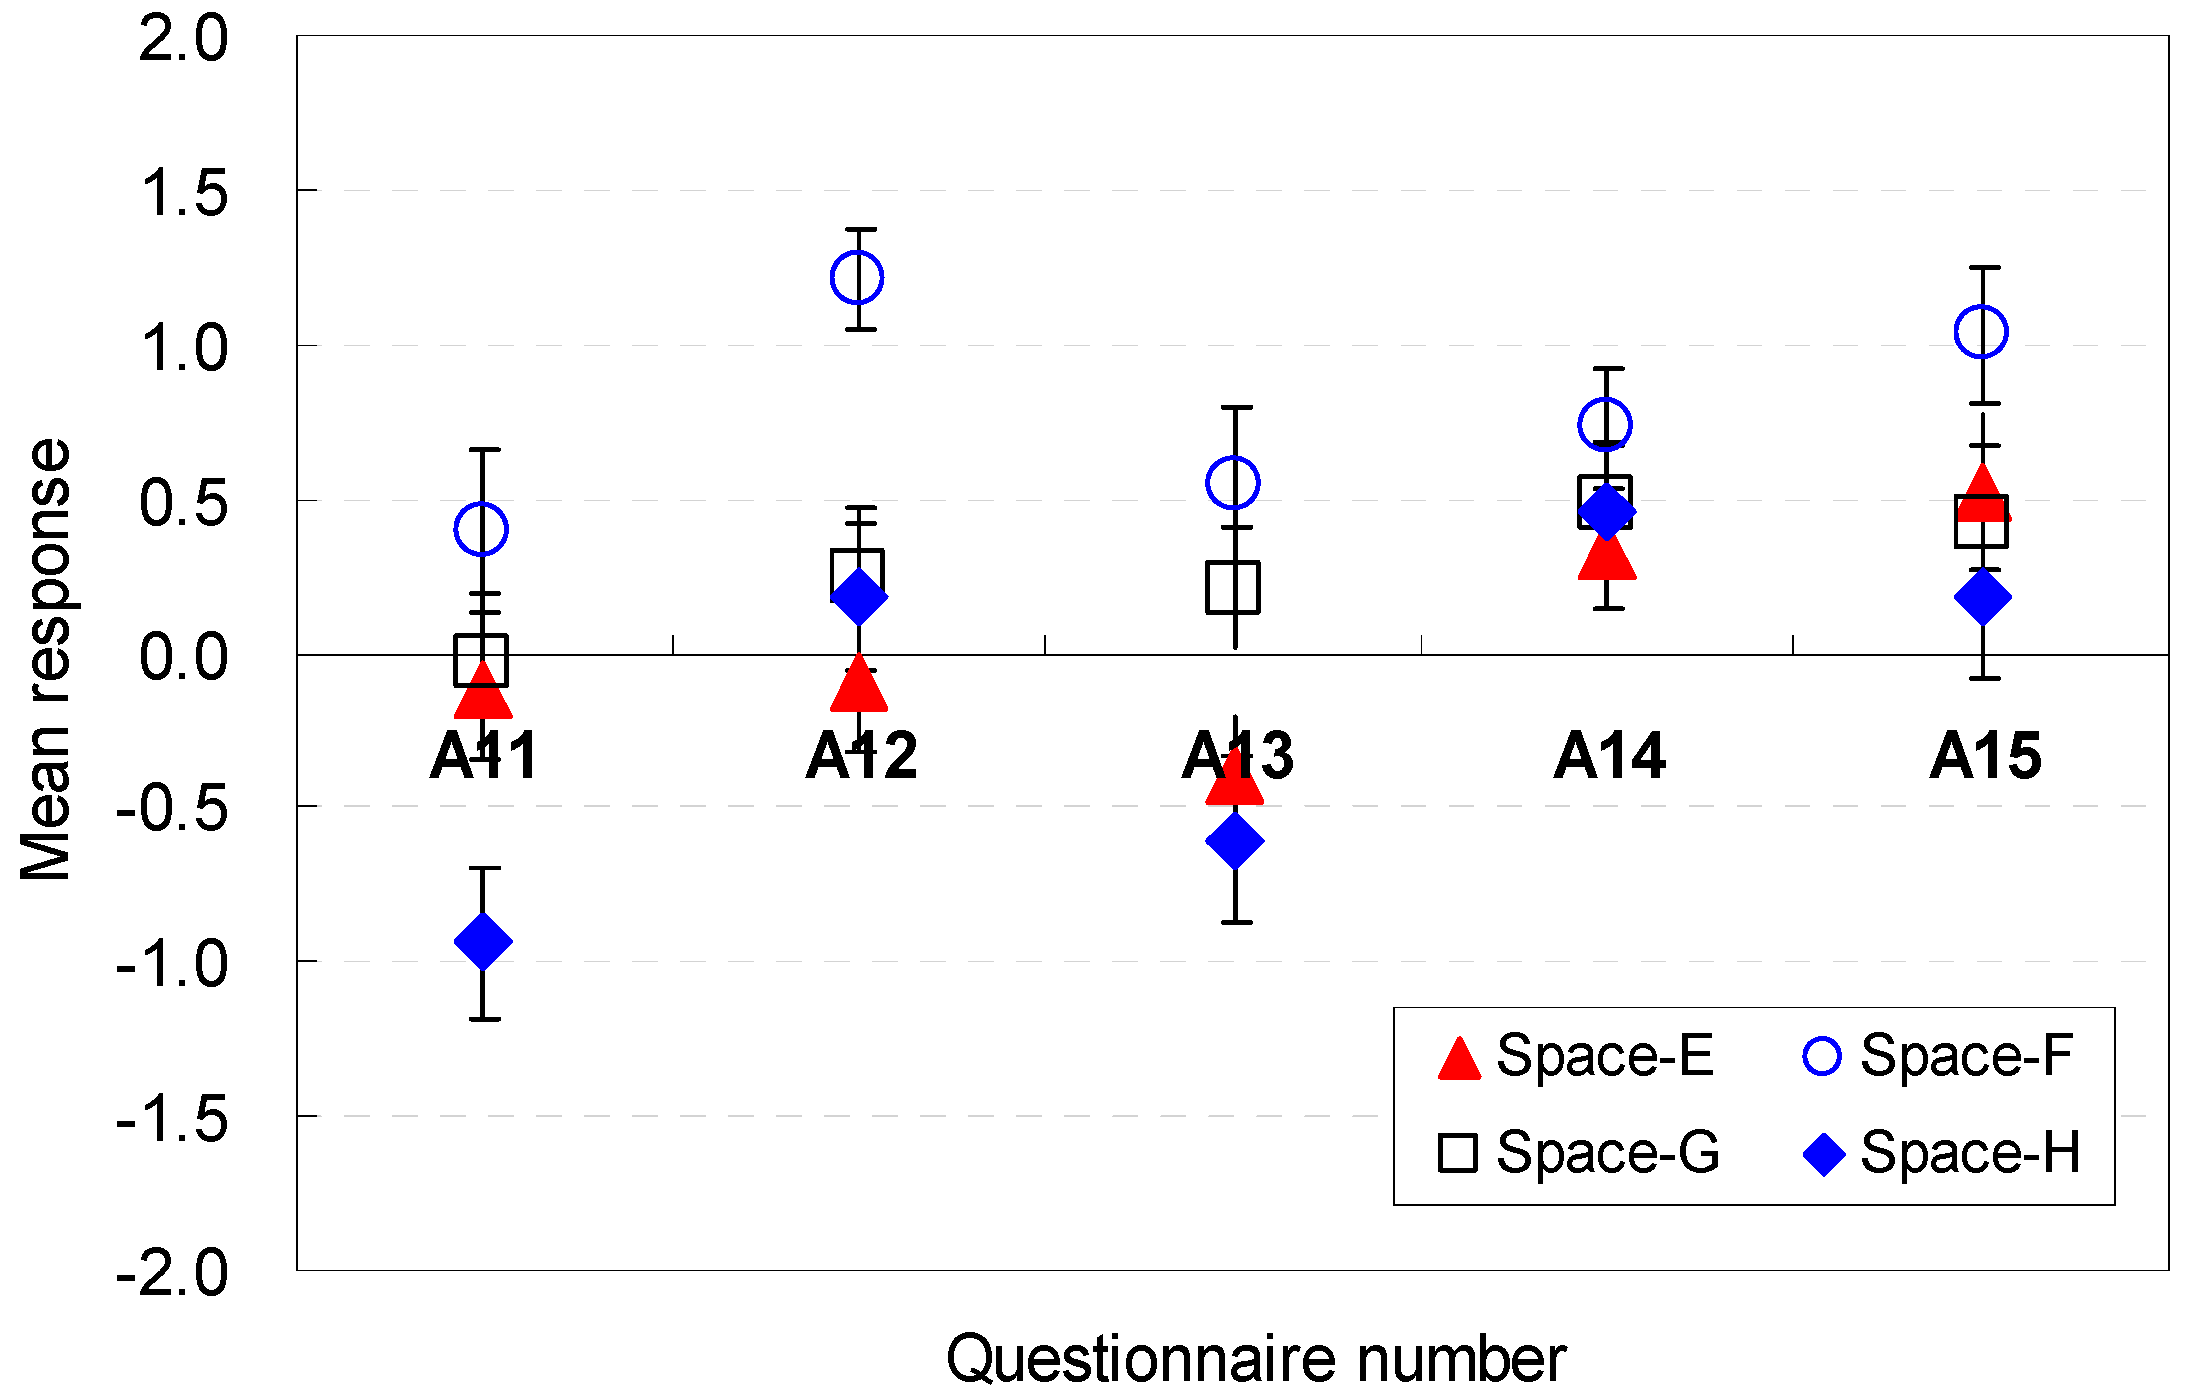
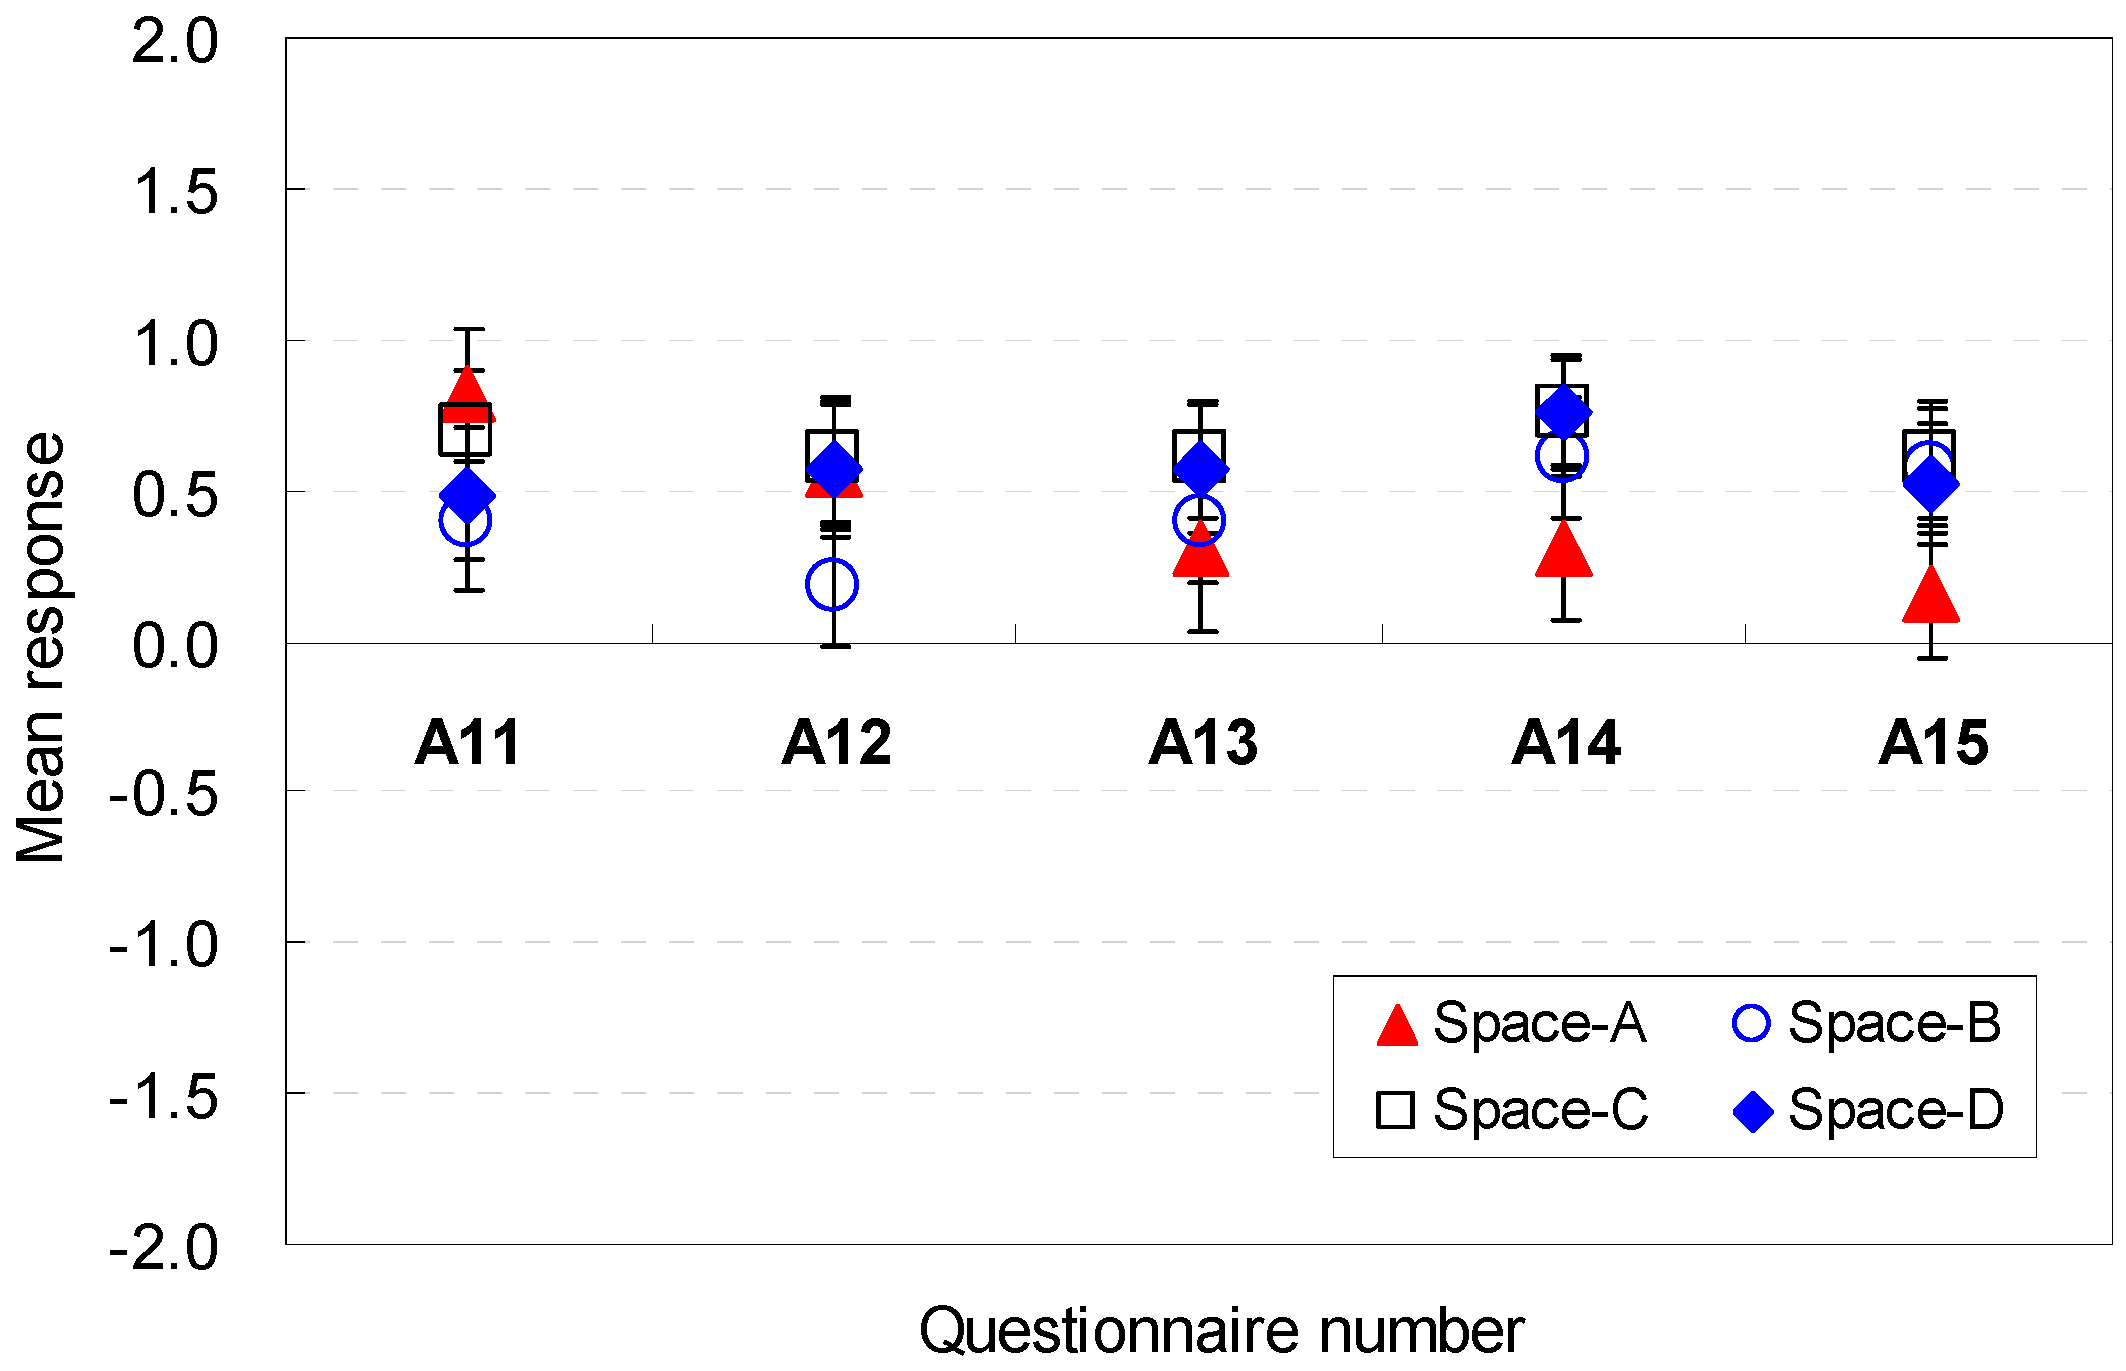
| A11 | Is the sofa location conducive to feeling amenity? | spatial elements configuration |
| A12 | Is the vacant space size conducive to feeling amenity? | |
| A13 | Is the vacant space location conducive to feeling amenity? | |
| A14 | Is the balcony door location conducive to feeling amenity? | |
| A15 | Is the corridor width to balcony conducive to feeling amenity? |
| Number | Questions Content | Category |
|---|---|---|
| E1 | How well is your sense of efficiency satisfied while walking through this space? | Satisfaction of space |
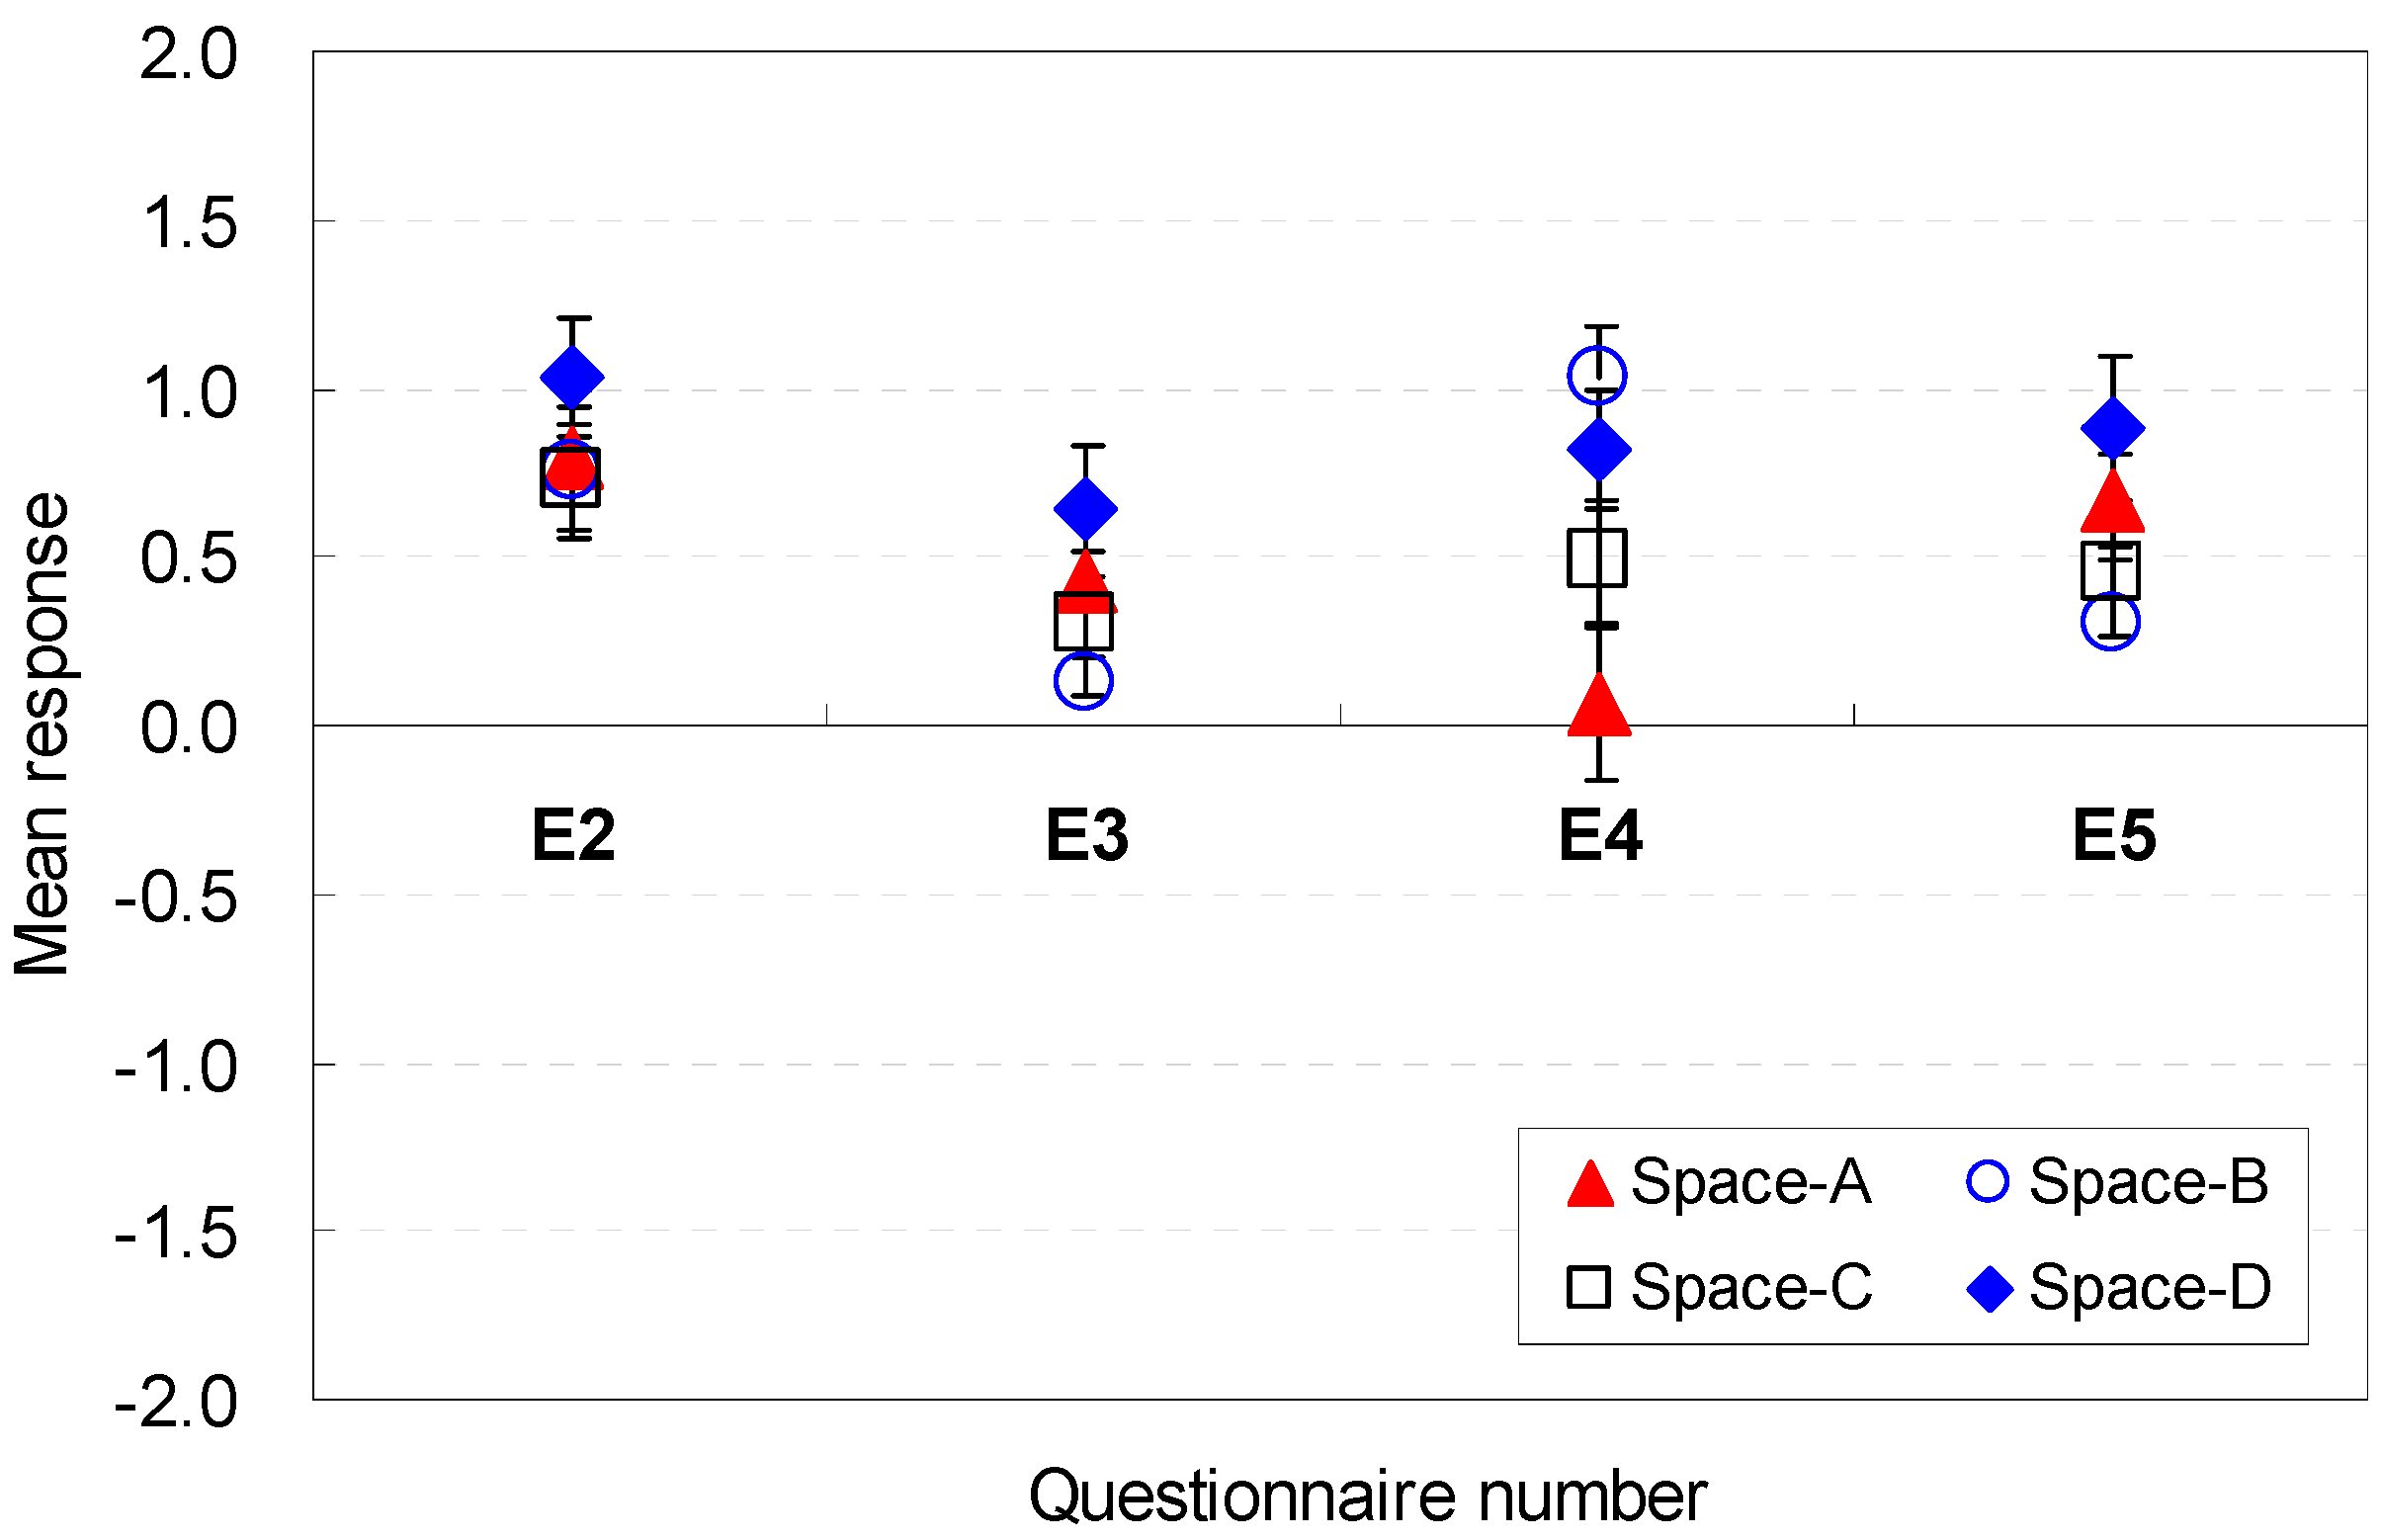
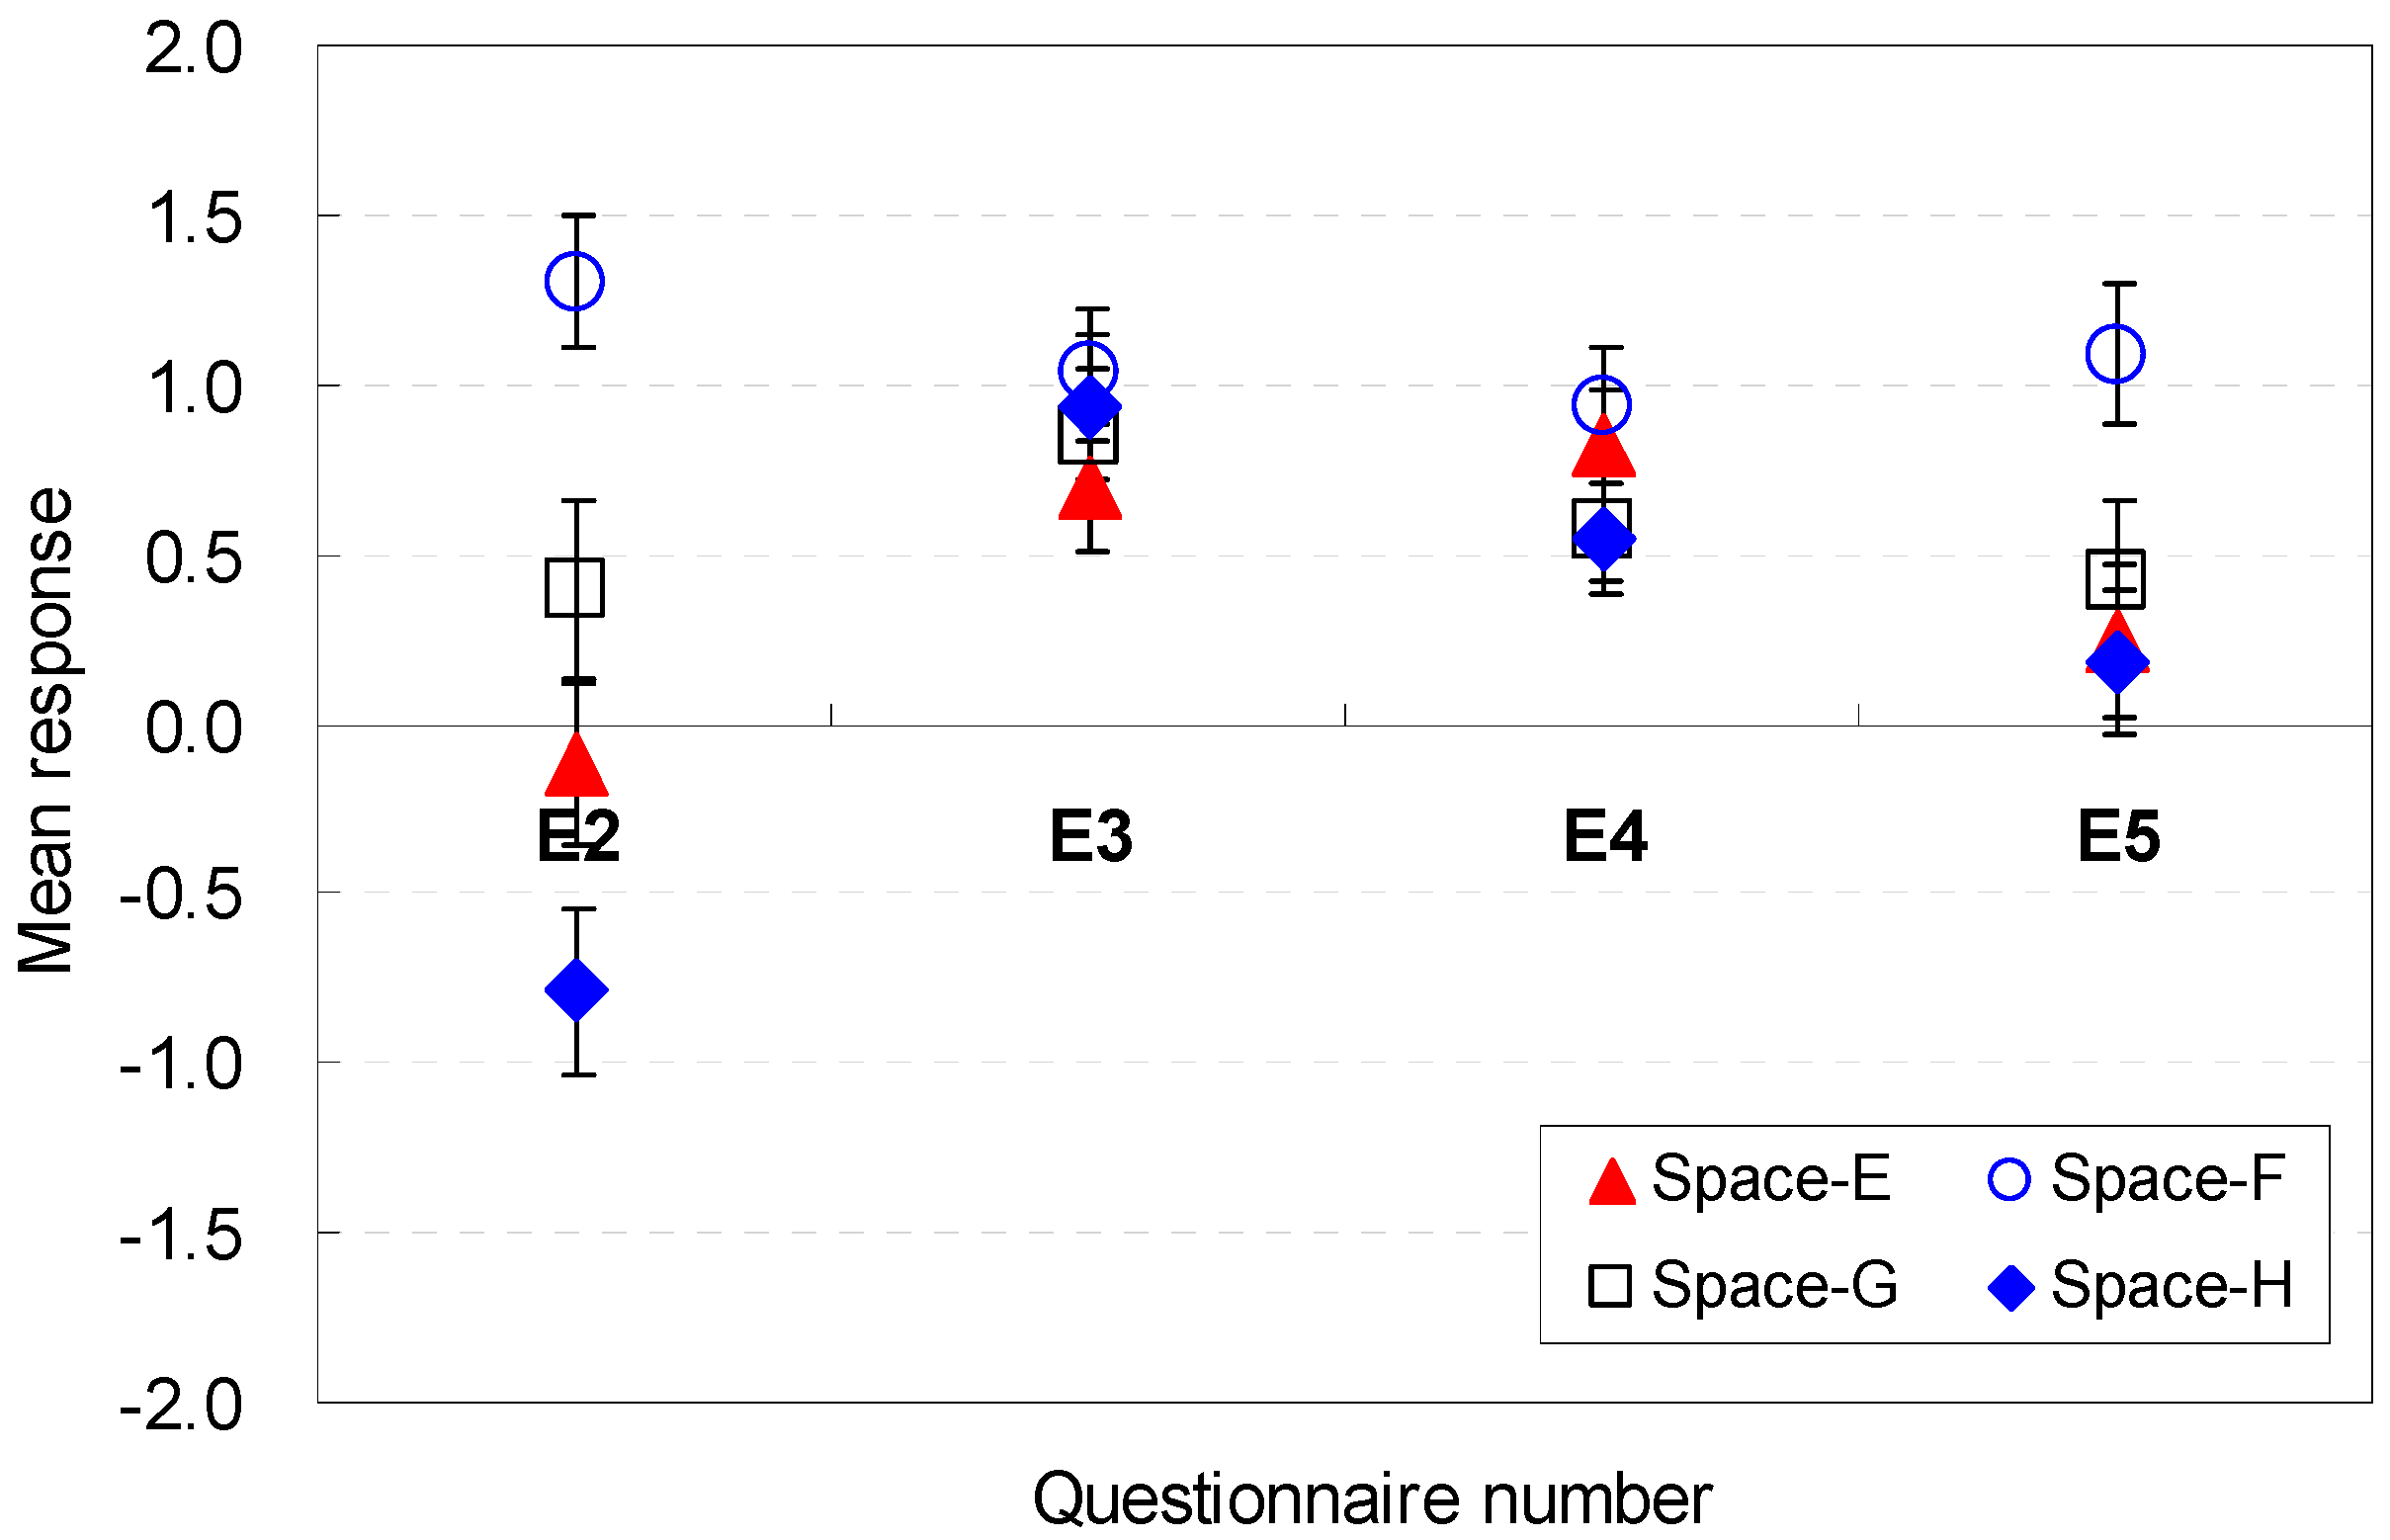
| E2 | Is the room width sufficient for serving guests? | spatial size |
| E3 | Is the room depth sufficient for serving guests? | |
| E4 | Is the room height sufficient for serving guests? | |
| E5 | Is the room area sufficient for serving guests? | |
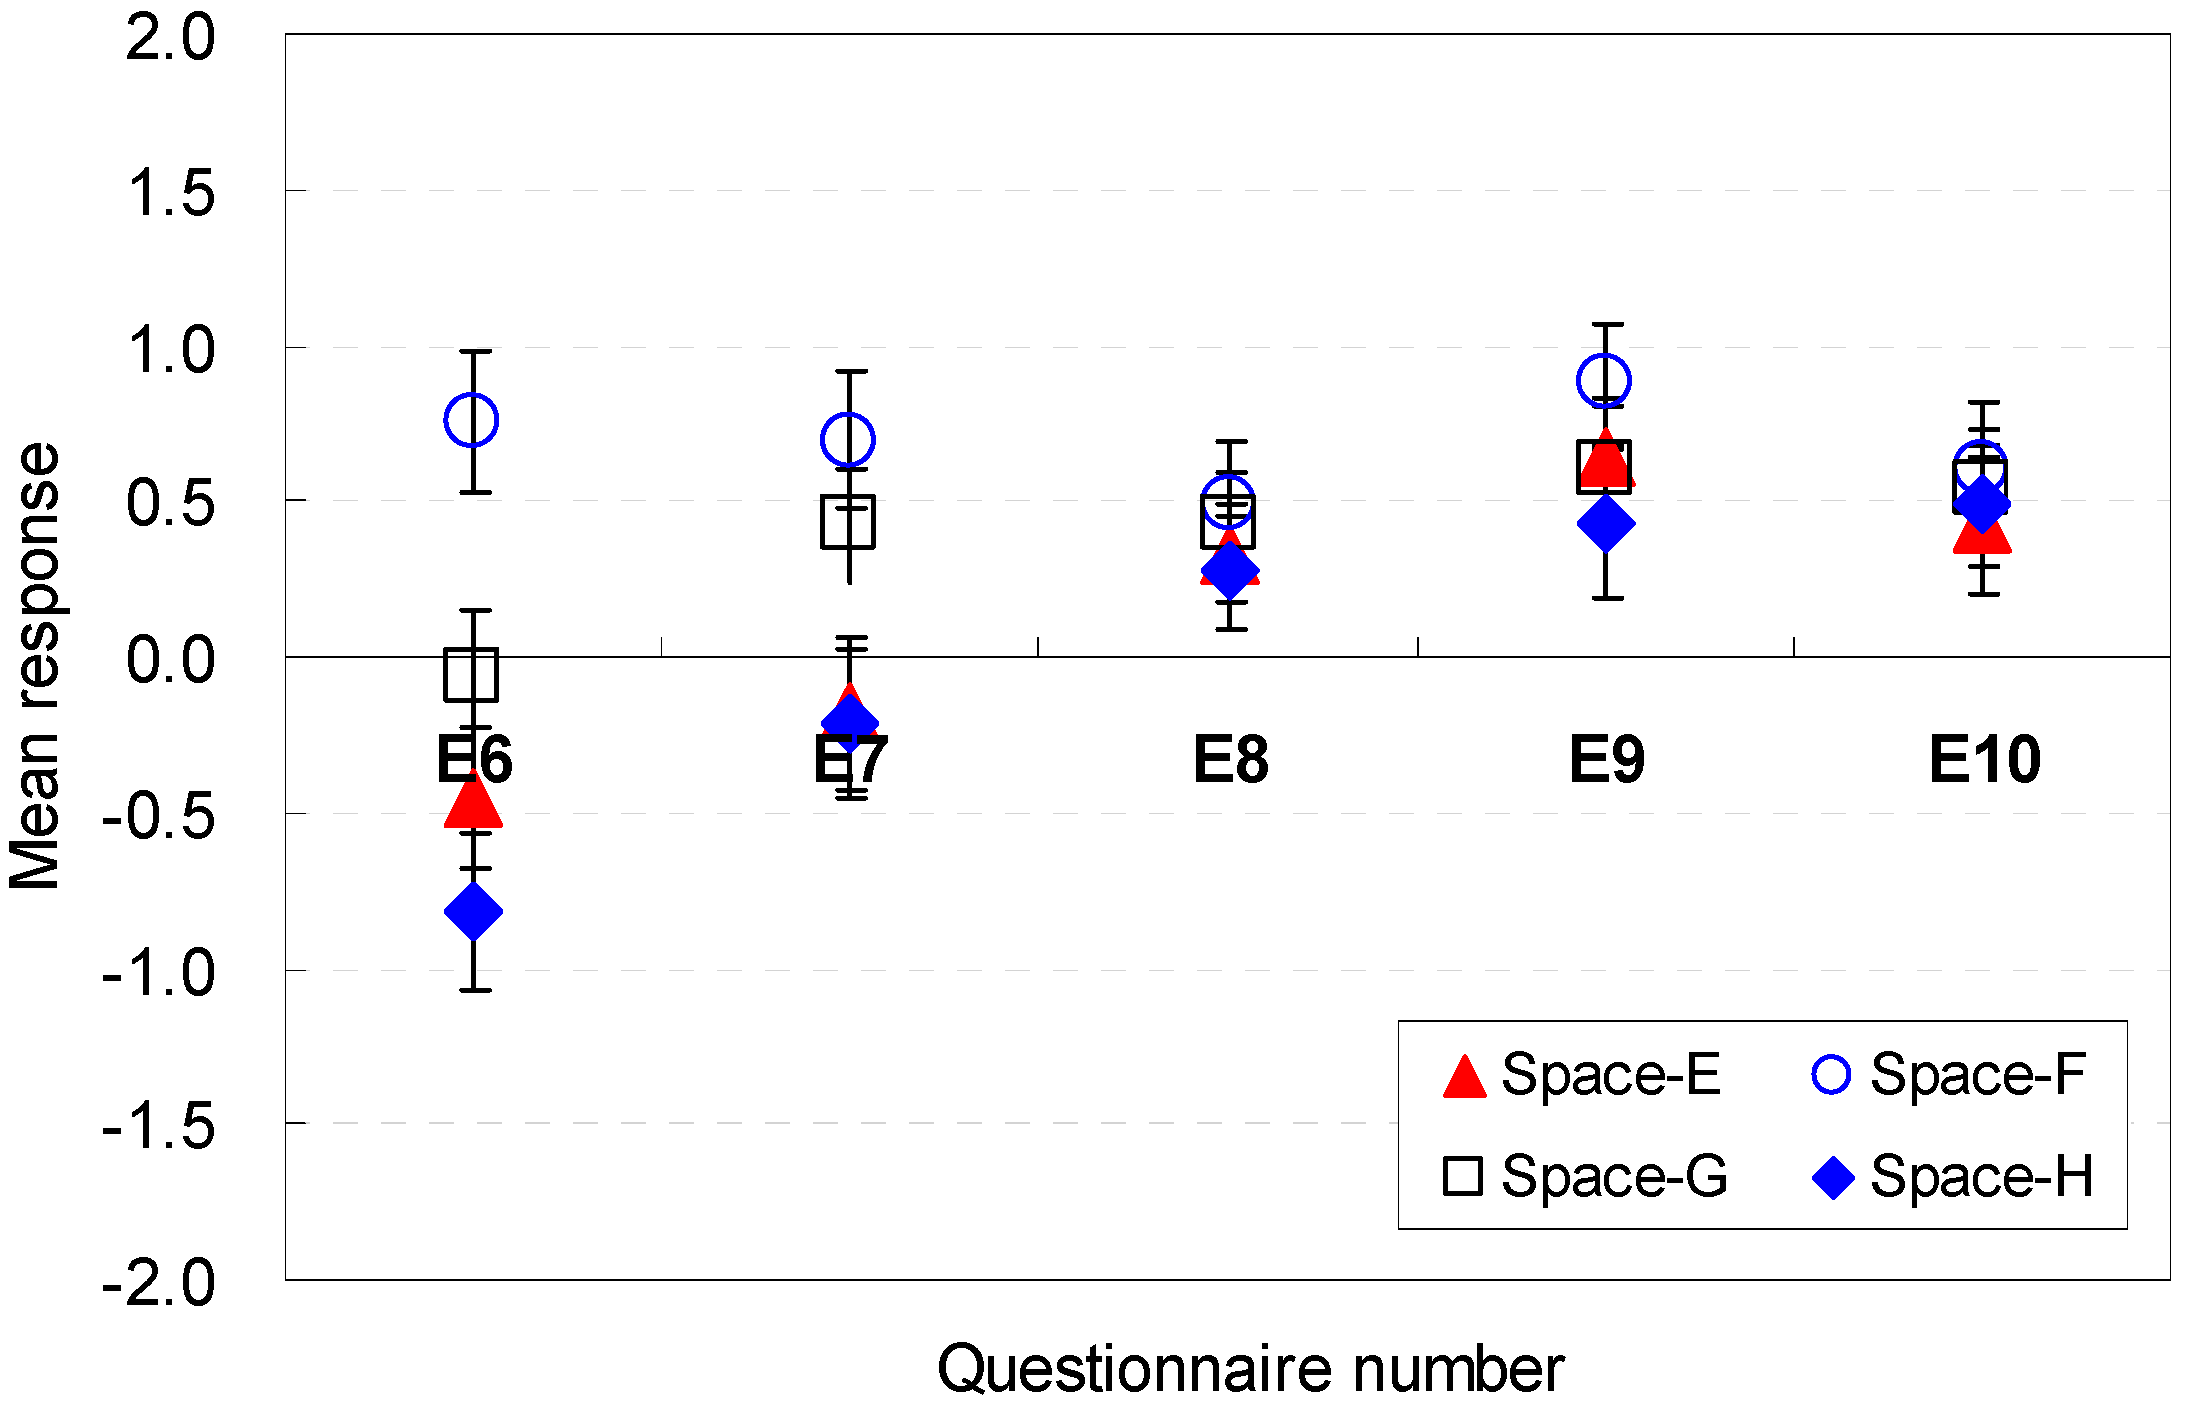
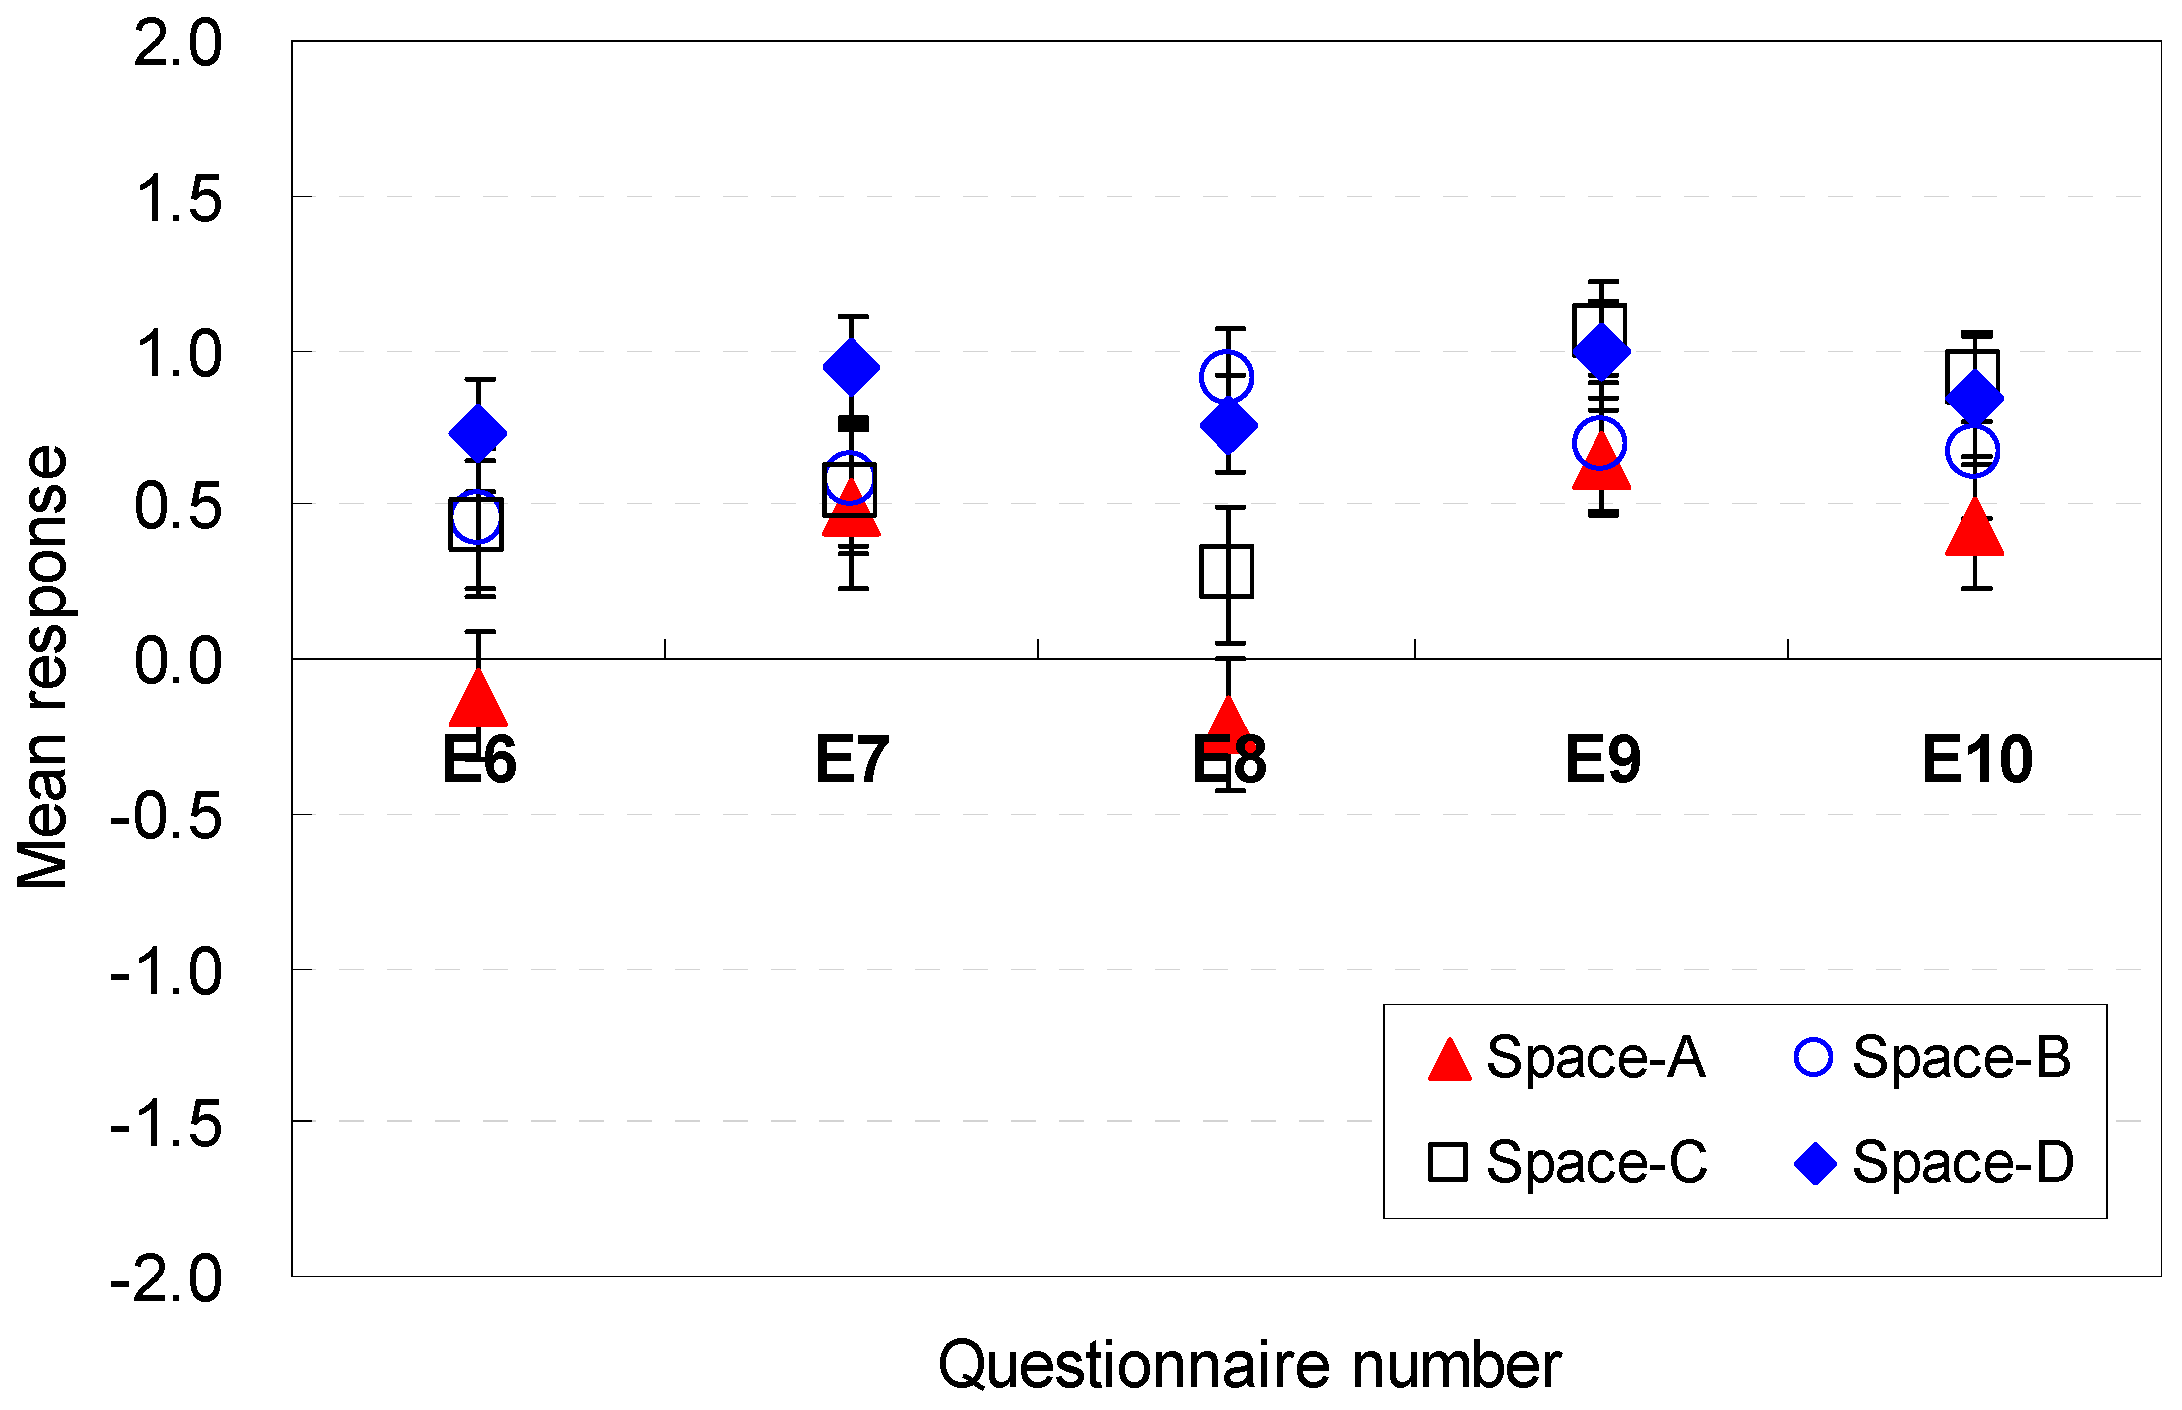
| E6 | Is the ratio of width to depth sufficient for serving guests? | spatial shape |
| E7 | Is the room shape sufficient for serving guests? | |
| E8 | Is the ratio of height to area sufficient for serving guests? | |
| E9 | Is the front window size sufficient for serving guests? | |
| E10 | Is the right window size sufficient for serving guests? | |
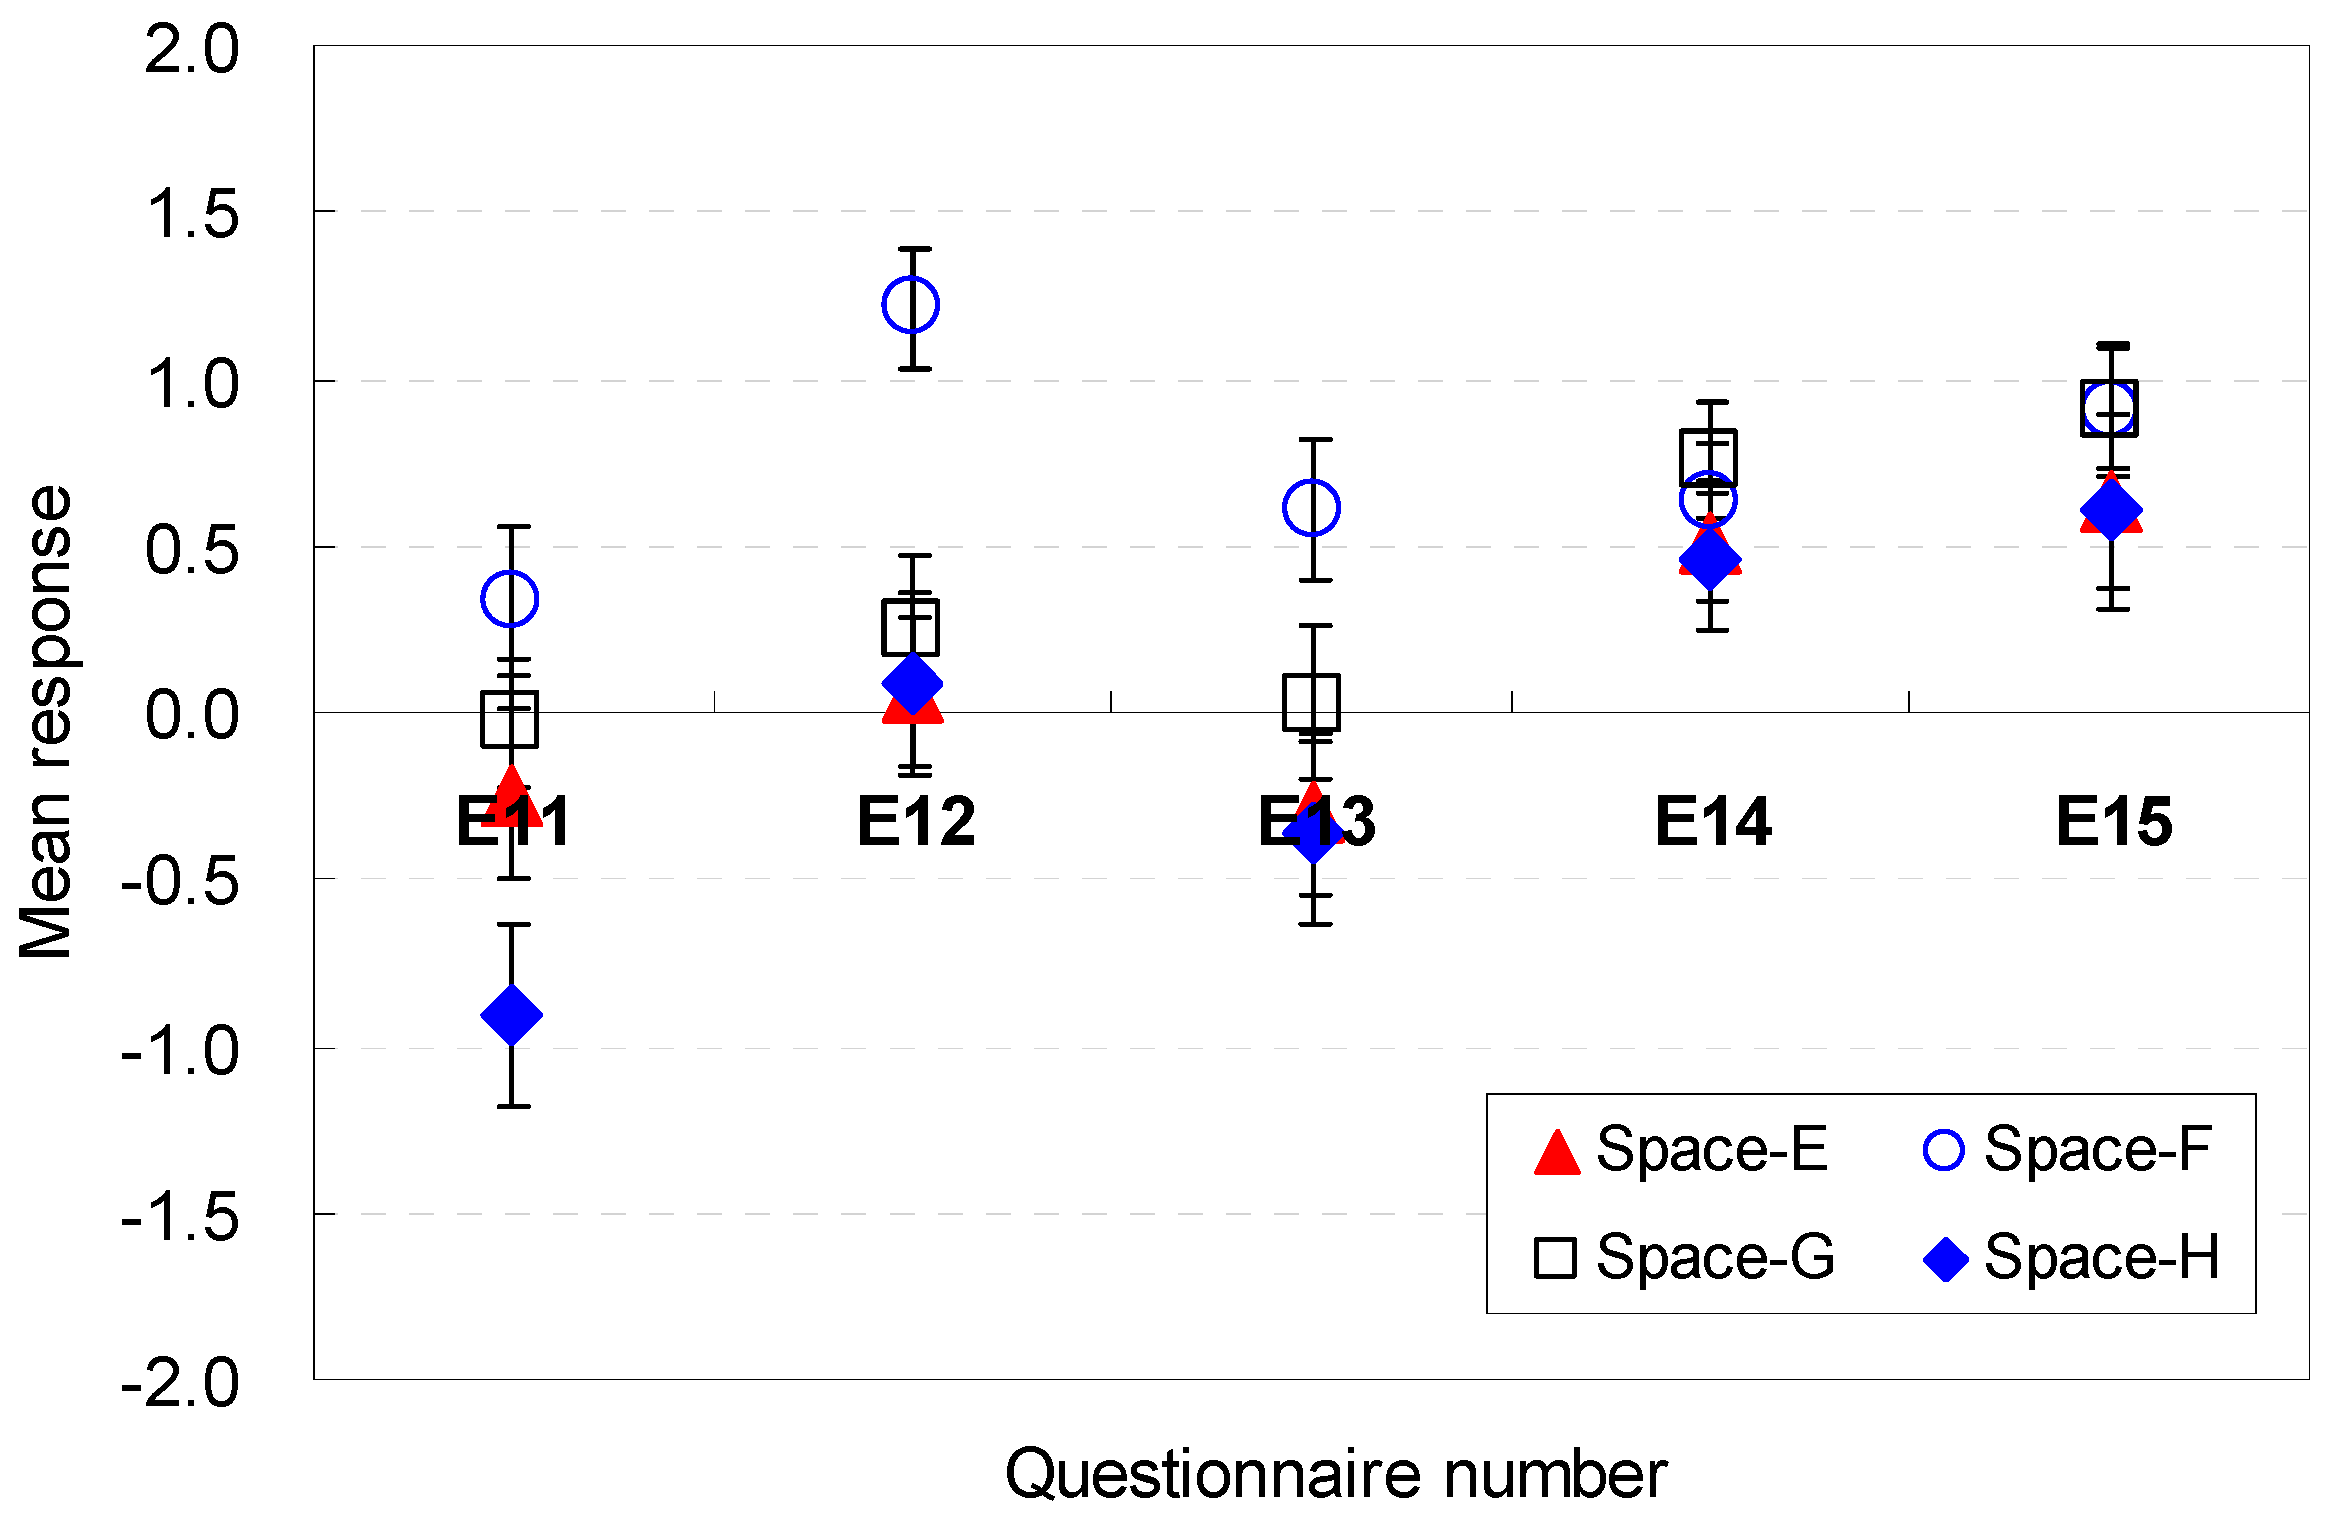
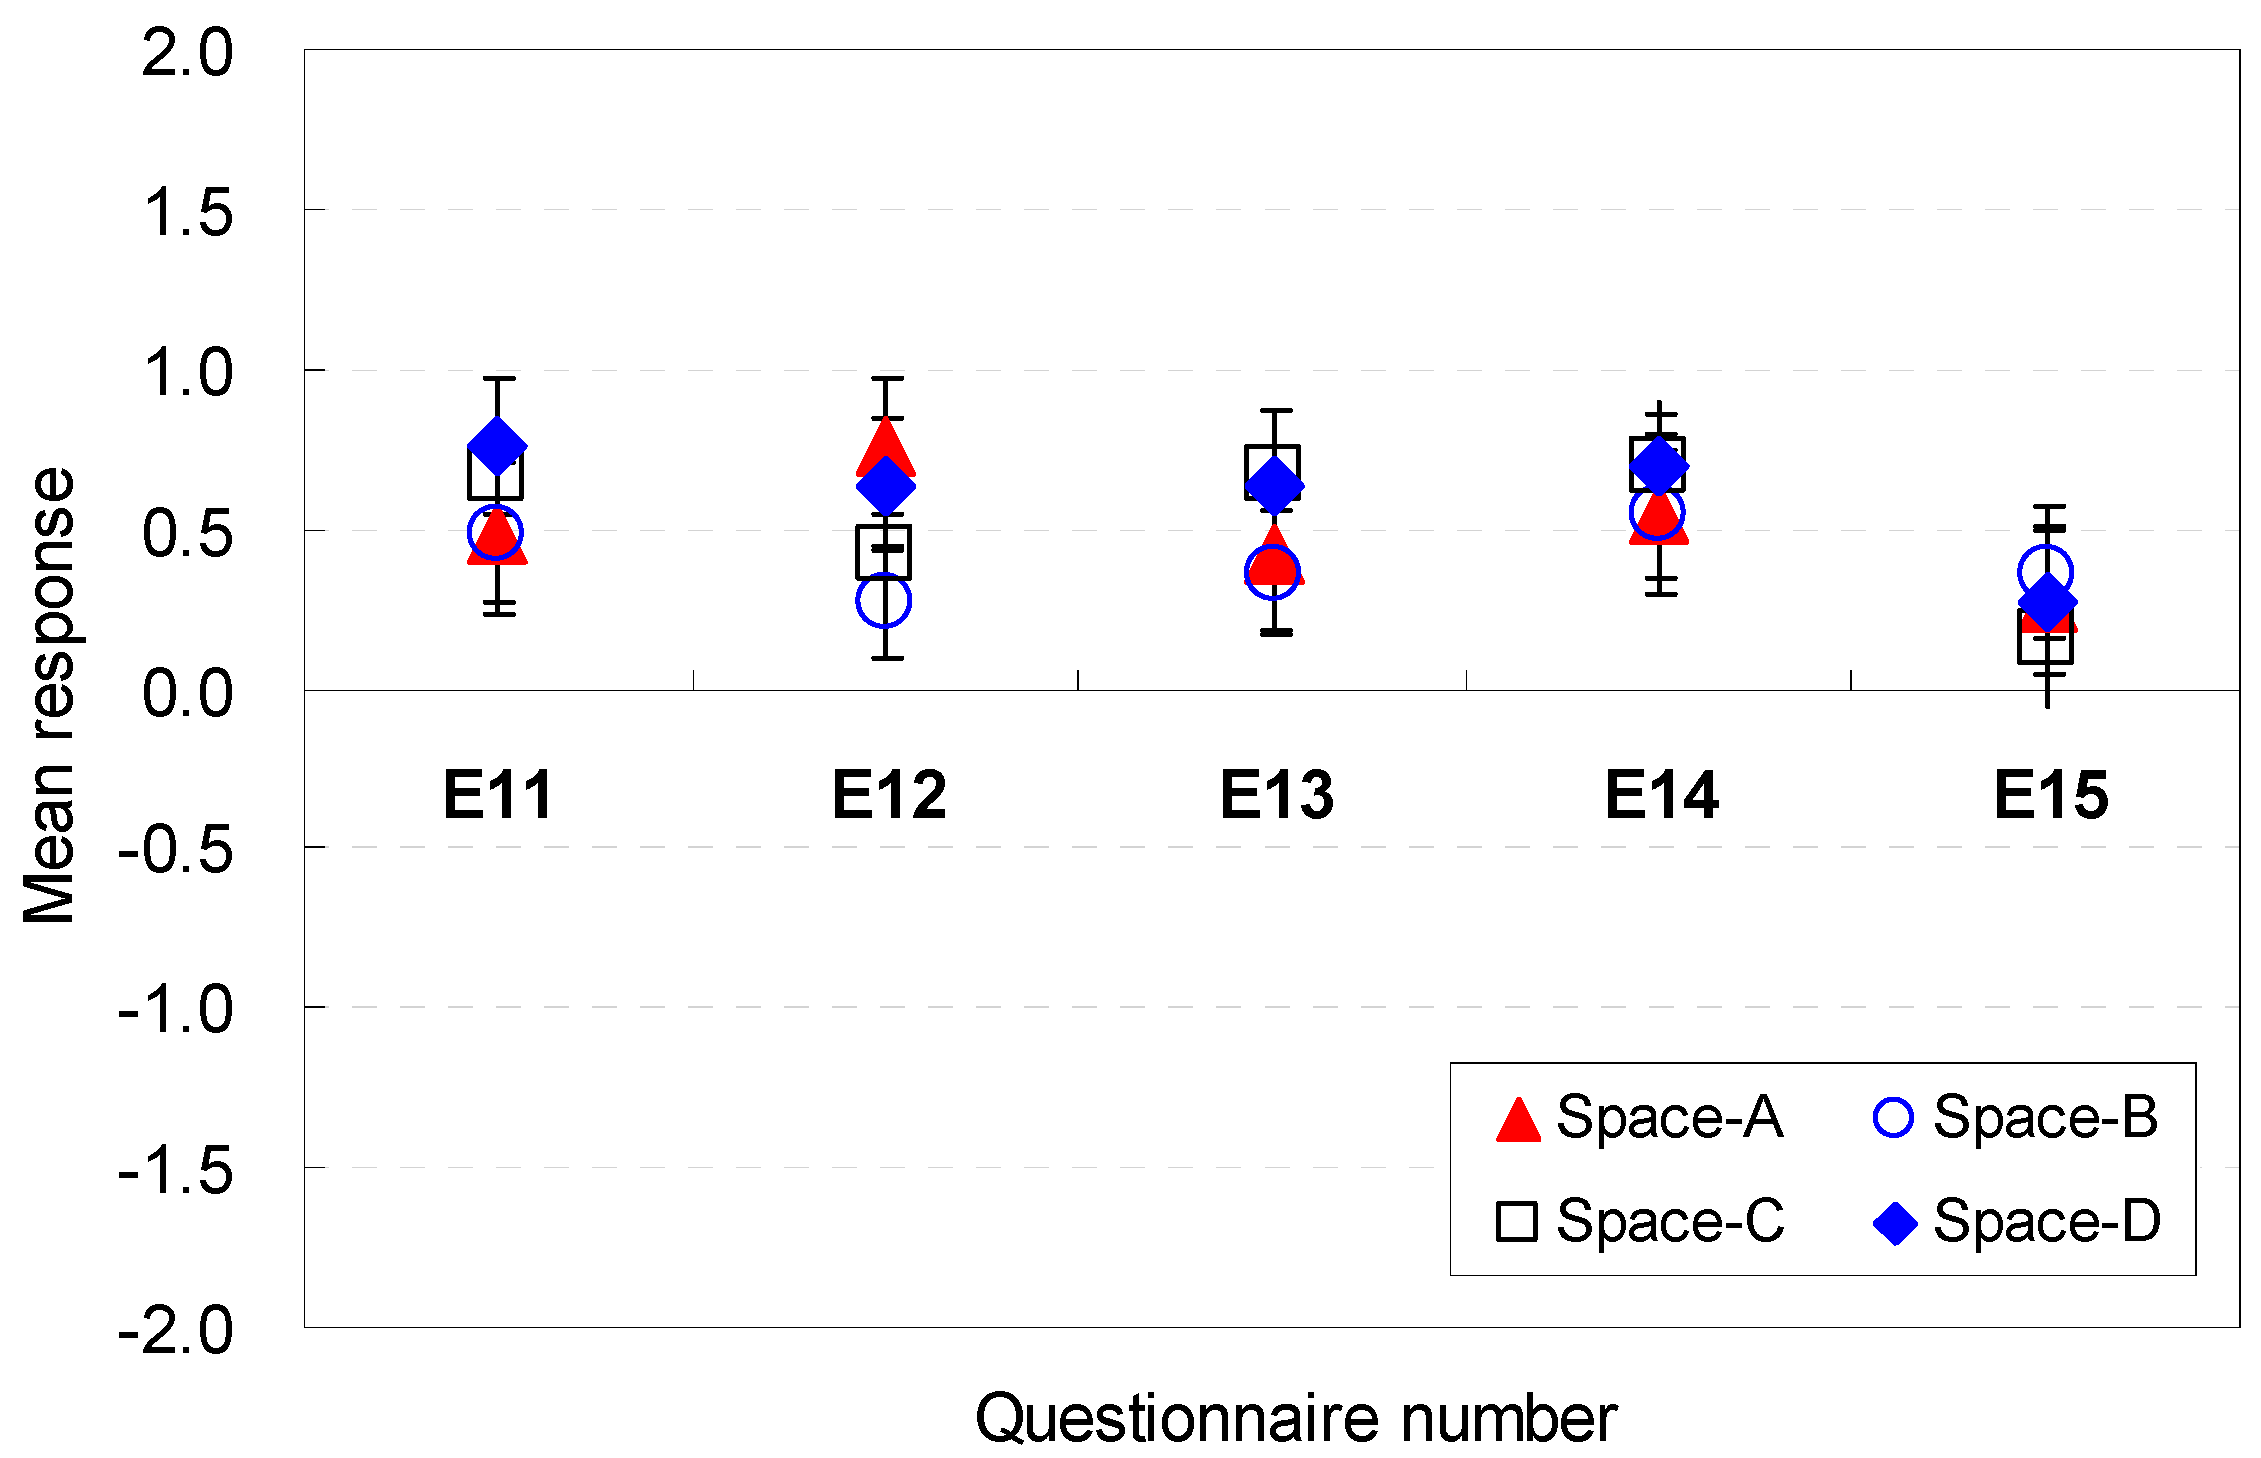
| E11 | Is the sofa location sufficient for serving guests? | spatial elements configuration |
| E12 | Is the vacant space sufficient for serving guests? | |
| E13 | Is the vacant space location sufficient for serving guests? | |
| E14 | Is the balcony door location sufficient for serving guests? | |
| E15 | Is the corridor width to balcony sufficient for serving guests? |
2.3. Occupants’ Participatory Evaluation Procedures and Statistical Analysis Method
- Step 1: Introduction for 15 min. Prior to the main tests, instructions were provided about the background of the tests with an explanation of the house plans and the survey procedure that is presented in Figure 2.
- Step 2: Priming for 15 min. Two types of framings were conducted in order to elaborate the potential occupants’ perceptions. The framing of categorical knowledge for the terminology of amenity and that for specific behavior in the current design alternatives were conducted. During the priming period, the participants adapted themselves to the current virtual spatial environments where the behavior settings were framed on amenity. The participants were primed to be ready to immediately respond with their judgment using both subconscious and conscious episodic memory activation [37].
- Step 3: Evaluation of perception (40 min). During the survey, the participants navigated eight spaces during the 40-min period and they perceived the spatial conditions of each room. When the participants navigated each room, they concurrently answered the survey questions that corresponded to each spatial element from Number 2 to Number 15 as listed in Table 2. These questions evaluated the perception of each spatial factor that affects the participant’s satisfaction with the amenity.
- Step 4: Evaluation of overall satisfaction after main survey (5 min). After the participants completed the navigation and answers for each room, they answered question Number 1 in Table 2.
3. Analysis of Occupants’ Perception of Amenity
3.1. Participants’ General Characteristics
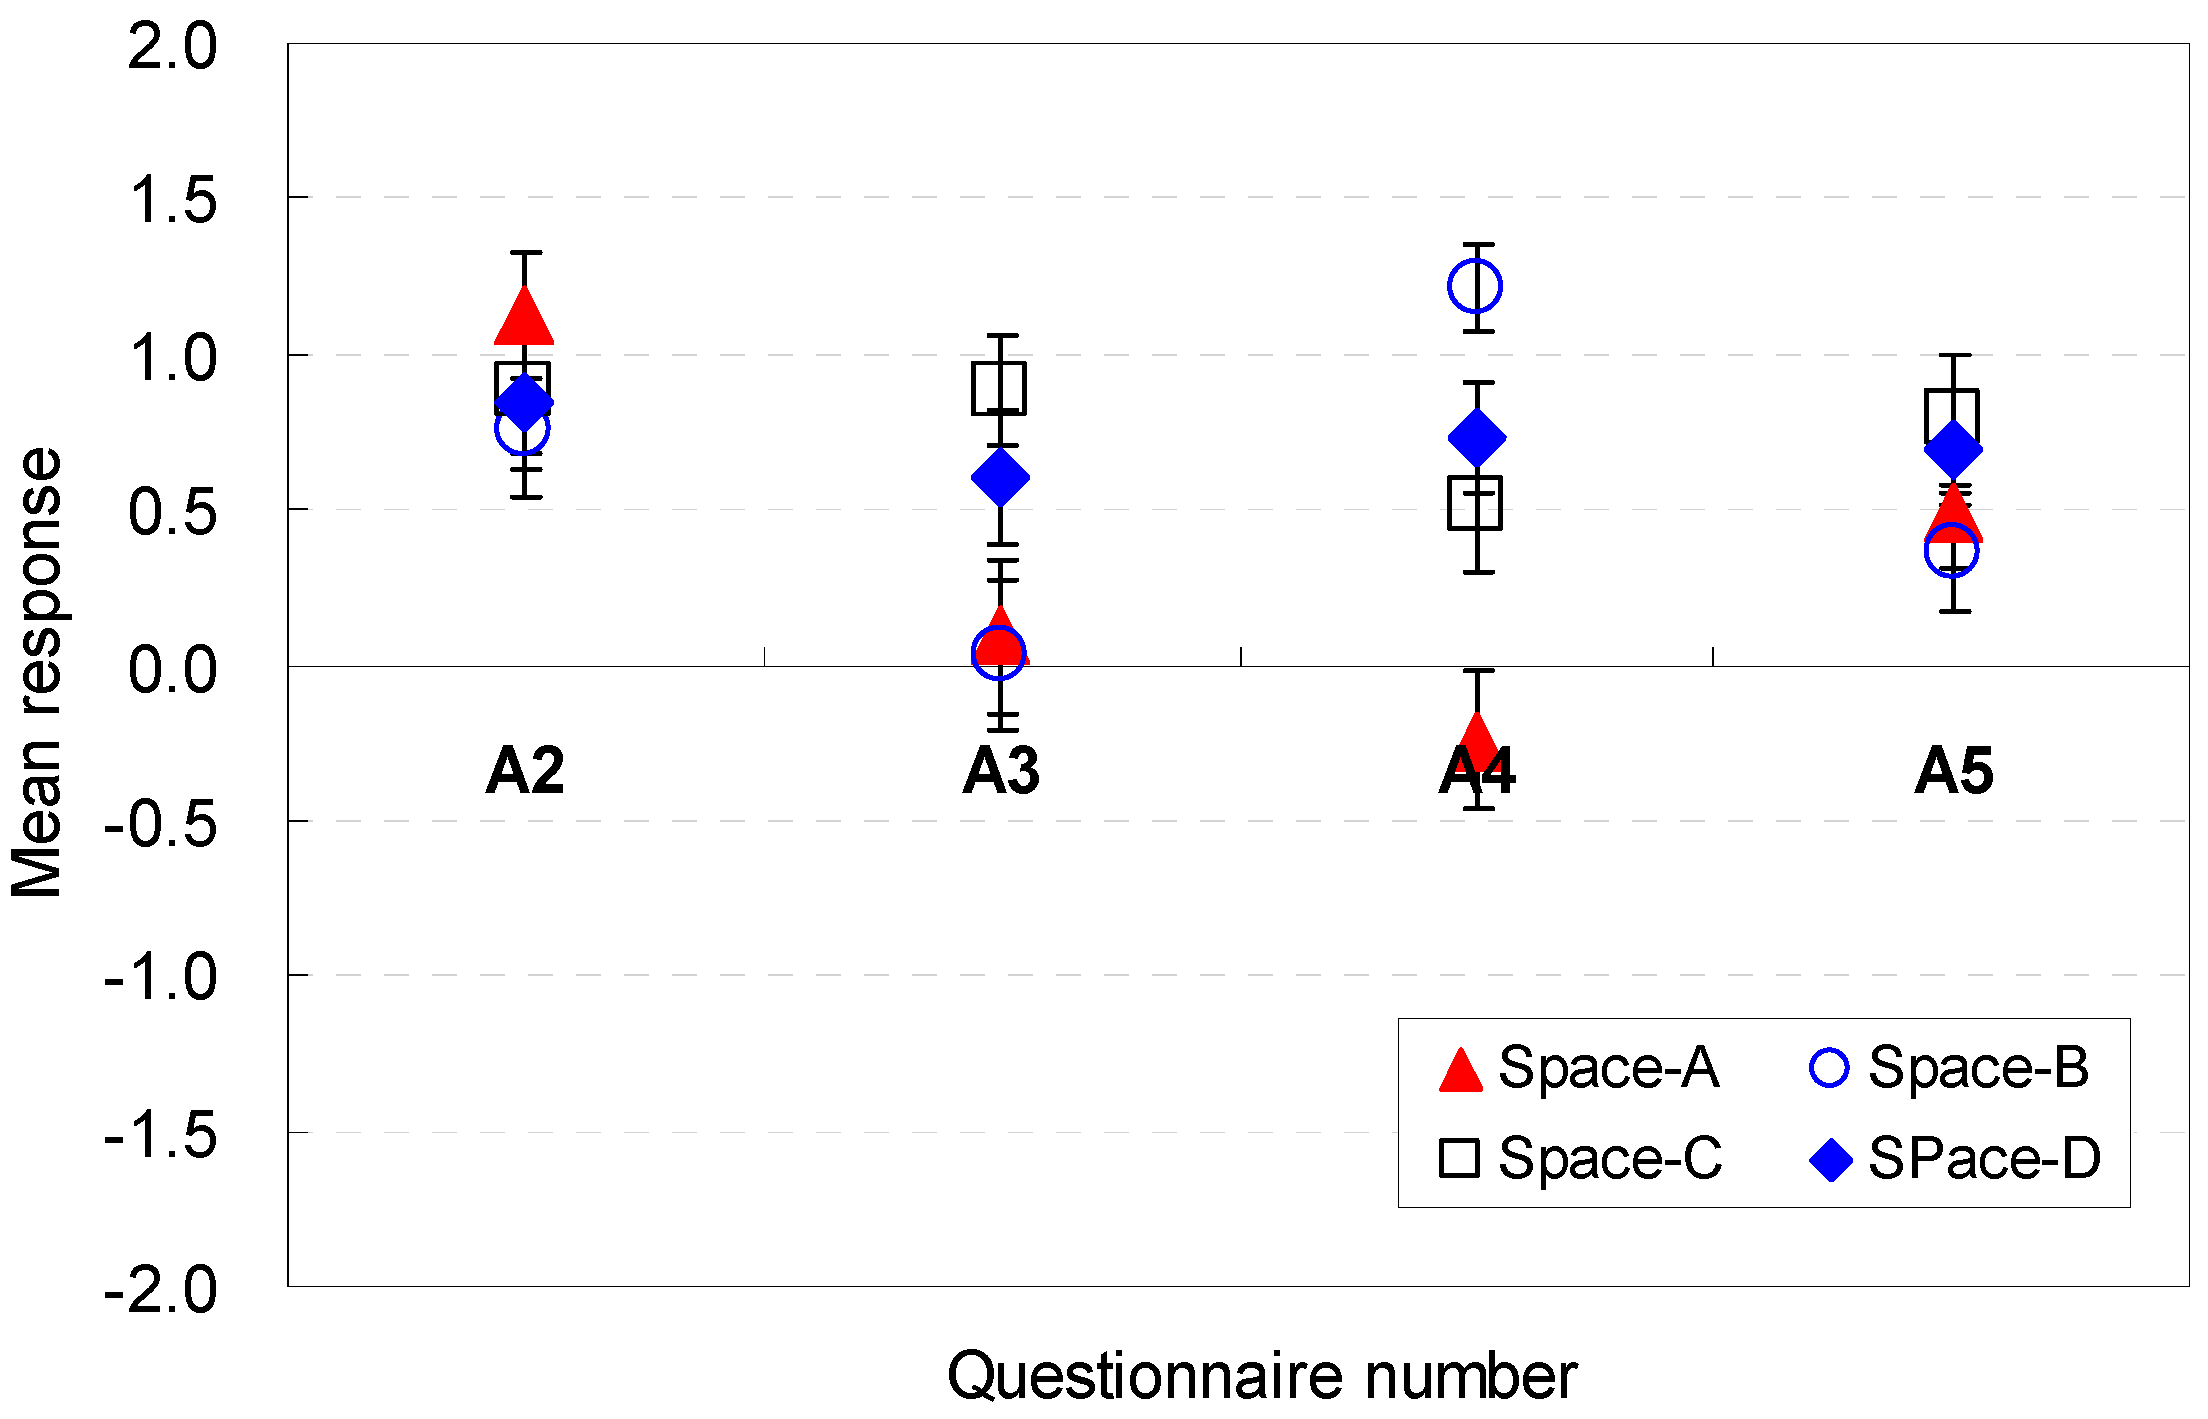
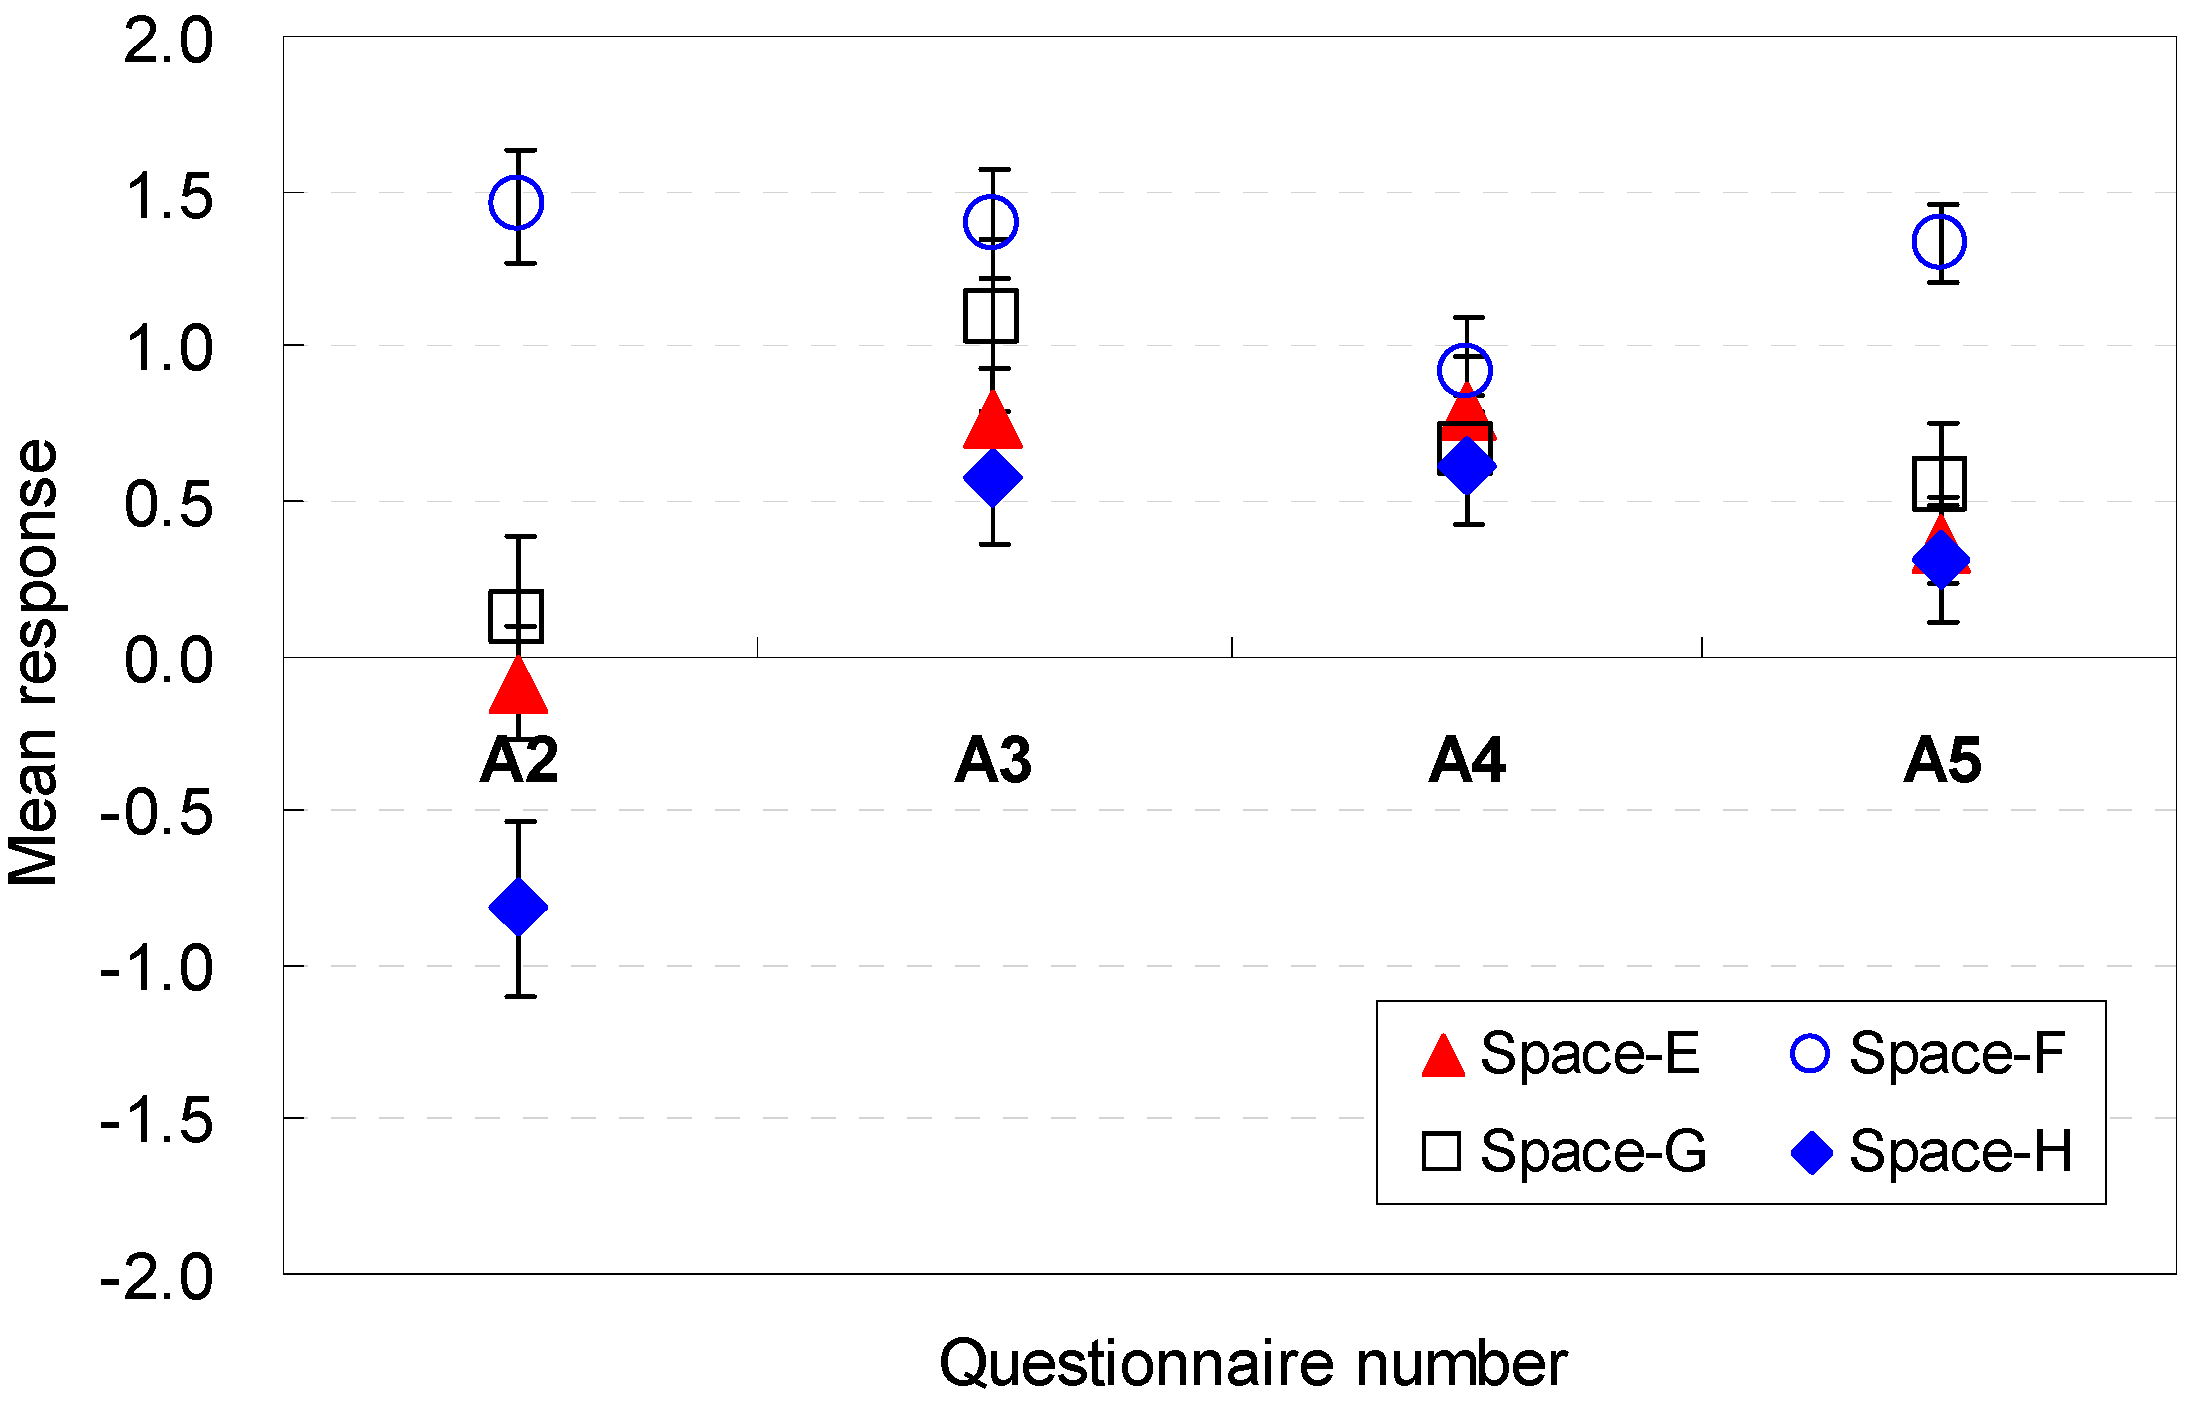
3.2. Effect of Spatial Size on the Perception of Amenity
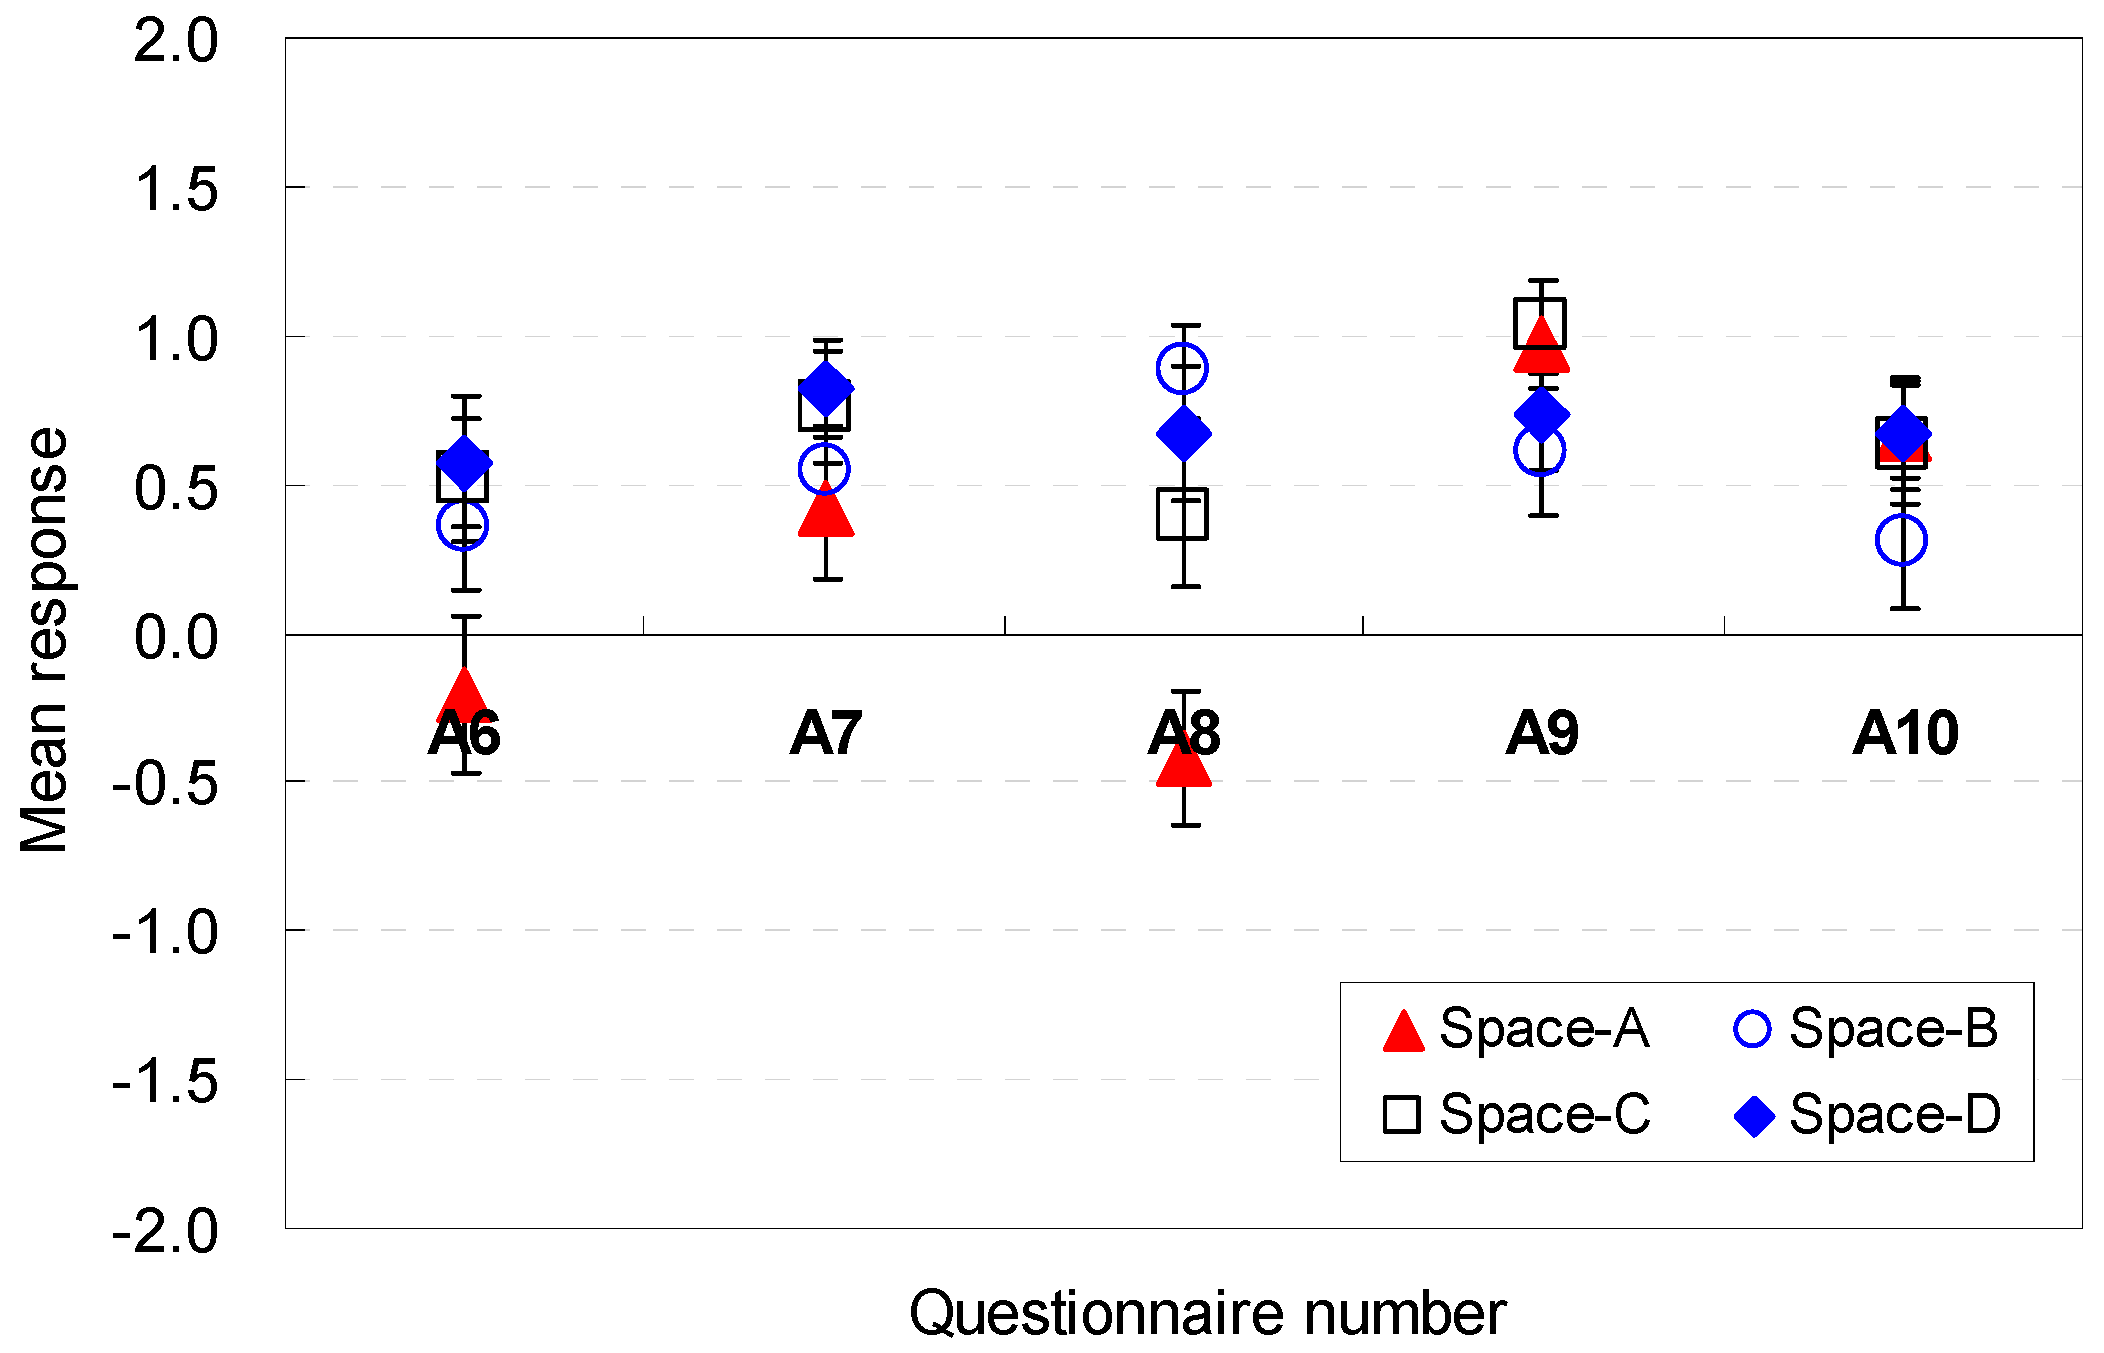
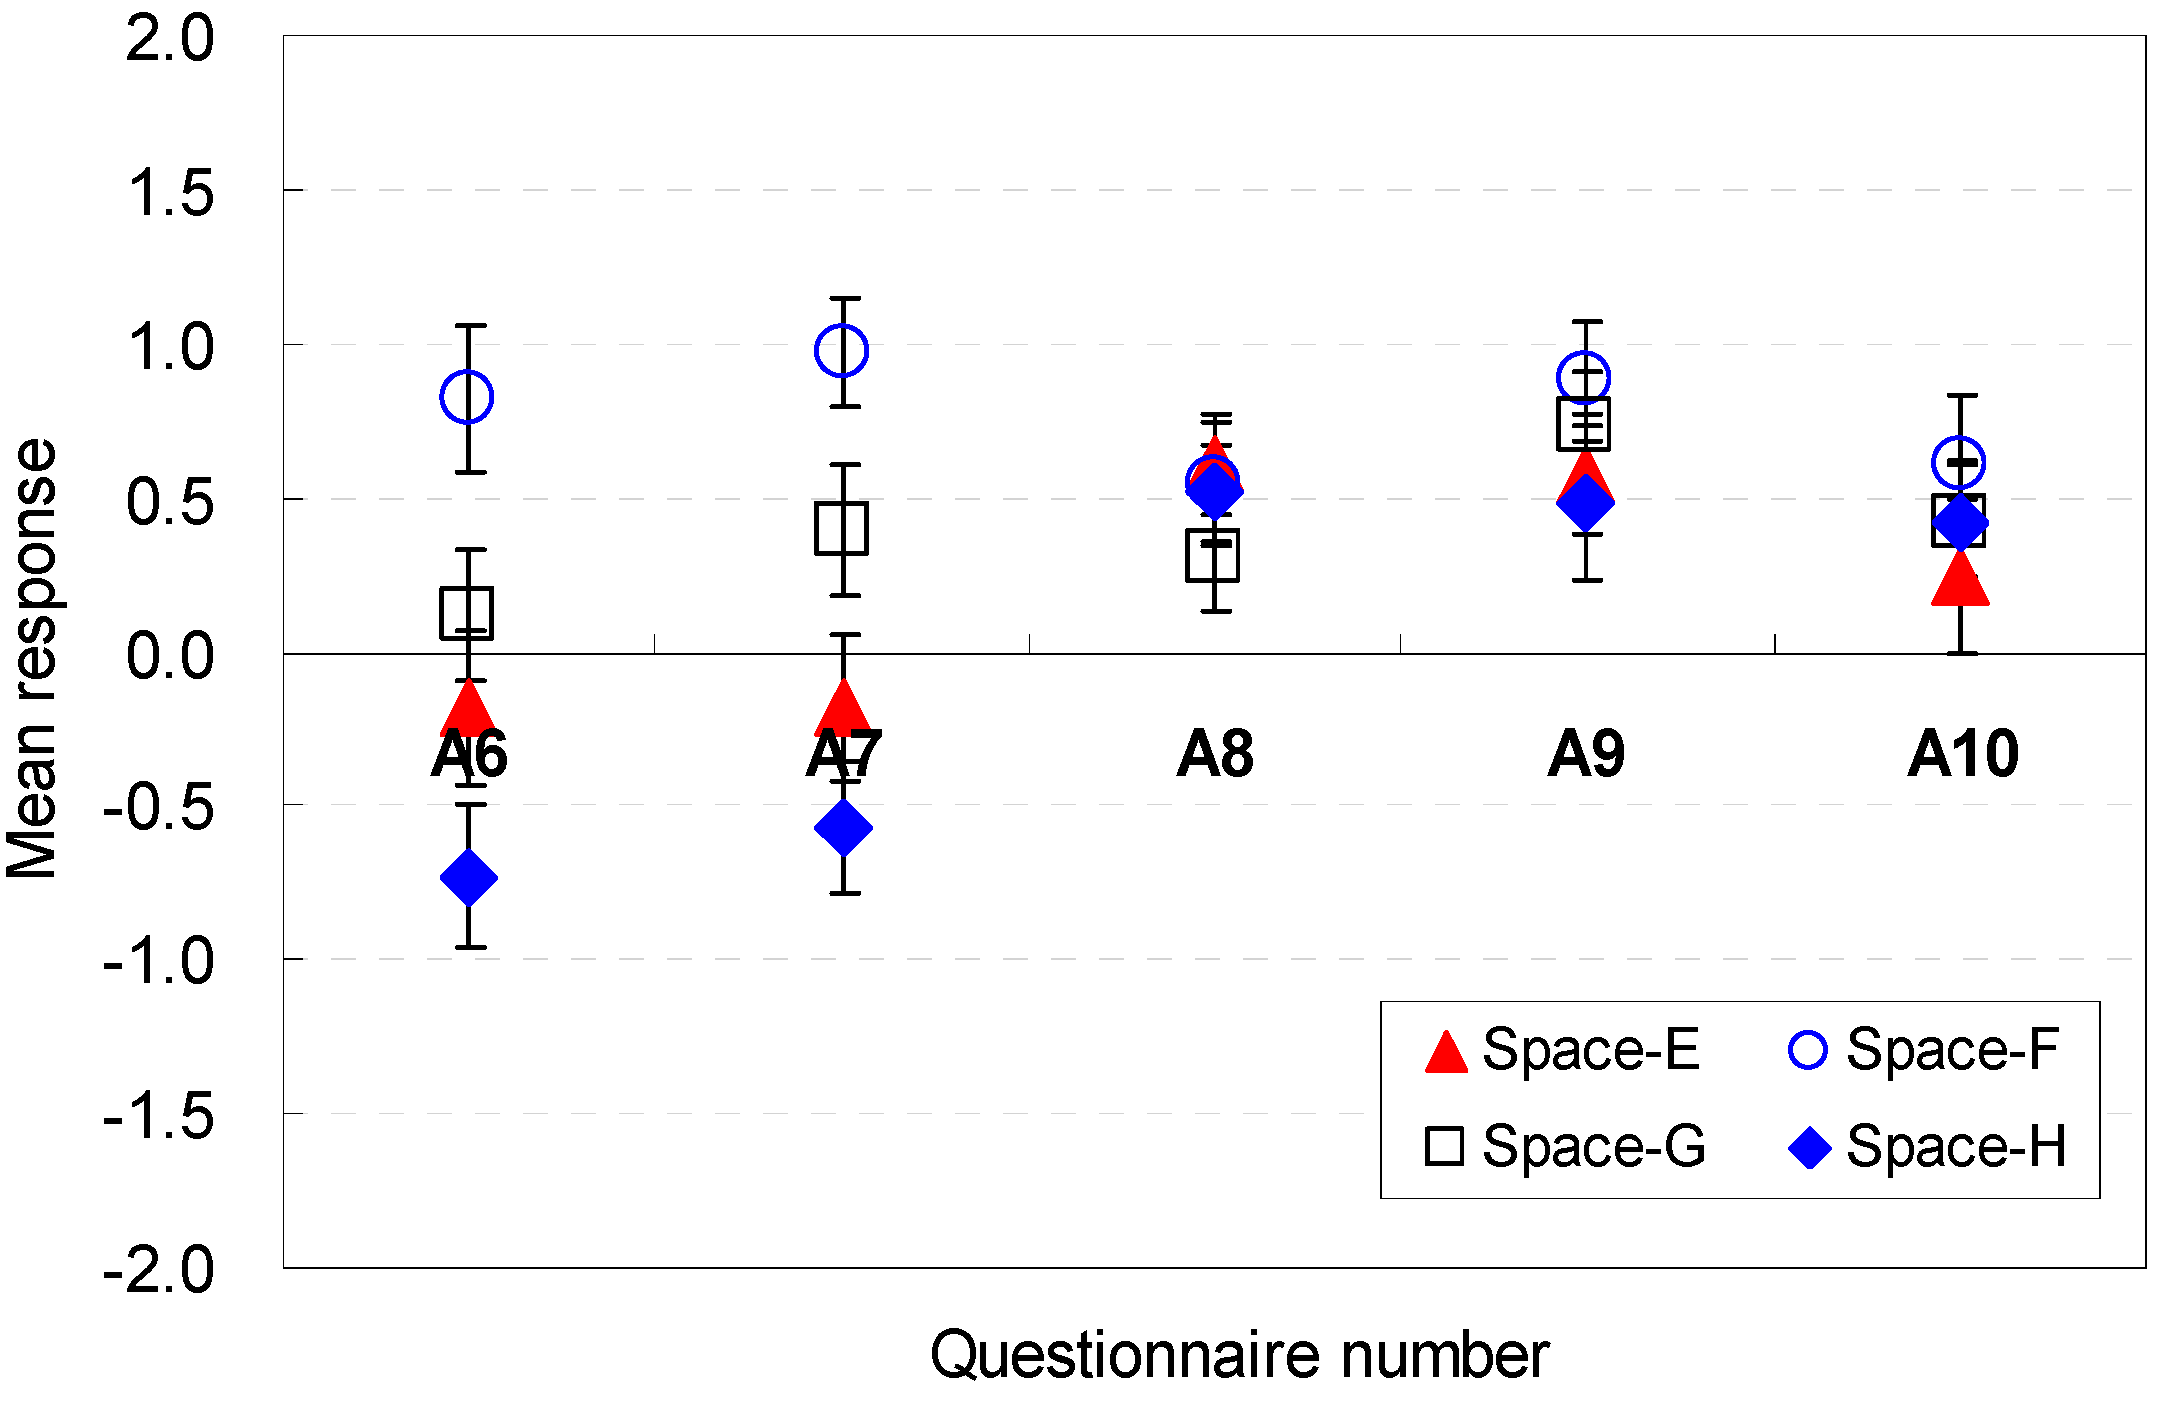
3.3. Effect of Spatial Shape on Perception of Amenity
3.4. Effect of Spatial Elements Configuration on Perception of Amenity

3.5. Overall Satisfaction of Space and the Influential Spatial Factors to Affect Satisfaction for Amenity

| Category | Number | Question Content | Findings in Response for Amenity Perception |
|---|---|---|---|
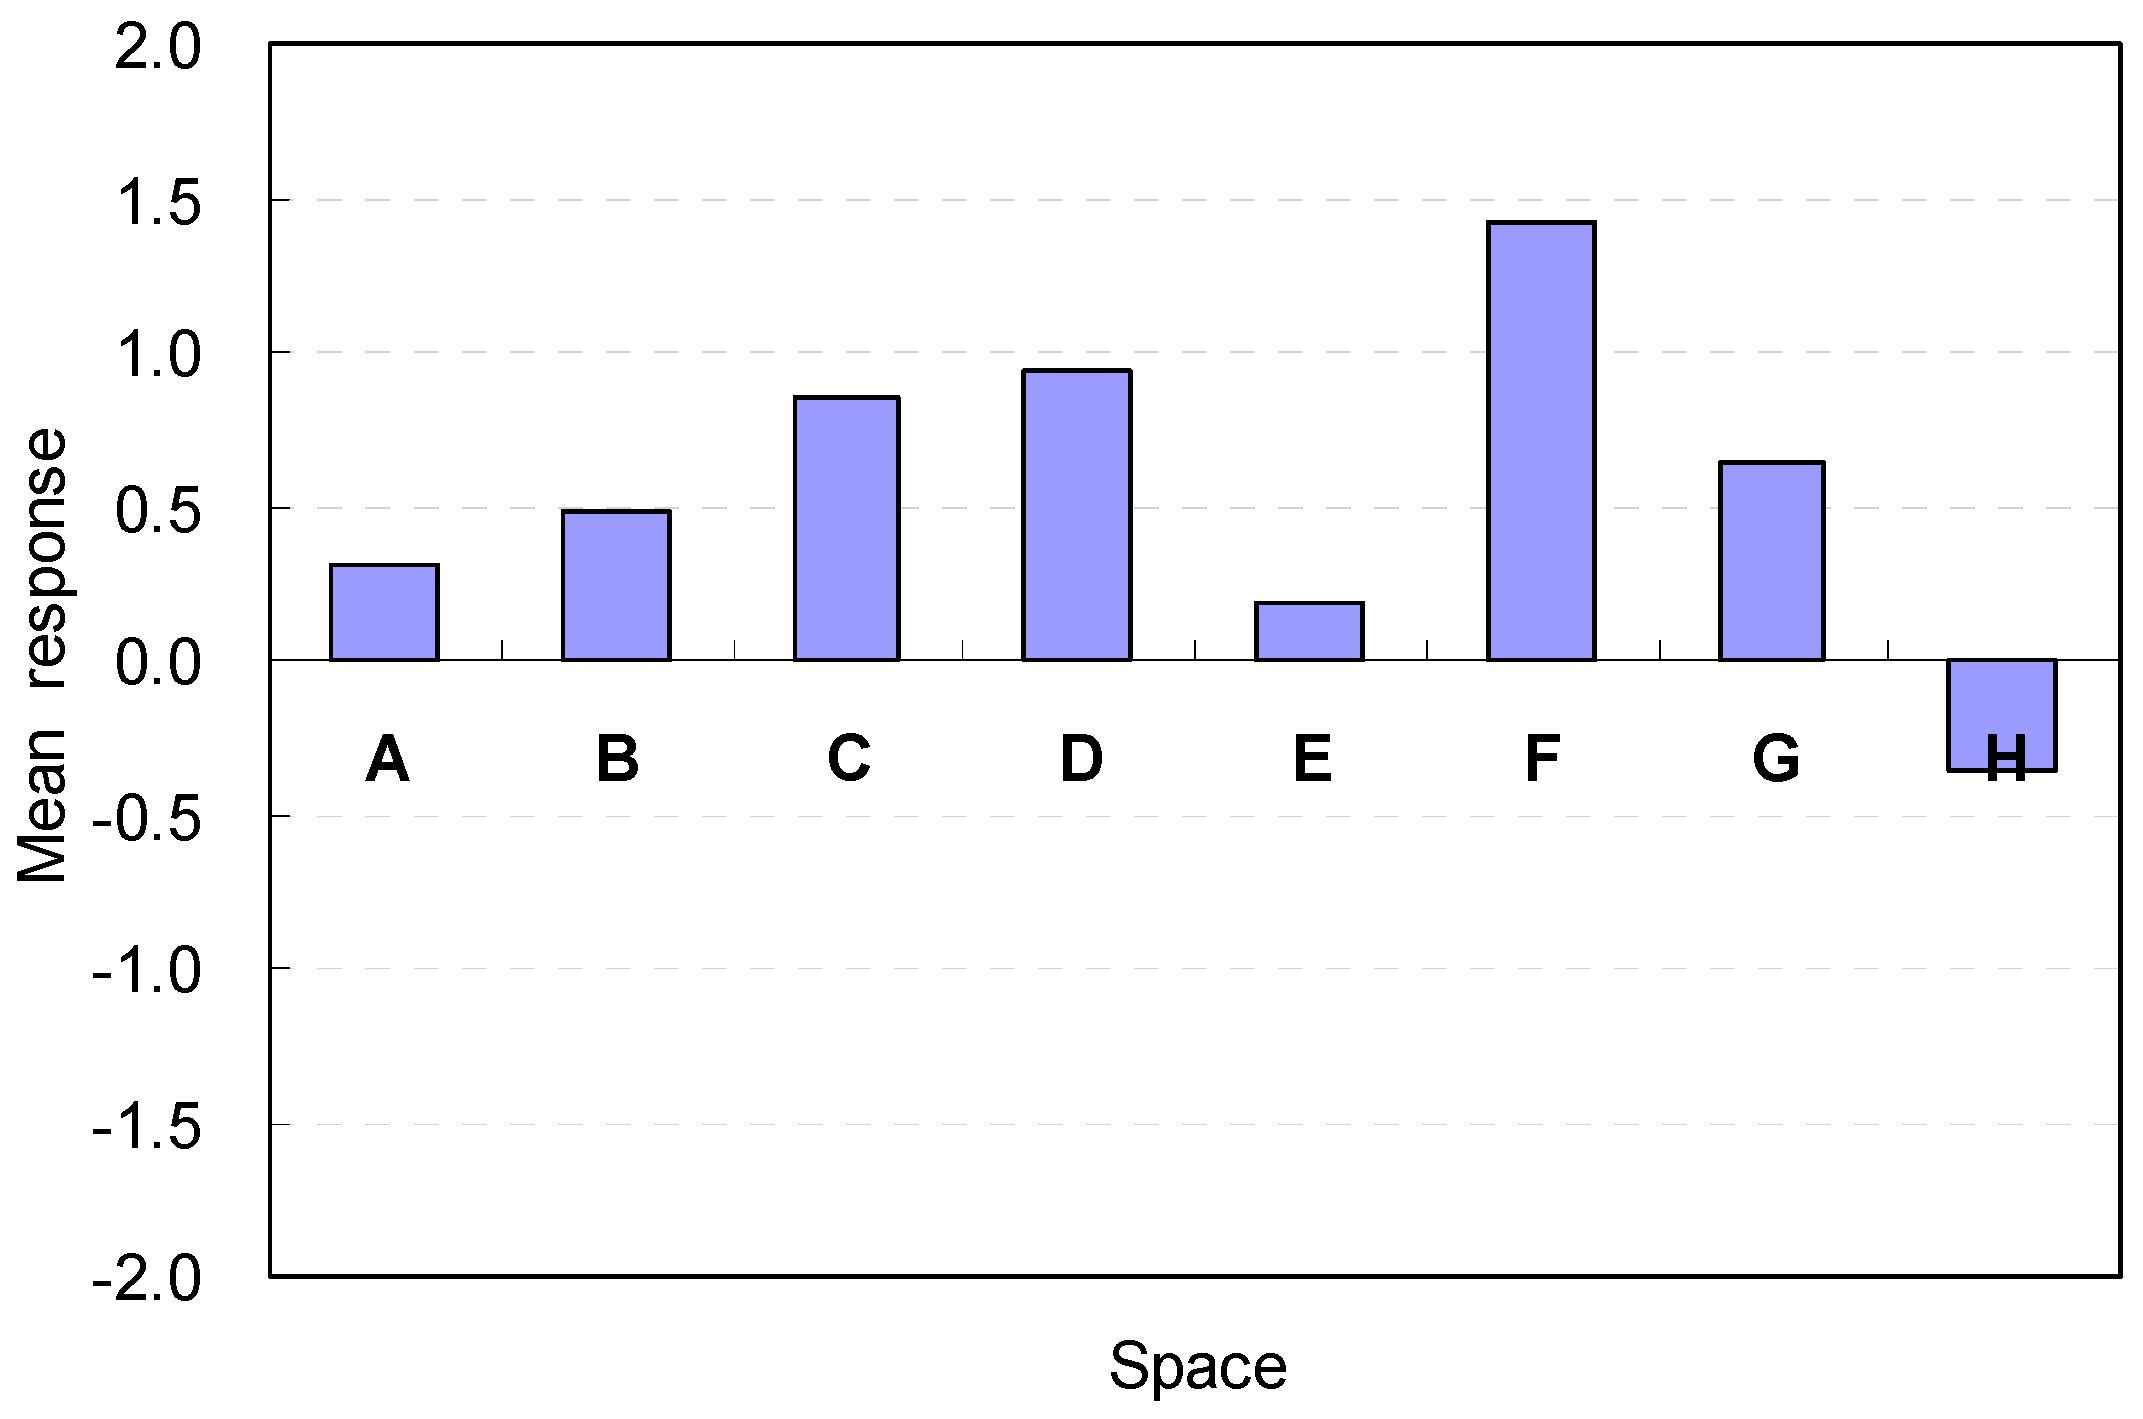
| space | A1 | sense of amenity | For Spaces A, B, C, and D, The perceptions of amenity were best when the ceiling height was 2.6 m; the harmonious composition of the best aesthetic stability and proportion between the ceiling height and width might be acceptable as effective spatial factors in the overall satisfaction; For Spaces E, F, G, and H, The rectangular shape that had the widest width (Space F) was the most favorable spatial condition; spatial arrangements that provide a clear view to the outdoor area without blocking the path might be an effective spatial factor for amenity. |
| spatial size | A2 | room width | The most positive responses for amenity were reported for Space F. The most negative perceptions were reported for Space H. |
| A3 | room depth | The lowest depth (Space F) was a strong contributor to the improvement of amenity | |
| A4 | room height | The highest ceiling height of 2.8 m in Space B was a strong contributor. 2.4 m for Space A failed to provide excellent perceptions | |
| A5 | room area | Space F, improved the perception of amenity for the space. The increase in the ceiling height deteriorated the spatial perception. | |
| spatial shape | A6 | ratio of width to depth | Wider widths in the ratio between the width and depth are an effective; Space F provided the most positive perceptions |
| A7 | room shape | Rectangular shape (Space F) with a wider width and shallower depth was the most acceptable shape | |
| A8 | ratio of height to area | Ratio of increasing the ceiling height to the area could contribute to increasing the amenity; Space B was acceptable | |
| A9 | front window size | Perceptions were influenced more by changes in the front window conditions than the side window conditions | |
| A10 | right window size | Window dimensions were not critical and did not generate distinguishable differences | |
| spatial elements configuration | A11 | sofa location | For Spaces A, B, C, and D, was generally acceptable. For Spaces E, F, G, and H (A11), the furniture layout reduced the spatial perception. |
| A12 | the vacant space size | Space F was the most agreeable condition | |
| A13 | vacant space location | Space F, separated from the sofa area and was close to the entrance area, increased the perception | |
| A14 | balcony door location | A broad width of the pathway to the balcony was an agreeable condition. | |
| A15 | corridor width to balcony | Space F, which had a wide width and shallow depth, provided a more agreeable condition to afford amenity. |
| Space | Variable | Unstandardized Coefficient | T | Sig. | ANOVA | |
|---|---|---|---|---|---|---|
| B | Std. Error | |||||
| A, B, C, D | (Constant) | 0.082 | 0.091 | 0.91 | 0.37 | F(5,126) = 31.76; Sig. = 0.00; r2 = 0.558 |
| A2 | 0.228 | 0.058 | 3.92 | 0.00 | ||
| A3 | 0.370 | 0.058 | 6.34 | 0.00 | ||
| A4 | 0.338 | 0.061 | 5.50 | 0.00 | ||
| A10 | 0.193 | 0.061 | 3.18 | 0.00 | ||
| A15 | −0.193 | 0.066 | −2.93 | 0.00 | ||
| E, F, G, H | (Constant) | 0.032 | 0.085 | 0.38 | 0.70 | F(5,126) = 70.16; Sig. = 0.00; r2 = 0.736 |
| A2 | 0.312 | 0.046 | 6.73 | 0.00 | ||
| A3 | 0.234 | 0.057 | 4.07 | 0.00 | ||
| A4 | 0.171 | 0.064 | 2.67 | 0.01 | ||
| A7 | 0.284 | 0.064 | 4.42 | 0.00 | ||
| A13 | 0.133 | 0.053 | 2.51 | 0.01 | ||
4. Analysis of Occupants’ Perception of Efficiency
4.1. Effect of Spatial Size on Perception of Efficiency
4.2. Effect of Spatial Shape on Perception of Efficiency

4.3. Effect of Spatial Elements Configuration on Perception of Efficiency

4.4. Overall Satisfaction of Space and the Influential Spatial Factors to Affect Satisfaction for Efficiency
| Category | Number | Question Content | Findings in Response for Amenity Perception |
|---|---|---|---|
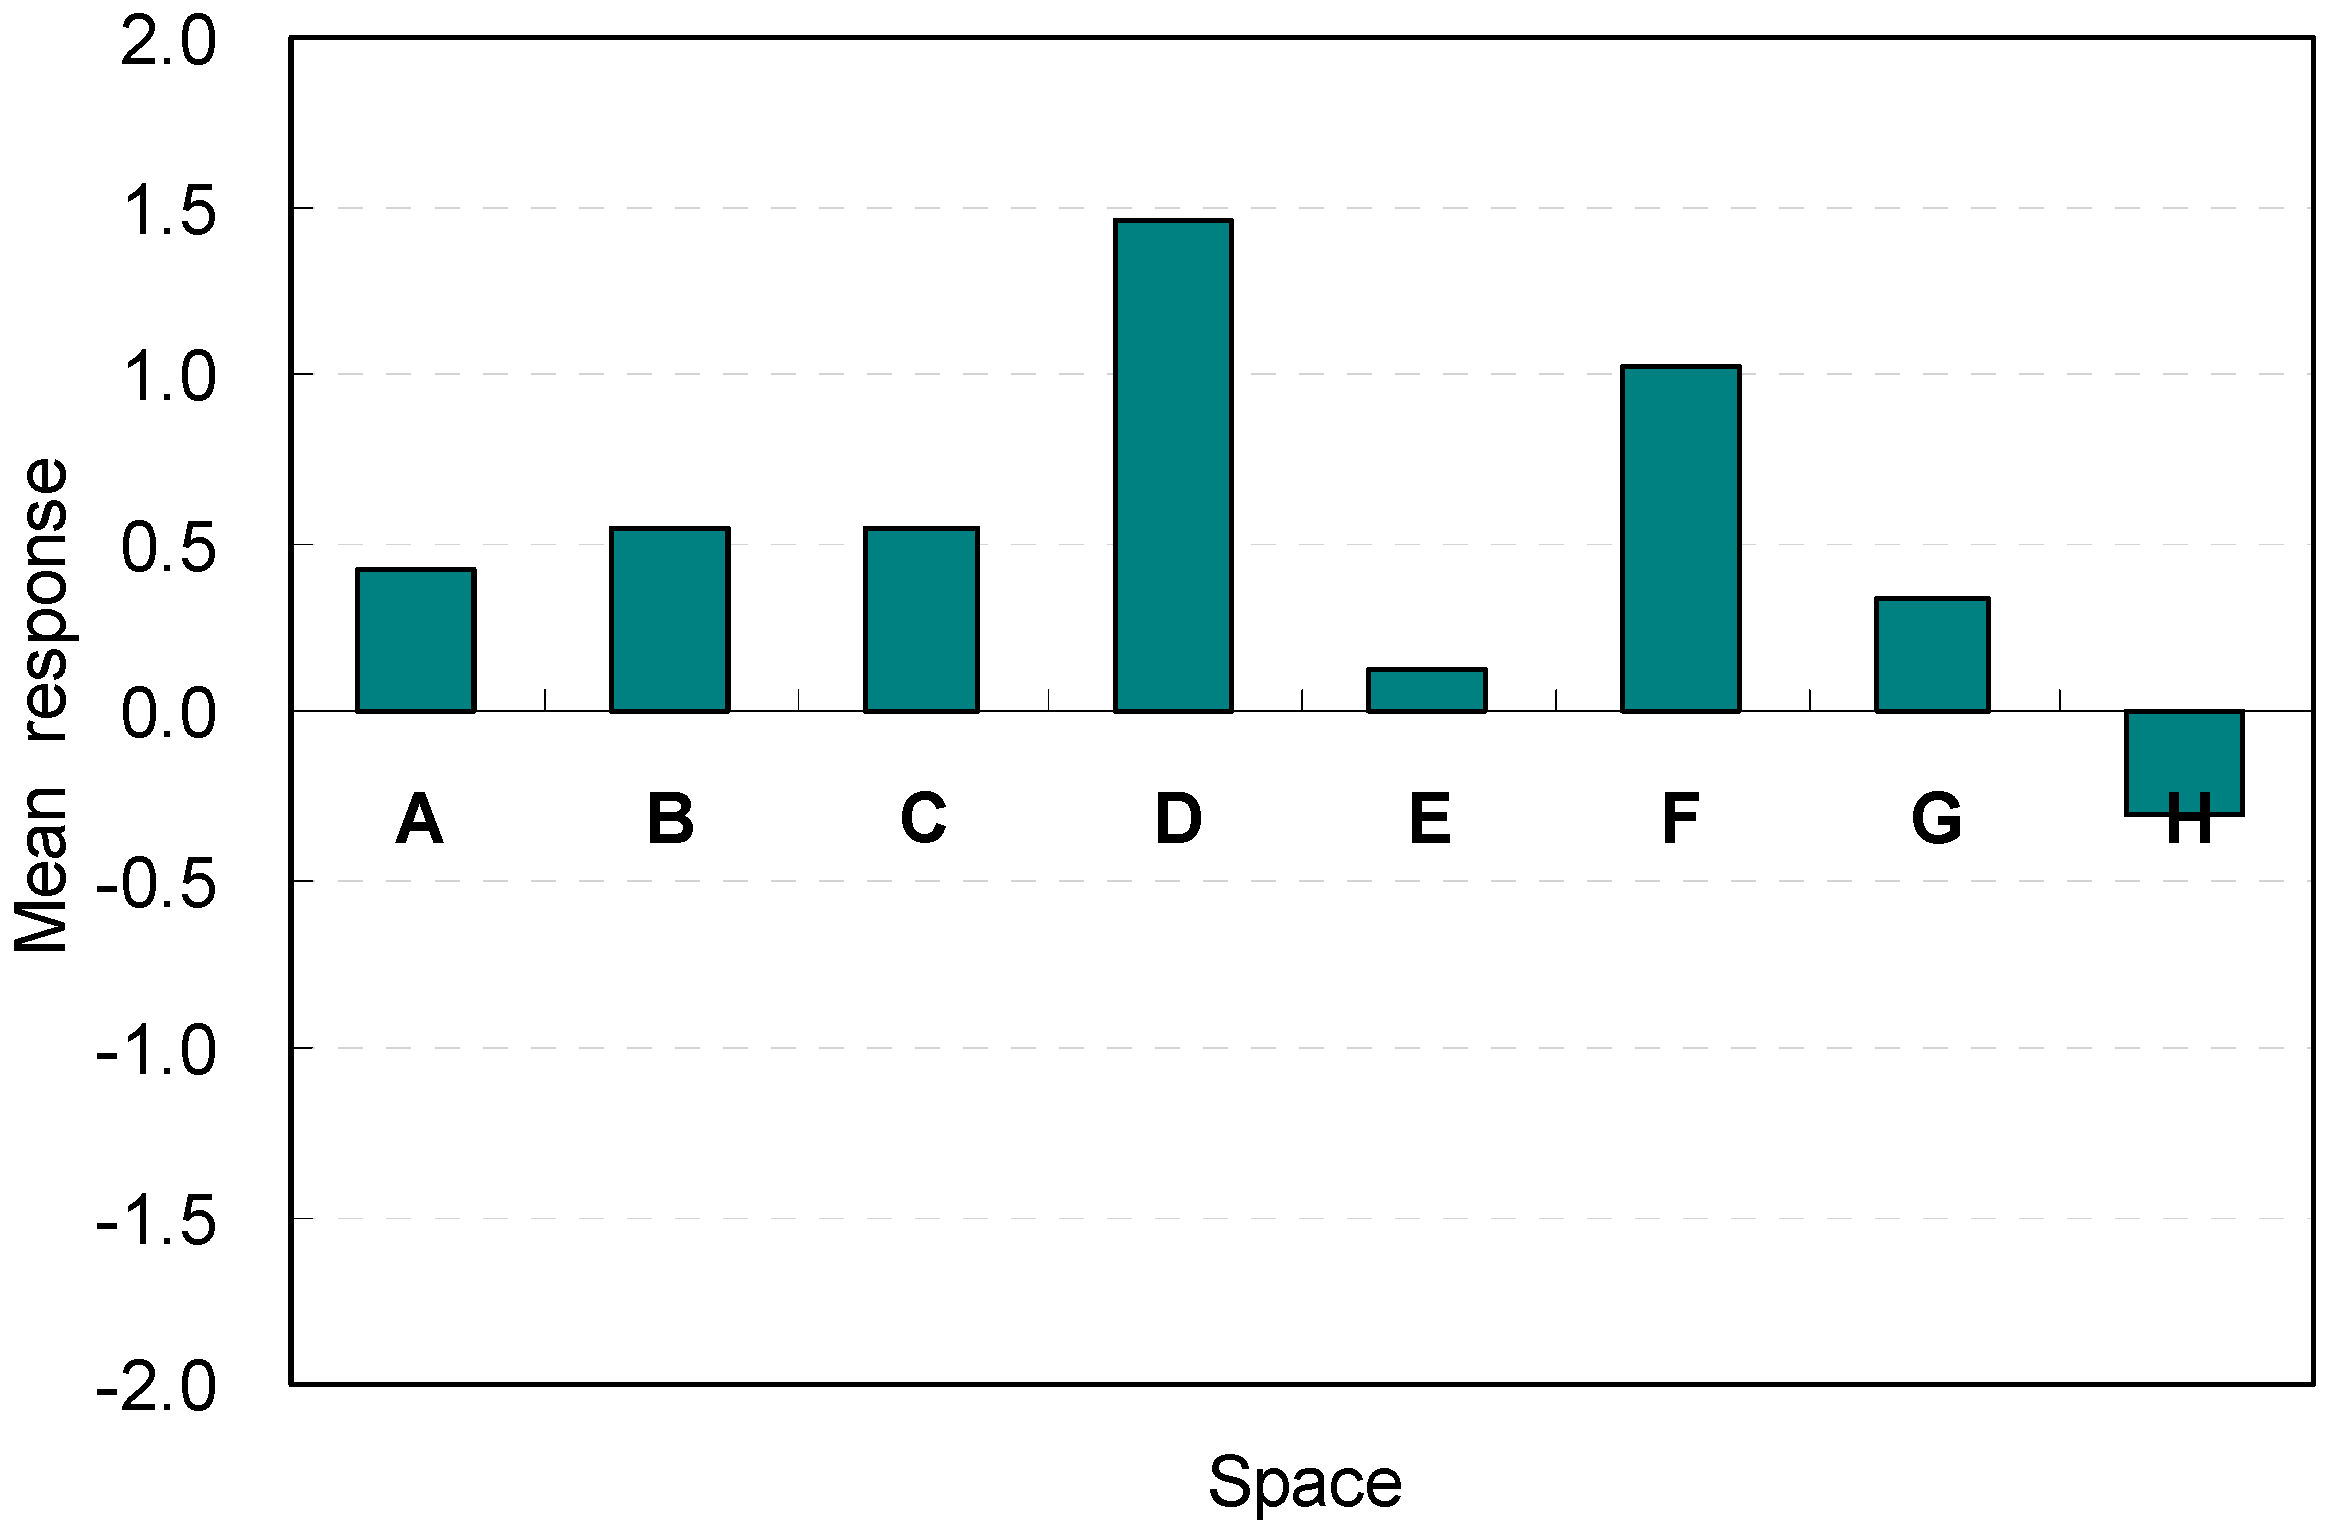
| space | E1 | sense of efficiency | For Spaces A, B, C, and D, Space D with a ceiling height of 2.6 m was the most favorable condition in terms of efficiency. Abrupt increases of satisfaction levels occurred in only Space D. For Spaces E, F, G, and H, The rectangular shape that had the widest width (Space F) was the best spatial condition to serve guests. |
| spatial size | E2 | room width | Space F, which had the widest width, was the most effective in terms of efficiency for hosting guests in the space. |
| E3 | room depth | All spaces did not have a significant difference; An increase in the width, as in Space F, was an effective contributor | |
| E4 | room height | When the ceiling height was 2.8 m (Space D), the perception of efficiency improved | |
| E5 | room area | Width became a strong element for Spaces E, F, G, and H; 2.6 m ceiling height (Space D) was the most effective, but 2.8 m (Space B) caused the worst perception. | |
| spatial shape | E6 | ratio of width to depth | For Spaces E, F, G, and H, the rectangular shape (Space F) provided positive perceptions; 2.6 m height in Space D was the most acceptable condition for serving guests. |
| E7 | room shape | Increase of the width and a decrease of the depth from a square shape would be effective design parameters for serving guests | |
| E8 | ratio of height to area | Space B, 2.8 m, was evaluated as the appropriate space for enhanced perceptions; the same height is not perceived as a meaningful factor to increase the efficiency. | |
| E9 | front window size | Perceptions were influenced more by changes in the front window conditions than the side window conditions | |
| E10 | right window size | Window dimensions were not critical and did not generate distinguishable differences | |
| spatial elements configuration | E11 | sofa location | Sofa location in this study was agreeable; square shape (Space E) generated a mean response close to the neutral point. |
| E12 | the vacant space size | Space F was the most agreeable condition; the area near the entrance must remain open for better spatial perception | |
| E13 | vacant space location | Space F, separated from the sofa area and was close to the entrance area, increased the perception | |
| E14 | balcony door location | A broad width of the pathway to the balcony was an agreeable condition. | |
| E15 | corridor width to balcony | Space F, which had a wide width and shallow depth, provided a more agreeable condition to serve guests. |
| Space | Variable | Unstandardized Coefficient | T | Sig. | ANOVA | |
|---|---|---|---|---|---|---|
| B | Stander Error | |||||
| A, B, C, D | (Constant) | 0.211 | 0.207 | 1.02 | 0.31 | F(2,129) = 11.10; Sig. = 0.00; r2 = 0.145 |
| E4 | 0.414 | 0.164 | 2.53 | 0.01 | ||
| E5 | 0.493 | 0.172 | 2.87 | 0.00 | ||
| E, F, G, H | (Constant) | 0.093 | 0.095 | 0.98 | 0.33 | F(5,126) = 55.02; Sig. = 0.00; r2 = 0.686 |
| E2 | 0.229 | 0.064 | 3.57 | 0.00 | ||
| E3 | 0.197 | 0.064 | 3.09 | 0.00 | ||
| E6 | 0.310 | 0.081 | 3.82 | 0.00 | ||
| E7 | 0.163 | 0.077 | 2.10 | 0.04 | ||
| E13 | 0.125 | 0.063 | 1.99 | 0.05 | ||
5. Discussion
- Hypothesis group 1 stated that the spatial size factors such as width, depth, and height of space affected the perception of amenity and efficiency. The previous studies have not clearly described the causal relationship between spatial size factors and space [35,81,82,83,84]. However, the findings of this study demonstrated that high heights and wide widths of room significantly affect the satisfaction of amenity. This result successfully supports the pleasure-arousal hypothesis: occupants were most attracted to settings that are moderately arousing and maximally pleasurable for the high height and wide width of the room [52]. In this study, occupants would feel pleasantness in agreeable spatial conditions (the spatial factors of configuration, vacant space, and shape) resulting from agreement with their openness experiences in actual space.
- Hypothesis group 2 stated that the spatial shape factors such as the width-to-depth ratio, the height-to-area ratio, and the room shape affected the perception of amenity and efficiency. The previous studies have not clearly described the causal relationship between spatial shape factors and space [35,81,82,83,84]. However, the findings of this study demonstrated that a short length and wide width of corridor affected the satisfaction of space in terms of efficiency. This result indicates that the occupants did not feel stress in agreeable spatial conditions (easiness of movement) when serving guests. This result aligns with social learning theory [87]: occupants observed, processed, and imitated the behaviors, attitudes, and emotional reactions for serving guests. In this study, occupants perceived a short length of corridor as operant conditioning, because they learned that this condition is desirable [52].
- Hypothesis group 3 stated that the overall satisfaction of amenity and efficiency were perceived differently under the same space. The findings of this study demonstrated that the efficiency satisfaction was influenced by the width-to-depth ratio, the room shape, and vacant space location. In contrast, amenity satisfaction was influenced by the ceiling height. Efficiency was affected by the host movement, and amenity was affected by the pleasure feeling due to openness. The results indicate that amenity and efficiency in the occupants’ perceptions were distinguished in association with the expected situation in order to achieve each occupancy need.
- Occupants’ perceptions of amenity and efficiency were the highest for the height change, with the highest height. Otherwise, satisfaction perception was the highest for space when the spatial factors were relatively harmonious. The findings demonstrate that two types perception were observed to compose a complementary two-dimensional path, and low level perceptions (affordance) were directly evaluated instantly, while the satisfaction (a high level perception) was evaluated during the recall the experience.In human-environment interaction studies, affordances are regarded as a lower level perception and satisfaction is a high level perception [78,79,80]. In the cognitive psychological mechanism in human-environment-interaction theories, perception, which is the first phase in the overall thought process, involves the interpretation of sensation. Cognition, which is the second phase, is the way that information and knowledge comes to be known, through the actions of perception, reasoning, or intuition [52].In this study, the results imply that the possibility of an intentional system could be performed to demonstrate the causal relationship: the correlation can be captured using low-level perception (e.g., perceived affordance) as well as the high-level perception (e.g., attitude, satisfaction); and the correlation between the spatial elements and space can be interpreted reflecting the occupants’ previous time-sequence experiences.
- Efficiency satisfaction increases abruptly in the evaluation sequence. These response patterns describe that the attention is directly applied to the evaluation of efficiency satisfaction, in which occupants ignored the spatial elements that did not to meet their efficiency needs and in contrast adopted the spatial elements that applied to their efficiency needs. The findings of this study imply that perception was integrated in association with primed intention with classification between amenity and efficiency. Priming on the occupants’ perceptions would reinforce the evaluation of SDA in comparing their own previous experiences in real spaces with the separation between amenity and efficiency.In the cognitive psychological mechanism in human-environment-interaction theories, the low-level and high-level perception mechanisms functioned simultaneously because selective attention was provided in the perception mechanism [52]. The perceptions are processed elaborations and amplified when the future occupants were aware of the feelings themselves. In previous studies, this difficulty was addressed in order to capture these perceptions because they are instantly integrated in related brain functions (particularly in the hippocampus) [48,70,71].In this study, the results potentially imply that the occupants’ evaluative perception processing elaborations were more activated in the assessment of SDA of amenity and efficiency under the operation conditions such as the primed categorical concepts of amenity and efficiency satisfaction increasing accessibility to long-term memory in association with control of top-down inference strategies and free association increases the activation of evaluative low-level perception in virtual spaces in association with the control of bottom-up perception processing.
- A series of priming supports to clearly describe the present correlation between spatial factors and space, through comparing occupants’ own experiences of real spaces. The previous study did not effectively activate the occupants’ perceptions in comparing the alternatives [4,55,62,73,74,75,76,77]. Therefore, the integrated human-environmental perception that describes the current design and previous occupants’ experiences was difficult to capture in the previous conventional POE and VR simulation methods [25,26,32,33,34,35,36]. In human-environment-interaction theories, occupants memorized their spatial experience using a time-sequentially causal relationship [80]. Furthermore, the perception of spatial experience is memorized in the long-term memory at the subconscious and conscious level, and it is interpreted with occupants’ own values: individual, social, etc.However, the results of this study illustrated the distinct result that support for simultaneous integration would be appropriate at low-level and high-level perceptions. The method priming in this study amplified the occupants’ awareness of their feelings and activated the occupants’ perceptions at the level of conscious as well as subconscious in order to evaluate SDA. In this study, the stimuli were compared with the future occupants’ previous experiences and integrated on the occupants’ perceptions. The stimuli were the spatial factors and space built in the VRE.
- An interpretation of the separating measures that support the description of the relationship as cause and effect: time-sequential causality. The previous study did not describe the correlation due to reasoning as a manner of separating the measures of occupants’ perceptions. Therefore, the determination cause and effect relationship between the spatial factors and space was difficult to discuss empirically because the occupants could not perceive the analytical structure in the moment [19,42,43,44,45].However, the results of this study demonstrated that the distinct relationship was interpreted as a cause and effect relationship: time-sequential causality in human-environmental perception. The method of separating measures would increase the integration of occupants’ perceptions under the activation of occupants’ selective attention; the evaluations were conducted separately: one as immediate assessments of the spatial factors perceptions and the other as satisfaction assessments of the space in recall. In this study, the questions provided the opportunity to statistically analyze the responses using the spatial factors as independent values and satisfaction as the dependent value.
- The occupant participatory method in this study improves the decision-making process in evaluating SDA regarding the behaviors in the space. The previous conceptual frameworks lacked a convincing focus on the actors in the housing system, particularly the inhabitants of dwellings, when describing and understanding this set of relationships [18]. The process does not have a coherent series of procedures in the decision-making [74], such as recognition, formulation, designing and screening, choice, deliberating about commitment, action, and feedback. However, the results of this study demonstrated that the decision-making process to select the best space could be improved in order to describe clear SDA as a complementary perception of a two-dimensional path [64,65,66]. This method contributes to solving the difficulty of evaluating SDA regarding the behaviors while considering the potential barriers and opportunities as a participatory process (i.e., designing and screening, choice, and deliberating about commitment), and it contributes to expanding the expectancy-value model and the theory of planned behavior.
6. Conclusions
- The spatial size factors demonstrated that wider widths of the space, a rectangular floor shape, and higher ceiling heights were agreeable conditions for amenity. The spatial size factors demonstrated that wider widths of the space were agreeable conditions for hosting guests in terms of efficiency.
- The spatial shape factors demonstrated that wider widths and shallower depths in the ratio between the width and depth in a rectangular shaped space, and the ratio of increasing height to area were agreeable conditions for amenity. The spatial shape factors demonstrated that wider widths and shallower depths in the ratio between the width and depth in a rectangular shaped space and the ratio of increasing height to area were agreeable conditions for efficiency.
- The spatial elements configuration demonstrated that the location of the available space without blockages and wider corridors to the balcony access were agreeable conditions for amenity. The spatial elements demonstrated that the location of the available space without blockages and wider corridors to the balcony access were agreeable conditions for serving guests.
- The overall satisfaction for amenity was determined using the most harmonious design of height rather than the highest height. Furthermore, the rectangular floor shape with the widest width was the best condition for amenity. The width, depth, and height were significantly correlated with the spatial satisfaction in terms of amenity. The window size, width of passage to the balcony, space shape, and size of available space were marginally associated with the spatial satisfaction of amenity.
- The ratio between the width and depth, and the width may significantly influence the overall satisfaction of efficiency. The window size, width of passage to the balcony, space shape, and size of available space were marginally associated with the spatial satisfaction of efficiency. The rectangular shape that had the widest width was the best spatial condition to serve guests in terms of efficiency. The flexibility of the room shape, depth, space shape, and position of available space should be determined carefully.
Author Contributions
Conflicts of Interest
References
- Gibson, E.; Gebken, R. Design quality in pre-project planning: Applications of the Project Definition Rating Index. Build. Res. Inf. 2003, 31, 346–356. [Google Scholar] [CrossRef]
- Nguyen, T.H.; Shehab, T.; Gao, Z. Evaluating Sustainability of Architectural Designs Using Building Information Modeling. Open Constr. Build. Technol. J. 2010, 4, 1–8. [Google Scholar] [CrossRef]
- Pati, D.; Park, C.-S.; Augenbroe, G. Roles of quantified expressions of building performance assessment in facility procurement and management. Build. Environ. 2009, 44, 773–784. [Google Scholar] [CrossRef]
- Cole, R.J. Building environmental assessment methods: Redefining intentions and roles. Build. Res. Inf. 2005, 33, 455–467. [Google Scholar] [CrossRef]
- Al-Kodmany, K. Visualization tools and methods for participatory planning and design. J. Urban Technol. 2001, 8, 1–37. [Google Scholar] [CrossRef]
- Shin, D.-H.; Shin, Y.-J. Consumers’ Trust in Virtual Mall Shopping: The Role of Social Presence and Perceived Security. Int. J. Hum. Comput. Interact. 2011, 27, 450–475. [Google Scholar] [CrossRef]
- Harun, S.N.; Hamid, M.Y.; Talib, A.; Rahim, Z.A. “Usability Evaluation”: Criteria for Quality Architecture In-Use. Procedia Eng. 2011, 20, 135–146. [Google Scholar] [CrossRef]
- Zeiler, W.; Savanovic, P. Integral Morphological C-K Design Approach for Multidisciplinary Building Design. Archit. Eng. Des. Manag. 2009, 5, 193–214. [Google Scholar] [CrossRef]
- Lai, A.C.K.; Mui, K.W.; Wong, L.T.; Law, L.Y. An evaluation model for indoor environmental quality (IEQ) acceptance in residential buildings. Energy Build. 2009, 41, 930–936. [Google Scholar] [CrossRef]
- Lai, J.H.K.; Yik, F.W.H. Perception of importance and performance of the indoor environmental quality of high-rise residential buildings. Build. Environ. 2009, 44, 352–360. [Google Scholar] [CrossRef]
- Kamaruzzaman, S.N.; Egbu, C.O.; Zawawi, E.M.A.; Ali, A.S.; Che-Ani, A.I. The effect of indoor environmental quality on occupants’ perception of performance: A case study of refurbished historic buildings in Malaysia. Energy Build. 2011, 43, 407–413. [Google Scholar] [CrossRef]
- Kim, S.-M.; Lee, J.-H.; Moon, H.J.; Kim, S. Improvement of Indoor Living Environment by Occupants’ Preferences for Heat Recovery Ventilators in High-Rise Residential Buildings. Indoor Built Environ. 2012, 21, 486–502. [Google Scholar] [CrossRef]
- Monfared, I.G.; Sharples, S. Occupants’ perceptions and expectations of a green office building: A longitudinal case study. Archit. Sci. Rev. 2011, 54, 344–355. [Google Scholar] [CrossRef]
- Bonaiuto, M.; Fornara, F.; Bonnes, M. Indexes of perceived residential environment quality and neighbourhood attachment in urban environments: A confirmation study on the city of Rome. Landsc. Urban Plan. 2003, 65, 41–52. [Google Scholar] [CrossRef]
- Whyte, J.; Gann, D.; Whyte, J.K.; Gann, D.M. Design Quality Indicators: Work in progress. Build. Res. Inf. 2003, 31, 387–398. [Google Scholar] [CrossRef]
- Frontczak, M.; Schiavon, S.; Goins, J.; Arens, E.; Zhang, H.; Wargocki, P. Quantitative relationships between occupant satisfaction and satisfaction aspects of indoor environmental quality and building design. Indoor Air 2012, 22, 119–131. [Google Scholar] [CrossRef] [PubMed]
- Peretti, C. Indoor Environmental Quality Surveys: A Brief Literature Review. Available online: http://escholarship.org/uc/item/0wb1v0ss# (accessed on 1 January 2011).
- Coolen, H.C.C.H. The relevance of the concepts of affordance and behavior setting for housing research. In Proceedings of the ENHR 2014 Beyond Globalisation. Remaking House Policy a Complex World, Edinburgh, UK, 1–4 July 2014.
- Stevenson, F.; Leaman, A. Evaluating housing performance in relation to human behaviour: New challenges. Build. Res. Inf. 2010, 38, 437–441. [Google Scholar] [CrossRef]
- Taylor, P. Post-Occupancy Indoor Environmental Post-Occupancy Indoor Environmental Quality Evaluation of Student Housing Facilities. Archit. Eng. Des. Manag. 2006, 3, 249–256. [Google Scholar]
- Cho, S.; Lee, T.; Kim, J. Residents’ satisfaction of indoor environmental quality in their old apartment homes IBE 2010. Indoor Built Environ. 2011, 20, 16–25. [Google Scholar]
- Korea Consumer Agency. Analysis of Damage Cases in Apartment; Korea Consumer Agency: Seoul, Korea, 2005. [Google Scholar]
- Hisako, K. Evaluation of Amenity (translation in korean). In Evaluation of Residential Environment. Evaluation of Living Environment; ASAMI, Y., Ed.; University of Tokyo Press: Tokyo, Japan; Seoul, Korea, 2003. [Google Scholar]
- Humiko, I. Evaluation of Efficiency. In Evaluation of Residential Environment. Evaluation of Living Environment; ASAMI, Y., Ed.; University of Tokyo Press: Tokyo, Japan; Seoul, Korea, 2003; pp. 89–122. [Google Scholar]
- Zimmerman, A.; Martin, M. Post-occupancy evaluation: Benefits and barriers. Build. Res. Inf. 2001, 29, 168–174. [Google Scholar] [CrossRef]
- Agha-Hossein, M.M.; El-Jouzi, S.; Elmualim, A.A.; Ellis, J.; Williams, M. Post-occupancy studies of an office environment: Energy performance and occupants’ satisfaction. Build. Environ. 2013, 69, 121–130. [Google Scholar] [CrossRef]
- GhaffarianHoseini, A.; Dahlan, N.D.; Berardi, U.; GhaffarianHoseini, A.; Makaremi, N.; GhaffarianHoseini, M. Sustainable energy performances of green buildings: A review of current theories, implementations and challenges. Renew. Sustain. Energy Rev. 2013, 25, 1–17. [Google Scholar] [CrossRef]
- Zuo, J.; Zhao, Z.-Y. Green building research–current status and future agenda: A review. Renew. Sustain. Energy Rev. 2014, 30, 271–281. [Google Scholar] [CrossRef]
- Kim, M.J.; Oh, M.W.; Kim, J.T. A method for evaluating the performance of green buildings with a focus on user experience. Energy Build. 2013, 66, 203–210. [Google Scholar] [CrossRef]
- Chau, C.K.; Tse, M.S.; Chung, K.Y. A choice experiment to estimate the effect of green experience on preferences and willingness-to-pay for green building attributes. Build. Environ. 2010, 45, 2553–2561. [Google Scholar] [CrossRef]
- Paul, W.L.; Taylor, P.A. A comparison of occupant comfort and satisfaction between a green building and a conventional building. Build. Environ. 2008, 43, 1858–1870. [Google Scholar] [CrossRef]
- Kassem, M.; Iqbal, N.; Kelly, G.; Lockley, S.; Dawood, N. Building Information Modelling: Collaborative Design Process Protocols. J. Inf. Technol. Constr. 2014, 19, 126–149. [Google Scholar]
- Shen, W.; Shen, Q.; Sun, Q. Building Information Modeling-based user activity simulation and evaluation method for improving designer–user communications. Autom. Constr. 2012, 21, 148–160. [Google Scholar] [CrossRef]
- Kumar, S.; Hedrick, M.; Wiacek, C.; Messner, J.I. Developing an experienced-based design review application for healthcare facilities using a 3D game engine. J. Inf. Technol. Constr. 2011, 16, 85–104. [Google Scholar]
- Frontczak, M.; Wargocki, P. Literature survey on how different factors influence human comfort in indoor environments. Build. Environ. 2011, 46, 922–937. [Google Scholar] [CrossRef]
- Markus, T.A. Lessons from the Design Quality Indicator. Build. Res.Inf. 2003, 31, 399–405. [Google Scholar] [CrossRef]
- Luo, Z.; Luo, W.; Chen, I.-M.I.; Jiao, R.J.; Duh, H.B. Spatial Representation of a Virtual Room Space: Perspective and Vertical Movement. Int. J. Hum. Comput. Interact. 2010, 26, 661–674. [Google Scholar] [CrossRef]
- Hartmann, T.; Fischer, M. Supporting the constructability review with 3D/4D models. Build. Res. Inf. 2007, 35, 70–80. [Google Scholar] [CrossRef]
- Franz, G.; von der Heyde, M.; Bülthoff, H.H. An empirical approach to the experience of architectural space in virtual reality—Exploring relations between features and affective appraisals of rectangular indoor spaces. Autom. Constr. 2005, 14, 165–172. [Google Scholar] [CrossRef]
- Arayici, Y.; Coates, P.; Koskela, L.; Kagioglou, M.; Usher, C.; O’Reilly, K. Technology adoption in the BIM implementation for lean architectural practice. Autom. Constr. 2011, 20, 189–195. [Google Scholar] [CrossRef]
- Pauwels, P.; de Meyer, R.; van Campenhout, J. Visualisation of semantic architectural information within a game engine environment. In Proceedings of the 10th International Conference on C onstruction Applications of Virtual Reality, Miyagi, Japan, 4–5 November 2010; pp. 219–228.
- Bordass, B.; Leaman, A. Making feedback and post-occupancy evaluation routine 3: Case studies of the use of techniques in the feedback portfolio. Build. Res. Inf. 2005, 33, 361–375. [Google Scholar] [CrossRef]
- Kwon, S.-H.; Chun, C.; Kwak, R.-Y. Relationship between quality of building maintenance management services for indoor environmental quality and occupant satisfaction. Build. Environ. 2011, 46, 2179–2185. [Google Scholar] [CrossRef]
- Lee, Y.S.; Guerin, D.A. Indoor Environmental Quality Related to Occupant Satisfaction and Performance in LEED-certified Buildings. Indoor Built Environ. 2009, 18, 293–300. [Google Scholar] [CrossRef]
- Humphreys, M.A. Quantifying occupant comfort: Are combined indices of the indoor environment practicable? Build. Res. Inf. 2005, 33, 317–325. [Google Scholar] [CrossRef]
- Kelly, J.W.; McNamara, T.P. Reference frames during the acquisition and development of spatial memories. Cognition 2010, 116, 409–420. [Google Scholar] [CrossRef] [PubMed]
- Conway, M.A. Episodic memories. Neuropsychologia 2009, 47, 2305–2313. [Google Scholar] [CrossRef] [PubMed]
- Moscovitch, M.; Nadel, L.; Winocur, G.; Gilboa, A.; Rosenbaum, R.S. The cognitive neuroscience of remote episodic, semantic and spatial memory. Curr. Opin. Neurobiol. 2006, 16, 179–190. [Google Scholar] [CrossRef] [PubMed]
- Burgess, N.; Maguire, E.A.; O’Keefe, J. The Human Hippocampus and Spatial and Episodic Memory. Neuron 2002, 35, 625–641. [Google Scholar] [CrossRef]
- Ozok, A.A.; Komlodi, A. Better in 3D? An Empirical Investigation of User Satisfaction and Preferences Concerning Two-Dimensional and Three-Dimensional Product Representations in Business-to-Consumer E-Commerce. Int. J. Hum. Comput. Interact. 2009, 25, 243–281. [Google Scholar] [CrossRef]
- Nash, E.B.; Edwards, G.W.; Thompson, J.A.; Barfield, W. A Review of Presence and Performance in Virtual Environments. Int. J. Hum. Comput. Interact. 2000, 12, 1–41. [Google Scholar] [CrossRef]
- Kopec, D. Environmental Psychology for Design, 2nd ed.; Fairchild Books: New York, NY, USA, 2012. [Google Scholar]
- Yasushi, A. Evaluation of Residential Environment; Spacetime Publisher: Tokyo, Japan; Seoul, Korea, 2003. [Google Scholar]
- Dewulf, G.; van Meel, J. Sense and nonsense of measuring design quality. Build. Res. Inf. 2004, 32, 247–250. [Google Scholar] [CrossRef]
- Eley, J. Design quality in buildings. Build. Res. Inf. 2004, 32, 255–260. [Google Scholar] [CrossRef]
- Land and housing institute. A Research on Residential Conditions 2012. Available online: www.korea.kr/common/download.do?tblKey=EDN&fileId=208315 (accessed on 12 January 2016).
- Kang, N.N.; Lee, T.K.; Kim, J.T. Characteristics of the Quality of Korean High-Rise Apartments Using the Health Performance Indicator. Indoor Built Environ. 2012, 22, 157–167. [Google Scholar] [CrossRef]
- Malkoc, E.; Ozkan, M.B. Post-occupancy Evaluation of a Built Environment: The Case of Konak Square (Izmir, Turkey). Indoor Built Environ. 2010, 19, 422–434. [Google Scholar] [CrossRef]
- Cole-Colander, C. Designing the Customer Experience. Build. Res. Inf. 2003, 31, 357–366. [Google Scholar] [CrossRef]
- Yildirim, K.; Capanoglu, A.; Cagatay, K. The Effects of Physical Environmental Factors on Students’ Perceptions in Computer Classrooms. Indoor Built Environ. 2011, 20, 501–510. [Google Scholar] [CrossRef]
- Andrews, C.J.; Senick, J.A.; Wener, R.E. Incorporating Occupant Perceptions and Behaviro into BIM. In Enhancing Builing Performance; Mallory-Hill, S., Preiser, W.F.E., Watson, C., Eds.; Wiley-Blackwell: Oxford, UK, 2012; pp. 234–245. [Google Scholar]
- Conniff, A.; Craig, T.; Laing, R.; Galán-Díaz, C. A comparison of active navigation and passive observation of desktop models of future built environments. Des. Stud. 2010, 31, 419–438. [Google Scholar] [CrossRef]
- Ernst, M.O.; Lange, C.; Newell, F.N. Multisensory recognition of actively explored objects. Can. J. Exp. Psychol. 2007, 61, 242–253. [Google Scholar] [CrossRef] [PubMed]
- Bechara, A.; Damasio, H.; Damasio, A.R.; Lee, G.P. Different contributions of the human amygdala and ventromedial prefrontal cortex to decision-making. J. Neurosci. 1999, 19, 5473–5481. [Google Scholar] [PubMed]
- Bechara, A. Emotion, Decision Making and the Orbitofrontal Cortex. Cereb. Cortex 2000, 10, 295–307. [Google Scholar] [CrossRef] [PubMed]
- Rahman, S.; Sahakian, B.J.; Cardinal, R.N.; Rogers, R.D.; Robbins, T.W. Decision making and neuropsychiatry. Trends Cogn. Sci. 2001, 5, 271–277. [Google Scholar] [CrossRef]
- Bogacz, R. Optimal decision-making theories: Linking neurobiology with behaviour. Trends Cogn. Sci. 2007, 11, 118–125. [Google Scholar] [CrossRef] [PubMed]
- Smith, P.L.; Ratcliff, R. Psychology and neurobiology of simple decisions. Trends Neurosci. 2004, 27, 161–168. [Google Scholar] [CrossRef] [PubMed]
- Körding, K.P.; Beierholm, U.; Ma, W.J.; Quartz, S.; Tenenbaum, J.B.; Shams, L. Causal inference in multisensory perception. PLoS ONE 2007, 2, e943. [Google Scholar] [CrossRef] [PubMed]
- Pals, R.; Steg, L.; Dontje, J.; Siero, F.W.; van der Zee, K.I. Physical features, coherence and positive outcomes of person-environment interactions: A virtual reality study. J. Environ. Psychol. 2014, 40, 108–116. [Google Scholar] [CrossRef]
- Hartson, R. Cognitive, physical, sensory, and functional affordances in interaction design. Behav. Inf. Technol. 2003, 22, 315–338. [Google Scholar] [CrossRef]
- Dennett, D.C. Intentional systems in cognitive ethology: The “Panglossian paradigm” defended. Behav. Brain Sci. 1983, 6, 343–355. [Google Scholar] [CrossRef]
- Lee, Y.-J. Subjective quality of life measurement in Taipei. Build. Environ. 2008, 43, 1205–1215. [Google Scholar] [CrossRef]
- Jansen, S.J.T.; Coolen, H.C.C.H.; Goetgeluk, R.W. The Measurement and Analysis of Housing Preference and Choice; Springer Netherlands: Dordrecht, The Netherlands, 2011. [Google Scholar]
- Prasad, S. Clarifying intentions: The design quality indicator. Build. Res. Inf. 2004, 32, 548–551. [Google Scholar] [CrossRef]
- Shen, W. Management and Innovation for a Sustainable Built Environment. Amsterdam, The Netherlands, 20–23 June 2011.
- Koleva, B.; Anastasi, R.O.B.; Greenhalgh, C.; Rodden, T.O.M.; Green, J.; Ghali, A.; Pridmore, T.; Gaver, B.; Boucher, A.; Walker, B.; et al. Expected, Sensed, and Desired: A Framework for Designing Sensing-Based Interaction. ACM Trans. Comput. Interatcion 2005, 12, 3–30. [Google Scholar]
- Lee, K.-I.; Yeom, D.-W. Comparative study for satisfaction level of green apartment residents. Build. Environ. 2011, 46, 1765–1773. [Google Scholar]
- Ilesanmi, A.O. Post-occupancy evaluation and residents’ satisfaction with public housing in Lagos, Nigeria. J. Build. Apprais. 2010, 6, 153–169. [Google Scholar] [CrossRef]
- Abbaszadeh, S.; Zagreus, L.; Lehrer, D.; Huizenga, C. Occupant Satisfaction with Indoor Environmental Quality in Green Buildings. Proc. Healthy Build. 2006, 3, 365–370. [Google Scholar]
- Frontczak, M.; Andersen, R.V.; Wargocki, P. Questionnaire survey on factors influencing comfort with indoor environmental quality in Danish housing. Build. Environ. 2012, 50, 56–64. [Google Scholar] [CrossRef]
- Kim, J.; de Dear, R. Nonlinear relationships between individual IEQ factors and overall workspace satisfaction. Build. Environ. 2012, 49, 33–40. [Google Scholar] [CrossRef]
- Minami, K. A Post-Occupancy Evaluation of Layout Changes Made to KEP Adaptable Housing. J. Asian Archit. Build. Eng. 2007, 6, 245–250. [Google Scholar] [CrossRef]
- Fang, Y. Residential Satisfaction, Moving Intention and Moving Behaviours: A Study of Redeveloped Neighbourhoods in Inner-City Beijing. Hous. Stud. 2006, 21, 671–694. [Google Scholar] [CrossRef]
- Gzsoy, A.; Problems, E. Spatial Adaptability and Flexibility as Parameters of User Satisfaction for Quality Housing. Build. Environ. 1998, 33, 315–323. [Google Scholar]
- Bassanino, M.; Fernando, T.; Wu, K.-C. Can virtual workspaces enhance team communication and collaboration in design review meetings? Archit. Eng. Des. Manag. 2013, 10, 200–217. [Google Scholar] [CrossRef]
- Gosling, S.D.; Ko, S.J.; Mannarelli, T.; Morris, M.E. A room with a cue: Personality judgments based on offices and bedrooms. J. Personal. Soc. Psychol. 2003, 82, 379–398. [Google Scholar] [CrossRef]
© 2016 by the authors; licensee MDPI, Basel, Switzerland. This article is an open access article distributed under the terms and conditions of the Creative Commons by Attribution (CC-BY) license (http://creativecommons.org/licenses/by/4.0/).
Share and Cite
Lee, S.; Wohn, K. Occupants’ Perceptions of Amenity and Efficiency for Verification of Spatial Design Adequacy. Int. J. Environ. Res. Public Health 2016, 13, 128. https://doi.org/10.3390/ijerph13010128
Lee S, Wohn K. Occupants’ Perceptions of Amenity and Efficiency for Verification of Spatial Design Adequacy. International Journal of Environmental Research and Public Health. 2016; 13(1):128. https://doi.org/10.3390/ijerph13010128
Chicago/Turabian StyleLee, Sangwon, and Kwangyun Wohn. 2016. "Occupants’ Perceptions of Amenity and Efficiency for Verification of Spatial Design Adequacy" International Journal of Environmental Research and Public Health 13, no. 1: 128. https://doi.org/10.3390/ijerph13010128
APA StyleLee, S., & Wohn, K. (2016). Occupants’ Perceptions of Amenity and Efficiency for Verification of Spatial Design Adequacy. International Journal of Environmental Research and Public Health, 13(1), 128. https://doi.org/10.3390/ijerph13010128