Article

The Effect of Urban Heat Island on Climate Warming in the Yangtze River Delta Urban Agglomeration in China

1
College of Geography Sciences, Nanjing Normal University, Wenyuan Road, Xianlin University District, Nanjing, 210023, China
2
Jiangsu Center for Collaborative Innovation in Geographical Information Resource Development and Application, Nanjing 210046, China
*
Authors to whom correspondence should be addressed.
Int. J. Environ. Res. Public Health 2015, 12(8), 8773-8789; https://doi.org/10.3390/ijerph120808773
Submission received: 25 June 2015 / Revised: 17 July 2015 / Accepted: 20 July 2015 / Published: 27 July 2015

Abstract

:
The Yangtze River Delta (YRD) has experienced rapid urbanization and dramatic economic development since 1978 and the Yangtze River Delta urban agglomeration (YRDUA) has been one of the three largest urban agglomerations in China. We present evidence of a significant urban heat island (UHI) effect on climate warming based on an analysis of the impacts of the urbanization rate, urban population, and land use changes on the warming rate of the daily average, minimal (nighttime) and maximal (daytime) air temperature in the YRDUA using 41 meteorological stations observation data. The effect of the UHI on climate warming shows a large spatial variability. The average warming rates of average air temperature of huge cities, megalopolises, large cities, medium-sized cities, and small cities are 0.483, 0.314 ± 0.030, 0.282 ± 0.042, 0.225 ± 0.044 and 0.179 ± 0.046 °C/decade during the period of 1957–2013, respectively. The average warming rates of huge cities and megalopolises are significantly higher than those of medium-sized cities and small cities, indicating that the UHI has a significant effect on climate warming (t-test, p < 0.05). Significantly positive correlations are found between the urbanization rate, population, built-up area and warming rate of average air temperature (p < 0.001). The average warming rate of average air temperature attributable to urbanization is 0.124 ± 0.074 °C/decade in the YRDUA. Urbanization has a measurable effect on the observed climate warming in the YRD aggravating the global climate warming.

1. Introduction

Since the beginning of the industrial revolution, industrial and agricultural activities, such as fossil fuel burning and land use change, have significantly increased the concentrations of greenhouse gases (GHG), such as carbon dioxide (CO2), methane (CH4), ozone (O3), nitrous oxide (N2O), and chlorofluorocarbons [1]. For example, since the beginning of the industrial era, the release of CO2 from human activities has resulted in atmospheric CO2 concentrations approximately increasing from 280 ppm to about 392 ppm in 2012 [1]. The 2013 IPCC report shows that global surface warming based on land and marine data was approximately 0.85 °C from 1880 to 2012 due to greenhouse effect. Additionally, the period of 1983–2012 was very likely the warmest 30-year period of the last 800 years and likely the warmest 30-year period of the last 1400 years [1]. Such an increase in air temperature results in rising sea levels, extreme weather events, complex and profound changes in terrestrial and aquatic ecosystems, altered modes of production, and altered lifestyles, thus forcing humans to adapt [2,3,4].
Because climate warming will affect human health in many ways through affecting surrounding environment and natural and social ecosystems, it is vital to describe the formation mechanism of climatic variations on regional to local scales. Cities have a warmer climate than rural areas due to the urban heat island (UHI), which represents one of the most significant human-induced changes to earth’s surface climate. The UHI effect has received considerable attention in climate warming research and in urban settlements [5,6,7,8,9]. Oke [10] ever reported that, even in a 1000 people town, an UHI effect could be observed, and the intensity of UHI is linearly correlated with the logarithms of the population, which is confirmed by other studies [11]. Because cities contain more than half of the world’s population [2], and because an estimated 70% of the global population is projected to live in cities by 2050 [12], city warming and heat waves due to the UHI effect have a profound impact on the lives, well-being and human health of urban residents [4,13,14].
On the global scale, urban area only occupies less than 0.5% of the Earth’s total land area based on the remote sensing estimation using 500 m spatial resolution Moderate Resolution Imaging Spectroradiometer (MODIS) [15]. Therefore, the influence of UHI on climatic change is thought to be very small. The IPCC [1] noted that it was unlikely that any uncorrected UHI effects and land use change effects would raise the estimated centennial globally averaged land surface air temperature trends by more than 10%. However, the IPCC [1] also admitted that 10% was an average value; in some regions with rapid development, the UHI and land use change impacts on regional trends might be substantially larger [16]. Schneider et al. [15] also pointed out that although only a small percentage of global land cover, urban areas could significantly alter climate at local, regional, and even global scales.
In China, there are also many studies on the warming effects of the UHI on the entire country or specific regions [5,17,18]. However, the results are inconsistent or even contradictory. Le et al. [17] reported that the average UHI effect for China from 1951 to 2001 was less than 0.01 °C/decade, suggesting that we cannot conclude that urbanization during the last 50 years has had an obvious effect on the observed warming in China. In contrast, Zhou et al. [5] suggested that climate warming of 0.05 °C/decade is attributable to urbanization in China, indicating a significant urbanization effect on climate warming. The warming rate due to urbanization reached 0.398 °C/decade, as detected by subtracting reanalysis data from observations, and 0.285 °C/decade, as determined by subtracting rural area values from urban area values, in East China from 1981 to 2007 [19]. The difference of warming rate in different studies in China was attributed to the different periods, different area and stations, and different variables (mean, maximum, and minimum air temperature). In addition, most studies only reported the warming trend and the UHI contribution to the warming rate. The driving factors and the potential mechanism of the UHI, for example, land use change from non-construction land to construction land, urbanization rate and population, in relation to climate warming are seldom interpreted [20,21]. Since the implementation of the policy of reform and opening up in late 1978, the Yangtze River Delta has experienced rapid urbanization and the Yangtze River Delta urban agglomeration (YRDUA) has been one of the three largest national urban agglomerations in China [22]. The effect of the UHI might be substantially larger in this region; thus, it cannot be neglected [23,24]. Therefore, more studies are needed to assess the contribution of the UHI effect to the warming rate and to discuss the causes of the UHI.
The aims of this study are to (1) present the climate warming rate for the YRDUA; (2) compare the warming rates for different urban sizes; and (3) qualitatively assess the factors that affect the warming rate and differentiate the UHI contributions to the warming rate using 41 meteorological stations observation data in the Yangtze River Delta (YRD) region.

2. Experimental Section
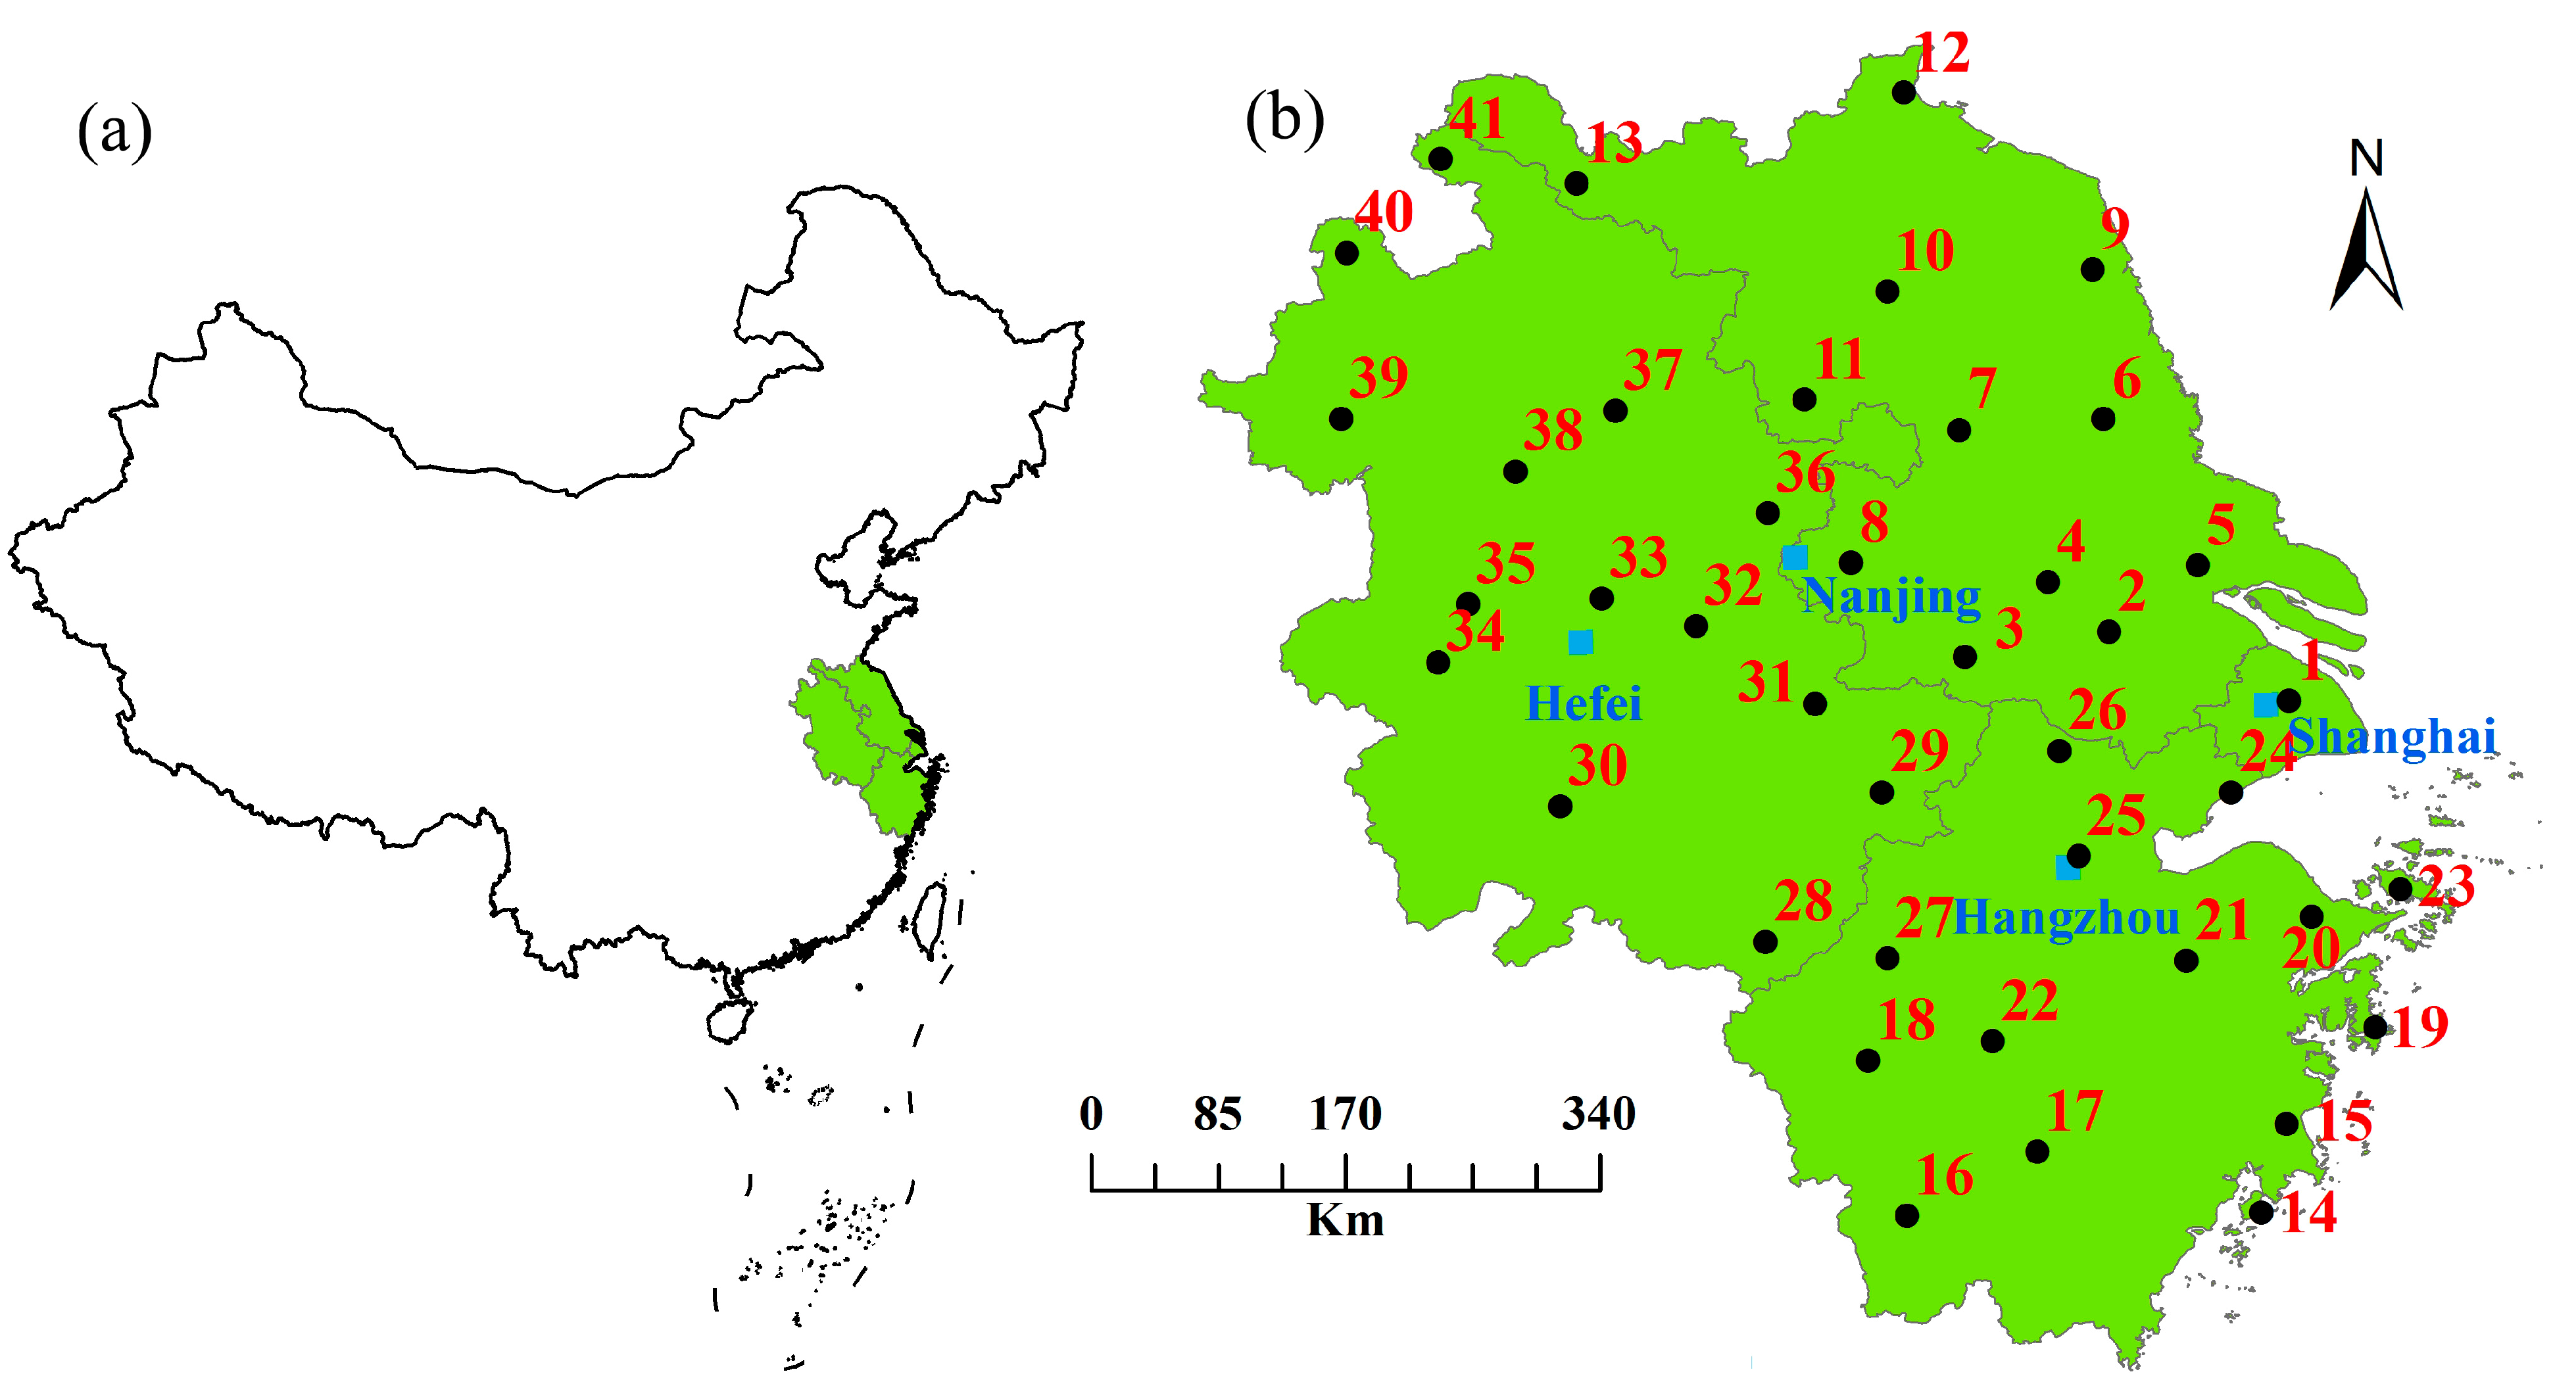
2.1. Study Area

YRD is located along the central-eastern coastline of China, comprising Shanghai, southern Jiangsu Province and northern Zhejiang Province. This region is one of China’s most developed, dynamic, densely populated and concentrated industrial areas. The YRDUA has grown into one of six influential world-class metropolitan areas, and it plays an important role in China’s economic and social development [22,24]. Generally, the boundary of the YRD varies according to the culture, economy, or geography considered in the different studies. The Yangtze River Delta Regional Plan issued by the State Council of China in May 2010 showed that the YRDUA covered a total of 30 cities including Shanghai, 13 cities in Jiangsu, 11 cities in Zhejiang and 5 cities in Anhui Provinces and excluded 11 cities in Anhui Province (Haozhou, Huaibei, Suzhou, Fuyang, Bengpu, Lu’an, Anqing, Chizhou, Tongli, Xuancheng and Huangshan). However, to discuss the background warming rate and differentiate the UHI contribution, this study referred to the YRDUA as comprising all regions of Shanghai, Jiangsu, Zhejiang and Anhui Provinces (Figure 1).
Figure 1. Locations of the YRDUA (a) and the 41 meteorological stations (b). 1: Longhua; 2: Wuxi; 3: Liyang; 4: Changzhou; 5: Nantong; 6: Dongtai; 7: Gaoyou; 8: Nanjing; 9: Sheyang; 10: Huai’an; 11: Xuyi; 12: Ganyu; 13: Xuzhou; 14: Yuhuan; 15: Hongjia; 16: Longquan; 17: Lishui; 18: Quzhou; 19: Shipu; 20: Yinxian; 21: Shengxian; 22: Jinhua; 23: Dinghai; 24: Pinghu; 25: Hangzhou; 26: Huzhou; 27: Chun’an; 28: Tunxi; 29: Ningguo; 30: Anqing; 31: Wuhu; 32: Chaohu; 33: Hefei; 34: Huoshan; 35: Lu’an; 36: Chuxian; 37: Bengbu; 38: Shouxian; 39: Fuyang; 40: Bozhou; and 41: Dangshan.
Ijerph 12 08773 g001

2.2. Data Set

The time series of the daily average, minimal (nighttime) and maximal (daytime) air temperature observed at 41 meteorological stations covering long-term consistent observation are used to analyze the variability of the warming rate in the YRDUA. The data are obtained from the China Meteorological Data Sharing Service System issued by the National Meteorological Information Center of China Meteorological Administration. The data have widely been used to study the climate change in China [25,26]. The stations are selected by considering the locations, lengths and completeness of the records so that the entire YRDUA can be uniformly covered. The locations of the YRDUA and selected stations are presented in Figure 1. All the time series data represent 1957 to 2013, with no missing years. The basic information, including latitude, longitude, altitude, city type and urban size, are presented in Table 1. All stations are located in the plain area with the highest elevation less than 200 m. Therefore, the effect of elevation on warming rate is negligible.
According to the classification standard of the report “Green book of small- and medium-sized cities: Annual report on development of small- and medium-sized cities in China”, we categorize the cities in the YRDUA into five levels according to population size: huge city (I: more than 10 million people), megalopolis (II: 3 million to 10 million people), large city (III: 1 million to 3 million people), medium city (IV: 5 hundred thousand to 1 million people), small city (V: less than 5 hundred thousand people).
Table 1. Information on 41 meteorological stations in the YRDUA.
NumberNameLatitudeLongitudeAltitude(m)ProvinceCityCity TypeUrban Size
1Longhua31°10′121°26′2.6ShanghaiShanghaiAI
2Wuxi31°35′120°21′5.2JiangsuWuxiBIII
3Liyang31°26′119°29′7.7JiangsuLiyangCIV
4Changzhou31°53′119°59′4.4JiangsuChangzhouBIII
5Nantong31°59′120°53′6.1JiangsuNantongBIII
6Dongtai32°52′120°19′4.3JiangsuDongtaiCIV
7Gaoyou32°48′119°27′5.4JiangsuGaoyouCIV
8Nanjing32°00′118°48′7.1JiangsuNanjingAII
9Sheyang33°46′120°15′2.0JiangsuSheyangCV
10Huai’an33°38′119°01′14.4JiangsuHuai’anBIII
11Xuyi32°59′118°31′40.8JiangsuXuyiCV
12Ganyu34°50′119°07′3.3JiangsuGanyuCV
13Xuzhou34°17′117°09′41.2JiangsuXuzhouBIII
14Yuhuan28°05′121°16′95.9ZhejiangYuhuanCV
15Hongjia28°37′121°25′4.6ZhejiangTaizhouBIII
16Longquan28°04′119°08′195.5ZhejiangLongquanCV
17Lishui28°27′119°55′59.7ZhejiangLishuiBV
18Quzhou29°00′118°54′82.4ZhejiangQuzhouBV
19Shipu29°12′121°57′128.4ZhejiangXiangshanCV
20Yinxian29°52′121°34′4.8ZhejiangNingboBIII
21Shengxian29°36′120°49′104.3ZhejiangShengzhouCIV
22Jinhua29°07′119°39′62.6ZhejiangJinhuaBIV
23Dinghai30°02′122°06′35.7ZhejiangZhoushanBIV
24Pinghu30°37′121°05′5.4ZhejiangPinghuCIV
25Hangzhou30°14′120°10′41.7ZhejiangHangzhouAII
26Huzhou30°52′120°03′7.4ZhejiangHuzhouBIII
27Chun’an29°37′119°01′171.4ZhejiangChun’anCV
28Tunxi29°43′118°17′142.7AnhuiHuangshanBV
29Ningguo30°37′118°59′89.4AnhuiNingguoCV
30Anqing30°32′117°03′19.8AnhuiAnqingBIV
31Wuhu31°09′118°35′21.1AnhuiWuhuxianBIV
32Chaohu31°37′117°52′22.4AnhuiChaohuCV
33Hefei31°47′117°18′27.0AnhuiHefeiAIII
34Huoshan31°24′116°19′86.4AnhuiHuoshanCV
35Lu’an31°45′116°30′60.5AnhuiLu’anBV
36Chuxian32°18′118°18′27.5AnhuiChuzhouBIV
37Bengbu32°55′117°23′21.9AnhuiBengbuBIV
38Shouxian32°33′116°47′22.7AnhuiShouxianCV
39Fuyang32°52′115°44′32.7AnhuiFuyangBIV
40Haozhou33°52′115°46′37.7AnhuiHaozhouBV
41Dangshan34°26′116°20′44.2AnhuiDangshanCV
A: provincial capital; B: prefecture-level city; C: county-level city. I: huge city; II: megalopolis; III: large city; IV: medium-sized city; V: small city.
The urbanization rates defined as a percentage of urban population to total population, populations and areas of the built-up districts were obtained from statistical yearbooks, including the Shanghai Statistical Yearbook 2013 [27], Jiangsu Statistical Yearbook 2013 [28], Zhejiang Statistical Yearbook 2013 [29], Anhui Statistical Yearbook 2013 [30], and the Chinese City Statistical Yearbook 2013 [31].

2.3. Data Analysis

Statistical analyses, including averaging, linear and non-linear fitting, and regression and correlation analyses, are performed to characterize the UHI and elucidate the affecting factors of UHI using the Statistical Program for Social Sciences (SPSS) 17.0 software (IBM Corp., Chicago, IL, USA). The warming rate was obtained through the linear fitting of the yearly average, minimal and maximal air temperature vs. year, which was widely used for the time series analysis of meteorological parameters [32,33,34]. The significance levels are reported as significant if p < 0.05. Because the number of cities of the five urban sizes differed substantially, differences in the parameters among the five urban sizes are assessed with independent sample t-tests (p < 0.05).

3. Results and Discussion

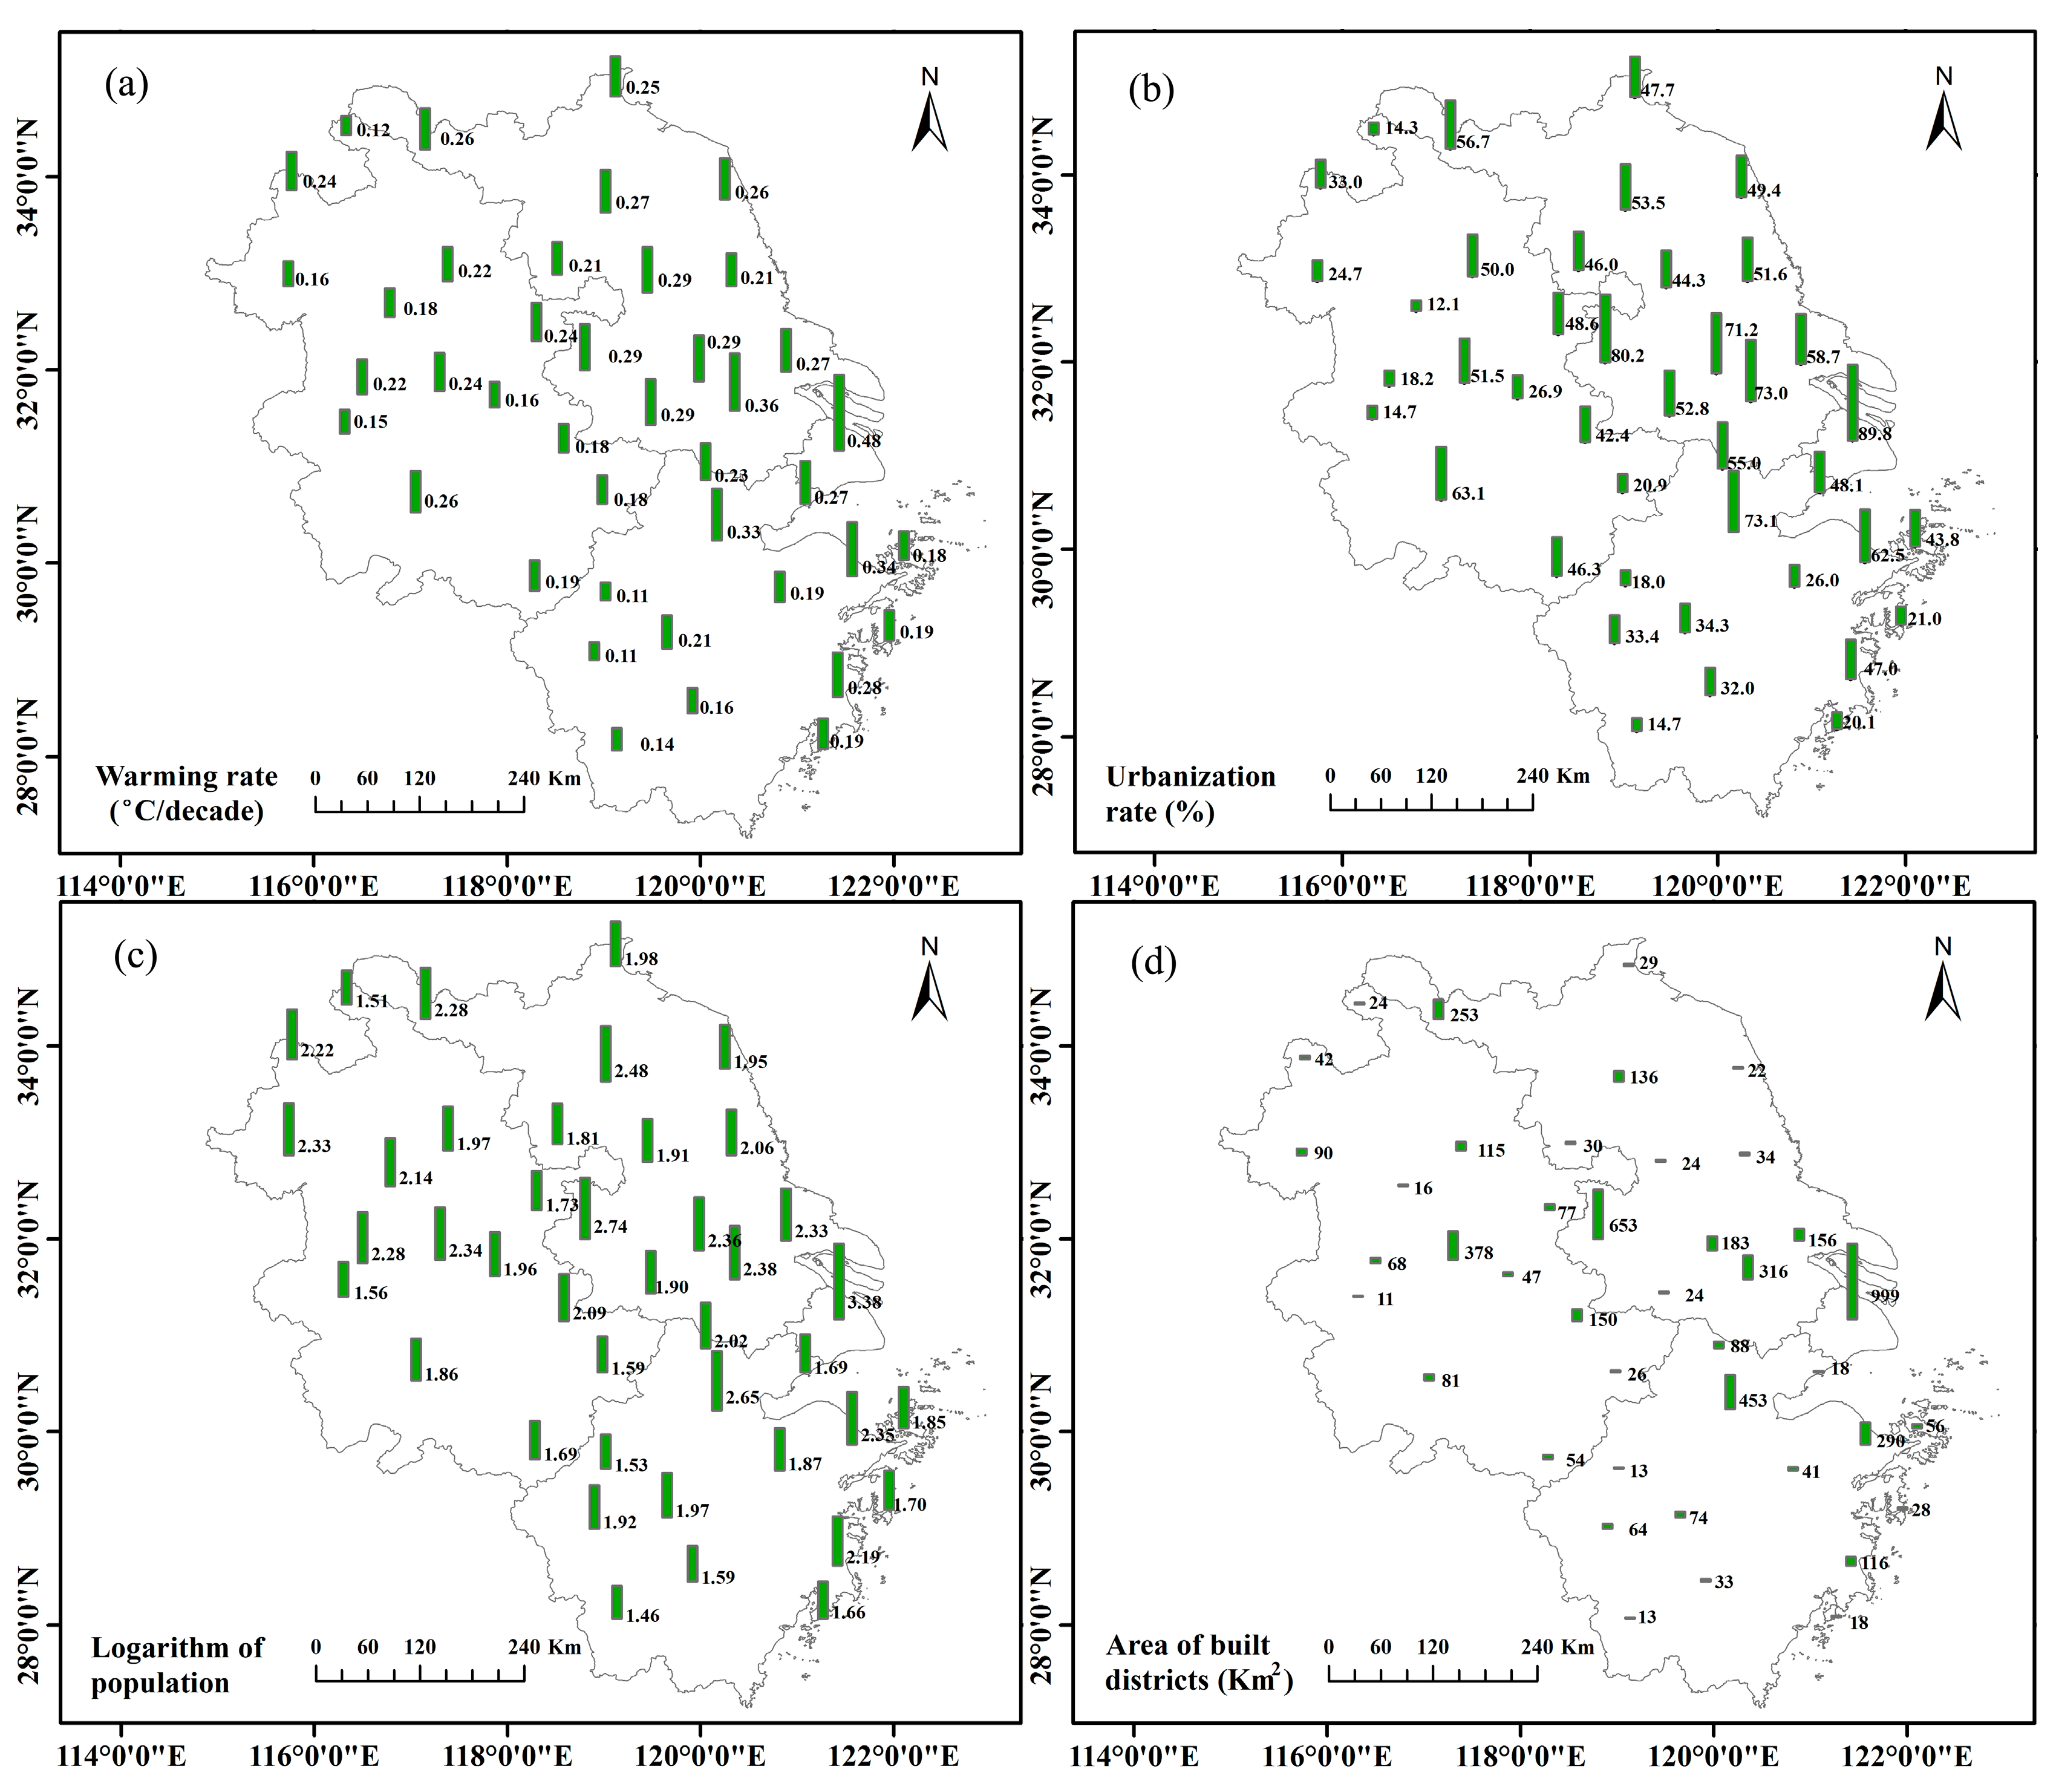
3.1. Spatial Distribution of the Warming Rate

The linear fitting of the yearly average, minimal and maximal air temperature vs. year showed that a significant climate warming rate was found for all 41 stations in the YRDUA (Table 2). The warming rate of average, minimal and maximal air temperature ranged from 0.108 °C/decade in Chun’an to 0.483 °C/decade in Shanghai, from 0.061 °C/decade in Quzhou to 0.521 °C/decade in Shanghai, and from 0.049 °C/decade in Chun’an to 0.433 °C/decade in Shanghai, respectively. The average warming rate of average, minimal and maximal air temperature was 0.229 ± 0.074, 0.270 ± 0.096 and 0.192 ± 0.088 °C/decade of these observation stations, respectively. Overall, the order of the warming rate was minimal > average > maximal air temperature. In addition, the linear fitting of average and minimal air temperature vs. year was significant for all 41 stations (p < 0.05) (Table 2). However, the linear fitting of maximal air temperature vs. year was not statistically significant for some stations (Table 2). Therefore, the warming trend of nighttime was more marked than that of daytime. Similarly, the magnitude of the mean nighttime UHI from the long-term measurements was found to be much stronger than the daytime UHI during all seasons in Athens (Greece) [35]. The main reason for the day-night asymmetry of urban warming is believed to be in the vertical stability of the atmospheric boundary layer. In the daytime, the strong vertical mixing results in diffusion of excessive heat in cities and reduces temperature anomaly. In the nighttime, the thermal anomaly in cities is confined to a shallow layer, where strong inversion develops in the rural area.
Table 2. Warming rate (°C/decade), determination coefficient (r2) and significance level (p) of the linear fit of the air temperature vs. year from 1957 to 2013 for all 41 stations.
Station NameAverage Air temperatureMinimal Air TemperatureMaximal Air Temperature
Warming Rater2pWarming Rater2pWarming Rater2p
Longhua0.4830.71<0.0010.5210.67<0.0010.4330.64<0.001
Wuxi0.3580.54<0.0010.4150.58<0.0010.3250.47<0.001
Liyang0.2890.47<0.0010.3340.48<0.0010.2350.32<0.001
Changzhou0.2920.52<0.0010.3410.59<0.0010.2390.35<0.001
Nantong0.2720.41<0.0010.2630.33<0.0010.2590.35<0.001
Dongtai0.2070.31<0.0010.2670.38<0.0010.1390.15<0.005
Gaoyou0.2910.46<0.0010.3700.55<0.0010.1870.23<0.001
Nanjing0.2930.50<0.0010.3320.50<0.0010.1650.17<0.005
Sheyang0.2560.41<0.0010.2820.38<0.0010.2200.29<0.001
Huai’an0.2670.46<0.0010.3020.48<0.0010.1430.14<0.005
Xuyi0.2060.35<0.0010.3290.56<0.0010.0630.03>0.05
Ganyu0.2500.37<0.0010.3920.49<0.0010.1340.14<0.005
Xuzhou0.2580.44<0.0010.3840.60<0.0010.0760.04>0.05
Yuhuan0.1860.35<0.0010.1620.27<0.0010.2110.39<0.001
Hongjia0.2810.47<0.0010.3180.44<0.0010.2910.46<0.001
Longquan0.1370.23<0.0010.1520.25<0.0010.0940.06>0.05
Lishui0.1620.27<0.0010.1990.38<0.0010.1760.20<0.001
Quzhou0.1100.18<0.0050.0610.09<0.050.1580.17<0.001
Shipu0.1910.35<0.0010.1620.27<0.0010.2510.40<0.001
Yinxian0.3370.56<0.0010.3670.53<0.0010.3770.51<0.001
Shengxian0.1850.33<0.0010.1500.24<0.0010.2210.29<0.001
Jinhua0.2140.34<0.0010.2920.51<0.0010.1700.16<0.005
Dinghai0.1830.35<0.0010.0910.11<0.050.2710.47<0.001
Pinghu0.2680.42<0.0010.2510.32<0.0010.2420.43<0.001
Hangzhou0.3350.60<0.0010.3390.62<0.0010.3080.44<0.001
Huzhou0.2330.42<0.0010.2210.35<0.0010.2360.32<0.001
Chun’an0.1080.13<0.010.2100.37<0.010.0490.02>0.05
Tunxi0.1930.38<0.0010.2280.48<0.0010.1510.13<0.01
Ningguo0.1770.32<0.0010.1950.35<0.0010.1630.16<0.005
Anqing0.2570.44<0.0010.3260.54<0.0010.1840.20<0.001
Wuhu0.1840.29<0.0010.2060.35<0.0010.2740.38<0.001
Chaohu0.1580.18<0.0050.1380.11<0.050.3080.43<0.001
Hefei0.2410.41<0.0010.2290.36<0.0010.2010.23<0.001
Huoshan0.1490.20<0.0050.2020.33<0.0010.1410.09<0.05
Lu’an0.2220.34<0.0010.3160.57<0.0010.1940.17<0.001
Chuzhou0.2430.35<0.0010.3460.49<0.0010.1790.18<0.001
Bengbu0.2170.34<0.0010.3530.60<0.0010.0840.04>0.05
Shouxian0.1770.32<0.0010.2500.49<0.0010.0880.05>0.05
Fuyang0.1580.25<0.0050.1980.31<0.0010.0710.03>0.05
Bozhou0.2370.33<0.0010.3940.54<0.0010.0780.03>0.05
Dangshan0.1190.13<0.010.1630.16<0.0050.0970.06>0.05
In this study, the warming rates of minimal and maximal air temperature were significantly correlated to that of average air temperature (Figure 2). In order to focus the aim of assessing the factors that affect the warming rate and differentiating the UHI contributions to the warming rate, we will pay our emphasis on the warming rate of average air temperature in the following results and discussion. A more detailed investigation for the interpretation of the difference of the warming rate of nighttime and daytime will be presented in the future study, which actually reflects the different mechanisms that determine nighttime and daytime UHI in the city.
Figure 2. Significant linear relationship between the warming rates of average, minimal (a) and maximal (b) air temperature in in the YRDUA.
Ijerph 12 08773 g002
This average warming rate of average air temperature was consistent with the results observed in other urban regions of China [34,36,37], some large US cities [38], and some Europe cities [35,39]. For example, the warming rates during 1961–2000 reached 0.32 °C/decade and 0.31 °C/decade at the Beijing station and Wuhan station, respectively [36]. Thirty-eight of 50 US cities experienced an average warming rate of 0.30 °C/decade between 1951 and 2000 [38]. However, our results were markedly lower than the warming rate from 0.502 to 0.904 °C/decade of rural and urban stations in East China for the period of 1981–2007 [19], for which the warming rate was more significant over the past 30 years due to the rapid urbanization during this period in East China [40].
In the YRDUA, the warming rate of average air temperature had significant spatial variability although this variability was not continuous because most stations were located in the urban region (Figure 3a). From Shanghai to Jiangsu and Zhejiang Provinces and further to Anhui Province, the warming rate decreased gradually as the distance from Shanghai increased. In addition, there were two small peaks around Nanjing and Hangzhou. The weak warming rates mainly occurred at small- or medium-sized city stations located in Anhui Province and in southern Zhejiang Province, where the economy is less developed and has more rural areas. Overall, the spatial pattern of the warming rate was highly consistent with those of the urbanization rate, the population, and the built-up areas (Figure 3b–d). We will further discuss the relationship between the warming rate and the urbanization rate, population, and built-up area in the section “Factors affecting the warming rate”.
Figure 3. Spatial distribution of the warming rate of average air temperature (a), urbanization rate (b), logarithm of the population (c), and built-up areas (d).
Ijerph 12 08773 g003

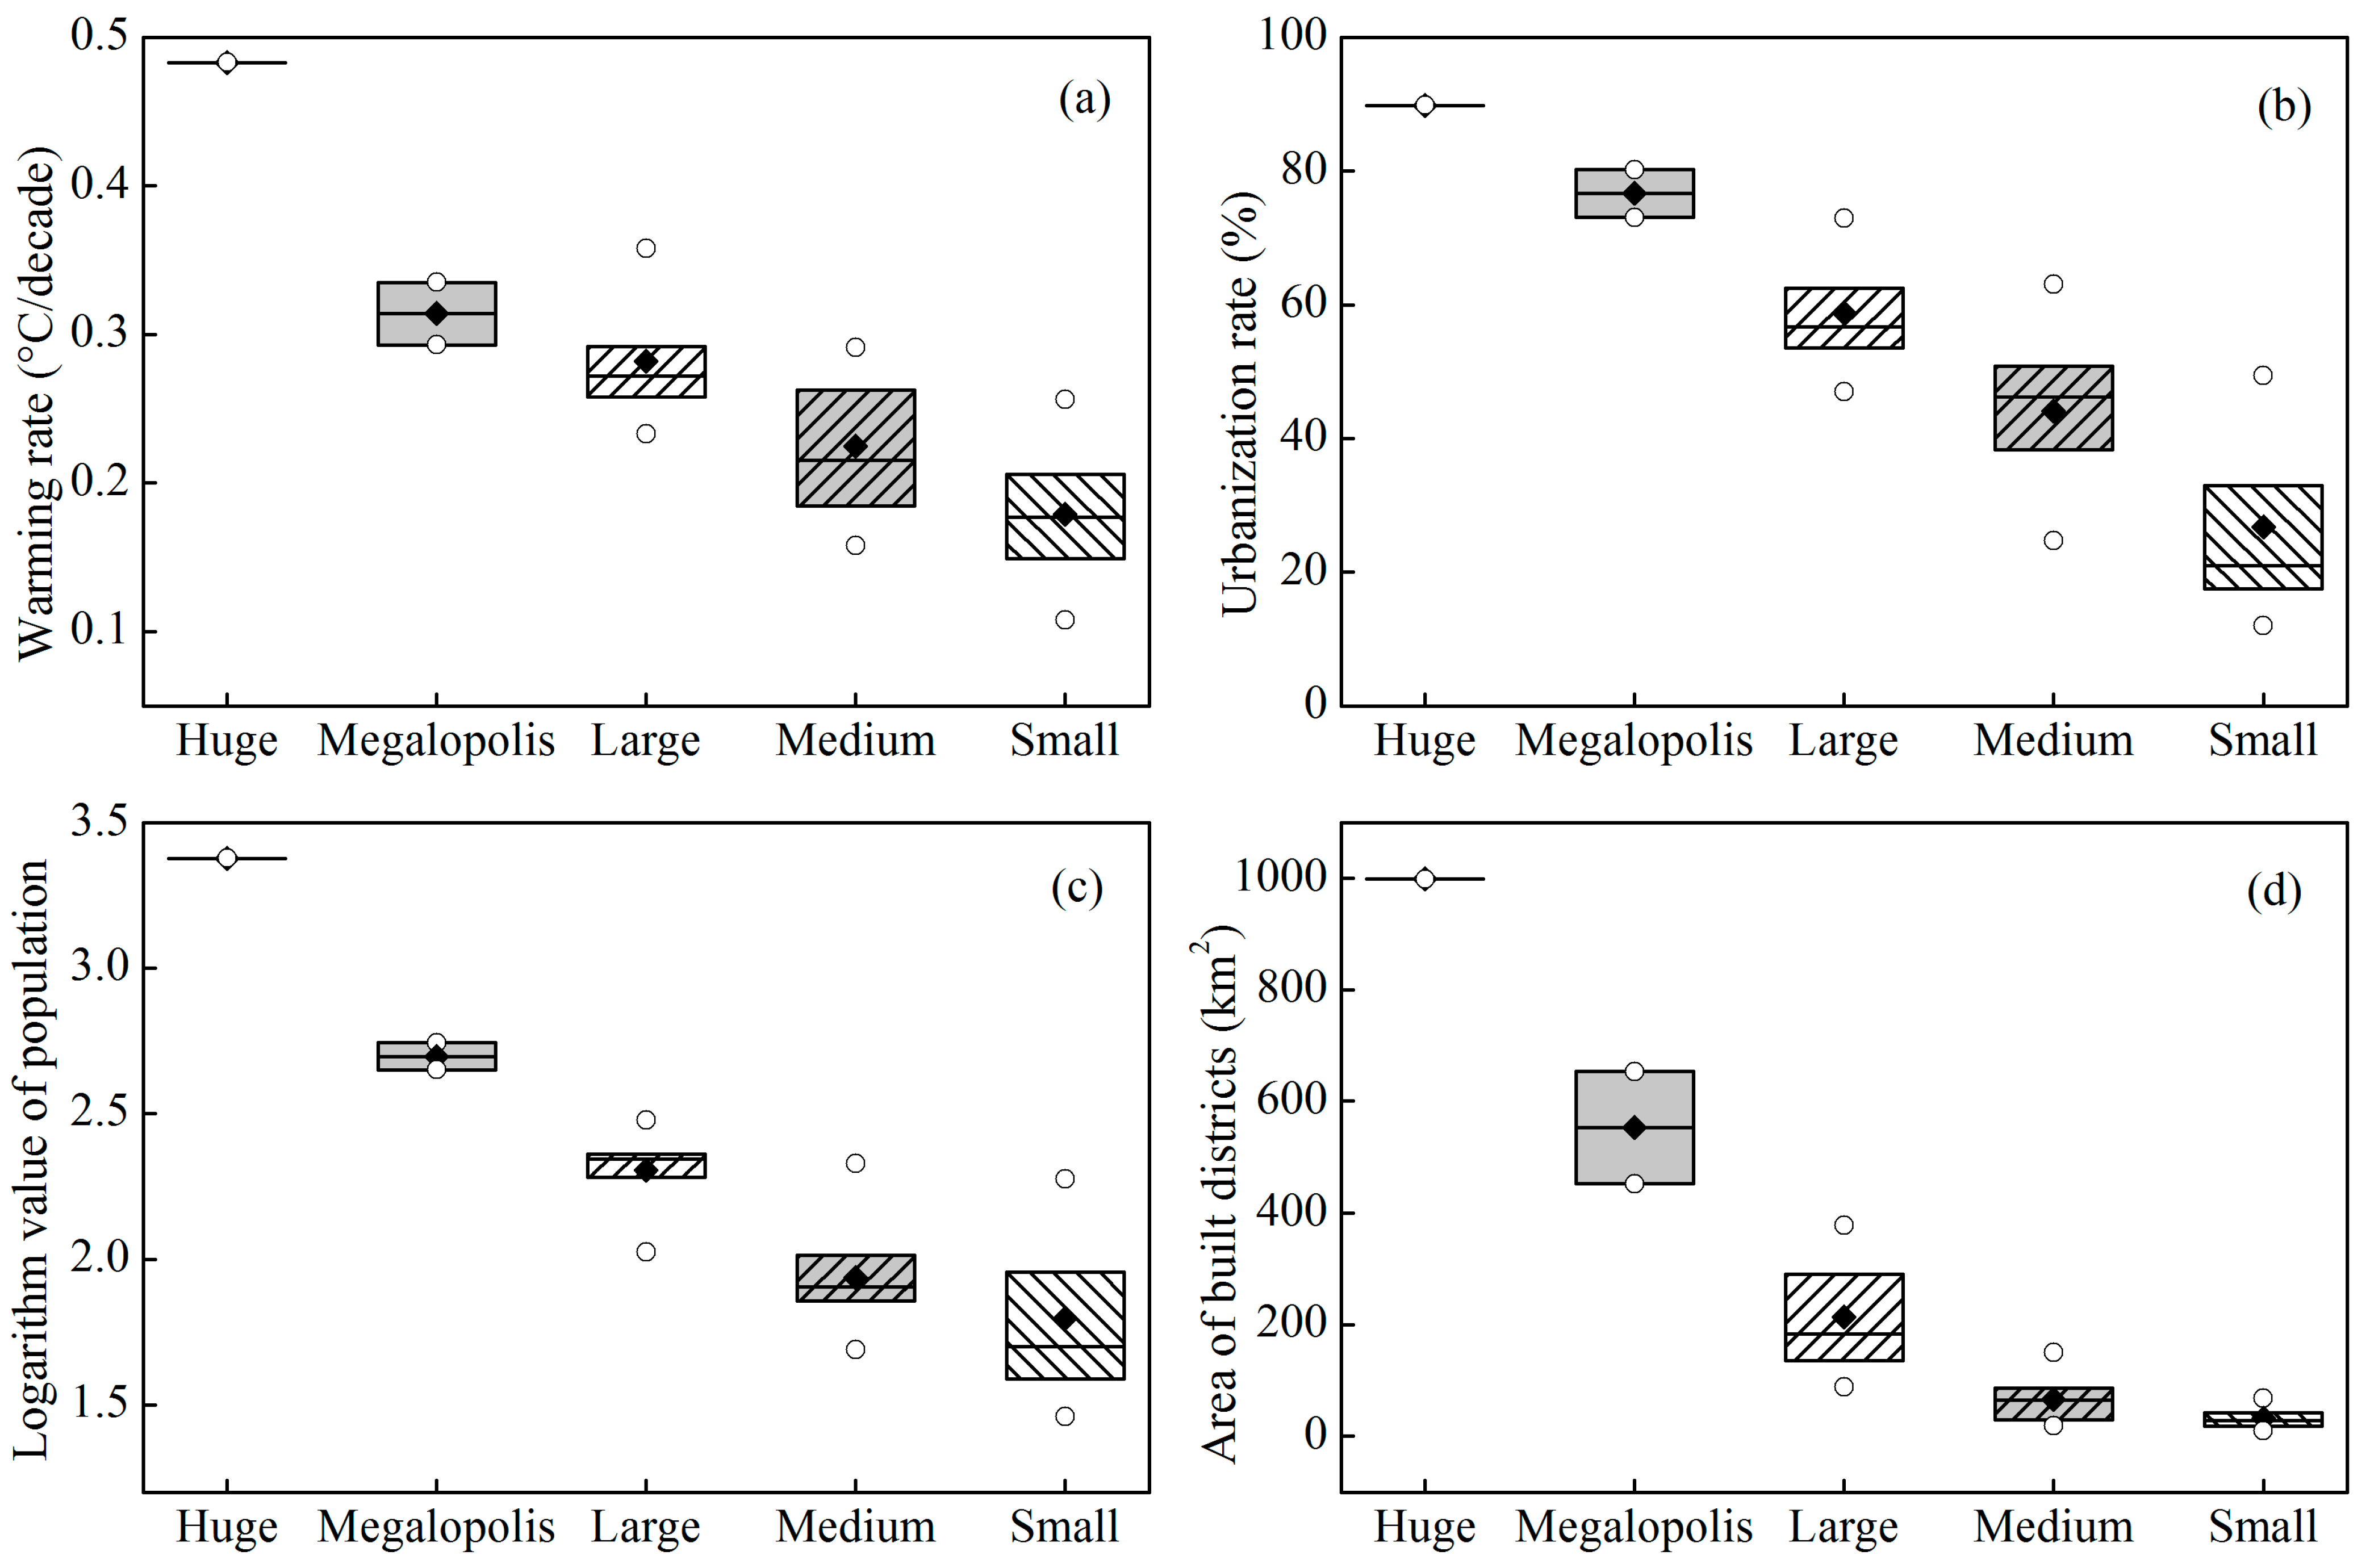
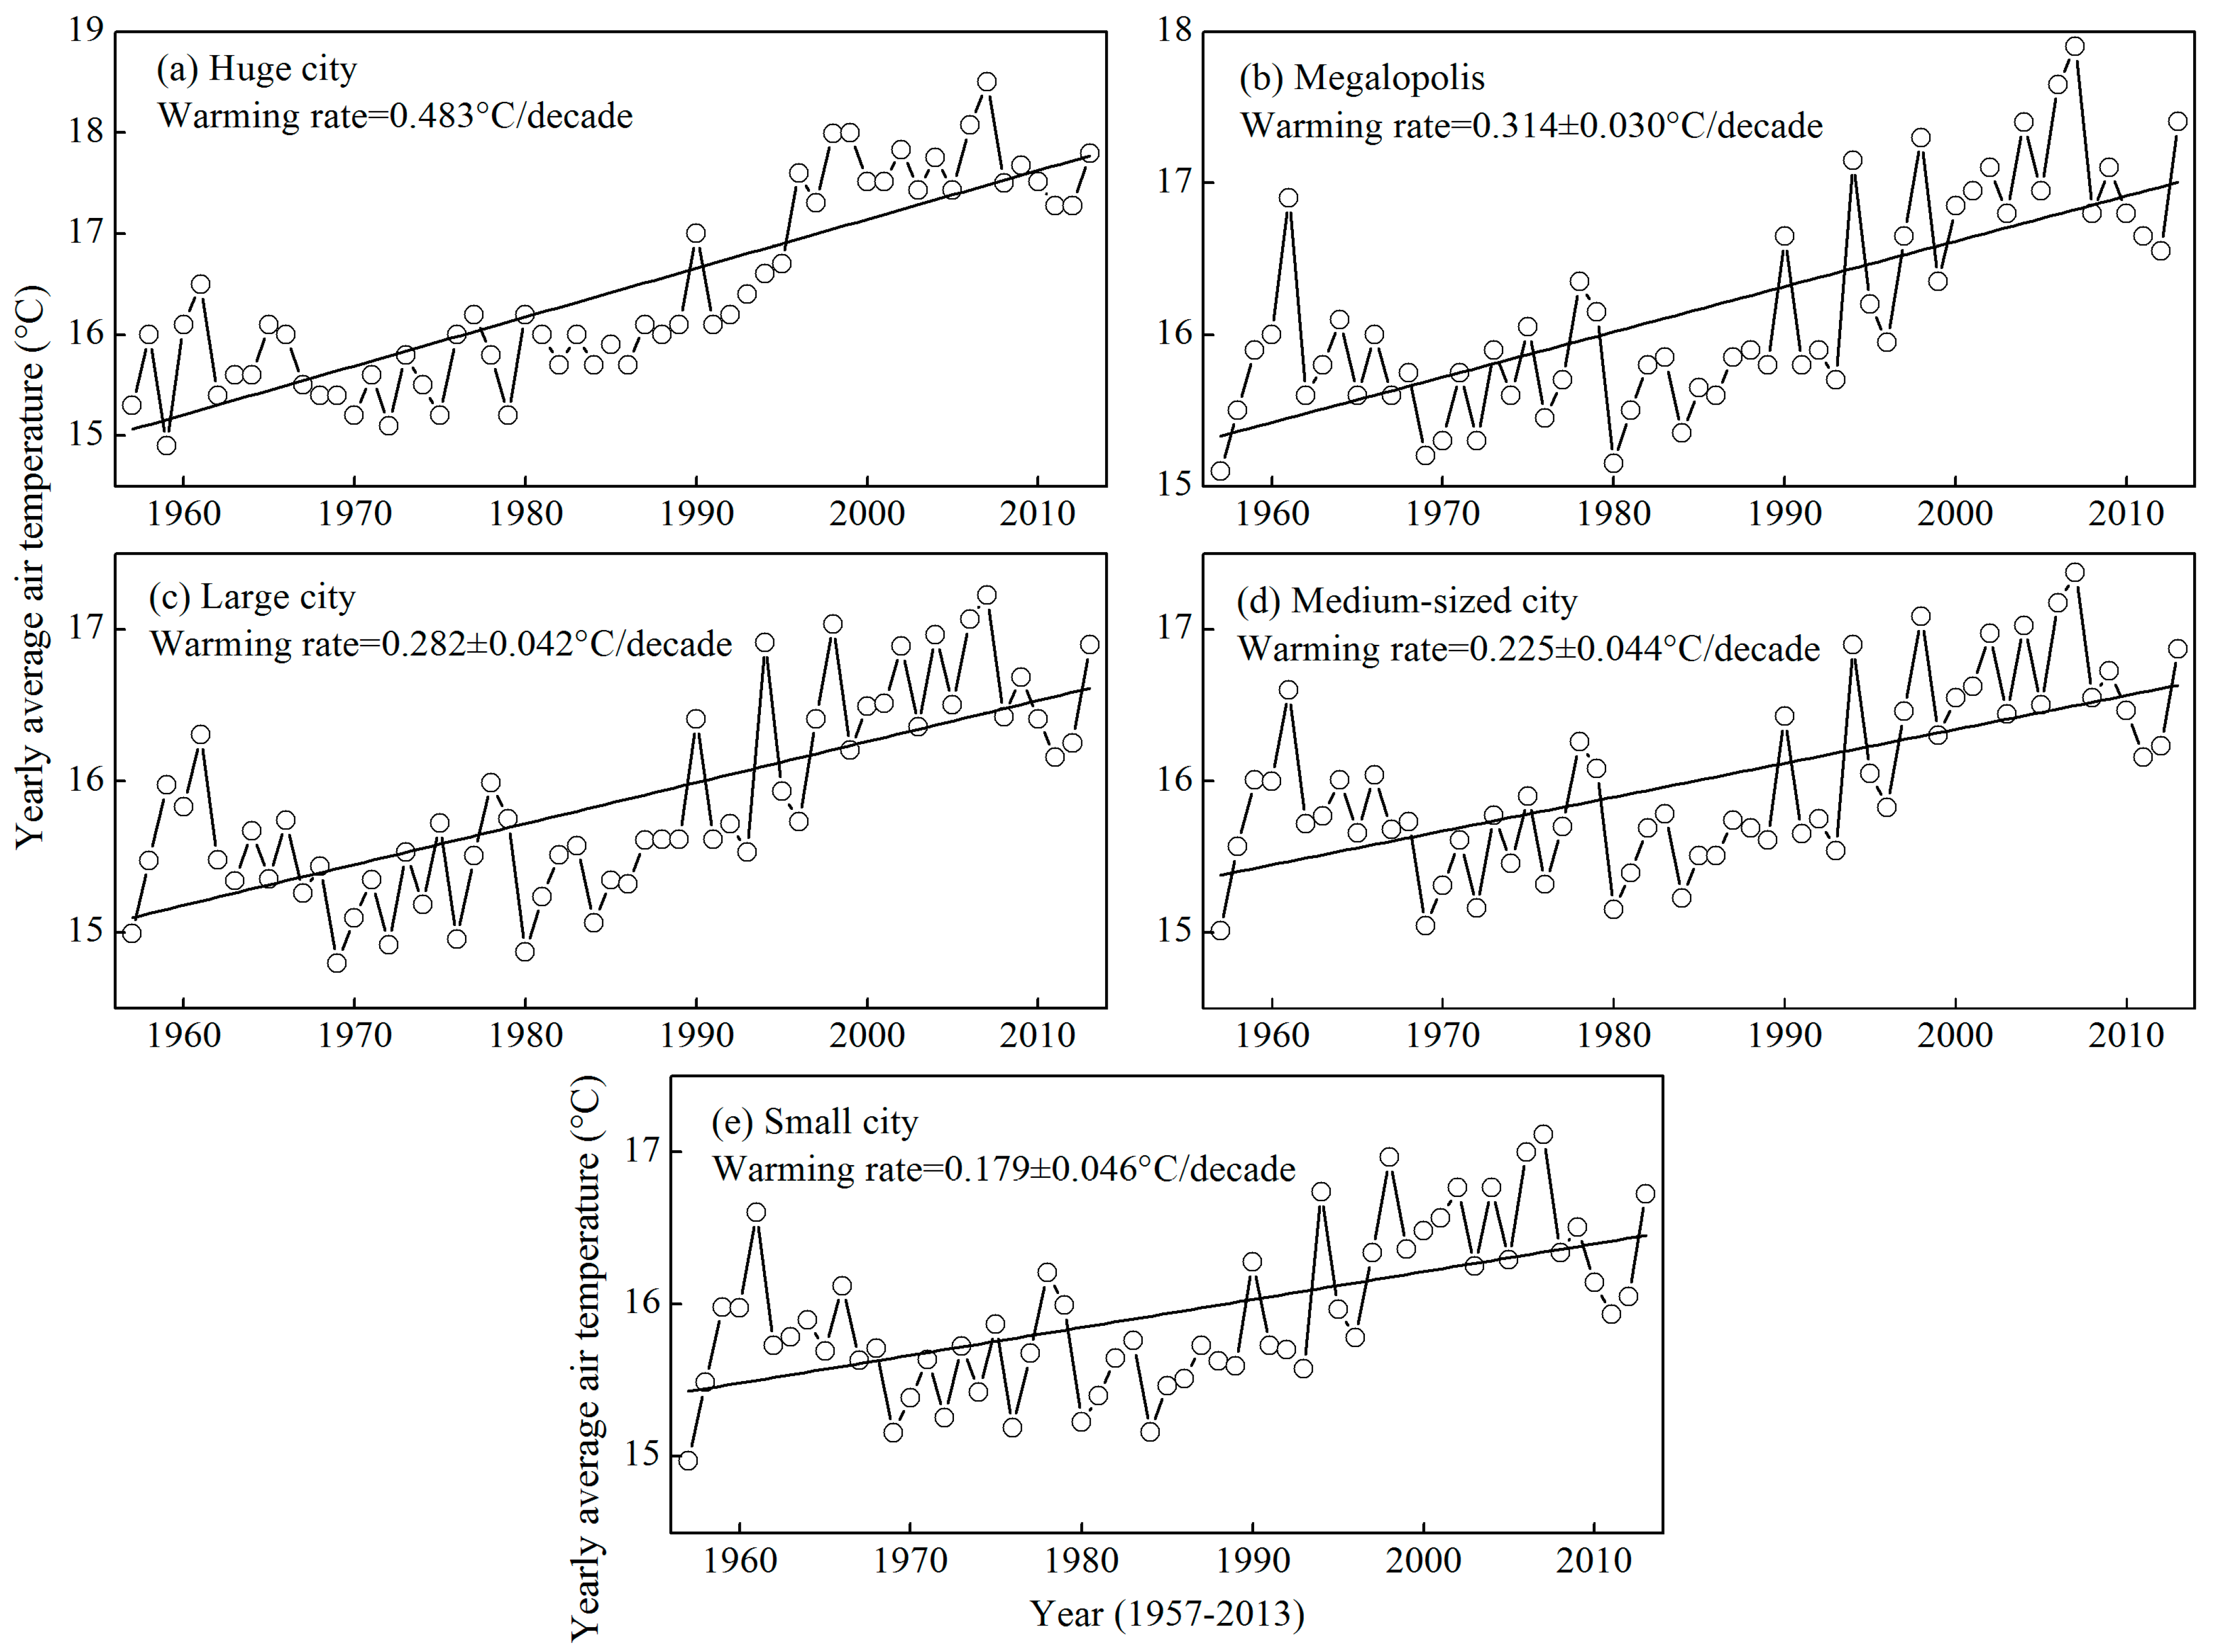
3.2. Comparison of Warming Rates of Different Urban Sizes

The variations in the warming rate of average air temperature, urbanization, logarithm of the population, and built-up area for five urban sizes are shown as boxplots in Figure 4. Figure 5 presents the time series of the yearly average air temperature of five urban sizes for the period of 1957–2013. The average warming rate decreased from 0.483 °C/decade in the huge city, to 0.314 ± 0.030 °C/decade in the megalopolis, 0.282 ± 0.042 °C/decade in the large city, 0.225 ± 0.044 °C/decade in medium-sized city, and to 0.179 ± 0.046 °C/decade in the small city (Figure 4a). The warming rate in huge city of Shanghai showed the most significant warming trends. Conversely, sites with the lowest warming trends are mainly located in small or medium-sized cities in Anhui Province, which has a less developed economy. The average warming rate of a huge city and megalopolis is significantly higher than that of a medium-sized city and small city, indicating that the UHI has a significant effect on climate warming (t-test, p < 0.05). The gradual decrease in the warming rate showed that the UHI effect on the climate warming decreased with the decrease in the urban size (Figure 4b–d). Similar results were observed in previous studies. For example, Yang et al. [19] found that the warming rates were 0.904 °C/decade in a megalopolis, 0.742 °C/decade in a large city, 0.674 °C/decade in a medium-sized city, and 0.614 °C/decade in a small city in East China using the “observation minus reanalysis” method from 1981 to 2007. However, our warming rates were markedly lower than those observed by Yang et al. [19]. The differences could be partially attributed to the data period. The authors used data from 1981 to 2007, but we used data from 1957 to 2013. The rapid urbanization in China started in late 1978 during the reform and opening up process [40]. Therefore, the effect of the UHI was more significant over the past 30 years than over 1957–1980.
Figure 4. Box plot of five urban sizes for the warming rate (a), urbanization rate (b), logarithm of the population (c), and built-up area (d). The box is determined by the 25th and 75th percentiles; the values for the median (horizontal line), mean (solid diamond), minimum, and maximum (hollow circle) are also included.
Ijerph 12 08773 g004
Figure 5. Long-term trends in the yearly average air temperature for huge city (a), megalopolis (b), large city (c), medium-sized city (d), and small city (e) and the linear fit (straight lines) of the yearly average air temperature vs. year. The warming rate is the average value of several stations with the same urban size.
Ijerph 12 08773 g005

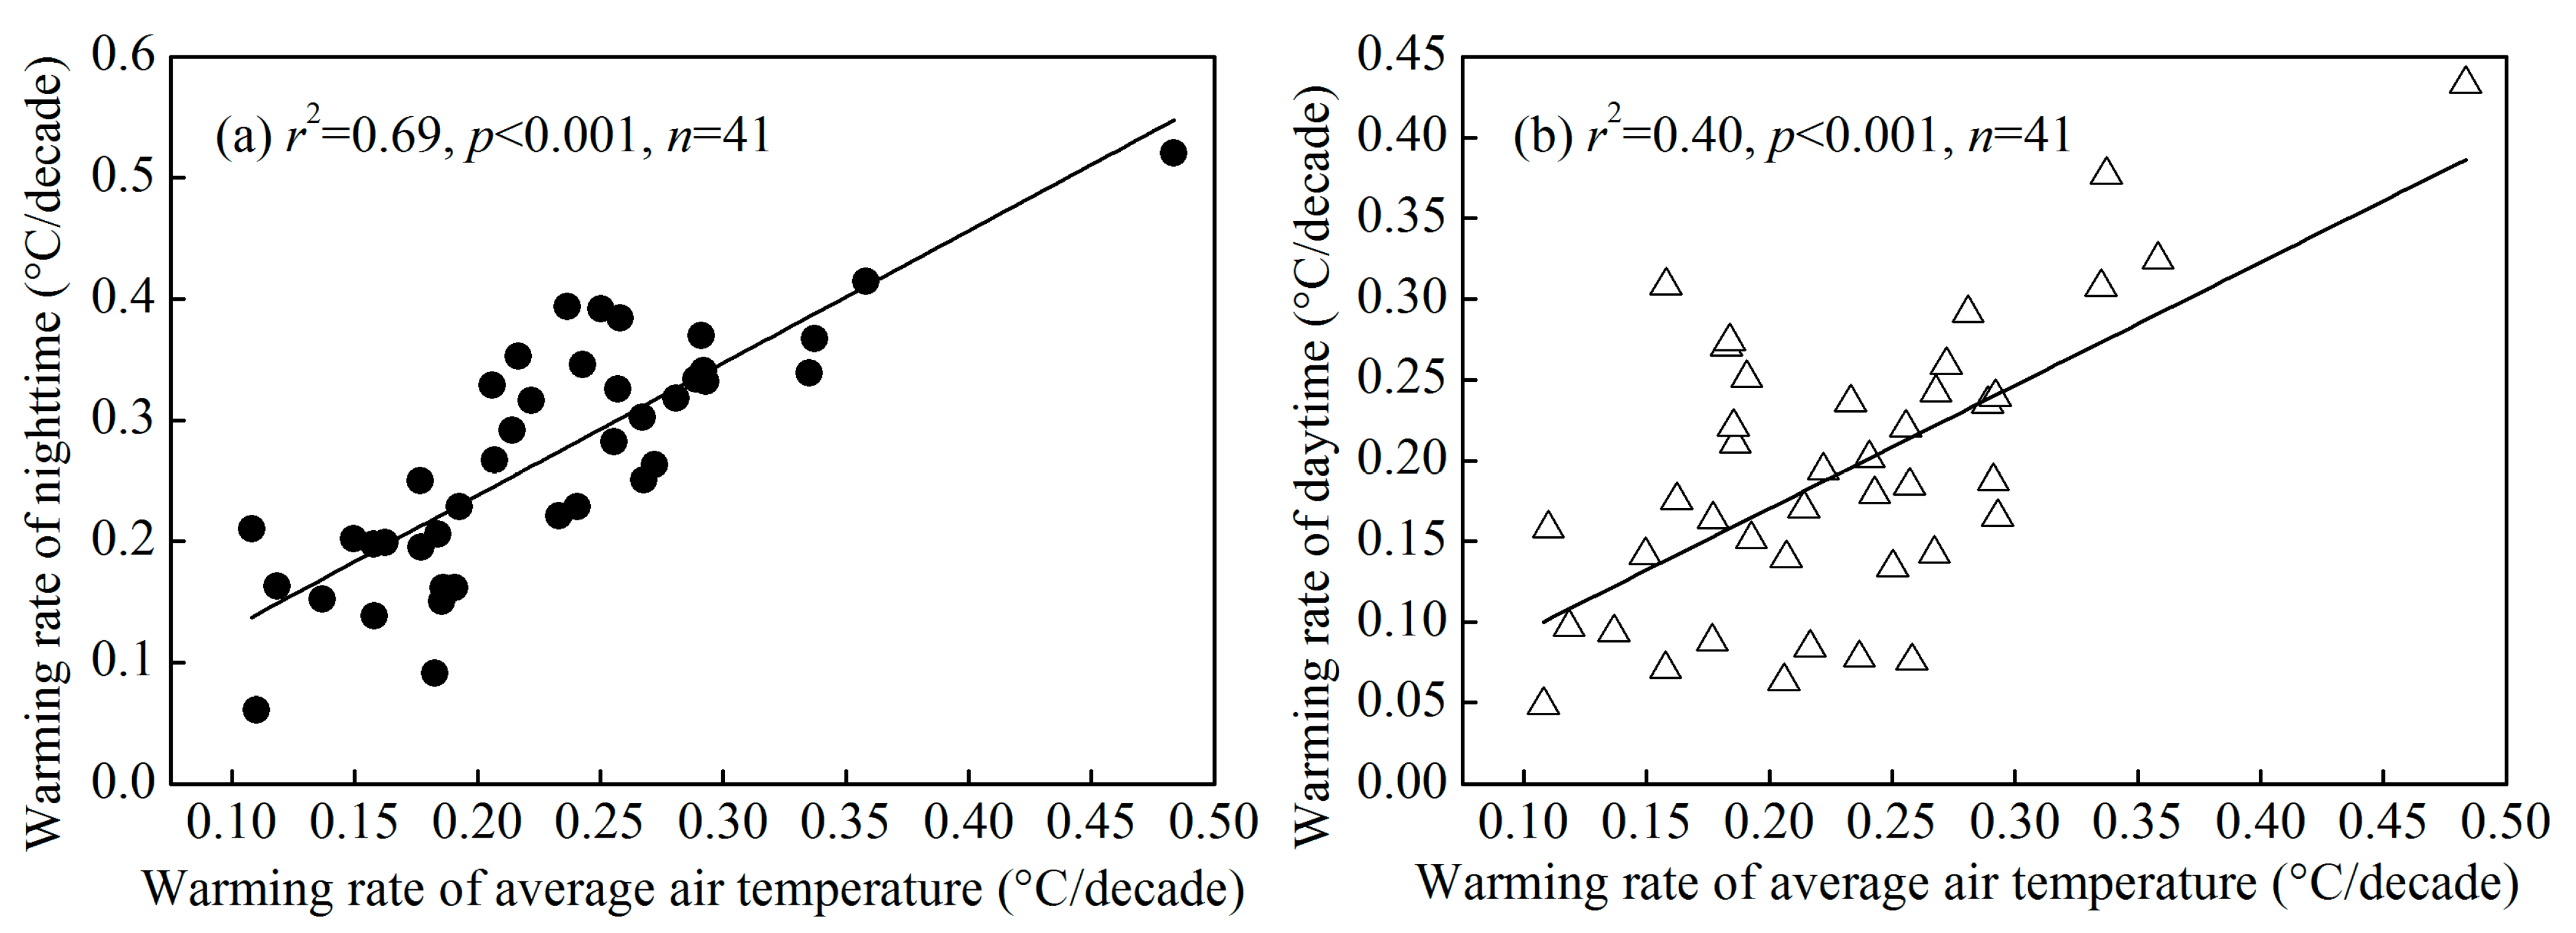
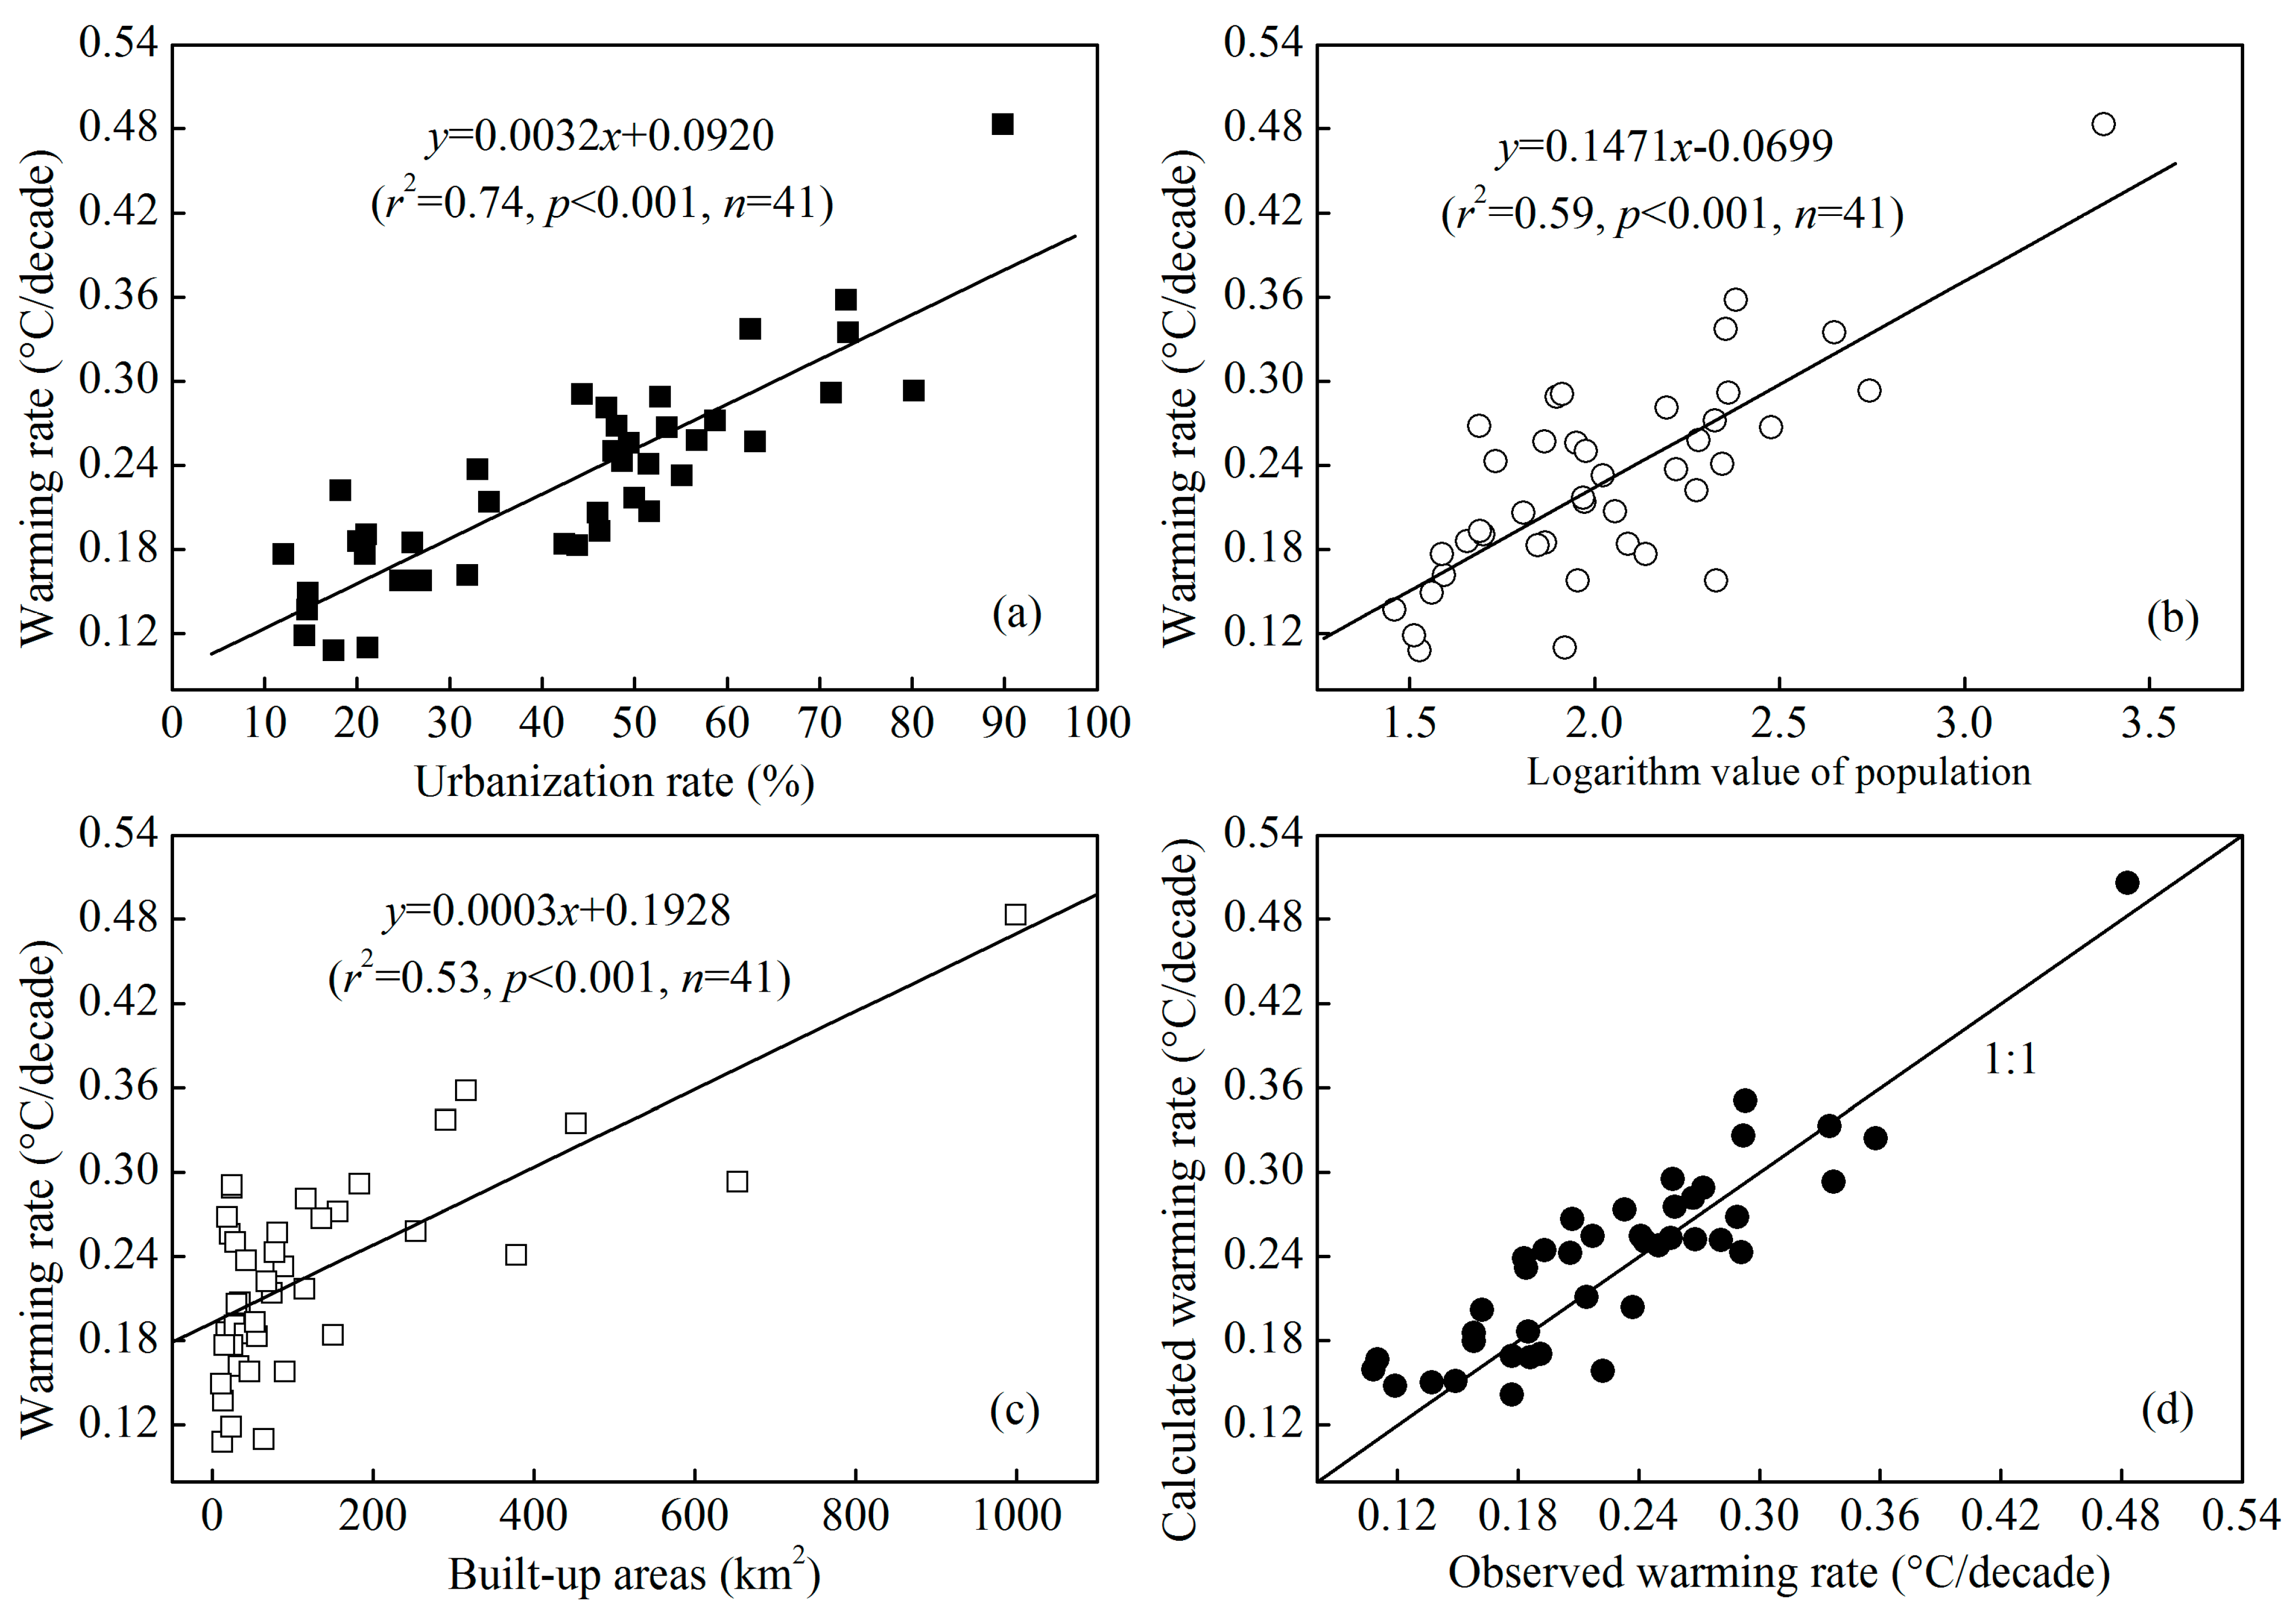
3.3. Factors Affecting the Warming Rate

Urbanization, including land use changes from non-construction land to construction land, dense building development, which alter sensible and latent heat fluxes, has a significant impact on climate warming. The study of the temperature trends at urban and non-urban stations between 1991 and 2000 showed that the UHI due to land use changes was significant at urban stations [41]. In addition, the temperature series were markedly affected by the UHI for most cities with populations of over 100,000 in China through the analysis of the homogenized annual mean surface air temperature data over 1954−2002 [17]. The urbanization rate, land use change and population are the main indices of urbanization. Therefore, we select the urbanization rate, population and built-up area as UHI indices that affect climate warming. Figure 6 shows that significant positive correlations are found between the urbanization rate, population, built-up areas and the climate warming rate of average air temperature. Of the three indices, the urbanization rate explains the most (74%) to the climate warming rate.
Figure 6. Linear relationships between the urbanization rate (a), population (b), built-up areas (c) and the warming rate of average air temperature for all 41 stations in the YRDUA. Comparison of the observed warming rate from the fit of the yearly mean daily air temperature vs. year as calculated from the multiple linear regression using the urbanization rate, population, and built-up area (d).
Ijerph 12 08773 g006
Previous studies mostly emphasized the effects of land use change, the expansion of built-up land, population increases and gross domestic product (GDP) on UHI intensity (the temperature difference between urban and rural stations) for a specific region or city [42,43,44,45]. Oke [10] found a linear relationship between the nocturnal heat-island intensity and the logarithm of the city population. Significantly positive correlations were observed between the UHI intensity and the total population, GDP, and area of paved roads in Shanghai [42]. However, a global study of 419 large cities found no relation between UHI intensity and population density or city size, but it emphasized the key role of urban vegetation cover and urban activities [46]. Our study presented significant correlations between the warming rate and urbanization rate, population, and built-up area in the YRDUA from a wide spatial perspective. Similarly, a significant correlation between the warming rate and the logarithm of the population was found for Japanese cities [11].
Multiple linear regression (Equation (1)) showed that the urbanization rate, population, and area of built-up districts could explain more than 80.7% of the climate warming variability. In addition, the observed and calculated warming rates were distributed along the 1:1 line (Figure 6d), indicating that the warming rate could be equally well explained by the urbanization rate, population, and built-up area.
y = 0.003   x 1 + 8.048 × 10 5   x 2 6.008 × 10 5   x 3 + 0.105 ( r 2 = 0.807 ,   p < 0.001 ,   n = 41 )
where y is the warming rate of average air temperature; and x1, x2, and x3 are the urbanization rate, population, and built-up areas, respectively.
The multiple linear regression revealed that the warming amount (the intercept of linear regression) that cannot be explained by the urbanization rate, population, and built-up area was 0.105 ± 0.014 °C/decade, which is lower than the former average warming rate of 0.179 ± 0.046 °C/decade for the small city. Therefore, a marked climate warming occurred due to the UHI, even for the small city, which further confirms Oke’s conclusion that a city of 1000 people could have an UHI effect [10]. Similarly, a study in the South Tyrol Province, northern Italy showed pronounced UHI effects for cities smaller than 1 km2 [47]. In addition, this value is very similar to the two lowest warming rates of 0.108 °C/decade in the small city of Chun’an and 0.110 °C/decade in the small city of Chuzhou (Table 2); these rates are representative of rural stations. Previous studies estimated the UHI effect by comparing observed temperatures at urban stations with those at the surrounding rural stations or by comparing the temperature between two urban-sized stations at the regional scale or between two regions at large scales [5,6,36]. Considering that this value is very close to the lowest warming rate in the smallest city similar to rural region, we therefore assume 0.105 ± 0.014 °C/decade is the background warming rate (i.e., without urbanization) of this region. This warming rate is very similar to the background warming rate of 0.12 °C/decade near Hong Kong over 1971–2010 [32]. In addition, the global warming rate from 1951 to 2012 ranged from 0.08 to 0.14 °C/decade with an average value of 0.12 °C/decade [1].
Subtracting this background warming rate from the observed warming rates of the five urban sizes yields the estimated contribution of urbanization to the climate warming rate. The average warming rate attributable to urbanization was 0.124 ± 0.074 °C/decade in the YRDUA. This value is much larger than the previous estimate of 0.05 °C/decade for Southeast China from 1979 to 1998 [5] but is very similar to the 0.11 °C/decade for North China [48] and 0.10 °C/decade for China when considering the annual land-based data for a long period (1951–2004) relative to the sea-surface temperature [18]. In addition, the UHI-induced warming rate of 0.368 °C/decade for the largest city (Shanghai) was consistent with the value of 0.40 °C/decade observed in other studies [19]. Therefore, the calculated warming rate caused by UHI in our study is reliable and acceptable.
The relative contributions of the UHI to the warming rates of average air temperature in huge cities, megalopolises, large cities, medium-sized cities, and small cities were 78.3%, 66.4%, 62.1%, 51.5%, and 37.1%, respectively. Our results on the relative contribution of the UHI to climate warming are consistent with previous studies. Ren et al. [36] found that urbanization-induced warming for Beijing (Wuhan) was significant and accounted for 80.4% (64.5%) of the warming over 1961−2000 and 61.3% (39.5%) of the warming over 1981−2000. Similarly, the contribution of urbanization to the warming trend was higher than 40% (40%–50%) in Hong Kong [32]. The results of this study and many other studies showed that urbanization significantly enhances local climate warming. In the future few decades, the effect of UHI due to urbanization on the local climate will further aggravate with the implementation of China’s National New-type Urbanization Plan [40]. The warming rate due to the UHI and its contributions to the climate warming in the fifth report of the IPCC can still be regarded as conservative in the urban agglomeration region. Some studies have suggested that the significant contribution of urbanization to temperature changes might be comparable to that of GHG emission for metropolises and large cities [19]. Of course, the urban area only represents a very limited area of the Yangtze River Delta, the effect of UHI due to urbanization on the local climate might vary with the location of meteorological station as the study in Beijing Municipality showed [49]. In addition, the seasonal characteristics of UHI as observed in other regions [49] should be included in the future study to elucidate the fine effect due to the urbanization in the YRD.

4. Conclusions

China has experienced rapid economic growth and urbanization [40], and the YRDUA has become one of six influential world-class metropolitan areas in recent decades. Our analysis of daily average, minimal and maximal air temperature observations at 41 stations in the YRDUA over 1957−2010 has revealed significant long-term warming due to the background warming and the UHI. The warming rate ranging from 0.108 to 0.483 °C/decade for average air temperature is generally consistent with the warming trend of other urban regions in China and in other urban agglomerations worldwide [5,11]. Significant positive correlations were found between three urbanization factors (urbanization rate, population, and built-up area) and the warming rates. All three factors could explain more than 80% of the variability in the warming rate. Our attempt to estimate the contribution of the UHI to the observed warming based on multiple linear regression and warming rates suggests that 37.1%–78.3% of the warming in the last few decades could be explained by local urbanization at various urban sizes. The results of this study showed that urbanization significantly enhanced local climate warming. However, more detailed physical explanations of the UHI’s role in the warming rate are needed in future studies. In this study, social-economic factors of urbanization, such as the urbanization rate, population and built-up area have been emphasized. However, they are only indirectly related to the warming rate of UHI. The actual physical factors, including reduced evapotranspiration of the impervious surfaces with scarce vegetation cover, complicated changes in the surface energy balance between impervious surfaces and vegetation, and anthropogenic heat release from automobiles, power plants, air conditioners should be elucidated in the future study.

Acknowledgments

This study was jointly funded by the National Natural Science Foundation of China (grant 41430635) and the Scientific Research Innovation Plan Projects of Universities affiliated with the Jiangsu Province (10319-94). We would like to thank Yibo Zhang for assisting in the drawing of figures. The authors would also like to thank the two anonymous reviewers for their useful comments and constructive suggestions.

Author Contributions

Yuqi Lu planned the study and contributed to revising the paper. Qunfang Huang conducted data collection, performed statistical analysis and wrote the paper.

Conflicts of Interest

The authors declare no conflict of interest.

References

  1. Stocker, T.F.; Dahe, Q.; Plattner, G.-K. Climate Change 2013: The Physical Science Basis, Working Group I Contribution to the Fifth Assessment Report of the Intergovernmental Panel on Climate Change. Stockholm, Sweden, 23–26 September 2013; Available online: http://www.climatechange2013.org/report/ (accessed on 27 July 2015).
  2. Grimm, N.B.; Faeth, S.H.; Golubiewski, N.E.; Redman, C.L.; Wu, J.; Bai, X.; Briggs, J.M. Global change and the ecology of cities. Science 2008, 319, 756–760. [Google Scholar] [CrossRef] [PubMed]
  3. Walther, G.-R.; Post, E.; Convey, P.; Menzel, A.; Parmesan, C.; Beebee, T.J.; Fromentin, J.-M.; Hoegh-Guldberg, O.; Bairlein, F. Ecological responses to recent climate change. Nature 2002, 416, 389–395. [Google Scholar] [CrossRef] [PubMed]
  4. Patz, J.A.; Campbell-Lendrum, D.; Holloway, T.; Foley, J.A. Impact of regional climate change on human health. Nature 2005, 438, 310–317. [Google Scholar] [CrossRef] [PubMed]
  5. Zhou, L.; Dickinson, R.E.; Tian, Y.; Fang, J.; Li, Q.; Kaufmann, R.K.; Tucker, C.J.; Myneni, R.B. Evidence for a significant urbanization effect on climate in China. Proc. Natl. Acad. Sci. USA. 2004, 101, 9540–9544. [Google Scholar] [CrossRef] [PubMed]
  6. Kalnay, E.; Cai, M. Impact of urbanization and land-use change on climate. Nature 2003, 423, 528–531. [Google Scholar] [CrossRef] [PubMed]
  7. Zhao, L.; Lee, X.; Smith, R.B.; Oleson, K. Strong contributions of local background climate to urban heat islands. Nature 2014, 511, 216–219. [Google Scholar] [CrossRef] [PubMed]
  8. Jenerette, G.D.; Harlan, S.L.; Brazel, A.; Jones, N.; Larsen, L.; Stefanov, W.L. Regional relationships between surface temperature, vegetation, and human settlement in a rapidly urbanizing ecosystem. Landsc. Ecol. 2007, 22, 353–365. [Google Scholar] [CrossRef]
  9. Acero, J.A.; Arrizabalaga, J.; Kupski, S.; Katzschner, L. Urban heat island in a coastal urban area in northern Spain. Theor. Appl. Climatol. 2013, 113, 137–154. [Google Scholar] [CrossRef]
  10. Oke, T.R. City size and the urban heat island. Atmos. Environ. 1973, 7, 769–779. [Google Scholar] [CrossRef]
  11. Fujibe, F. Detection of urban warming in recent temperature trends in Japan. Int. J. Climatol. 2009, 29, 1811–1822. [Google Scholar] [CrossRef]
  12. United Nations Population Division. World Urbanization Prospects: The 2007 Revision. United Nations Department of Economic and Social Affairs: New York, NY, USA, 2008; Available online: http://www.un.org/esa/population/publications/wup2007/2007WUP_ExecSum_web.pdf (accessed on 27 July 2015).
  13. Douglas, I. Urban ecology and urban ecosystems: Understanding the links to human health and well-being. Curr. Opin. Environ. Sustain. 2012, 4, 385–392. [Google Scholar] [CrossRef]
  14. Conti, S.; Meli, P.; Minelli, G.; Solimini, R.; Toccaceli, V.; Vichi, M.; Beltrano, C.; Perini, L. Epidemiologic study of mortality during the Summer 2003 heat wave in Italy. Environ. Res. 2005, 98, 390–399. [Google Scholar] [CrossRef] [PubMed]
  15. Schneider, A.; Friedl, M.A.; Potere, D. A new map of global urban extent from MODIS satellite data. Environ. Res. Lett. 2009, 4, 044003. [Google Scholar] [CrossRef]
  16. Adachi, S.A.; Kimura, F.; Kusaka, H.; Inoue, T.; Ueda, H. Comparison of the impact of global climate changes and urbanization on summertime future climate in the Tokyo Metropolitan Area. J. Clim. 2012, 51, 1441–1454. [Google Scholar] [CrossRef]
  17. Li, Q.; Zhang, H.; Liu, X.; Huang, J. Urban heat island effect on annual mean temperature during the last 50 years in China. Theor. Appl. Climatol. 2004, 79, 165–174. [Google Scholar] [CrossRef]
  18. Jones, P.; Lister, D.; Li, Q. Urbanization effects in large-scale temperature records, with an emphasis on China. J. Geophys. Res. Atmos. 2008, 113, D16. [Google Scholar] [CrossRef]
  19. Yang, X.; Hou, Y.; Chen, B. Observed surface warming induced by urbanization in east China. J. Geophys. Res. Atmos. 2011, 116. [Google Scholar] [CrossRef]
  20. Li, Y.; Zhu, L.; Zhao, X.; Li, S.; Yan, Y. Urbanization impact on temperature change in China with emphasis on land cover change and human activity. J. Clim. 2013, 26, 8765–8780. [Google Scholar] [CrossRef]
  21. Wang, F.; Ge, Q. Estimation of urbanization bias in observed surface temperature change in China from 1980 to 2009 using satellite land-use data. Sci. Bull. 2012, 57, 1708–1715. [Google Scholar] [CrossRef]
  22. Tian, G.; Jiang, J.; Yang, Z.; Zhang, Y. The urban growth, size distribution and spatio-temporal dynamic pattern of the Yangtze River Delta megalopolitan region, China. Ecol. Model. 2011, 222, 865–878. [Google Scholar] [CrossRef]
  23. Zhang, N.; Gao, Z.; Wang, X.; Chen, Y. Modeling the impact of urbanization on the local and regional climate in Yangtze River Delta, China. Theor. Appl. Climatol. 2010, 102, 331–342. [Google Scholar] [CrossRef]
  24. Gu, C.; Hu, L.; Zhang, X.; Wang, X.; Guo, J. Climate change and urbanization in the Yangtze River Delta. Habitat Int. 2011, 35, 544–552. [Google Scholar] [CrossRef]
  25. Deng, J.; Zhang, Y.; Qin, B.; Shi, K. Long-term changes in surface solar radiation and their effects on air temperature in the Shanghai region. Sci. Bull. 2015, 35. [Google Scholar] [CrossRef]
  26. You, Q.; Kang, S.; Flügel, W.-A.; Sanchez-Lorenzo, A.; Yan, Y.; Huang, J.; Martin-Vide, J. From brightening to dimming in sunshine duration over the eastern and central Tibetan Plateau (1961–2005). Theor. Appl. Climatol. 2010, 101, 445–457. [Google Scholar] [CrossRef]
  27. Shanghai Statistics Bureau. Shanghai Statistical Yearbook; China Statistics Press: Beijing, China, 2013.
  28. Jiangsu Statistics Bureau. Jiangsu Statistical Yearbook; China Statistics Press: Beijing, China, 2013.
  29. Zhejiang Statistics Bureau. Zhejiang Statistical Yearbook; China Statistics Press: Beijing, China, 2013.
  30. Anhui Statistics Bureau. Anhui Statistical Yearbook; China Statistics Press: Beijing, China, 2013.
  31. State Statistics Bureau. China City Statistical Yearbook; China Statistics Press: Beijing, China, 2013.
  32. Chan, H.; Kok, M.; Lee, T. Temperature trends in Hong Kong from a seasonal perspective. Clim. Res. 2012, 55, 53–63. [Google Scholar] [CrossRef]
  33. Zhang, Y.L.; Qin, B.Q.; Chen, W.M. Analysis of 40 year records of solar radiation data in Shanghai, Nanjing and Hangzhou in Eastern China. Theor. Appl. Climatol. 2004, 78, 217–227. [Google Scholar] [CrossRef]
  34. Li, Q.; Li, W.; Si, P.; Xiaorong, G.; Dong, W.; Jones, P.; Huang, J.; Cao, L. Assessment of surface air warming in northeast China, with emphasis on the impacts of urbanization. Theor. Appl. Climatol. 2010, 99, 469–478. [Google Scholar] [CrossRef]
  35. Founda, D.; Pierros, F.; Petrakis, M.; Zerefos, C. Interdecadal variations and trends of the Urban Heat Island in Athens (Greece) and its response to heat waves. Atmos. Res. 2015, 161, 1–13. [Google Scholar] [CrossRef]
  36. Ren, G.; Chu, Z.; Chen, Z.; Ren, Y. Implications of temporal change in urban heat island intensity observed at Beijing and Wuhan stations. Geophys. Res. Lett. 2007, 34, L05711. [Google Scholar] [CrossRef]
  37. Lau, K.L.; Ng, E. An investigation of urbanization effect on urban and rural Hong Kong using a 40-year extended temperature record. Landsc. Urban Plan. 2013, 114, 42–52. [Google Scholar] [CrossRef]
  38. Stone, B. Urban and rural temperature trends in proximity to large US cities: 1951–2000. Int. J. Climatol. 2007, 27, 1801–1807. [Google Scholar] [CrossRef]
  39. Ceppi, P.; Scherrer, S.C.; Fischer, A.M.; Appenzeller, C. Revisiting Swiss temperature trends 1959–2008. Int. J. Climatol. 2012, 32, 203–213. [Google Scholar] [CrossRef]
  40. Bai, X.; Shi, P.; Liu, Y. Society: Realizing China’s urban dream. Nature 2014, 509, 158–160. [Google Scholar] [CrossRef] [PubMed]
  41. He, J.; Liu, J.; Zhuang, D.; Zhang, W.; Liu, M. Assessing the effect of land use/land cover change on the change of urban heat island intensity. Theor. Appl. Climatol. 2007, 90, 217–226. [Google Scholar] [CrossRef]
  42. Zhang, K.; Wang, R.; Shen, C.; Da, L. Temporal and spatial characteristics of the urban heat island during rapid urbanization in Shanghai, China. Environ. Monit. Assess. 2010, 169, 101–112. [Google Scholar] [CrossRef] [PubMed]
  43. Cui, L.; Shi, J. Urbanization and its environmental effects in Shanghai, China. Urban Climate 2012, 2, 1–15. [Google Scholar] [CrossRef]
  44. Hu, Y.; Jia, G. Influence of land use change on urban heat island derived from multi—sensor data. Environ. Monit. Assess. 2010, 30, 1382–1395. [Google Scholar] [CrossRef]
  45. Wolters, D.; Brandsma, T. Estimating the Urban Heat Island in residential areas in the Netherlands using observations by weather amateurs. J. Appl. Meteor. Climatol. 2012, 51, 711–721. [Google Scholar] [CrossRef]
  46. Peng, S.; Piao, S.; Ciais, P.; Friedlingstein, P.; Ottle, C.; Bréon, F.O.-M.; Nan, H.; Zhou, L.; Myneni, R.B. Surface urban heat island across 419 global big cities. Environ. Sci. Technol. 2011, 46, 696–703. [Google Scholar] [CrossRef] [PubMed]
  47. Heinl, M.; Hammerle, A.; Tappeiner, U.; Leitinger, G. Determinants of urban–rural land surface temperature differences—A landscape scale perspective. Landsc. Urban Plan. 2015, 134, 33–42. [Google Scholar] [CrossRef]
  48. Ren, G.; Zhou, Y.; Chu, Z.; Zhou, J.; Zhang, A.; Guo, J.; Liu, X. Urbanization effects on observed surface air temperature trends in North China. J. Clim. 2008, 21, 1333–1348. [Google Scholar] [CrossRef]
  49. Yang, P.; Ren, G.; Liu, W. Spatial and temporal characteristics of Beijing urban heat island intensity. J. Clim. 2013, 52, 1803–1816. [Google Scholar] [CrossRef]

