
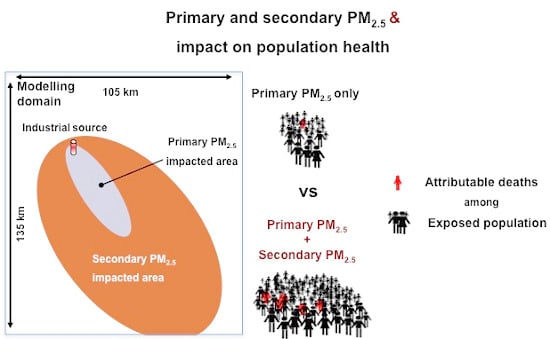
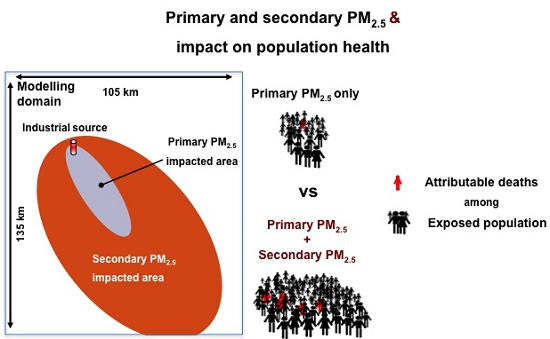
Secondary Particulate Matter Originating from an Industrial Source and Its Impact on Population Health

Abstract
:
1. Introduction
2. Material and Methods
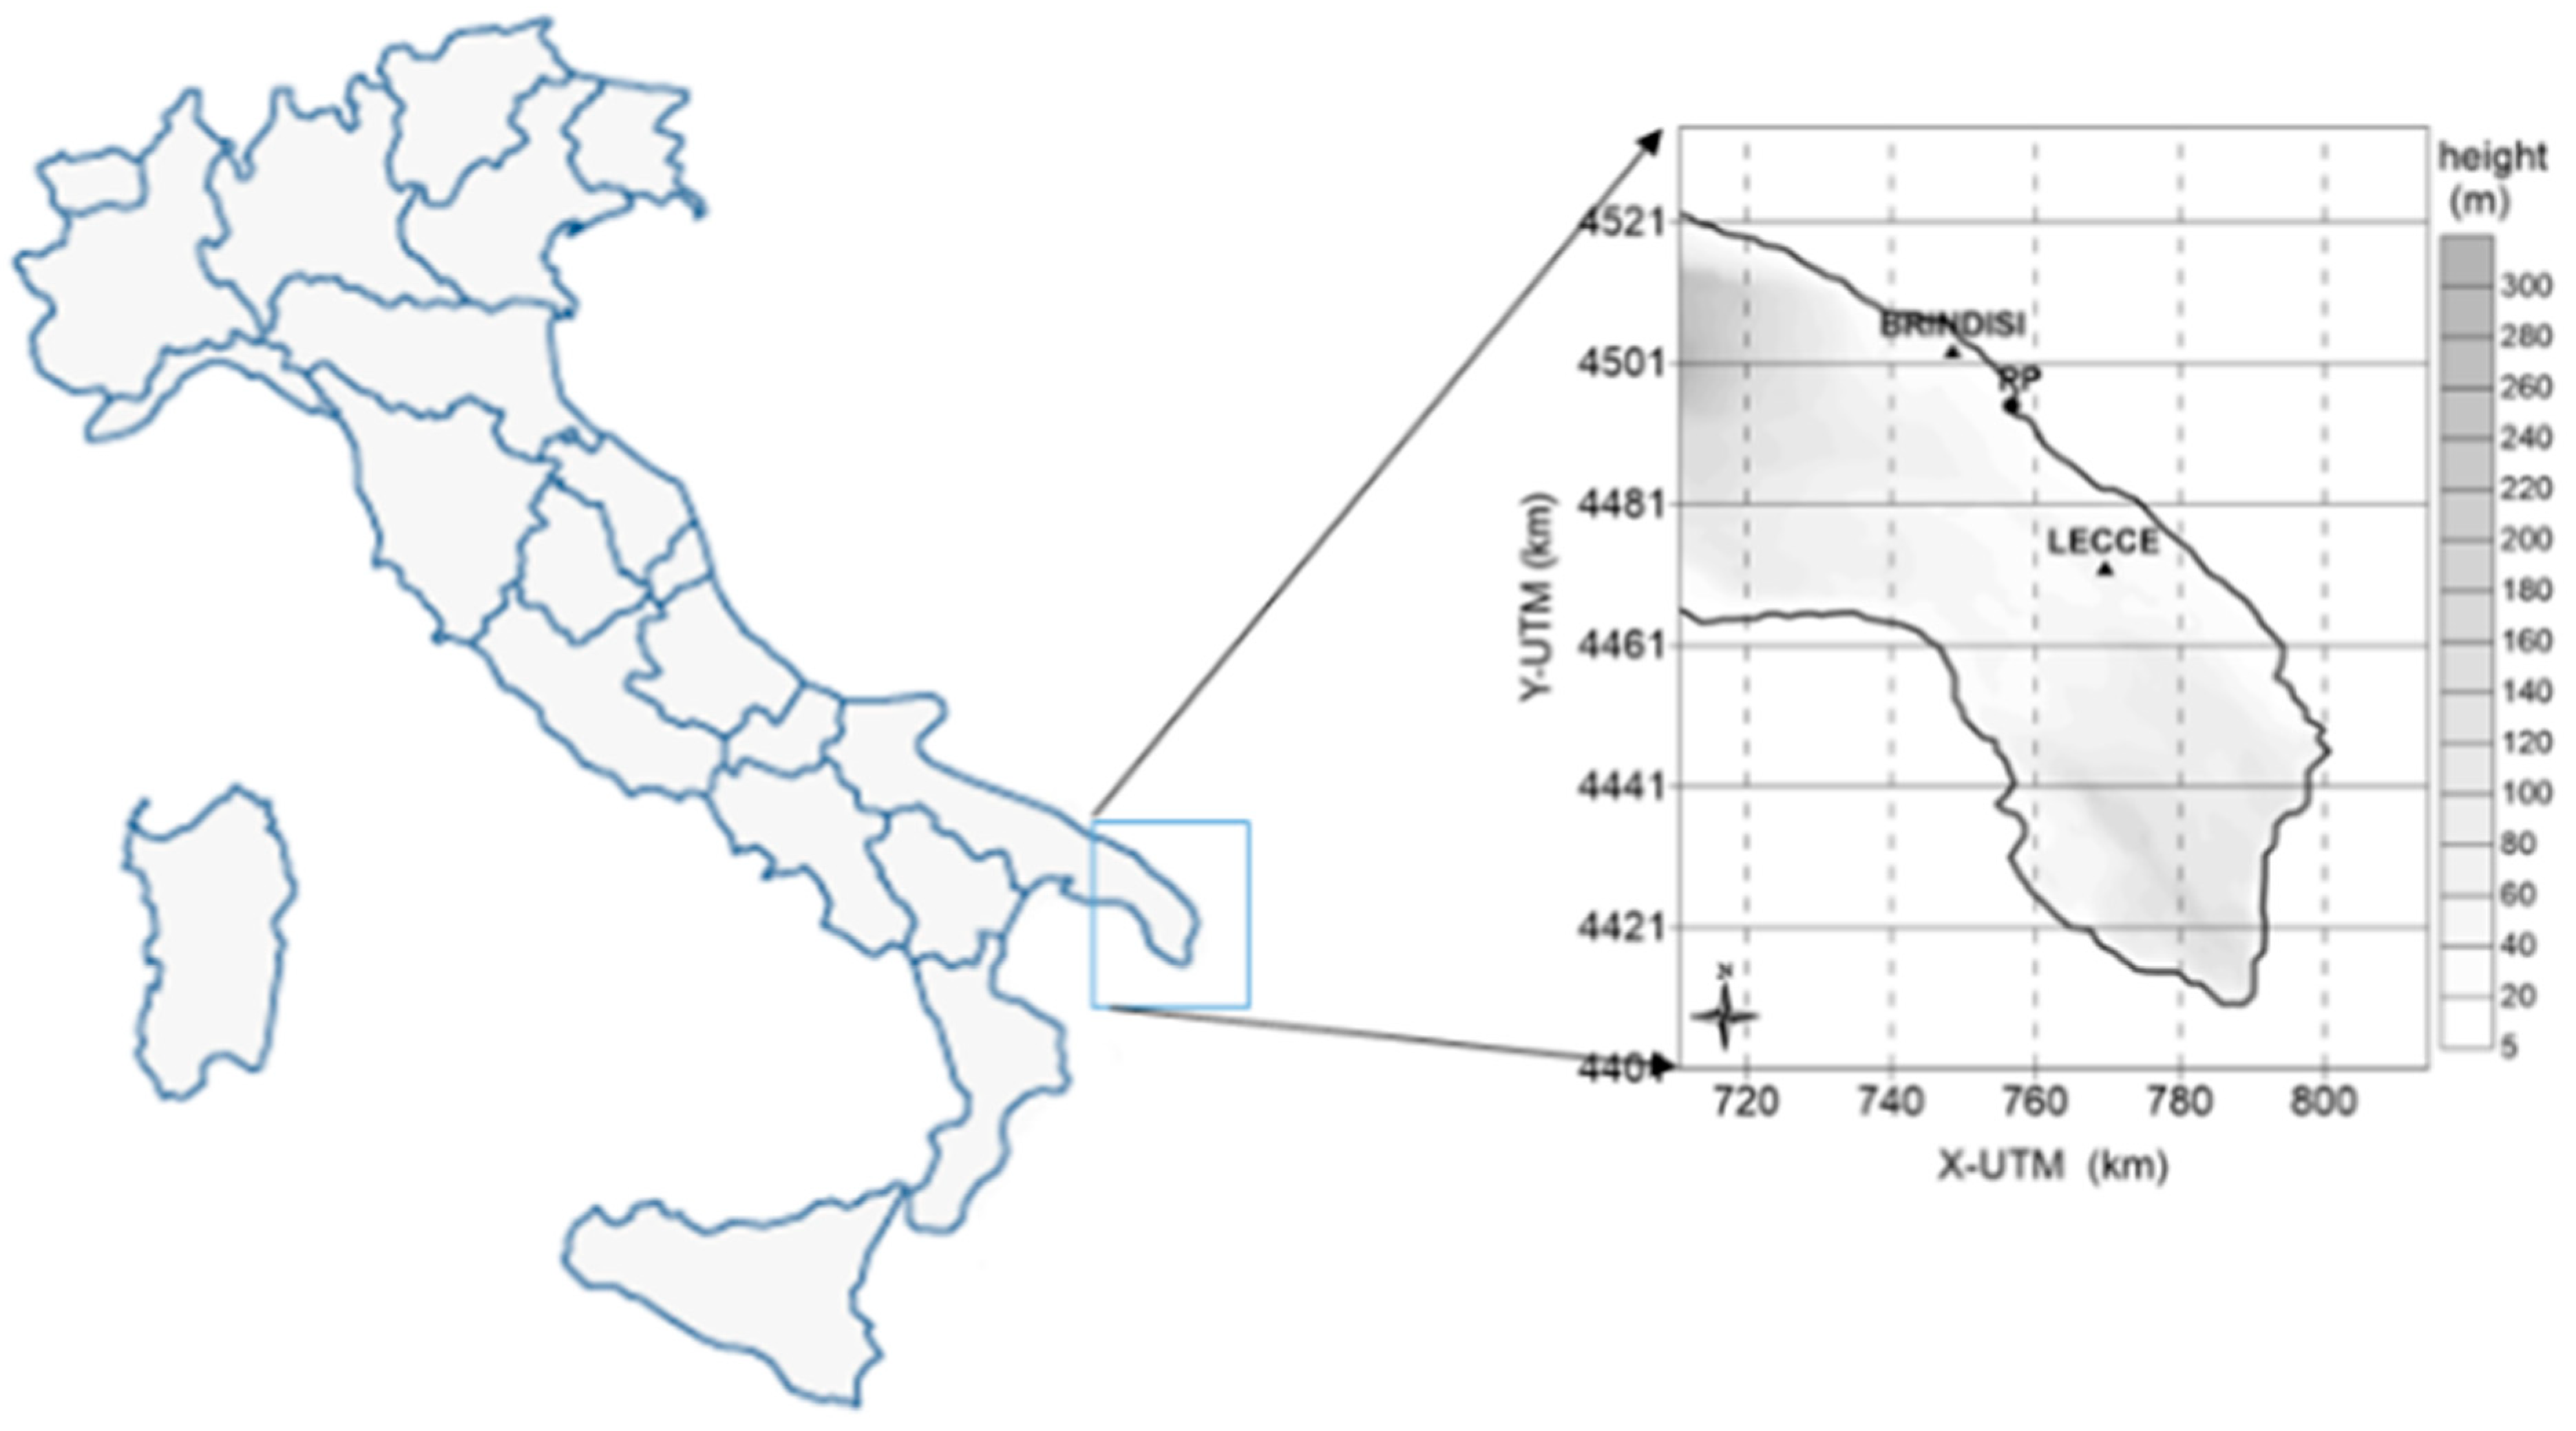
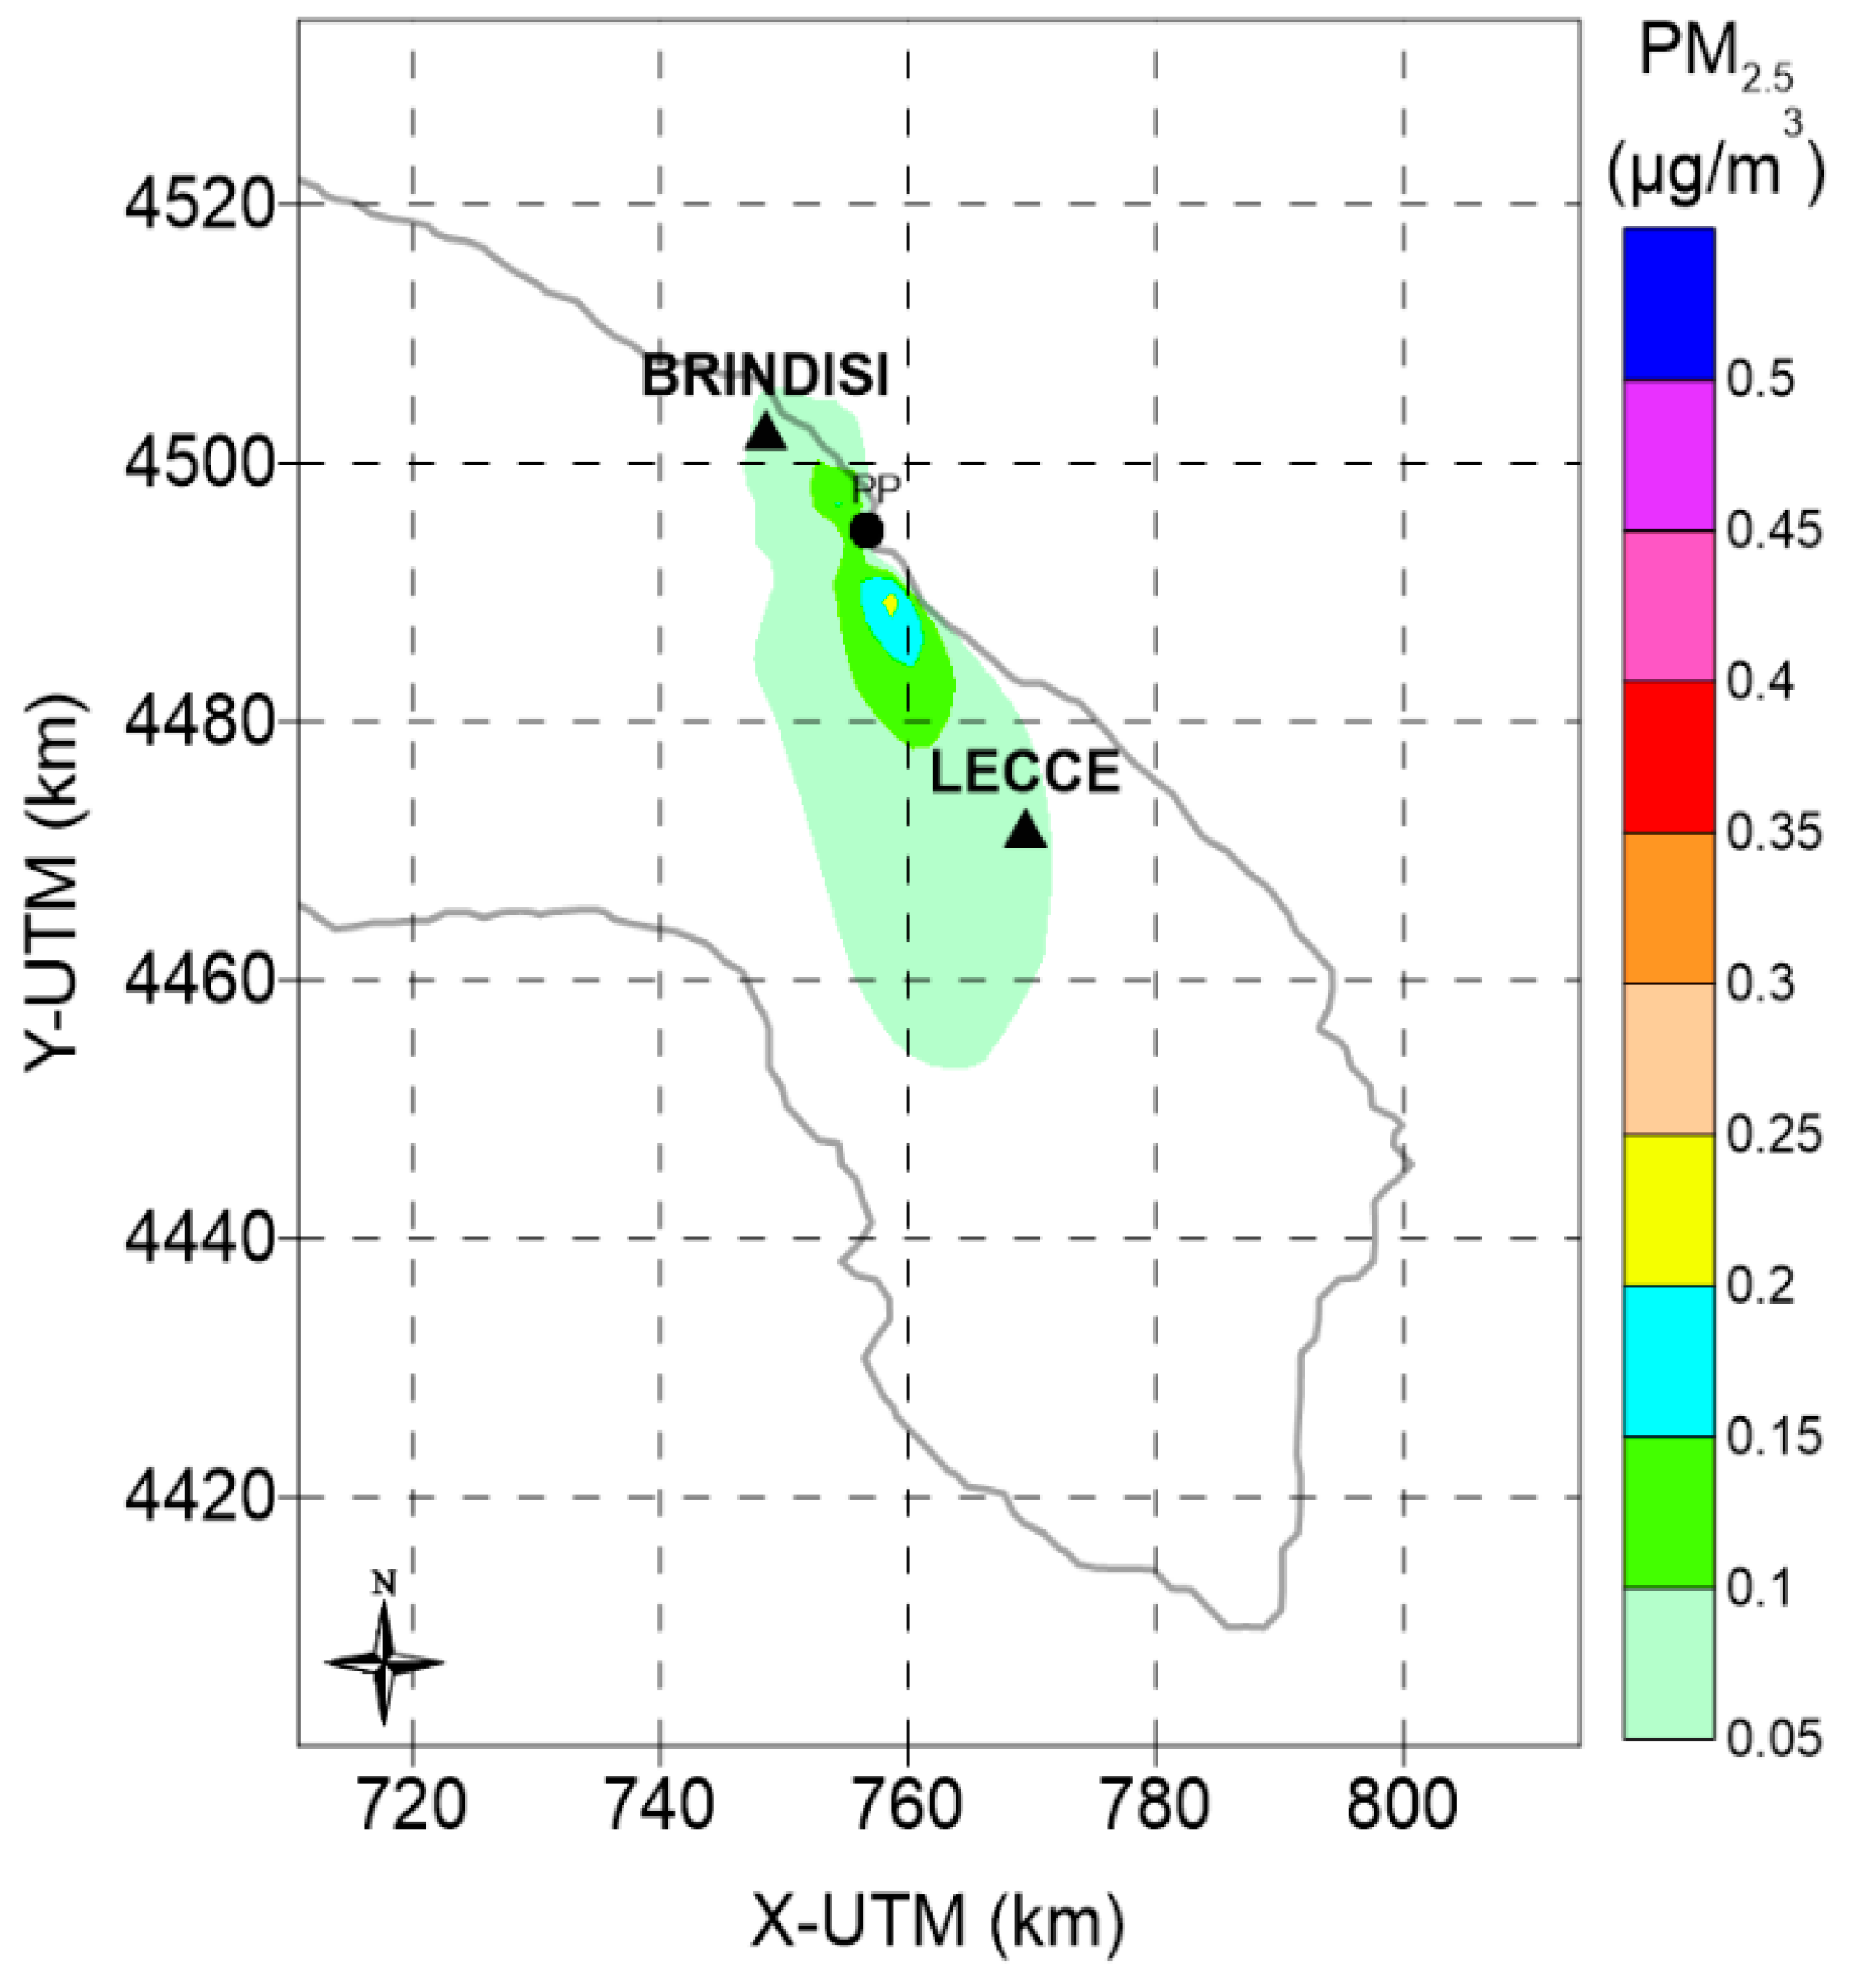
2.1. Source Characteristics and Area of Study

2.2. Atmospheric Modelling Setup

| Station | Location | O3 Concentration | ||||
|---|---|---|---|---|---|---|
| Xutm (km) | Yutm (km) | Min (ppb) | Max (ppb) | Average (ppb) | St. Dev (ppb) | |
| S1 | 749.277 | 4503.418 | 2 | 79 | 32 | 14 |
| S2 | 764.807 | 4478.158 | 4 | 115 | 38 | 15 |
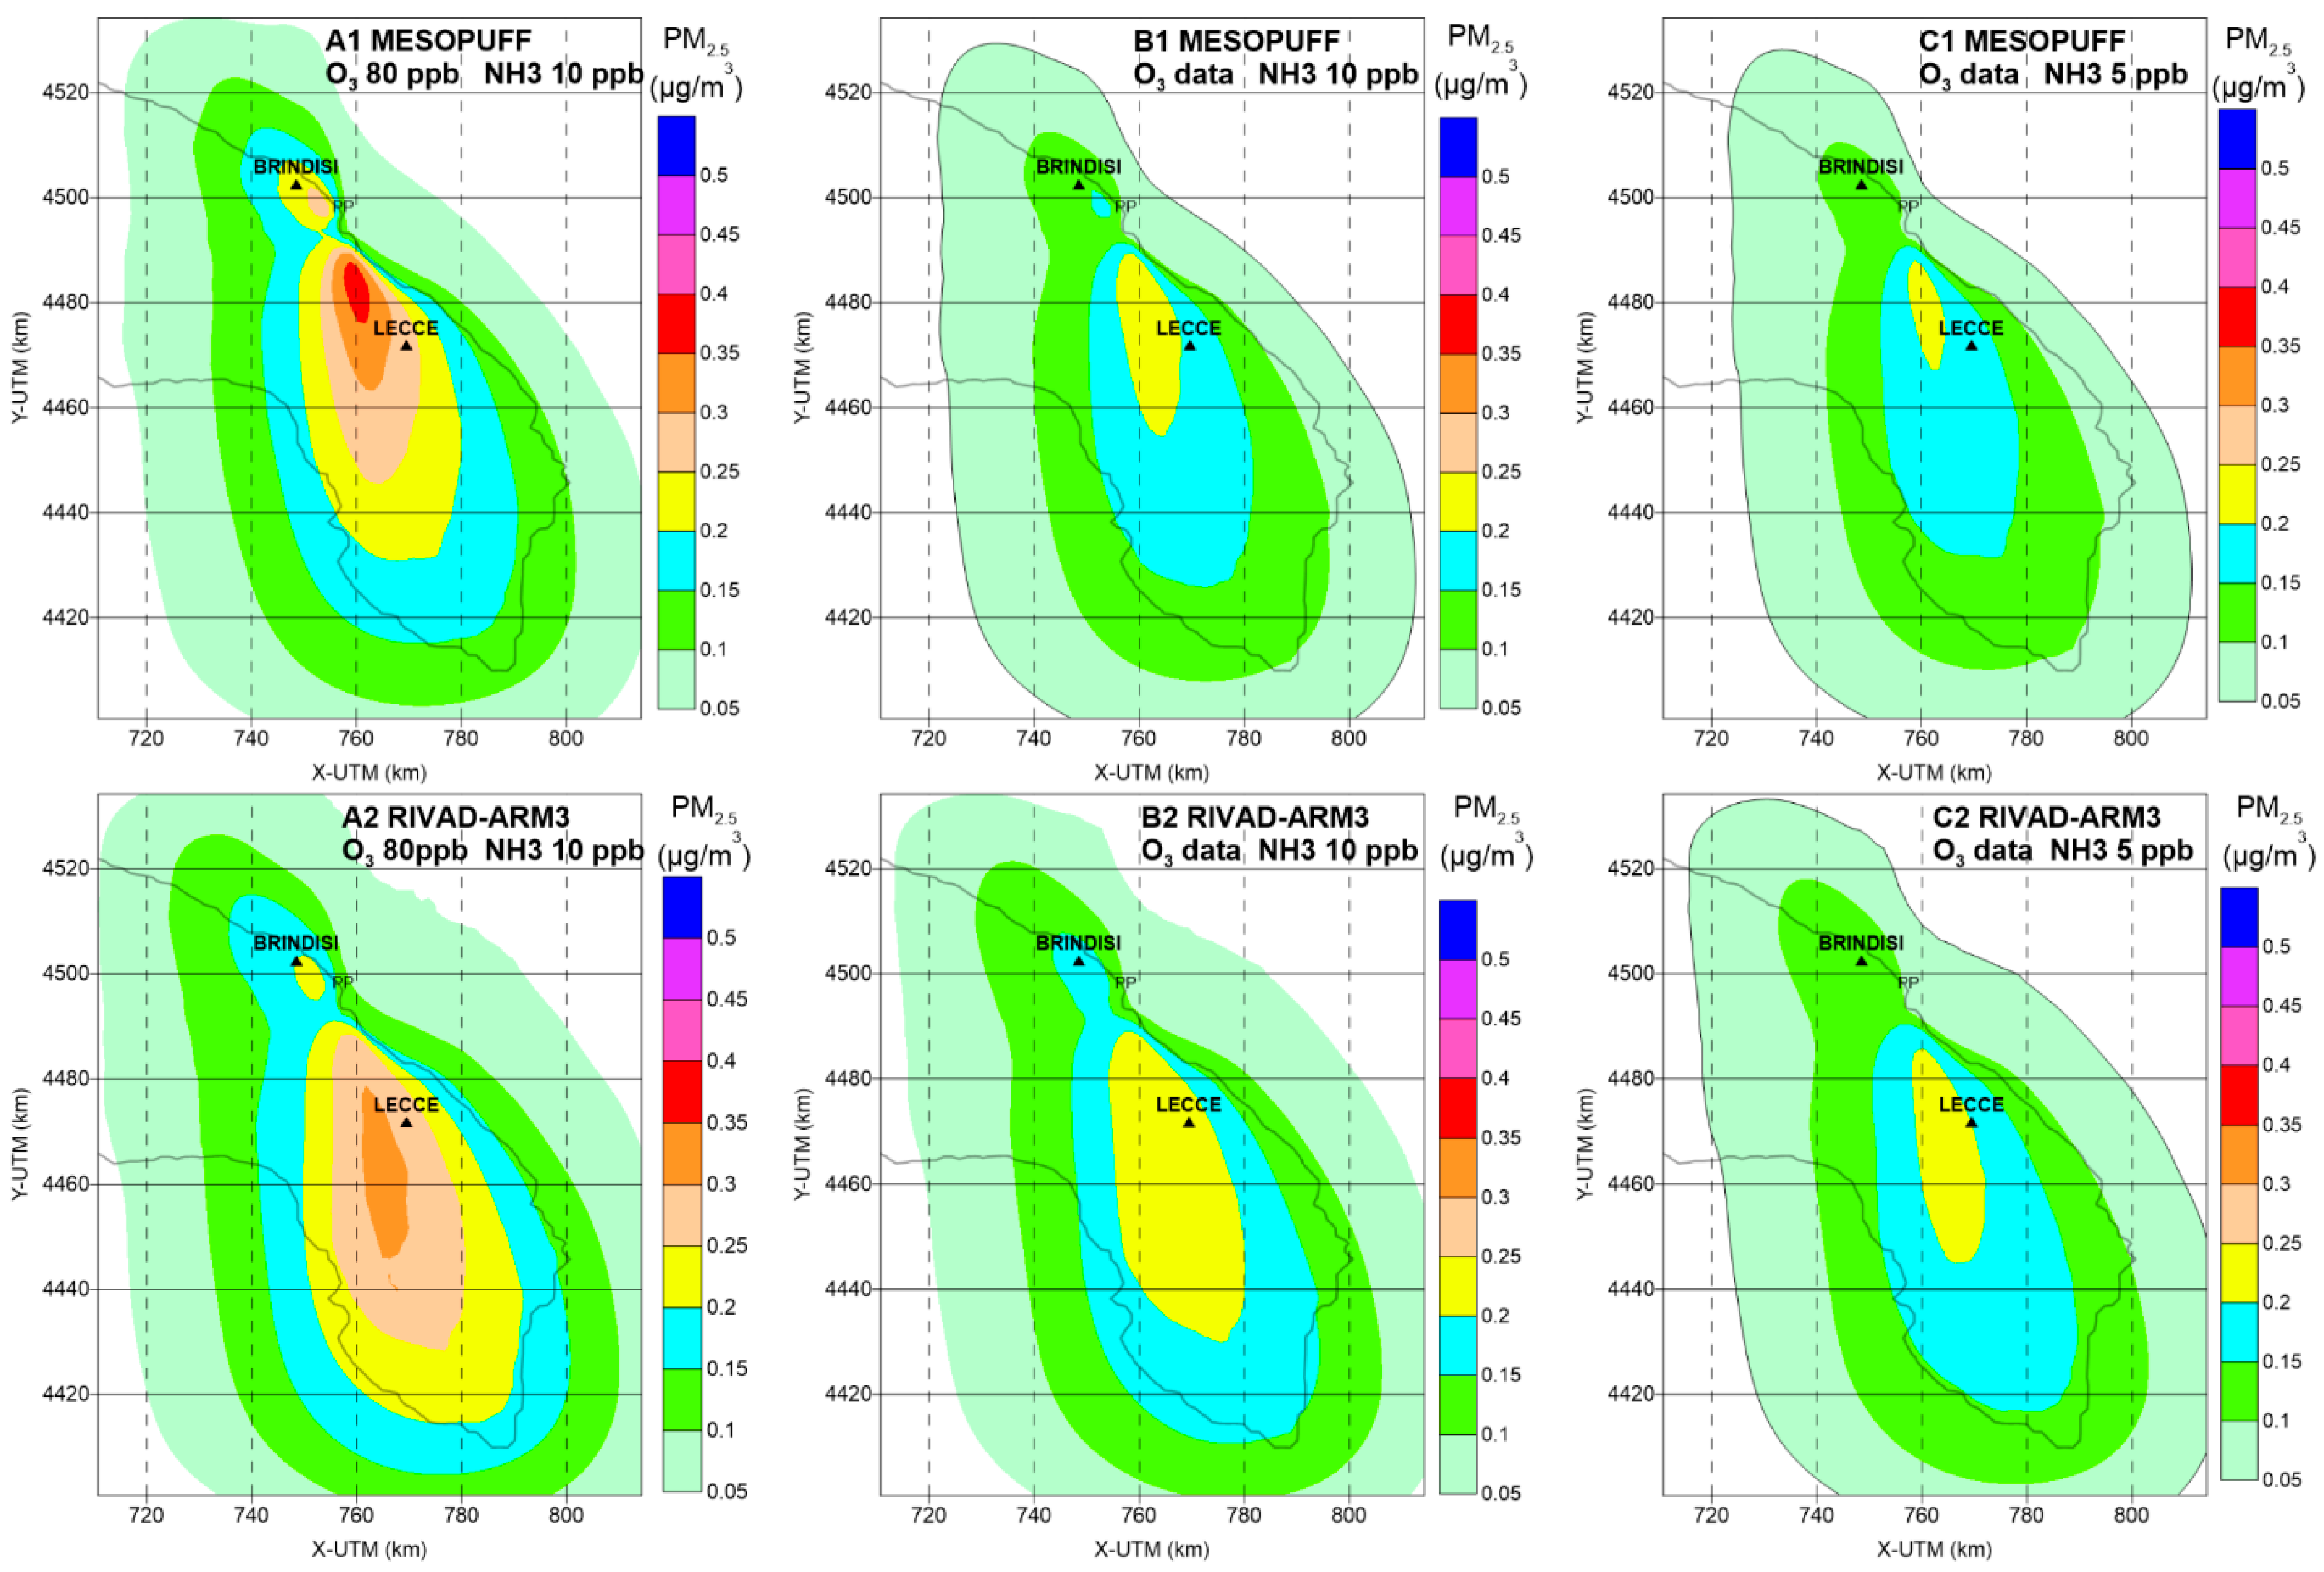
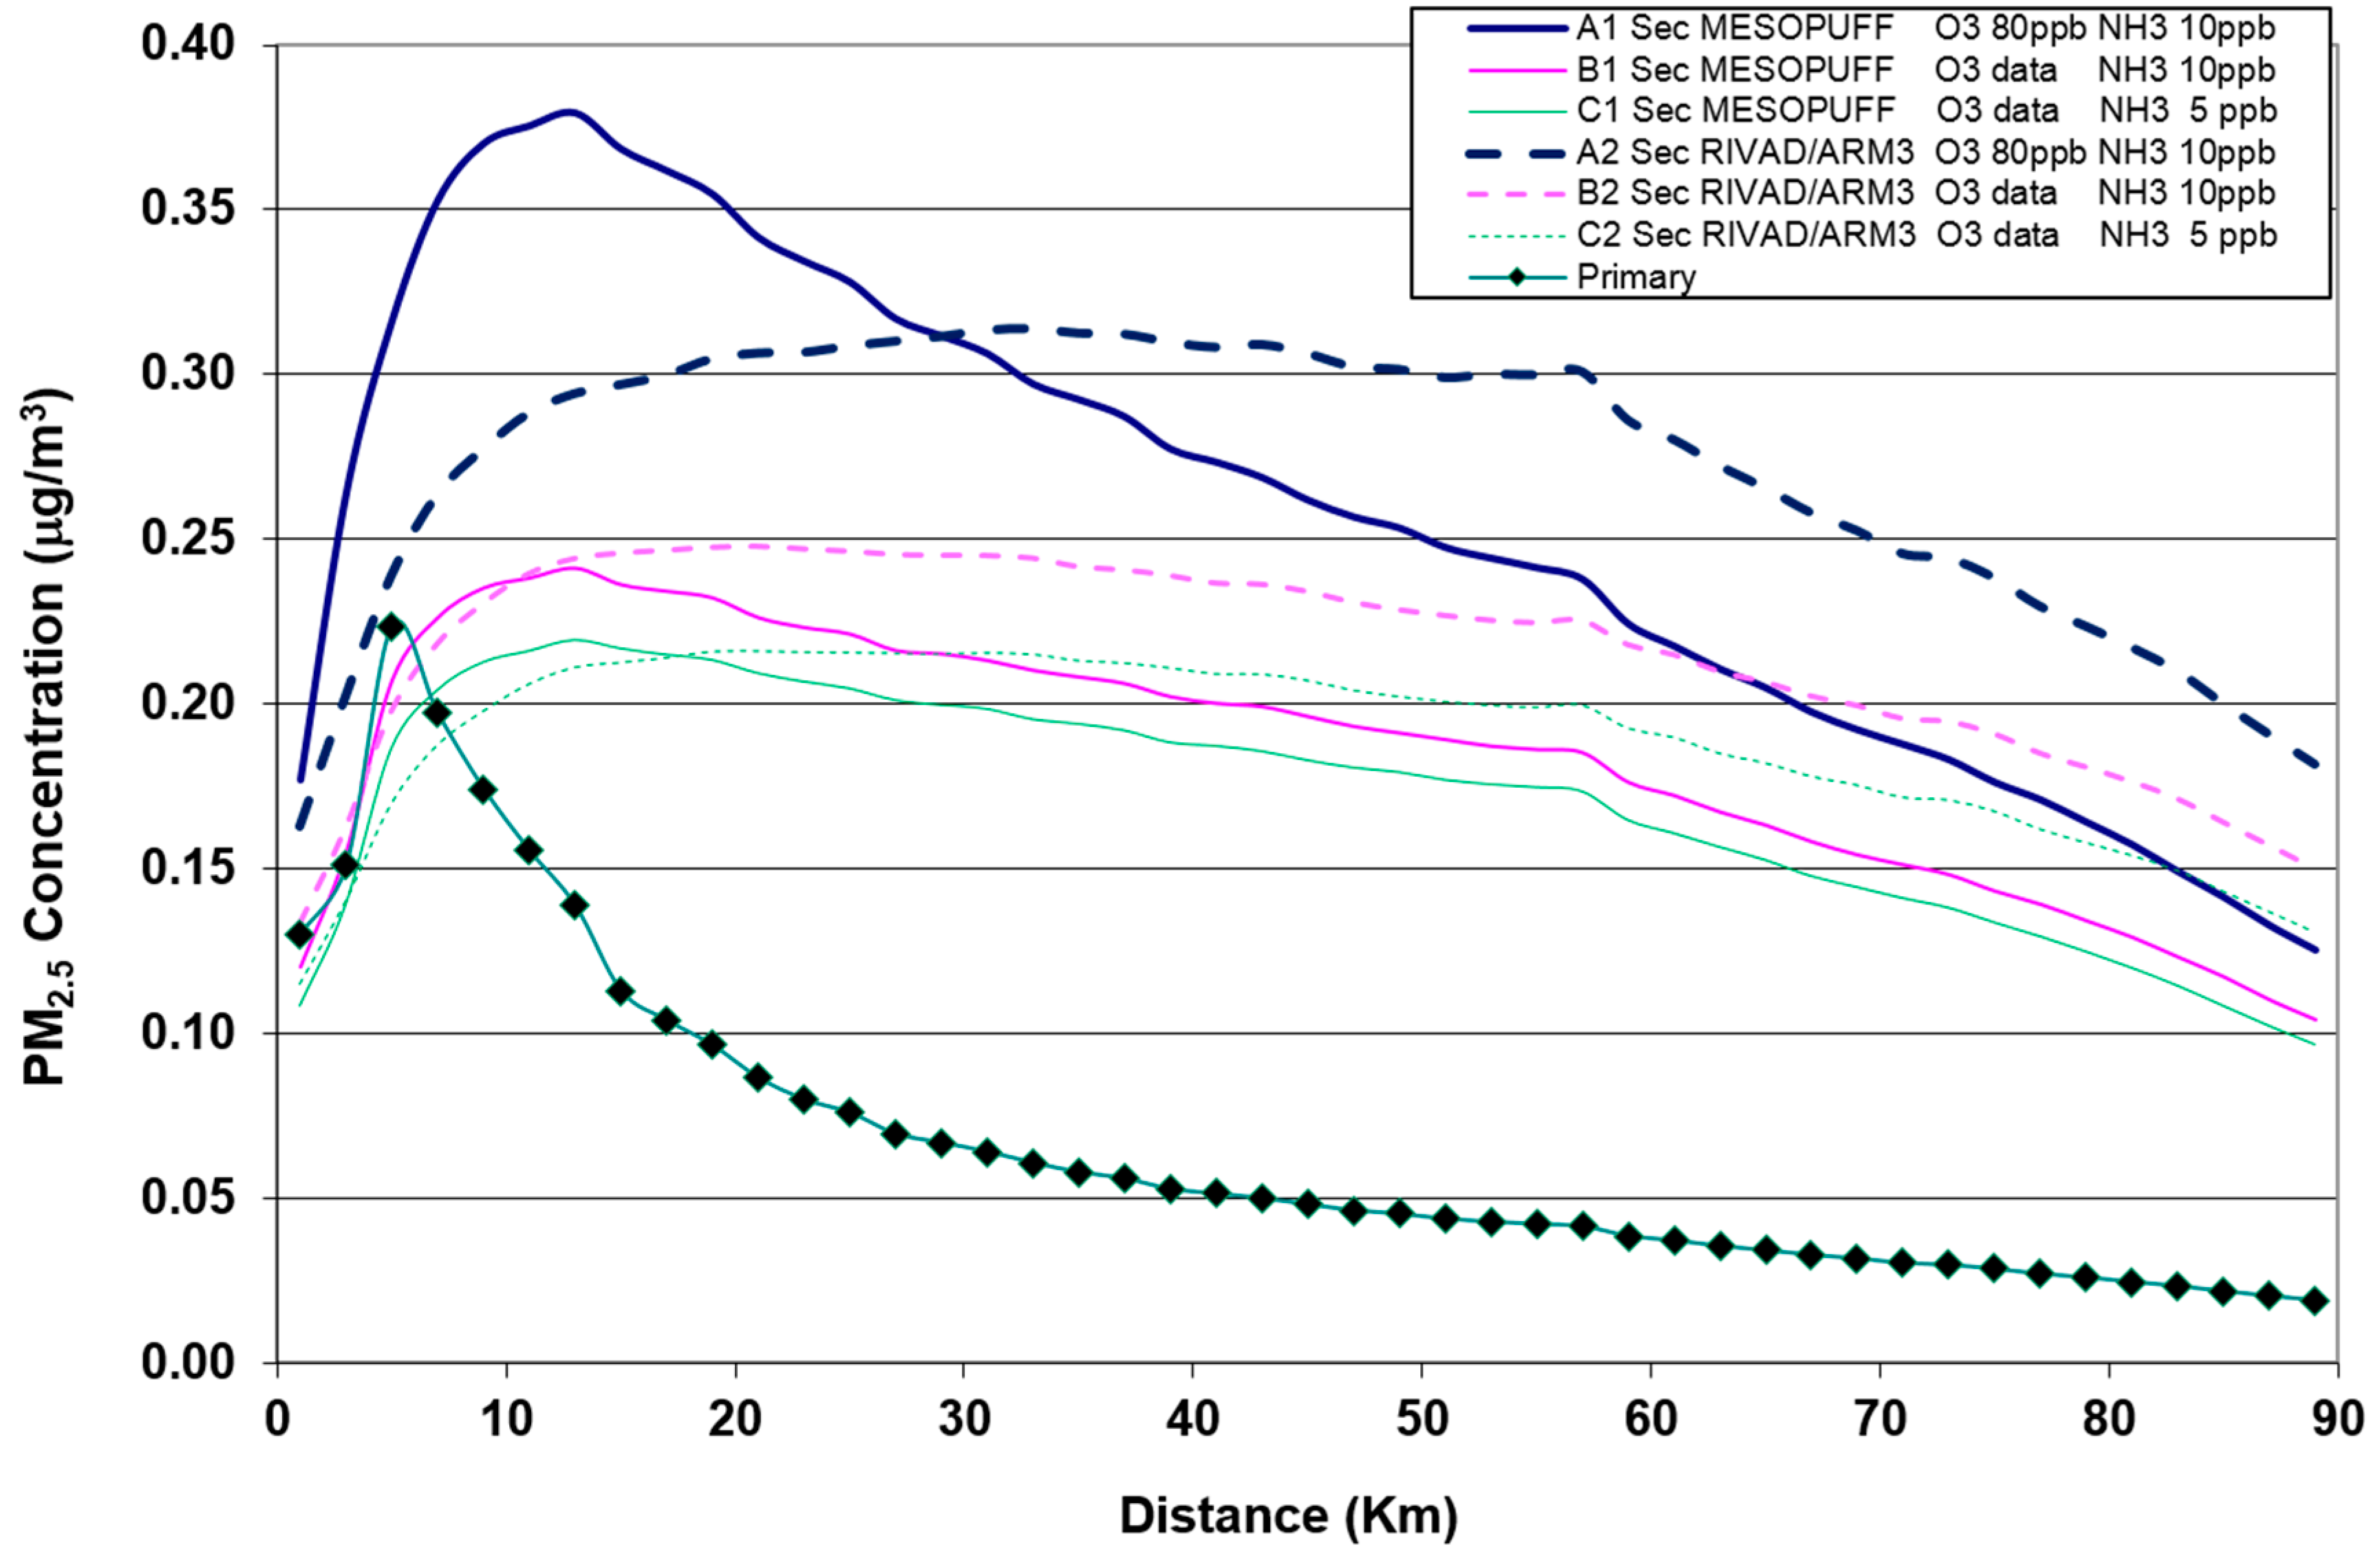
| Run | O3 (ppb) | NH3 (ppb) | Chemical Mechanism |
|---|---|---|---|
| A1 | 80 | 10 | MESOPUFF |
| B1 | Monitored data | 10 | MESOPUFF |
| C1 | Monitored data | 5 | MESOPUFF |
| A2 | 80 | 10 | RIVAD/ARM3 |
| B2 | Monitored data | 10 | RIVAD/ARM3 |
| C2 | Monitored data | 5 | RIVAD/ARM3 |
2.3. Health Impact
3. Results

| Run | Minimum (μg/m3) | Maximum (μg/m3) | Average (μg/m3) | Distance of the maximum from the source (Km) |
|---|---|---|---|---|
| Primary | 0.00 | 0.22 | 0.02 | 6 |
| A1 | 0.01 | 0.38 | 0.10 | 12 |
| B1 | 0.01 | 0.24 | 0.08 | 12 |
| C1 | 0.01 | 0.22 | 0.07 | 12 |
| A2 | 0.01 | 0.31 | 0.12 | 32 |
| B2 | 0.01 | 0.25 | 0.10 | 22 |
| C2 | 0.01 | 0.22 | 0.08 | 22 |
| Scenario | Absolute Number of Cases | 95% CI | Number of Cases per 100,000 Inhabitants | 95% CI | ||
|---|---|---|---|---|---|---|
| Lower | Upper | Lower | Upper | |||
| Primary PM2.5 | 4 | 1 | 7 | 0.4 | 0.1 | 0.6 |
| Secondary and primary PM2.5—run A1 | 26 | 9 | 41 | 2.2 | 0.7 | 3.4 |
| Secondary and primary PM2.5—run B1 | 20 | 7 | 31 | 1.7 | 0.6 | 2.6 |
| Secondary and primary PM2.5—run C1 | 19 | 6 | 30 | 1.6 | 0.5 | 2.5 |
| Secondary and primary PM2.5—run A2 | 28 | 10 | 44 | 2.4 | 0.8 | 3.7 |
| Secondary and primary PM2.5—run B2 | 23 | 8 | 37 | 2.0 | 0.7 | 3.1 |
| Secondary and primary PM2.5—run C2 | 21 | 7 | 33 | 1.8 | 0.6 | 2.8 |
4. Discussion
5. Conclusions
Acknowledgments
Author Contributions
Conflicts of Interest
Appendix A
Modelling System Options
References
- Spix, C.; Anderson, H.R.; Schwartz, J.; Vigotti, M.A.; LeTertre, A.; Vonk, J.M.; Touloumi, G.; Balducci, F.; Piekarski, T.; Bacharova, L.; et al. Short-term effects of air pollution on hospital admissions of respiratory diseases in Europe: A quantitative summary of APHEA study results. Air Pollution and Health: A European Approach. Arch. Environ. Health 1998, 53, 54–64. [Google Scholar] [CrossRef] [PubMed]
- Pope, C.A. Mortality effects of longer term exposures to fine particulate air pollution: Review of recent epidemiological evidence. Inhal. Toxicol. 2007, 19, 33–38. [Google Scholar] [CrossRef] [PubMed]
- Andersen, Z.J.; Olsen, T.S.; Andersen, K.K.; Loft, S.; Ketzel, M.; Raaschou-Nielsen, O. Association between short-term exposure to ultrafine particles and hospital admissions for stroke in Copenhagen, Denmark. Eur. Heart J. 2010, 31, 2034–2040. [Google Scholar] [CrossRef] [PubMed]
- Rückerl, R.; Schneider, A.; Breitner, S.; Cyrys, J.; Peters, A. Health effects of particulate air pollution: A review of epidemiological evidence. Inhal. Toxicol. 2011, 23, 555–592. [Google Scholar] [CrossRef] [PubMed]
- Cesaroni, G.; Badaloni, C.; Gariazzo, C.; Stafoggia, M.; Sozzi, R.; Davoli, M.; Forastiere, F. Long-term exposure to urban air pollution and mortality in a cohort of more than a million adults in Rome. Environ. Health Perspect. 2013, 121, 324–331. [Google Scholar] [CrossRef] [PubMed]
- Hoek, G.; Krishnan, R.M.; Beelen, R.; Peters, A.; Ostro, B.; Brunekreef, B.; Kaufman, J.D. Long-term air pollution exposure and cardio-respiratory mortality: A review. Environ. Health 2007, 12. [Google Scholar] [CrossRef] [PubMed]
- Beelen, R.; Raaschou-Nielsen, O.; Stafoggia, M.; Andersen, Z.J.; Weinmayr, G.; Hoffmann, B.; Wolf, K.; Samoli, E.; Fischer, P.; Nieuwenhuijsen, M.; et al. Effects of long-term exposure to air pollution on natural-cause mortality: An analysis of 22 European cohorts within the multicentre ESCAPE project. The Lancet 2014, 383, 785–795. [Google Scholar] [CrossRef]
- Pedersen, M.; Giorgis-Allemand, L.; Bernard, C.; Aguilera, I.; Andersen, A.M.; Ballester, F.; Beelen, R.M.; Chatzi, L.; Cirach, M.; Danileviciute, A.; et al. Ambient air pollution and low birthweight: A European cohort study (ESCAPE). Lancet Respir. Med. 2013, 1, 695–704. [Google Scholar] [CrossRef]
- Ha, S.; Hu, H.; Roussos-Ross, D.; Haidong, K.; Roth, J.; Xu, X. The effects of air pollution on adverse birth outcomes. Environ. Res. 2014. [Google Scholar] [CrossRef] [PubMed]
- Vrijheid, M.; Martinez, D.; Manzanares, S.; Dadvand, P.; Schembari, A.; Rankin, J.; Nieuwenhuijsen, M. Ambient air pollution and risk of congenital anomalies: A systematic review and meta-analysis. Environ. Health Perspect. 2011, 119, 598–606. [Google Scholar] [CrossRef] [PubMed]
- Chen, E.K.; Zmirou-Navier, D.; Padilla, C.; Deguen, S. Effects of air pollution on the risk of congenital anomalies: A systematic review and meta-analysis. Int. J. Environ. Res. Public Health 2014, 11, 7642–7668. [Google Scholar] [CrossRef] [PubMed]
- Nieuwenhuijsen, M.J.; Dadvand, P.; Grellier, J.; Martinez, D.; Vrijheid, M. Environmental risk factors of pregnancy outcomes: A summary of recent meta-analyses of epidemiological studies. Environ. Health 2013. [Google Scholar] [CrossRef] [PubMed]
- Gorini, F.; Chiappa, E.; Gargani, L.; Picano, E. Potential effects of environmental chemical contamination in congenital heart disease. Pediatr. Cardiol. 2014. [Google Scholar] [CrossRef] [PubMed]
- Hamra, G.B.; Guha, N.; Cohen, A.; Laden, F.; Raaschou-Nielsen, O.; Samet, J.M.; Vineis, P.; Forastiere, F.; Saldiva, P.; Yorifuji, T.; Loomis, D. Outdoor particulate matter exposure and lung cancer: A systematic review and meta-analysis. Environ. Health Perspect. 2014, 122, 906–911. [Google Scholar] [PubMed]
- Seinfeld, J.H.; Pandis, S.N. Atmospheric Chemistry and Physics: From Air Pollution to Climate Change, 2nd ed.; Wiley: New York, NY, USA, 2006. [Google Scholar]
- Franklin, M.; Koutrakis, P.; Schwartz, J. The role of particle composition on the association between PM2.5 and mortality. Epidemiology 2008, 19, 680–689. [Google Scholar] [CrossRef] [PubMed]
- Ostro, B.; Tobias, A.; Querol, X.; Alastuey, A.; Amato, F.; Pey, J.; Pérez, N.; Sunyer, J. The effects of particulate matter sources on daily mortality: A case-crossover study of Barcelona, Spain. Environ. Health Perspect. 2011, 119, 1781–1787. [Google Scholar] [CrossRef] [PubMed]
- Ostro, B.M.; Lipsett, P.; Reynolds, D.; Goldberg, A.; Hertz, C.; Garcia, K.; Henderson, D.; Bernstein, L. Long-term exposure to constituents of fine particulate air pollution and mortality: Results from the California Teachers Study. Environ. Health Perspect. 2010, 118, 363–369. [Google Scholar] [CrossRef] [PubMed]
- Brock, C.A.; Washenfelder, R.A.; Trainer, M.; Ryerson, T.B.; Wilson, J.C.; Reeves, J.M.; Huey, L.G.; Holloway, J.S.; Parrish, D.D.; Hubler, G.; Fehsenfeld, F.C. Particle growth in the plumes of coal-fired power plants. J. Geophys. Res. 2002, 107. [Google Scholar] [CrossRef]
- Bickel, P.; Friedrich, R. ExternE—Externalities of Energy—Methodology 2005 Update; Office for Official Publications of the European Communities: Luxemburg, Luxemburg, 2005. [Google Scholar]
- Lopez, M.T.; Zuk, M.; Garibay, V.; Tzintzun, G.; Iniestra Fernandez, A. Health impacts from power plant emissions in Mexico. Atmos. Environ. 2005, 39, 1199–1209. [Google Scholar] [CrossRef]
- NACAA (National Association of Clean Air Agencies). PM2.5 Modeling Implementation for Projects Subject to National Ambient Air Quality Demonstration Requirements Pursuant to New Source Review. Report from NACAA PM2.5 Modeling Implementation Workgroup. 2011. Available online: http://www.epa.gov/ttn/scram/10thmodconf/review_material/01072011-NACAAPM2.5ModelingWorkgroupReport-FINAL.pdf (accessed on 29 June 2015).
- US EPA (Unites States Environment Protection Agency). Guidance for PM2.5 Permit Modeling EPA-454/B-14-001; Office of Air Quality Planning and Standards, Air Quality Assessment Division: Research Triangle Park, NC, USA, 2014; pp. 1–144. [Google Scholar]
- Levy, J.I.; Spengler, J.D.; Hlinka, D.; Sullivan, D.; Moon, D. Using Calpuff to evaluate the impacts of power plant emissions in Illinois: Model sensitivity and implications. Atmos. Environ. 2002, 36, 1063–1075. [Google Scholar] [CrossRef]
- Li, Y.R.; MacDonald Gibson, J. Health and air quality benefits of policies to reduce coal-fired power plant emissions: A case study in North Carolina. Environ. Sci. Technol. 2014, 48, 10019–10027. [Google Scholar] [CrossRef] [PubMed]
- Guerra, S.A.; Olsen, S.R.; Anderson, J.J. Evaluation of the SO2 and NOX offset ratio method to account for secondary PM2.5 formation. J. Air Waste Manag. Assoc. 2014, 64, 265–271. [Google Scholar] [CrossRef] [PubMed]
- Ministero dell’Ambiente e della Tutela del Territorio e del Mare. Parere istruttorio centrale termoelettrica ENEL di Brindisi. 2012. Available online: aia.minambiente.it/DettaglioAutorizzazionePub.aspx?id=4985 (accessed on 10 June 2015).
- ARPA Puglia. Le emissioni industriali in Puglia. 2009. Available online: www.arpa.puglia.it/web/guest/feedrss/-/journal_content/56/10125/76762 (accessed on 10 June 2015).
- Mangia, C.; Bruni, A.; Cervino, M.; Gianicolo, E.A.L. Sixteen-year air quality data analysis of a high environmental risk area in Southern Italy. Environ. Monit. Assess. 2011, 183, 555–570. [Google Scholar] [CrossRef] [PubMed]
- ISTAT. Data on Resident Population in the Italian Municipalities. 2014. Available online: http://demo.istat.it/index_e.html (accessed on 25 November 2014).
- Gianicolo, E.A.L.; Mangia, C.; Cervino, M.; Bruni, A.; Andreassi, M.G.; Latini, G. Congenital anomalies among live births in a high environmental risk area—A case-control study in Brindisi (southern Italy). Environ. Res. 2014, 128, 9–14. [Google Scholar] [CrossRef] [PubMed]
- Gianicolo, E.A.L.; Bruni, A.; Mangia, C.; Cervino, M.; Vigotti, M.A. Acute effects of urban and industrial pollution in a government-designated “Environmental risk area”: The case of Brindisi, Italy. Int. J. Environ. Health Res. 2013, 23, 446–460. [Google Scholar] [CrossRef] [PubMed]
- Scire, J.S.; Stimatis, D.G.; Yamartino, R. CALPUFF Modeling System Version 6 User Instructions; Earth Tech, Inc.: Johnstown, PA, USA, 2000. [Google Scholar]
- Unites States Environment Protection Agency (US EPA). Documentation of the Evaluation of Calpuff and Other Long Range Transport Models Using Tracer Field Experiment Data EPA 454/R-12-003. 2012. Available online: http://www.epa.gov/scram001/reports/EPA-454_R-12-003.pdf (accessed on 9 May 2015). [Google Scholar]
- Levy, J.I.; Wilson, A.M.; Evans, J.S.; Spengler, J.D. Estimation of primary and secondary particulate matter intake fractions for power plants in Georgia. Environ. Sci. Technol. 2003, 37, 5528–5536. [Google Scholar] [CrossRef] [PubMed]
- MacIntosh, D.L.; Stewart, J.H.; Myatt, T.A.; Sabato, J.E.; Flowers, G.C.; Brown, K.W.; Hlinka, D.J.; Sullivan, D.A. Use of CALPUFF for exposure assessment in a near-field, complex terrain setting. Atmos. Environ. 2010, 44, 262–270. [Google Scholar] [CrossRef]
- Zhou, Y.; Levy, J.I.; Hammitt, J.K.; Evans, J.S. Estimating population exposure to power plant emissions using Calpuff: A case study in Beijing, China. Atmos. Environ. 2003, 37, 815–826. [Google Scholar] [CrossRef]
- Mangia, C.; Cervino, M.; Gianicolo, E.A.L. Dispersion models and air quality data for population exposure assessment to air pollution. Int. J. Environ. Pollut. 2014, 54, 119–127. [Google Scholar] [CrossRef]
- Schipa, I.; Tanzirella, A.; Mangia, C. Differences between weekend and weekday ozone levels over rural and urban sites in Southern Italy. Environ. Monit. Assess. 2009, 156, 509–523. [Google Scholar] [CrossRef] [PubMed]
- Adar, S.D.; Filigrana, P.A.; Clements, N.; Peel, J.L. Ambient coarse particulate matter and human health: A systematic review and meta-analysis. Curr. Environ. Health Rep. 2014, 1, 258–274. [Google Scholar] [CrossRef] [PubMed]
- Shang, Y.; Sun, Z.; Cao, J.; Wang, X.; Zhong, L.; Bi, X.; Li, H.; Liu, W; Zhu, T.; Huang, W. Systematic review of Chinese studies of short-term exposure to air pollution and daily mortality. Environ. Int. 2013, 54, 100–111. [Google Scholar] [CrossRef] [PubMed]
- Chen, H.; Goldberg, M.S.; Villeneuve, P.J. A systematic review of the relation between long-term exposure to ambient air pollution and chronic diseases. Rev. Environ. Health 2008, 23, 243–297. [Google Scholar] [PubMed]
- Künzli, N.; Kaiser, R.; Medina, S.; Studnicka, M.; Oberfeld, G.; Horak, F., Jr. Health costs due to road traffic-related air pollution: An impact assessment project of Austria, France and Switzerland. (Air pollution attributable cases Technical report on epidemiology) Federal Department for Environment, Energy and Communications Bureau for Transport Studies: Bern, Switzerland, 1999. [Google Scholar]
- ARPA Puglia. Relazione sullo Stato dell'Ambiente. 2011. Available online: www.arpa.puglia.it/web/guest/rsa2011 (accessed on 25 March 2014).
- ISTAT. National Survey on Mortality Causes. 2012. Available online: www.istat.it/it/archivio/58063 (accessed on 25 November 2014).
- Capiaghi, V. Ammoniaca in Atmosfera in Lombardia. Confronto tra stima modellistica e risultanze analitiche. 2013. Available online: www.politesi.polimi.it/handle/10589/88130?locale=it (accessed on 25 May 2015).
- Buonocore, J.J.; Dong, X.; Spengler, J.D.; Fu, J.S.; Levy, J.I. Using the Community Multiscale Air Quality (CMAQ) model to estimate public health impacts of PM2.5 from individual power plants. Environ. Int. 2014, 68, 200–208. [Google Scholar] [CrossRef] [PubMed]
- Lepeule, J.; Laden, F.; Dockery, D.W.; Schwartz, J.D. Chronic exposure to fine particles and mortality: An extended follow-up of the Harvard Six Cities study from 1974 to 2009. Environ. Health Perspect. 2012, 120, 965–970. [Google Scholar] [CrossRef] [PubMed]
© 2015 by the authors; licensee MDPI, Basel, Switzerland. This article is an open access article distributed under the terms and conditions of the Creative Commons Attribution license (http://creativecommons.org/licenses/by/4.0/).
Share and Cite
Mangia, C.; Cervino, M.; Gianicolo, E.A.L. Secondary Particulate Matter Originating from an Industrial Source and Its Impact on Population Health. Int. J. Environ. Res. Public Health 2015, 12, 7667-7681. https://doi.org/10.3390/ijerph120707667
Mangia C, Cervino M, Gianicolo EAL. Secondary Particulate Matter Originating from an Industrial Source and Its Impact on Population Health. International Journal of Environmental Research and Public Health. 2015; 12(7):7667-7681. https://doi.org/10.3390/ijerph120707667
Chicago/Turabian StyleMangia, Cristina, Marco Cervino, and Emilio Antonio Luca Gianicolo. 2015. "Secondary Particulate Matter Originating from an Industrial Source and Its Impact on Population Health" International Journal of Environmental Research and Public Health 12, no. 7: 7667-7681. https://doi.org/10.3390/ijerph120707667
APA StyleMangia, C., Cervino, M., & Gianicolo, E. A. L. (2015). Secondary Particulate Matter Originating from an Industrial Source and Its Impact on Population Health. International Journal of Environmental Research and Public Health, 12(7), 7667-7681. https://doi.org/10.3390/ijerph120707667