1. Introduction
Growth is a multifaceted process where increases in body size lead to morphological and functional changes. This process is determined by biological factors that show a high degree of sensitivity to environmental stimuli which tempers the expression of genetic potential [
1,
2]. As a result, sizeable variation across populations in growth patterns exists [
3].
There is a general consensus that child growth is a putative health and nutrition marker of quality of life [
4,
5] and, therefore, monitoring growth is an important public health task. In 2006, the World Health Organization (WHO) published normative centile charts [
6] based on data from the multicentre growth reference study including highly selective samples of infants and native children from Davis (United States), Accra (Ghana), Muscat (Oman), Oslo (Norway), Pelotas (Brazil), and Delhi (India). Notwithstanding the importance of international standards, data from local samples seem to be more informative [
7,
8,
9] and centile curves for height and body mass have been published in central and south America, namely in Argentina [
10], Bolivia [
11], Brazil [
12,
13,
14], Cuba [
15] and Venezuela [
16].
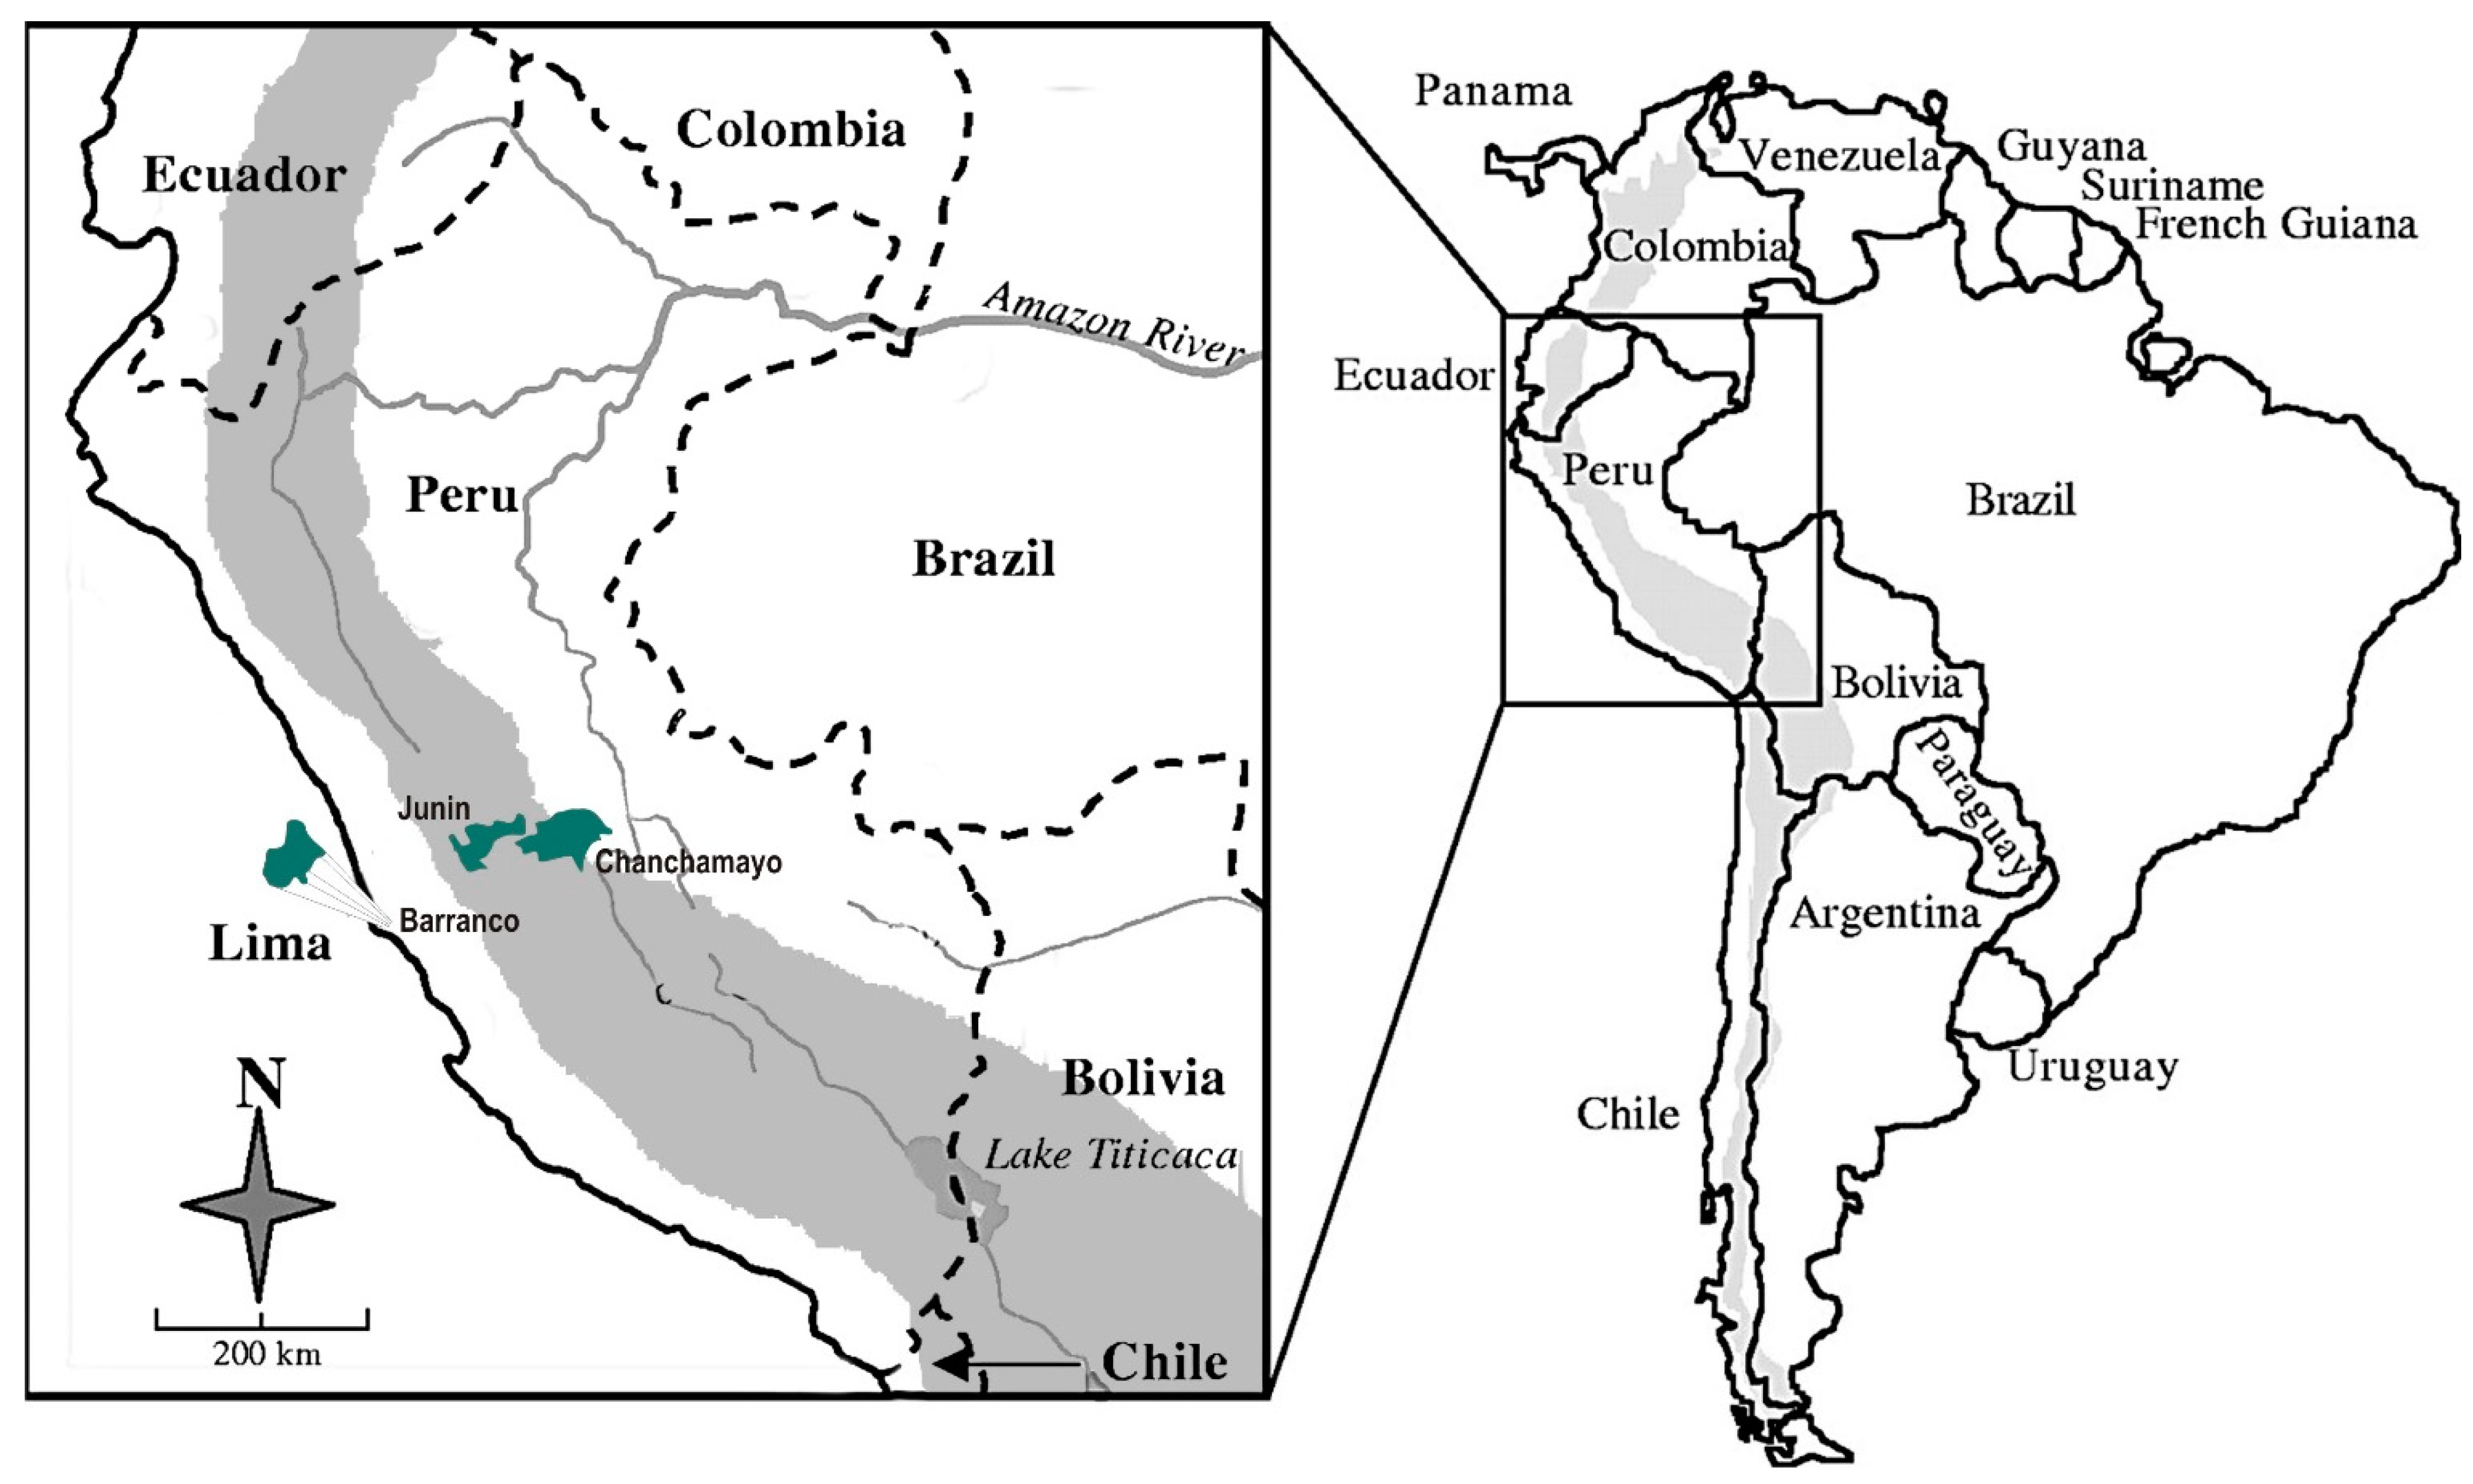
To the best of our knowledge no national charts for height, body mass, body mass index (BMI) and waist circumference (WC) are available in Peru. Peru is a country on the central western coast of South America facing the Pacific Ocean with a territorial surface of 1.3 million km
2, 28 million inhabitants and a population density of 23.5 inhabitants per km
2. This large territory represents a wide range of geographic, socio-economic, ethnic and cultural conditions [
17]. For simplicity, Peru can be described as having three natural regions: coast, mountain and jungle. The Peruvian population includes descendants of Amerindians, European-Spanish, Afro-Americans, Chinese, and a mixture of these groups. According to the recent classification of the International Monetary Fund, Peru belongs to a class of emerging and developing economies with a Human Development Index (HDI) of 0.74 and a life expectancy at birth of 74.2 years [
17,
18].
Since there is no proper substitute for a country having its own child growth reference data and no national growth centile charts are available in Peru, the purpose of this study was twofold: (1) to provide centile charts for height, body mass, BMI and WC for school-children, aged 4–17 years, from the central Peruvian region; and (2) to compare Peruvian data with the North-American [
19,
20] and Argentina [
10,
21,
22] references.
3. Results
Age- and gender-specific values for the 3rd, 10th, 25th, 50th, 75th, 90th, and 97th centiles are presented in
Figure 2 and
Table 4 and
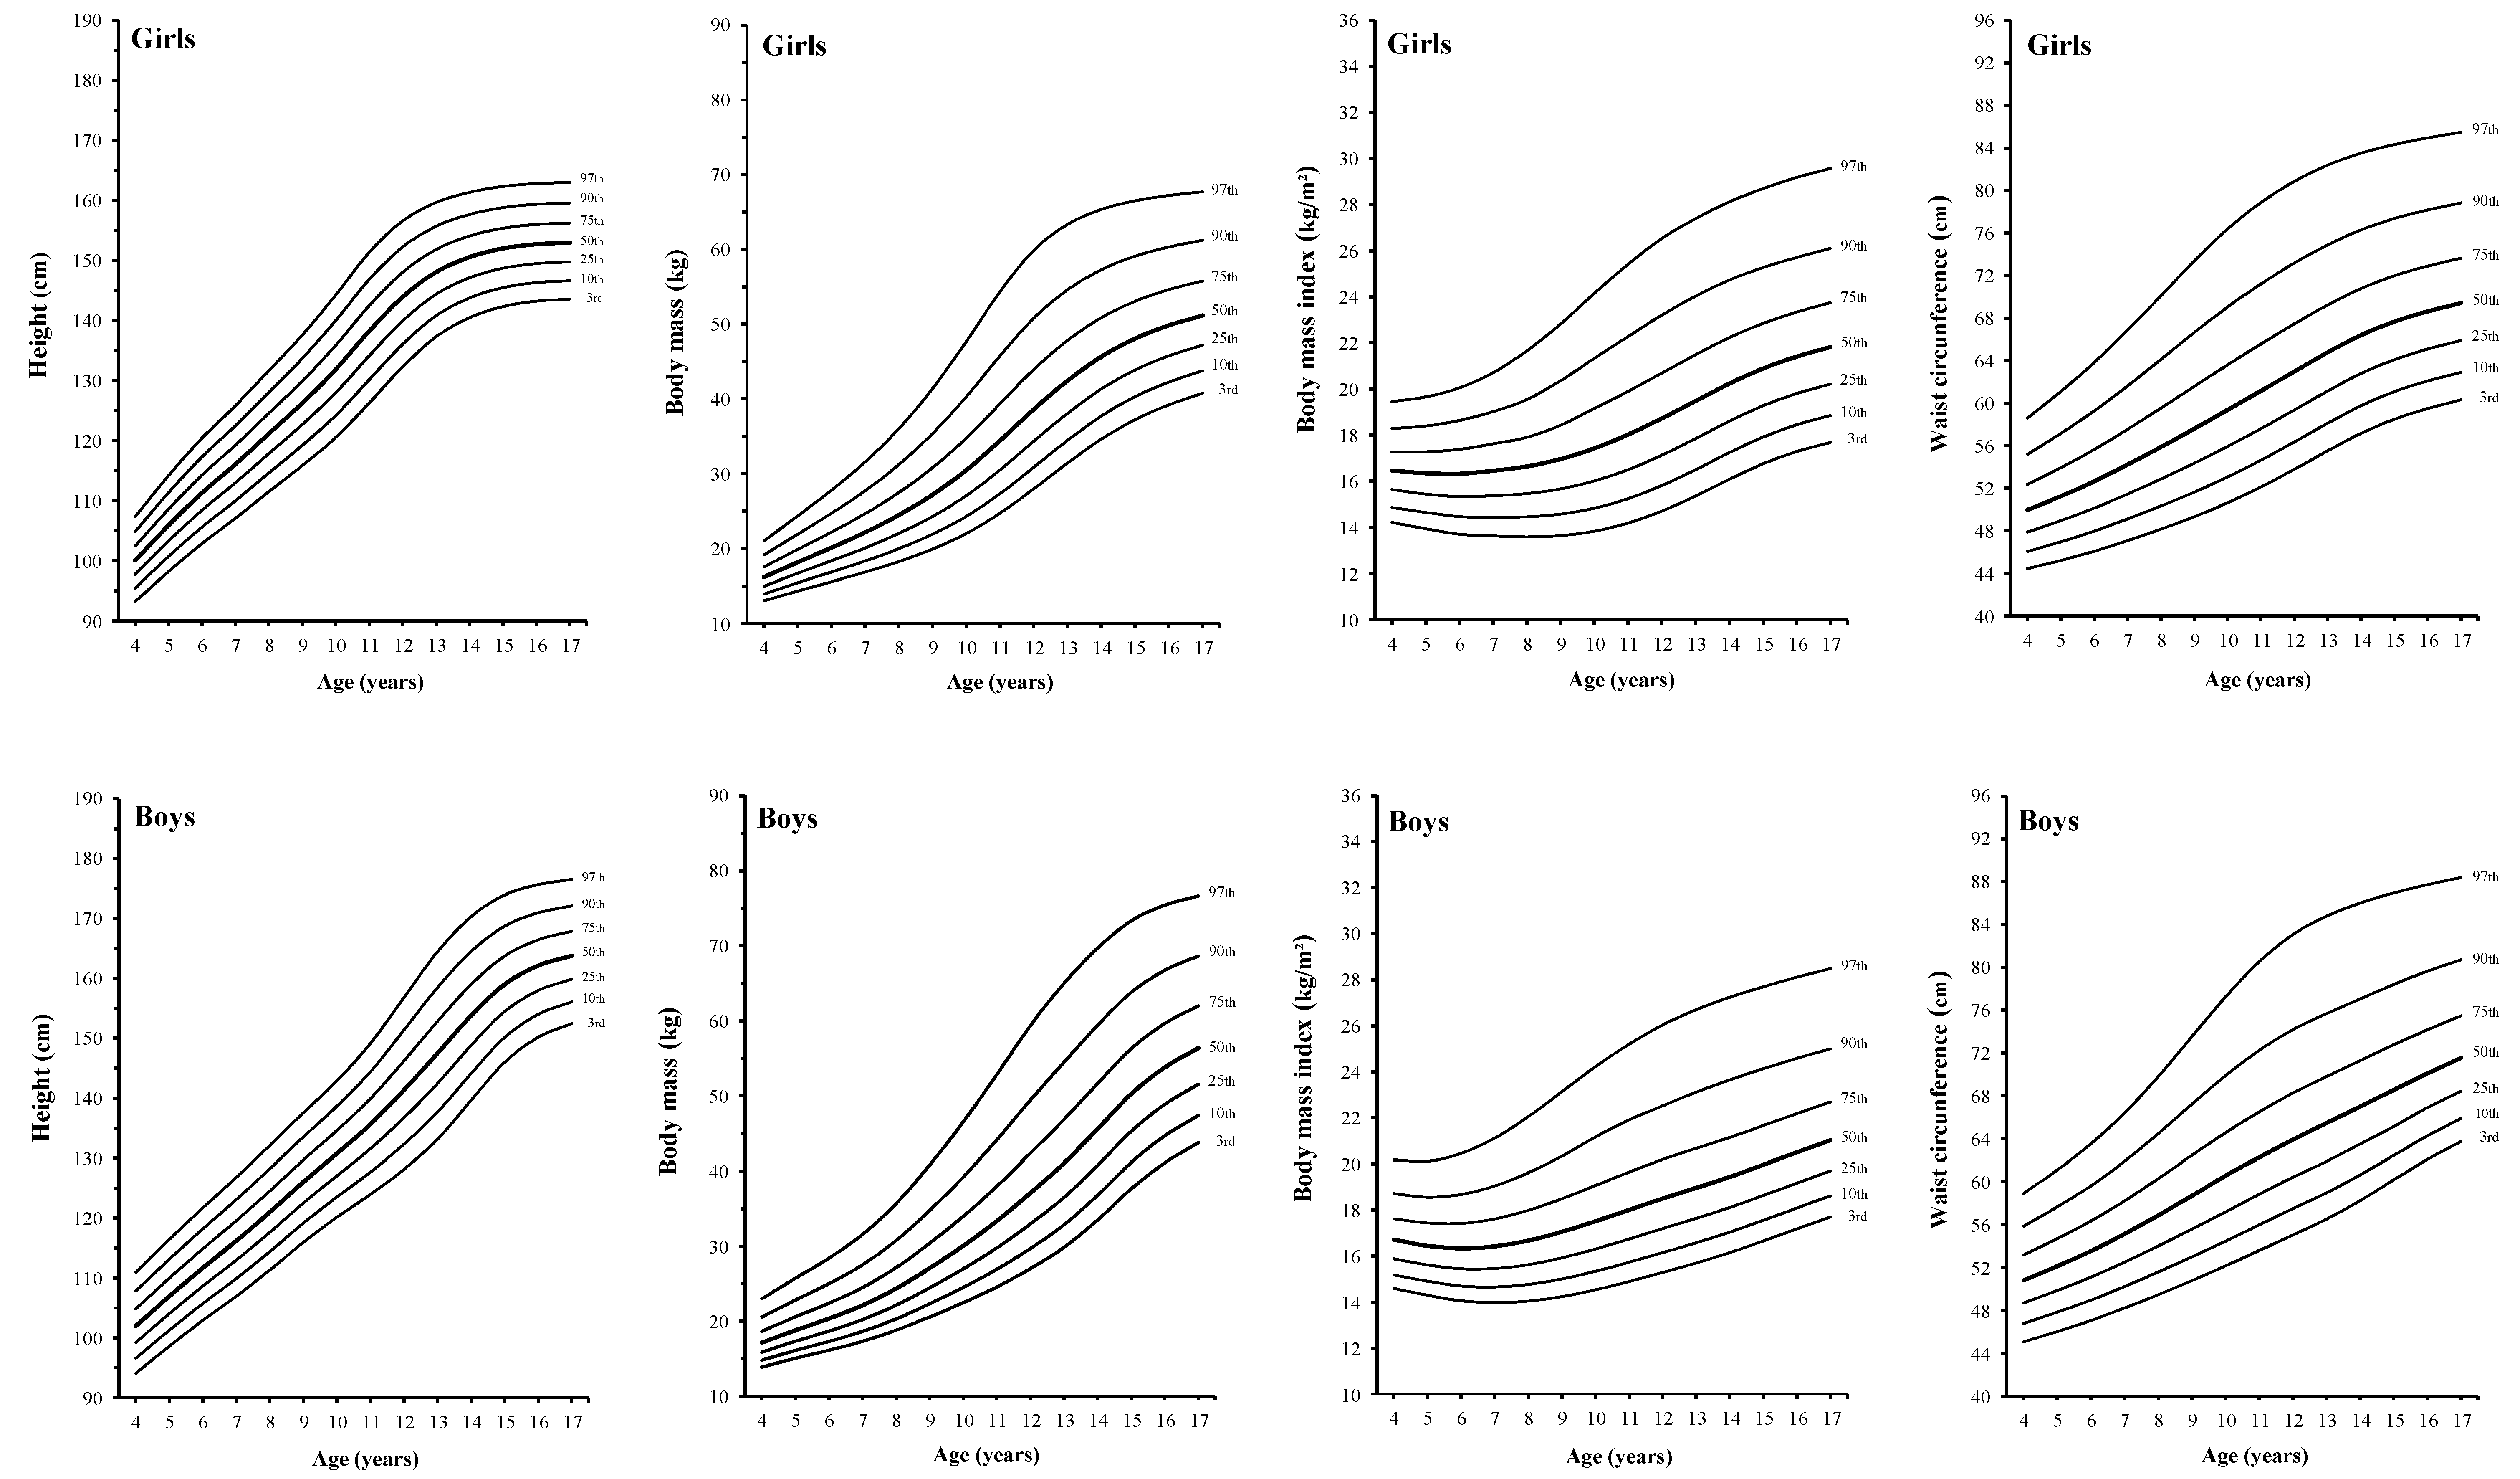
Table 5. The medians for height increase linearly from 4 to 14 years in boys and from 4 to 11 years in girls, and gradually level off, reaching a value of 165 cm in boys and 153 cm in girls. The increase is higher in boys than in girls. The P50 values for body mass increase curvilinearly from 4 years of age onward; the increase is stepper from 11 to 14 years in boys and from 9 to 11 years in girls. Maximum values are achieved at 17 years for girls (52.3 kg) and boys (58.5 kg).
Smoothed centiles for BMI and WC are presented in
Figure 2 and
Table 5. The BMI shows a decline from 4 to 6 years of age and then increases linearly in boys and curvilinearly in girls. At 17 years of age, the BMI of boys and girls are 22.2 kg/m
2 and 21.5 kg/m
2, respectively. The variability increases with increasing age. As for the BMI, the P50 values for WC increase linearly in boys and curvilinearly in girls through 4 to 17 years of age. The median for WC at 17 years old is 72.8 cm in boys and 70.1 cm in girls. Variability of WC also increases with age and is higher at 17 years old.
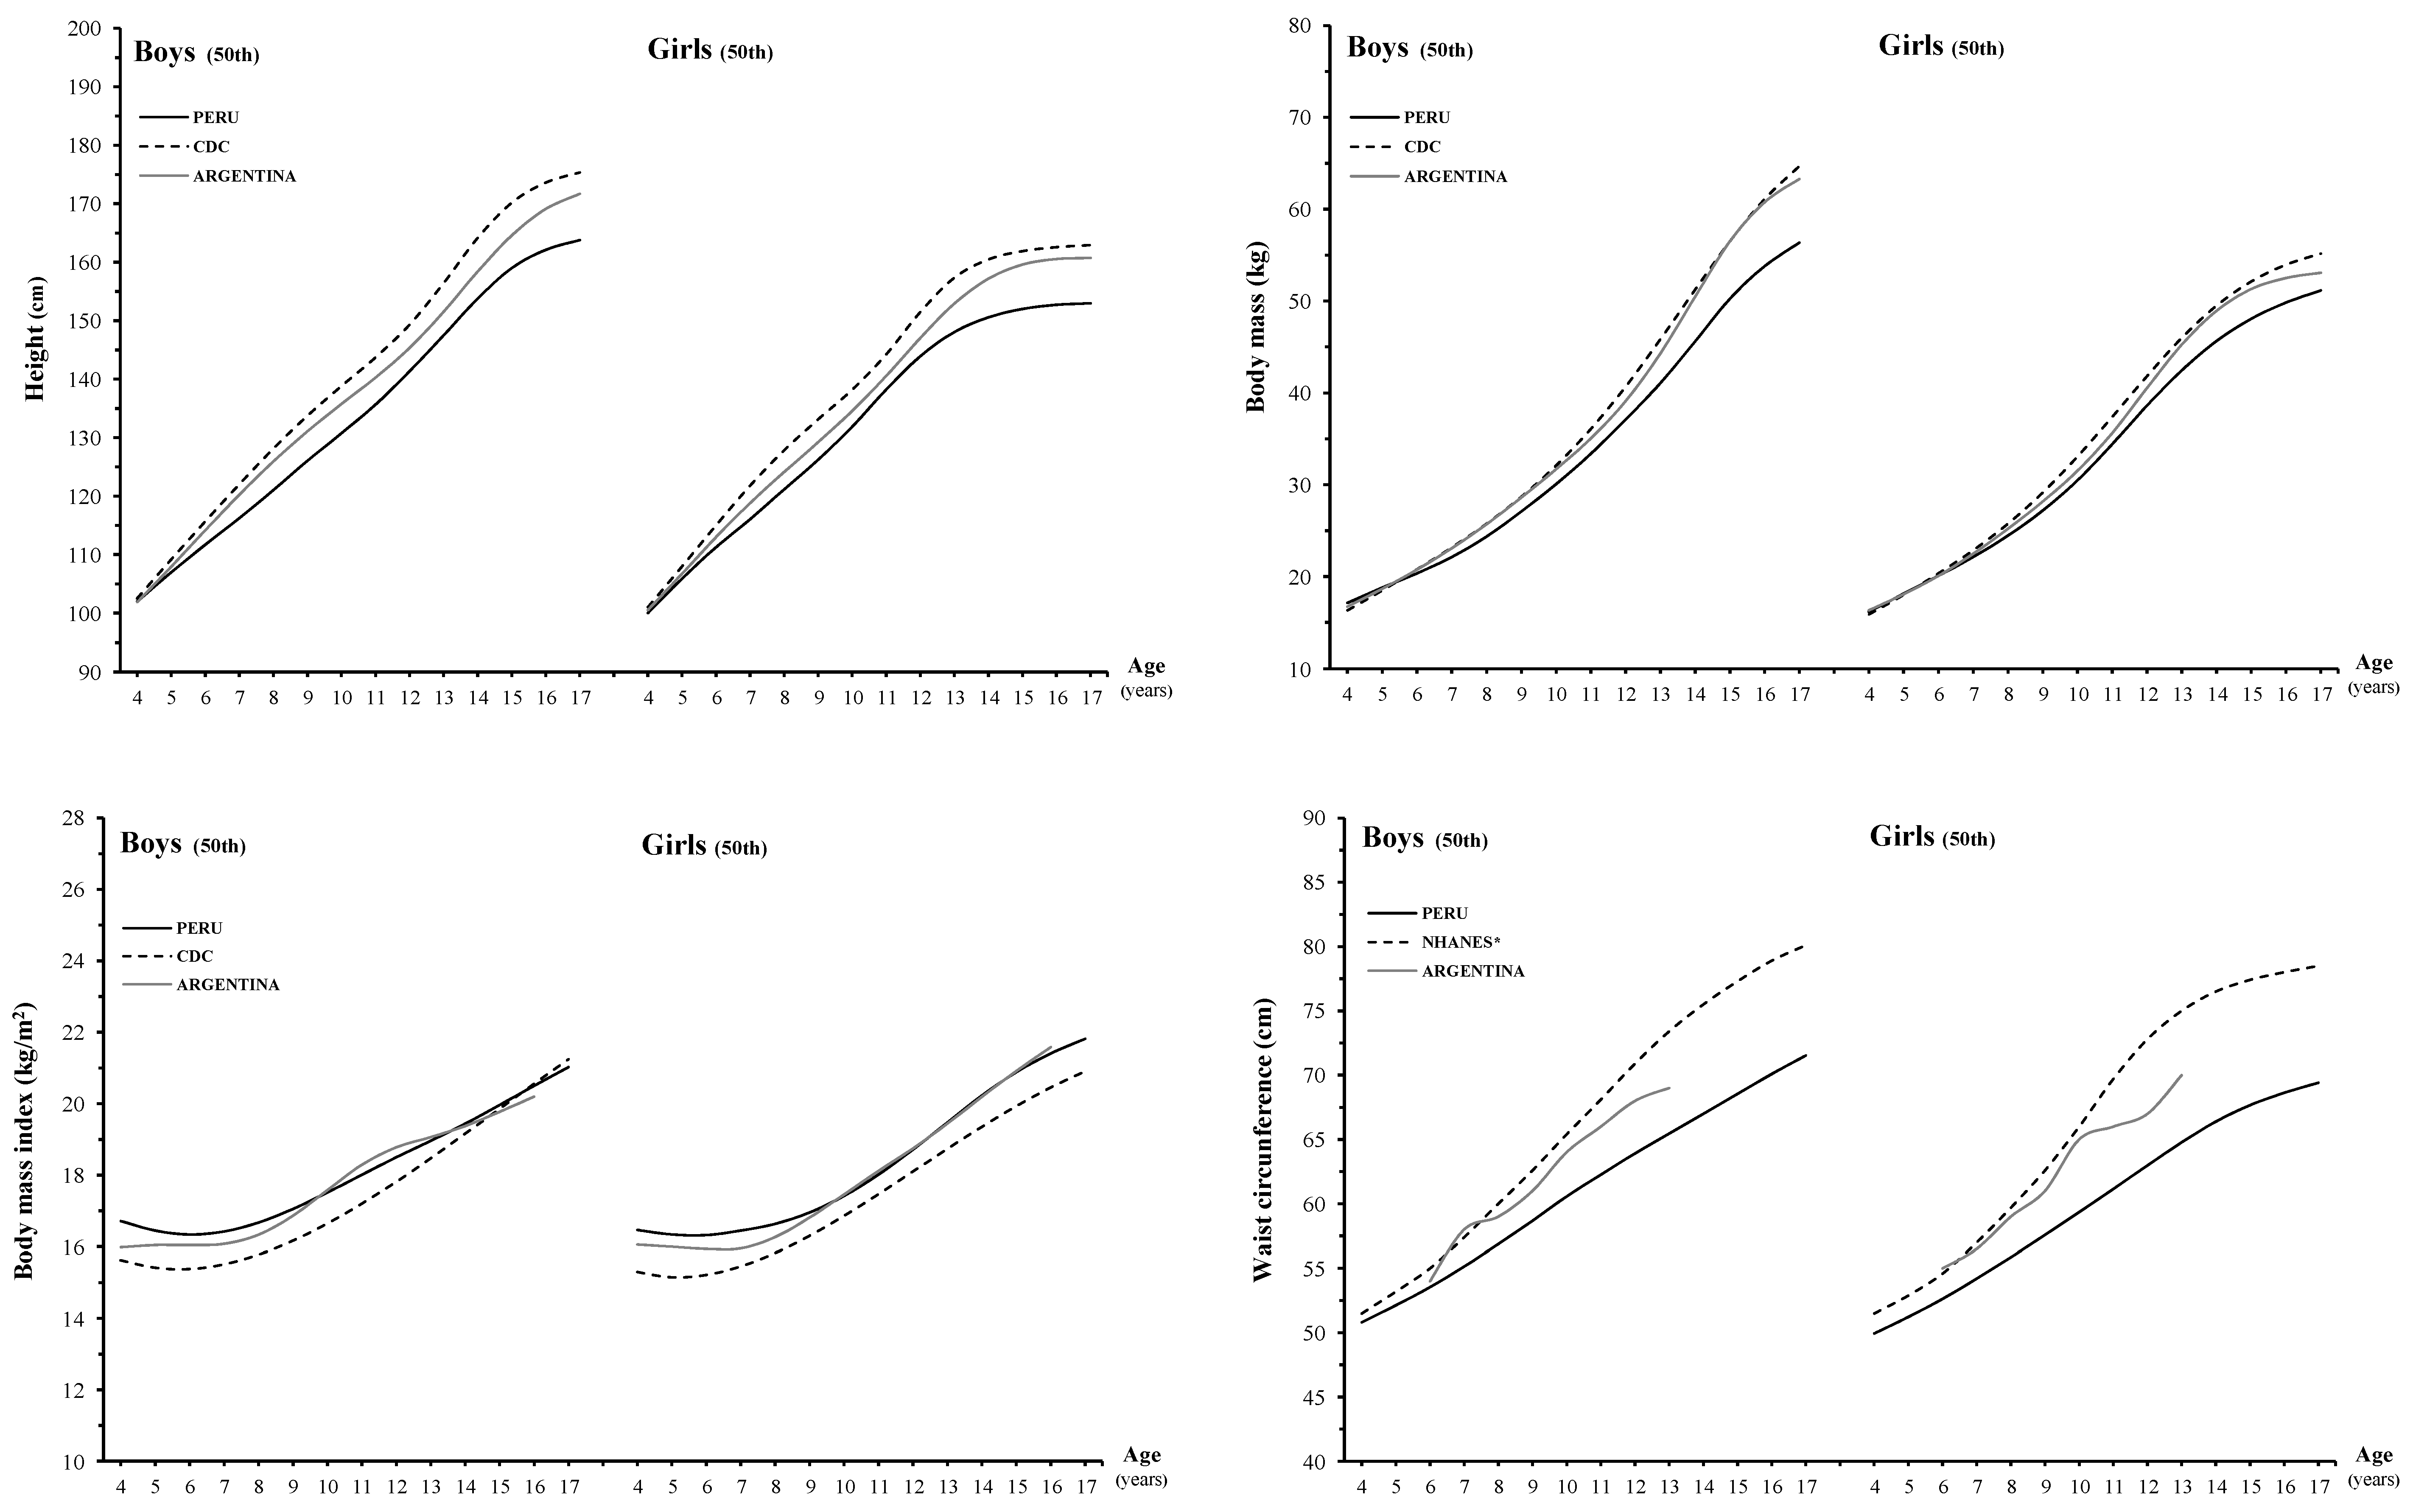
Figure 3 displays the 50th centiles for height, body mass, BMI and WC of Peruvian children against North-American [
19,
20], and Argentinean [
10,
21,
22] counterparts.
Table 6 and
Table 7 provides means, mean differences and
p values for these growth characteristics. The Peruvian boys are shorter than North-American and Argentinean peers. The average difference between Peruvian and North-American boys is ~7.8 cm and between Peruvian and Argentinean is ~4.5 cm. Corresponding values for girls are ~7.0 cm and ~4.1 cm. For body mass, Peruvian boys and girls are lighter than North-American and Argentinean counterparts. The differences between Peruvian and North-American children are ~4.1 kg in boys and ~2.8 kg in girls. The differential between Peruvian and Argentinean children is ~3.4 kg (boys) and 1.6 kg (girls). For BMI, Peruvian boys have higher mean values than North-American peers and the difference is ~0.8 kg/m
2. In girls, the difference is ~0.9 kg/m
2 in the age interval 4–17 years. The differential between Peruvian and Argentinean boys and girls is ~0.4 kg/m
2 between 4 and 9 years of age. The WC of Peruvian children is lower than North-Americans and Argentinean peers in all age intervals. Differences between Peruvian and North-American children are ~5.4 cm in boys and ~6.6 cm in girls. The same differential between Peruvian and Argentinean children is ~2.8 cm in boys and ~3.9 cm in girls between 6 and 13 years of age.
Figure 2.
Smoothed reference curves for the 3rd, 10th, 25th, 50th, 75th, 90th and 97th percentiles for height, body mass, body mass index and waist circumference in 4 to 17 year-old Peruvian boys and girls.
Figure 2.
Smoothed reference curves for the 3rd, 10th, 25th, 50th, 75th, 90th and 97th percentiles for height, body mass, body mass index and waist circumference in 4 to 17 year-old Peruvian boys and girls.
Table 4.
Age- and sex-specific percentiles of height (cm) and body mass (kg) for school-aged Peruvian children and adolescents.
Table 4.
Age- and sex-specific percentiles of height (cm) and body mass (kg) for school-aged Peruvian children and adolescents.
| Age | | | Centiles: Height (cm) | | | Centiles: Body Mass (kg) |
|---|
| (Years) | L | S | 3rd | 10th | 25th | 50th (M) | 75th | 90th | 97th | L | S | 3rd | 10th | 25th | 50th (M) | 75th | 90th | 97th |
|---|
| Boys |
| 4 | −0.5772 | 0.0412 | 94.1 | 96.6 | 99.2 | 102.0 | 104.8 | 107.8 | 111.0 | −1.3460 | 0.1214 | 13.9 | 14.8 | 15.9 | 17.1 | 18.7 | 20.6 | 23.0 |
| 5 | −0.5772 | 0.0415 | 98.6 | 101.3 | 104.1 | 107.0 | 110.0 | 113.1 | 116.5 | −1.3184 | 0.1286 | 15.1 | 16.1 | 17.3 | 18.8 | 20.6 | 22.8 | 25.7 |
| 6 | −0.5772 | 0.0419 | 102.9 | 105.7 | 108.6 | 111.7 | 114.9 | 118.2 | 121.7 | −1.2921 | 0.1356 | 16.1 | 17.3 | 18.7 | 20.3 | 22.4 | 25.0 | 28.4 |
| 7 | −0.5772 | 0.0425 | 107.0 | 109.9 | 113.0 | 116.2 | 119.6 | 123.1 | 126.8 | −1.2623 | 0.1433 | 17.3 | 18.6 | 20.2 | 22.1 | 24.5 | 27.5 | 31.6 |
| 8 | −0.5772 | 0.0428 | 111.3 | 114.4 | 117.6 | 121.0 | 124.6 | 128.2 | 132.1 | −1.2256 | 0.1525 | 18.8 | 20.3 | 22.1 | 24.3 | 27.1 | 30.8 | 35.7 |
| 9 | −0.5772 | 0.0426 | 116.0 | 119.2 | 122.5 | 126.0 | 129.7 | 133.5 | 137.5 | −1.1817 | 0.1625 | 20.6 | 22.3 | 24.5 | 27.1 | 30.4 | 34.8 | 40.8 |
| 10 | −0.5772 | 0.0433 | 120.2 | 123.5 | 127.1 | 130.8 | 134.6 | 138.7 | 142.9 | −1.1326 | 0.1724 | 22.5 | 24.5 | 27.0 | 30.1 | 34.0 | 39.2 | 46.5 |
| 11 | −0.5772 | 0.0461 | 124.0 | 127.7 | 131.6 | 135.6 | 139.9 | 144.4 | 149.1 | −1.0777 | 0.1813 | 24.6 | 26.9 | 29.8 | 33.4 | 38.0 | 44.1 | 52.8 |
| 12 | −0.5772 | 0.0504 | 128.2 | 132.3 | 136.7 | 141.3 | 146.2 | 151.4 | 156.8 | −1.0165 | 0.1870 | 27.0 | 29.7 | 33.0 | 37.1 | 42.4 | 49.4 | 59.4 |
| 13 | −0.5772 | 0.0527 | 133.1 | 137.7 | 142.4 | 147.5 | 152.8 | 158.5 | 164.4 | −0.9506 | 0.1861 | 29.8 | 32.9 | 36.5 | 41.1 | 46.8 | 54.5 | 65.0 |
| 14 | −0.5772 | 0.0496 | 139.6 | 144.1 | 148.8 | 153.8 | 159.0 | 164.5 | 170.3 | −0.8806 | 0.1771 | 33.5 | 36.8 | 40.7 | 45.6 | 51.6 | 59.4 | 69.7 |
| 15 | −0.5772 | 0.0438 | 146.0 | 150.1 | 154.4 | 159.0 | 163.7 | 168.7 | 173.9 | −0.8112 | 0.1628 | 37.6 | 41.1 | 45.3 | 50.2 | 56.3 | 63.8 | 73.3 |
| 16 | −0.5772 | 0.0392 | 150.1 | 154.0 | 158.0 | 162.1 | 166.4 | 170.9 | 175.6 | −0.7498 | 0.1493 | 41.1 | 44.7 | 48.9 | 53.8 | 59.6 | 66.7 | 75.4 |
| 17 | −0.5772 | 0.0366 | 152.4 | 156.1 | 159.8 | 163.8 | 167.9 | 172.1 | 176.5 | −0.6968 | 0.1383 | 43.8 | 47.4 | 51.5 | 56.4 | 62.0 | 68.7 | 76.6 |
| Girls | |
| 4 | 0.0064 | 0.0352 | 93.2 | 95.4 | 97.7 | 100.0 | 102.4 | 104.8 | 107.3 | −0.8235 | 0.1180 | 13.0 | 13.9 | 15.0 | 16.2 | 17.5 | 19.1 | 21.0 |
| 5 | 0.0064 | 0.0377 | 98.2 | 100.7 | 103.2 | 105.9 | 108.6 | 111.3 | 114.2 | −0.8235 | 0.1303 | 14.3 | 15.4 | 16.7 | 18.1 | 19.9 | 21.9 | 24.3 |
| 6 | 0.0064 | 0.0395 | 102.8 | 105.6 | 108.4 | 111.3 | 114.2 | 117.3 | 120.4 | −0.8235 | 0.1422 | 15.6 | 16.8 | 18.3 | 20.1 | 22.2 | 24.7 | 27.8 |
| 7 | 0.0064 | 0.0405 | 107.0 | 109.9 | 112.9 | 116.0 | 119.2 | 122.5 | 125.8 | −0.8235 | 0.1539 | 16.8 | 18.3 | 20.1 | 22.1 | 24.6 | 27.7 | 31.6 |
| 8 | 0.0064 | 0.0416 | 111.5 | 114.6 | 117.8 | 121.1 | 124.5 | 128.0 | 131.6 | −0.8235 | 0.1659 | 18.2 | 20.0 | 22.0 | 24.5 | 27.5 | 31.2 | 36.0 |
| 9 | 0.0064 | 0.0430 | 115.8 | 119.2 | 122.7 | 126.2 | 129.9 | 133.7 | 137.6 | −0.8235 | 0.1777 | 19.9 | 21.9 | 24.3 | 27.2 | 30.8 | 35.4 | 41.4 |
| 10 | 0.0064 | 0.0450 | 120.5 | 124.2 | 128.0 | 131.8 | 135.9 | 140.0 | 144.3 | −0.8235 | 0.1872 | 22.0 | 24.3 | 27.1 | 30.5 | 34.8 | 40.3 | 47.7 |
| 11 | 0.0064 | 0.0453 | 126.2 | 130.1 | 134.1 | 138.2 | 142.5 | 146.8 | 151.4 | −0.8235 | 0.1904 | 24.7 | 27.3 | 30.5 | 34.4 | 39.4 | 45.8 | 54.4 |
| 12 | 0.0064 | 0.0422 | 132.3 | 136.0 | 139.9 | 143.9 | 148.0 | 152.2 | 156.6 | −0.8235 | 0.1843 | 28.0 | 30.9 | 34.3 | 38.6 | 44.0 | 50.8 | 59.9 |
| 13 | 0.0064 | 0.0378 | 137.3 | 140.8 | 144.4 | 148.1 | 151.8 | 155.7 | 159.7 | −0.8235 | 0.1706 | 31.4 | 34.5 | 38.1 | 42.4 | 47.8 | 54.6 | 63.3 |
| 14 | 0.0064 | 0.0347 | 140.5 | 143.8 | 147.1 | 150.6 | 154.1 | 157.7 | 161.4 | −0.8235 | 0.1553 | 34.6 | 37.7 | 41.3 | 45.6 | 50.9 | 57.3 | 65.3 |
| 15 | 0.0064 | 0.0329 | 142.3 | 145.5 | 148.7 | 152.0 | 155.4 | 158.8 | 162.3 | −0.8235 | 0.1424 | 37.2 | 40.3 | 43.9 | 48.1 | 53.1 | 59.1 | 66.5 |
| 16 | 0.0064 | 0.0321 | 143.2 | 146.3 | 149.5 | 152.7 | 156.0 | 159.4 | 162.8 | −0.8235 | 0.1326 | 39.2 | 42.2 | 45.7 | 49.8 | 54.6 | 60.3 | 67.2 |
| 17 | 0.0064 | 0.0318 | 143.6 | 146.6 | 149.8 | 153.0 | 156.2 | 159.6 | 163.0 | −0.8235 | 0.1251 | 40.7 | 43.8 | 47.2 | 51.2 | 55.8 | 61.2 | 67.7 |
Table 5.
Age- and sex-specific percentiles of body mass index (kg/m²) and waist circumference (cm) for school-aged Peruvian children and adolescents.
Table 5.
Age- and sex-specific percentiles of body mass index (kg/m²) and waist circumference (cm) for school-aged Peruvian children and adolescents.
| Age | | | Centiles: Body Mass Index (kg/m²) | | | Centiles: Waist Circumference (cm) |
|---|
| (Years) | L | S | 3rd | 10th | 25th | 50th (M) | 75th | 90th | 97th | L | S | 3rd | 10th | 25th | 50th (M) | 75th | 90th | 97th |
|---|
| Boys | |
| 4 | −2.2535 | 0.0753 | 14.6 | 15.2 | 15.8 | 16.7 | 17.6 | 18.7 | 20.2 | −1.5809 | 0.0660 | 45.1 | 46.8 | 48.7 | 50.8 | 53.2 | 55.9 | 58.9 |
| 5 | −2.2535 | 0.0824 | 14.3 | 14.9 | 15.6 | 16.4 | 17.4 | 18.6 | 20.1 | −1.7335 | 0.0694 | 46.0 | 47.8 | 49.9 | 52.1 | 54.7 | 57.7 | 61.1 |
| 6 | −2.2535 | 0.0896 | 14.1 | 14.7 | 15.4 | 16.3 | 17.4 | 18.7 | 20.5 | −1.8922 | 0.0730 | 47.1 | 49.0 | 51.1 | 53.5 | 56.3 | 59.6 | 63.5 |
| 7 | −2.2535 | 0.0972 | 14.0 | 14.7 | 15.5 | 16.4 | 17.6 | 19.0 | 21.1 | −2.0652 | 0.0772 | 48.2 | 50.2 | 52.5 | 55.1 | 58.2 | 61.9 | 66.4 |
| 8 | −2.2535 | 0.1048 | 14.0 | 14.8 | 15.6 | 16.7 | 18.0 | 19.6 | 22.0 | −2.2483 | 0.0820 | 49.5 | 51.6 | 54.0 | 56.9 | 60.3 | 64.5 | 69.8 |
| 9 | −2.2535 | 0.1113 | 14.2 | 15.0 | 15.9 | 17.1 | 18.5 | 20.3 | 23.1 | −2.4370 | 0.0867 | 50.8 | 53.0 | 55.6 | 58.7 | 62.5 | 67.2 | 73.5 |
| 10 | −2.2535 | 0.1160 | 14.5 | 15.3 | 16.3 | 17.5 | 19.1 | 21.2 | 24.2 | −2.6247 | 0.0903 | 52.2 | 54.5 | 57.2 | 60.6 | 64.6 | 69.9 | 77.2 |
| 11 | −2.2535 | 0.1186 | 14.9 | 15.7 | 16.7 | 18.0 | 19.6 | 21.9 | 25.2 | −2.8058 | 0.0920 | 53.6 | 56.0 | 58.8 | 62.3 | 66.5 | 72.2 | 80.5 |
| 12 | −2.2535 | 0.1191 | 15.3 | 16.2 | 17.2 | 18.5 | 20.2 | 22.5 | 26.0 | −2.9769 | 0.0917 | 55.0 | 57.5 | 60.4 | 63.9 | 68.3 | 74.2 | 83.0 |
| 13 | −2.2535 | 0.1177 | 15.7 | 16.6 | 17.6 | 19.0 | 20.7 | 23.1 | 26.7 | −3.1406 | 0.0895 | 56.5 | 59.0 | 61.9 | 65.5 | 69.8 | 75.7 | 84.8 |
| 14 | −2.2535 | 0.1150 | 16.2 | 17.0 | 18.1 | 19.4 | 21.1 | 23.6 | 27.2 | −3.3097 | 0.0859 | 58.2 | 60.6 | 63.5 | 67.0 | 71.3 | 77.0 | 86.0 |
| 15 | −2.2535 | 0.1117 | 16.7 | 17.6 | 18.6 | 20.0 | 21.7 | 24.1 | 27.7 | −3.4879 | 0.0811 | 60.2 | 62.4 | 65.1 | 68.5 | 72.8 | 78.4 | 86.9 |
| 16 | −2.2535 | 0.1083 | 17.2 | 18.1 | 19.2 | 20.5 | 22.2 | 24.6 | 28.1 | −3.6608 | 0.0765 | 62.1 | 64.3 | 66.9 | 70.1 | 74.2 | 79.6 | 87.7 |
| 17 | −2.2535 | 0.1049 | 17.7 | 18.6 | 19.7 | 21.0 | 22.7 | 25.0 | 28.5 | −3.8214 | 0.0725 | 63.7 | 65.9 | 68.4 | 71.5 | 75.5 | 80.7 | 88.4 |
| Girls | |
| 4 | −1.2523 | 0.0784 | 14.2 | 14.9 | 15.6 | 16.5 | 17.3 | 18.3 | 19.5 | −2.2787 | 0.0670 | 44.4 | 46.0 | 47.9 | 49.9 | 52.3 | 55.2 | 58.6 |
| 5 | −1.2523 | 0.0889 | 13.9 | 14.6 | 15.4 | 16.3 | 17.3 | 18.4 | 19.7 | −2.2787 | 0.0725 | 45.2 | 46.9 | 48.9 | 51.2 | 53.9 | 57.1 | 61.1 |
| 6 | −1.2523 | 0.0982 | 13.7 | 14.5 | 15.3 | 16.3 | 17.4 | 18.6 | 20.0 | −2.2787 | 0.0780 | 46.1 | 47.9 | 50.1 | 52.6 | 55.6 | 59.3 | 63.8 |
| 7 | −1.2523 | 0.1066 | 13.6 | 14.4 | 15.4 | 16.4 | 17.6 | 19.0 | 20.7 | −2.2787 | 0.0834 | 47.1 | 49.1 | 51.4 | 54.2 | 57.5 | 61.6 | 66.9 |
| 8 | −1.2523 | 0.1156 | 13.6 | 14.5 | 15.5 | 16.6 | 17.9 | 19.5 | 21.7 | −2.2787 | 0.0886 | 48.1 | 50.3 | 52.8 | 55.9 | 59.5 | 64.1 | 70.1 |
| 9 | −1.2523 | 0.1255 | 13.6 | 14.6 | 15.7 | 17.0 | 18.4 | 20.4 | 22.8 | −2.2787 | 0.0931 | 49.3 | 51.6 | 54.3 | 57.6 | 61.6 | 66.6 | 73.4 |
| 10 | −1.2523 | 0.1341 | 13.8 | 14.8 | 16.0 | 17.4 | 19.2 | 21.3 | 24.2 | −2.2787 | 0.0959 | 50.6 | 53.1 | 55.9 | 59.4 | 63.6 | 69.0 | 76.4 |
| 11 | −1.2523 | 0.1397 | 14.2 | 15.2 | 16.5 | 18.0 | 19.9 | 22.3 | 25.4 | −2.2787 | 0.0965 | 52.1 | 54.6 | 57.6 | 61.2 | 65.6 | 71.2 | 78.9 |
| 12 | −1.2523 | 0.1413 | 14.7 | 15.8 | 17.1 | 18.7 | 20.7 | 23.2 | 26.5 | −2.2787 | 0.0953 | 53.8 | 56.3 | 59.4 | 63.0 | 67.5 | 73.2 | 80.9 |
| 13 | −1.2523 | 0.1386 | 15.4 | 16.5 | 17.8 | 19.5 | 21.5 | 24.0 | 27.4 | −2.2787 | 0.0926 | 55.5 | 58.1 | 61.1 | 64.8 | 69.2 | 74.9 | 82.4 |
| 14 | −1.2523 | 0.1332 | 16.1 | 17.2 | 18.6 | 20.2 | 22.2 | 24.7 | 28.1 | −2.2787 | 0.0894 | 57.1 | 59.7 | 62.8 | 66.4 | 70.8 | 76.3 | 83.5 |
| 15 | −1.2523 | 0.1271 | 16.7 | 17.9 | 19.3 | 20.9 | 22.8 | 25.3 | 28.7 | −2.2787 | 0.0866 | 58.5 | 61.1 | 64.1 | 67.7 | 72.0 | 77.4 | 84.3 |
| 16 | −1.2523 | 0.1227 | 17.3 | 18.4 | 19.8 | 21.4 | 23.3 | 25.7 | 29.2 | −2.2787 | 0.0845 | 59.5 | 62.1 | 65.1 | 68.6 | 72.9 | 78.2 | 85.0 |
| 17 | −1.2523 | 0.1205 | 17.7 | 18.8 | 20.2 | 21.8 | 23.7 | 26.1 | 29.6 | −2.2787 | 0.0829 | 60.3 | 62.9 | 65.9 | 69.4 | 73.6 | 78.8 | 85.5 |
Figure 3.
Comparison of the age and sex specific 50th percentile values for height, body mass, body mass index and waist circumference between Peruvian boys and girls and those from North-America and Argentina.
Figure 3.
Comparison of the age and sex specific 50th percentile values for height, body mass, body mass index and waist circumference between Peruvian boys and girls and those from North-America and Argentina.
Table 6.
Results of mean differences between the CDC and Peruvian schoolchildren for height, body mass, body mass index and waist circumference from both sexes aged 4 to 17 years.
Table 6.
Results of mean differences between the CDC and Peruvian schoolchildren for height, body mass, body mass index and waist circumference from both sexes aged 4 to 17 years.
| Age(Years) | | Height | | Body Mass | | Body Mass Index | | Waist Circumference |
|---|
| | CDC | PERU | Mean | p | | CDC | PERU | Mean | p | | CDC | PERU | Mean | p | | NHNES | PERU | Mean | p |
|---|
| | Mean | Mean | Difference | | Mean | Mean | Difference | | Mean | Mean | Difference | | Mean | Mean | Difference |
|---|
| Boys | | |
| 4 | | 105.6 | 104.7 | −0.86 | 0.010 | | 17.7 | 18.2 | 0.56 | 0.003 | | 15.8 | 16.6 | 0.78 | 0.001 | | 51.5 | 52.3 | 0.75 | 0.008 |
| 5 | | 112.4 | 109.6 | −2.85 | 0.001 | | 20.0 | 20.2 | 0.20 | 0.347 | | 15.8 | 16.7 | 0.99 | 0.001 | | 53.2 | 53.3 | 0.63 | 0.837 |
| 6 | | 118.7 | 113.5 | −5.15 | 0.001 | | 22.2 | 21.7 | −0.52 | 0.022 | | 15.8 | 16.8 | 1.02 | 0.001 | | 55.0 | 54.8 | −0.16 | 0.532 |
| 7 | | 125.0 | 119.1 | −5.97 | 0.001 | | 24.8 | 24.2 | −0.61 | 0.026 | | 15.9 | 17.0 | 1.06 | 0.001 | | 57.4 | 56.9 | −0.52 | 0.093 |
| 8 | | 130.1 | 123.5 | −6.63 | 0.001 | | 27.4 | 26.7 | −0.74 | 0.027 | | 16.2 | 17.4 | 1.14 | 0.001 | | 60.0 | 58.9 | −1.10 | 0.003 |
| 9 | | 135.8 | 128.8 | −6.99 | 0.001 | | 31.2 | 29.9 | −1.27 | 0.001 | | 16.9 | 17.9 | 1.00 | 0.001 | | 62.6 | 60.9 | −1.66 | 0.001 |
| 10 | | 141.0 | 133.0 | −7.95 | 0.001 | | 34.8 | 32.7 | −2.06 | 0.001 | | 17.5 | 18.3 | 0.86 | 0.001 | | 65.4 | 62.4 | −3.73 | 0.001 |
| 11 | | 146.1 | 138.5 | −7.64 | 0.001 | | 39.0 | 37.4 | −1.56 | 0.001 | | 18.2 | 19.4 | 1.17 | 0.001 | | 68.1 | 65.2 | −2.91 | 0.001 |
| 12 | | 153.1 | 145.1 | −8.02 | 0.001 | | 43.5 | 42.0 | −1.51 | 0.010 | | 18.6 | 19.7 | 1.09 | 0.001 | | 70.9 | 66.8 | −4.14 | 0.001 |
| 13 | | 159.7 | 150.1 | −9.65 | 0.001 | | 49.8 | 44.5 | −5.35 | 0.001 | | 19.5 | 19.6 | 0.07 | 0.708 | | 73.4 | 66.5 | −7.71 | 0.001 |
| 14 | | 167.3 | 156.8 | −10.44 | 0.001 | | 56.4 | 50.1 | −6.33 | 0.001 | | 20.2 | 20.2 | 0.25 | 0.878 | | 75.5 | 68.8 | −6.73 | 0.001 |
| 15 | | 171.5 | 160.8 | −10.67 | 0.001 | | 61.1 | 53.8 | −7.29 | 0.001 | | 20.8 | 20.7 | −0.03 | 0.830 | | 77.3 | 70.2 | −7.11 | 0.001 |
| 16 | | 174.5 | 163.1 | −11.33 | 0.001 | | 66.2 | 56.5 | −9.78 | 0.001 | | 21.7 | 21.1 | −0.58 | 0.001 | | 78.9 | 72.0 | −6.87 | 0.001 |
| 17 | | 175.9 | 163.2 | −12.73 | 0.001 | | 67.8 | 57.4 | −10.32 | 0.001 | | 21.9 | 21.5 | −0.38 | 0.096 | | 80.1 | 72.6 | −7.50 | 0.001 |
| Girls | | | | | | | | | | | | | | | | | | | | |
| 4 | | 104.5 | 103.5 | −1.01 | 0.002 | | 17.2 | 17.5 | 0.30 | 0.067 | | 15.7 | 16.3 | 0.63 | 0.001 | | 51.5 | 51.1 | −0.44 | 0.103 |
| 5 | | 111.8 | 109.3 | −2.50 | 0.001 | | 19.8 | 19.9 | 0.12 | 0.580 | | 15.7 | 16.6 | 0.84 | 0.001 | | 52.9 | 52.2 | −0.65 | 0.028 |
| 6 | | 117.9 | 113.0 | −4.86 | 0.001 | | 21.6 | 21.3 | −0.29 | 0.190 | | 15.5 | 16.6 | 1.14 | 0.001 | | 54.6 | 53.9 | −0.67 | 0.013 |
| 7 | | 123.9 | 118.5 | −5.38 | 0.001 | | 24.3 | 24.0 | −0.28 | 0.313 | | 15.8 | 17.0 | 1.20 | 0.001 | | 57.0 | 55.8 | −1.20 | 0.001 |
| 8 | | 129.9 | 124.3 | −5.55 | 0.001 | | 27.6 | 26.7 | −0.95 | 0.002 | | 16.4 | 17.2 | 0.79 | 0.001 | | 59.7 | 57.4 | −2.26 | 0.001 |
| 9 | | 135.6 | 129.8 | −5.79 | 0.001 | | 31.7 | 30.4 | −1.26 | 0.001 | | 17.2 | 17.9 | 0.66 | 0.001 | | 62.6 | 60.0 | −2.64 | 0.001 |
| 10 | | 141.4 | 135.2 | −6.19 | 0.001 | | 34.9 | 33.2 | −1.71 | 0.001 | | 17.4 | 18.0 | 0.54 | 0.001 | | 66.0 | 60.7 | −5.34 | 0.001 |
| 11 | | 148.3 | 142.0 | −6.24 | 0.001 | | 40.8 | 39.1 | −1.75 | 0.001 | | 18.6 | 19.2 | 0.61 | 0.001 | | 69.7 | 63.4 | −6.31 | 0.001 |
| 12 | | 154.7 | 145.9 | −8.88 | 0.001 | | 46.4 | 41.8 | −4.58 | 0.010 | | 19.3 | 19.5 | 0.21 | 0.140 | | 72.8 | 64.4 | −8.37 | 0.001 |
| 13 | | 159.0 | 149.6 | −9.41 | 0.001 | | 51.1 | 45.7 | −5.32 | 0.001 | | 20.2 | 20.4 | 0.21 | 0.198 | | 75.0 | 66.8 | −8.25 | 0.001 |
| 14 | | 161.0 | 151.0 | −14.00 | 0.001 | | 54.4 | 48.2 | −6.21 | 0.001 | | 21.0 | 21.1 | 0.13 | 0.397 | | 76.5 | 68.1 | −8.39 | 0.001 |
| 15 | | 163.0 | 152.3 | −10.66 | 0.001 | | 56.1 | 50.1 | −6.02 | 0.001 | | 21.0 | 21.5 | 0.50 | 0.001 | | 77.4 | 69.0 | −8.39 | 0.001 |
| 16 | | 162.6 | 153.0 | −9.54 | 0.001 | | 57.5 | 51.6 | −5.94 | 0.001 | | 21.8 | 22.0 | 0.23 | 0.120 | | 78.0 | 69.8 | −8.21 | 0.001 |
| 17 | | 163.0 | 152.9 | −10.03 | 0.001 | | 59.0 | 52.5 | −6.53 | 0.001 | | 22.3 | 22.4 | 0.16 | 0.543 | | 78.5 | 70.5 | −7.95 | 0.001 |
Table 7.
Results of mean differences between Argentina and Peruvian schoolchildren for height, body mass, body mass index and waist circumference from both sexes aged 4 to 17 years.
Table 7.
Results of mean differences between Argentina and Peruvian schoolchildren for height, body mass, body mass index and waist circumference from both sexes aged 4 to 17 years.
| Age(Years) | | Height | | Body Mass | | Body Mass Index | | Waist Circumference |
|---|
| | Argentina | Peru | Mean | p | | Argentina | Peru | Mean | p | | Argentina | Peru | Mean | p | | Argentina | Peru | Mean | p |
|---|
| | Mean | Mean | Difference | | Mean | Mean | Difference | | Mean | Mean | Difference | | Mean | Mean | Difference |
|---|
| Boys | | |
| 4 | | 101.9 | 104.7 | 2.84 | 0.001 | | 16.7 | 18.2 | 1.49 | 0.001 | | 16.0 | 16.6 | 0.59 | 0.001 | | | | | |
| 5 | | 107.9 | 109.6 | 1.64 | 0.001 | | 18.7 | 20.2 | 1.52 | 0.001 | | 16.0 | 16.7 | 0.70 | 0.001 | | | | | |
| 6 | | 114.2 | 113.5 | −0.60 | 0.056 | | 20.7 | 21.7 | 0.98 | 0.001 | | 16.0 | 16.8 | 0.73 | 0.001 | | 54.0 | 54.8 | 0.84 | 0.001 |
| 7 | | 120.2 | 119.1 | −1.17 | 0.001 | | 23.1 | 24.2 | 1.14 | 0.001 | | 16.1 | 17.0 | 0.88 | 0.001 | | 58.0 | 56.9 | −1.12 | 0.001 |
| 8 | | 125.9 | 123.5 | −2.44 | 0.001 | | 25.7 | 26.7 | 1.02 | 0.002 | | 16.3 | 17.4 | 1.05 | 0.001 | | 59.0 | 58.9 | −0.10 | 0.785 |
| 9 | | 131.1 | 128.8 | −2.25 | 0.001 | | 28.6 | 29.9 | 1.35 | 0.001 | | 16.9 | 17.9 | 1.07 | 0.001 | | 61.0 | 60.9 | −0.06 | 0.876 |
| 10 | | 135.8 | 133.0 | −2.75 | 0.001 | | 31.7 | 32.7 | 1.03 | 0.011 | | 17.6 | 18.3 | 0.76 | 0.001 | | 64.0 | 62.4 | −1.57 | 0.001 |
| 11 | | 140.3 | 138.5 | −1.80 | 0.001 | | 35.0 | 37.4 | 2.40 | 0.001 | | 18.3 | 19.4 | 1.06 | 0.001 | | 66.0 | 65.2 | −0.81 | 0.056 |
| 12 | | 145.4 | 145.1 | −0.26 | 0.572 | | 39.1 | 42.0 | 2.88 | 0.001 | | 18.8 | 19.7 | 0.90 | 0.001 | | 68.0 | 66.8 | −1.24 | 0.006 |
| 13 | | 151.5 | 150.1 | −1.44 | 0.006 | | 44.3 | 44.5 | 0.19 | 0.745 | | 19.1 | 19.6 | 0.50 | 0.005 | | 69.0 | 66.5 | −2.48 | 0.001 |
| 14 | | 158.4 | 156.8 | −1.56 | 0.001 | | 50.5 | 50.1 | −0.36 | 0.540 | | 19.4 | 20.2 | 0.84 | 0.001 | | | | | |
| 15 | | 164.6 | 160.8 | −3.74 | 0.001 | | 56.5 | 53.8 | −2.71 | 0.001 | | 19.8 | 20.7 | 0.95 | 0.001 | | | | | |
| 16 | | 169.1 | 163.1 | −5.96 | 0.001 | | 60.8 | 56.5 | −4.31 | 0.001 | | 20.2 | 21.1 | 0.95 | 0.001 | | | | | |
| 17 | | 171.7 | 163.2 | −8.48 | 0.001 | | 63.3 | 57.4 | −5.86 | 0.001 | | | | | | | | | | |
| Girls | | | | | | | | | | | | | | | | | | | | |
| 4 | | 100.5 | 103.5 | 3.00 | 0.001 | | 16.3 | 17.5 | 1.19 | 0.001 | | 16.1 | 16.3 | 0.24 | 0.022 | | | | | |
| 5 | | 106.7 | 109.3 | 2.62 | 0.001 | | 18.1 | 19.9 | 1.79 | 0.001 | | 16.0 | 16.6 | 0.55 | 0.001 | | | | | |
| 6 | | 113.0 | 113.0 | 0.04 | 0.896 | | 20.1 | 21.3 | 1.27 | 0.001 | | 15.9 | 16.6 | 0.69 | 0.001 | | 55.0 | 53.9 | −1.07 | 0.001 |
| 7 | | 118.8 | 118.5 | −0.27 | 0.426 | | 22.5 | 24.0 | 1.56 | 0.001 | | 16.0 | 17.0 | 1.04 | 0.001 | | 56.5 | 55.8 | −0.70 | 0.025 |
| 8 | | 124.1 | 124.3 | 0.20 | 0.571 | | 25.2 | 26.7 | 1.46 | 0.001 | | 16.3 | 17.2 | 0.89 | 0.001 | | 59.0 | 57.4 | −1.56 | 0.001 |
| 9 | | 129.2 | 129.8 | 0.55 | 0.116 | | 28.2 | 30.4 | 2.25 | 0.001 | | 16.8 | 17.9 | 1.06 | 0.001 | | 61.0 | 60.0 | −1.04 | 0.005 |
| 10 | | 134.6 | 135.2 | 0.62 | 0.109 | | 31.5 | 33.2 | 1.64 | 0.001 | | 17.5 | 18.0 | 0.51 | 0.001 | | 65.0 | 60.7 | −4.34 | 0.001 |
| 11 | | 140.6 | 142.0 | 1.47 | 0.001 | | 35.6 | 39.1 | 3.45 | 0.001 | | 18.1 | 19.2 | 1.06 | 0.001 | | 66.0 | 63.4 | −2.61 | 0.001 |
| 12 | | 147.0 | 145.9 | −1.18 | 0.001 | | 40.5 | 41.8 | 1.28 | 0.002 | | 18.8 | 19.5 | 0.77 | 0.001 | | 67.0 | 64.4 | −2.57 | 0.001 |
| 13 | | 152.9 | 149.6 | −3.29 | 0.001 | | 45.2 | 45.7 | 0.49 | 0.251 | | 19.4 | 20.4 | 0.93 | 0.001 | | 70.0 | 66.8 | −3.25 | 0.001 |
| 14 | | 157.2 | 151.0 | −6.17 | 0.001 | | 48.9 | 48.2 | −0.71 | 0.089 | | 20.2 | 21.1 | 0.90 | 0.001 | | | | | |
| 15 | | 159.6 | 152.3 | −7.26 | 0.001 | | 51.3 | 50.1 | −1.23 | 0.002 | | 20.9 | 21.5 | 0.63 | 0.001 | | | | | |
| 16 | | 160.5 | 153.0 | −7.53 | 0.001 | | 52.5 | 51.6 | −0.91 | 0.091 | | 21.6 | 22.0 | 0.43 | 0.004 | | | | | |
| 17 | | 160.7 | 152.9 | −7.80 | 0.001 | | 53.1 | 52.5 | −0.59 | 0.394 | | | | | | | | | | |
4. Discussion
Since the last century, Peru, as well as other Latin American countries, are experiencing epidemiological and nutritional transitions with not only dramatic decreases in malnutrition and stunting, but also increases in obesity [
29]. Furthermore, over the last decade the Peruvian population has undergone significant changes in living conditions that are highly related to the overall improvement in their economy and general health status [
18]. In this context, the use of simple, reliable and valid anthropometric indicators such as height, body mass, BMI, and WC, as well as their respective centile charts, are highly valuable tools in public health surveillance and epidemiology [
9].
The trends in height, body mass, BMI and WC of Peruvian children and adolescents were similar to other international data. In height and body mass, the individual variation expressed in terms of the range between the 3rd and 97th percentiles increased progressively with age through childhood and adolescence. Furthermore, there is high inter-individual variation starting at an early age and clearly expressed in the upper centiles. Additionally, the adiposity rebound starting at age 6–7 years was noted in Peruvian children and parallels the study of Rolland-Cachera
et al. [
30].
Peruvian children were shorter and lighter than North-American and Argentinean peers. One possible explanation may be rooted in genetic potential which has been previously suggested by several authors [
3,
10,
15]. Another additional factor relies on the fact that children who were born and live in high altitudes and/or subjected to chronic environmental stress, such as those living in the forest areas, had lower height and body mass values when compared to sea level standards [
31,
32]. Furthermore, nutritional stress, particularly in rural populations, plays an important role in co-regulating the growth process [
33], although some growth delay may be expected even when socio-economic and nutritional factors have been optimized [
34,
35]. It is widely accepted that BMI is a suitable anthropometric marker when assessing obesity in clinical and epidemiological settings [
36], while the WC is used as a relatively consistent indicator of cardio metabolic risk [
37]. The Peruvian 50th BMI centile was slightly higher than the North-American [
19] and similar to Argentinean [
21] reference. On the contrary, the 50th WC centile of Peruvian children was below the 50th WC centiles of North-Americans and Argentineans [
20,
22]. The interpretation of these results requires taking into account the morphological characteristics of the population. For example, Peruvian children have a lower relative leg length in comparison to their American peers, which directly influences their stature. This condition partly explains their higher BMI values. On the other hand, in the updating of the 2000 CDC centile charts body mass that corresponded to NHANES III was excluded in order to avoid significant modifications of BMI-for-age and body mass-for-age [
19]. Children and adolescents below the 5th centile may involve those with growth delay, genetically low stature, a phenotype or thrifty genotype or a complex mixture of all these factors [
38]. In the opposite, those above the 75th centile may be explained by the presence of a high prevalence of overweight and obesity in the studied population [
39]. For WC, comparisons are difficult because there are no international references accepted by the scientific community. The use of different WC measurement protocols limits comparisons between countries which may affect, for example, the estimations of obesity and cardio metabolic risk factors prevalence [
40]. The differences found when making comparisons with Argentine and American children can be partly explained by the use of different anatomical locations to measure WC. However, the WC increase in the preschool years may be a sign that this age is crucial for the emergence of central obesity [
22].
The lower stature and body mass of Peruvian children and adolescents in relation to North-American and Argentinean counterparts may be a result of genetic, geographical, cultural and socio-economic factors [
33,
34,
35]. However, socio-economic factors deserve further attention. It is well known that the economic situation in Peru has gradually improved in the last decade, which possibly gave rise to better life conditions to important sectors of the population [
17]. However, a sustained economic growth may not be enough to quench the poverty. In 2011, 17.8% of children under the age of 5 years suffered from chronic malnutrition, 7.8% suffered from global malnutrition and 1.5% suffered from acute malnutrition; in addition, 27.6% of pregnant women suffered from anemia [
41]. Notwithstanding, these rates have decreased in recent years. A 2012 report of the INS revealed a prevalence of overweight and obesity of 6.4% and 1.8%, respectively, in children less than 5 years of age [
42]. It was also reported that 34.4% of pregnant women were overweight, while 12.7% had shortfalls of weight, affecting in 2011 to nearly one of every eight women [
41]. Furthermore, the prevalence of overweight and obesity in Peruvian children, aged 6–11 years, was 21.7% and 7%, respectively [
43].
Height, body mass, BMI and WC centile charts provided in this article are based on data from a cross-sectional study of children and adolescents who attended public schools in Peru central region. In very general terms, they provide novel and useful information for monitoring the growth of children, as well as for the identification of children that maybe at risk of obesity, stunting and wasting, and maybe related to high central obesity given WC upper centiles. It represents an advance in the perspective of having national references. Notwithstanding the relevance of the present information, at least four limitations have to be stated: (1) despite the size of our sample, it is not representative of the total children and adolescents´ Peruvian population; (2) the cross-sectional outline of this study does not allow to dynamically analyze intra-individual changes that occur throughout the growing period as a result of complex biological and environmental interactions; (3) no information is presently available about the racial/ethnic composition of Peruvian schoolchildren, and so we were not able to stratify our sample according to this condition. Yet, we are confident that the present charts reflect Peruvian children and adolescent physical growth and will be useful to clinicians and educators throughout the country; (4) although the Argentinian data are 30–45 years old, they were recently (5 years ago) updated using LMS to provide growth charts. In addition, WC is frequently measured at different anatomical landmarks which cause problems with comparisons. We ask the readers to bear this information in mind.


