
Validation Analysis of a Geriatric Dehydration Screening Tool in Community-Dwelling and Institutionalized Elderly People

 ,
, 
Abstract
:1. Introduction
2. Experimental Section
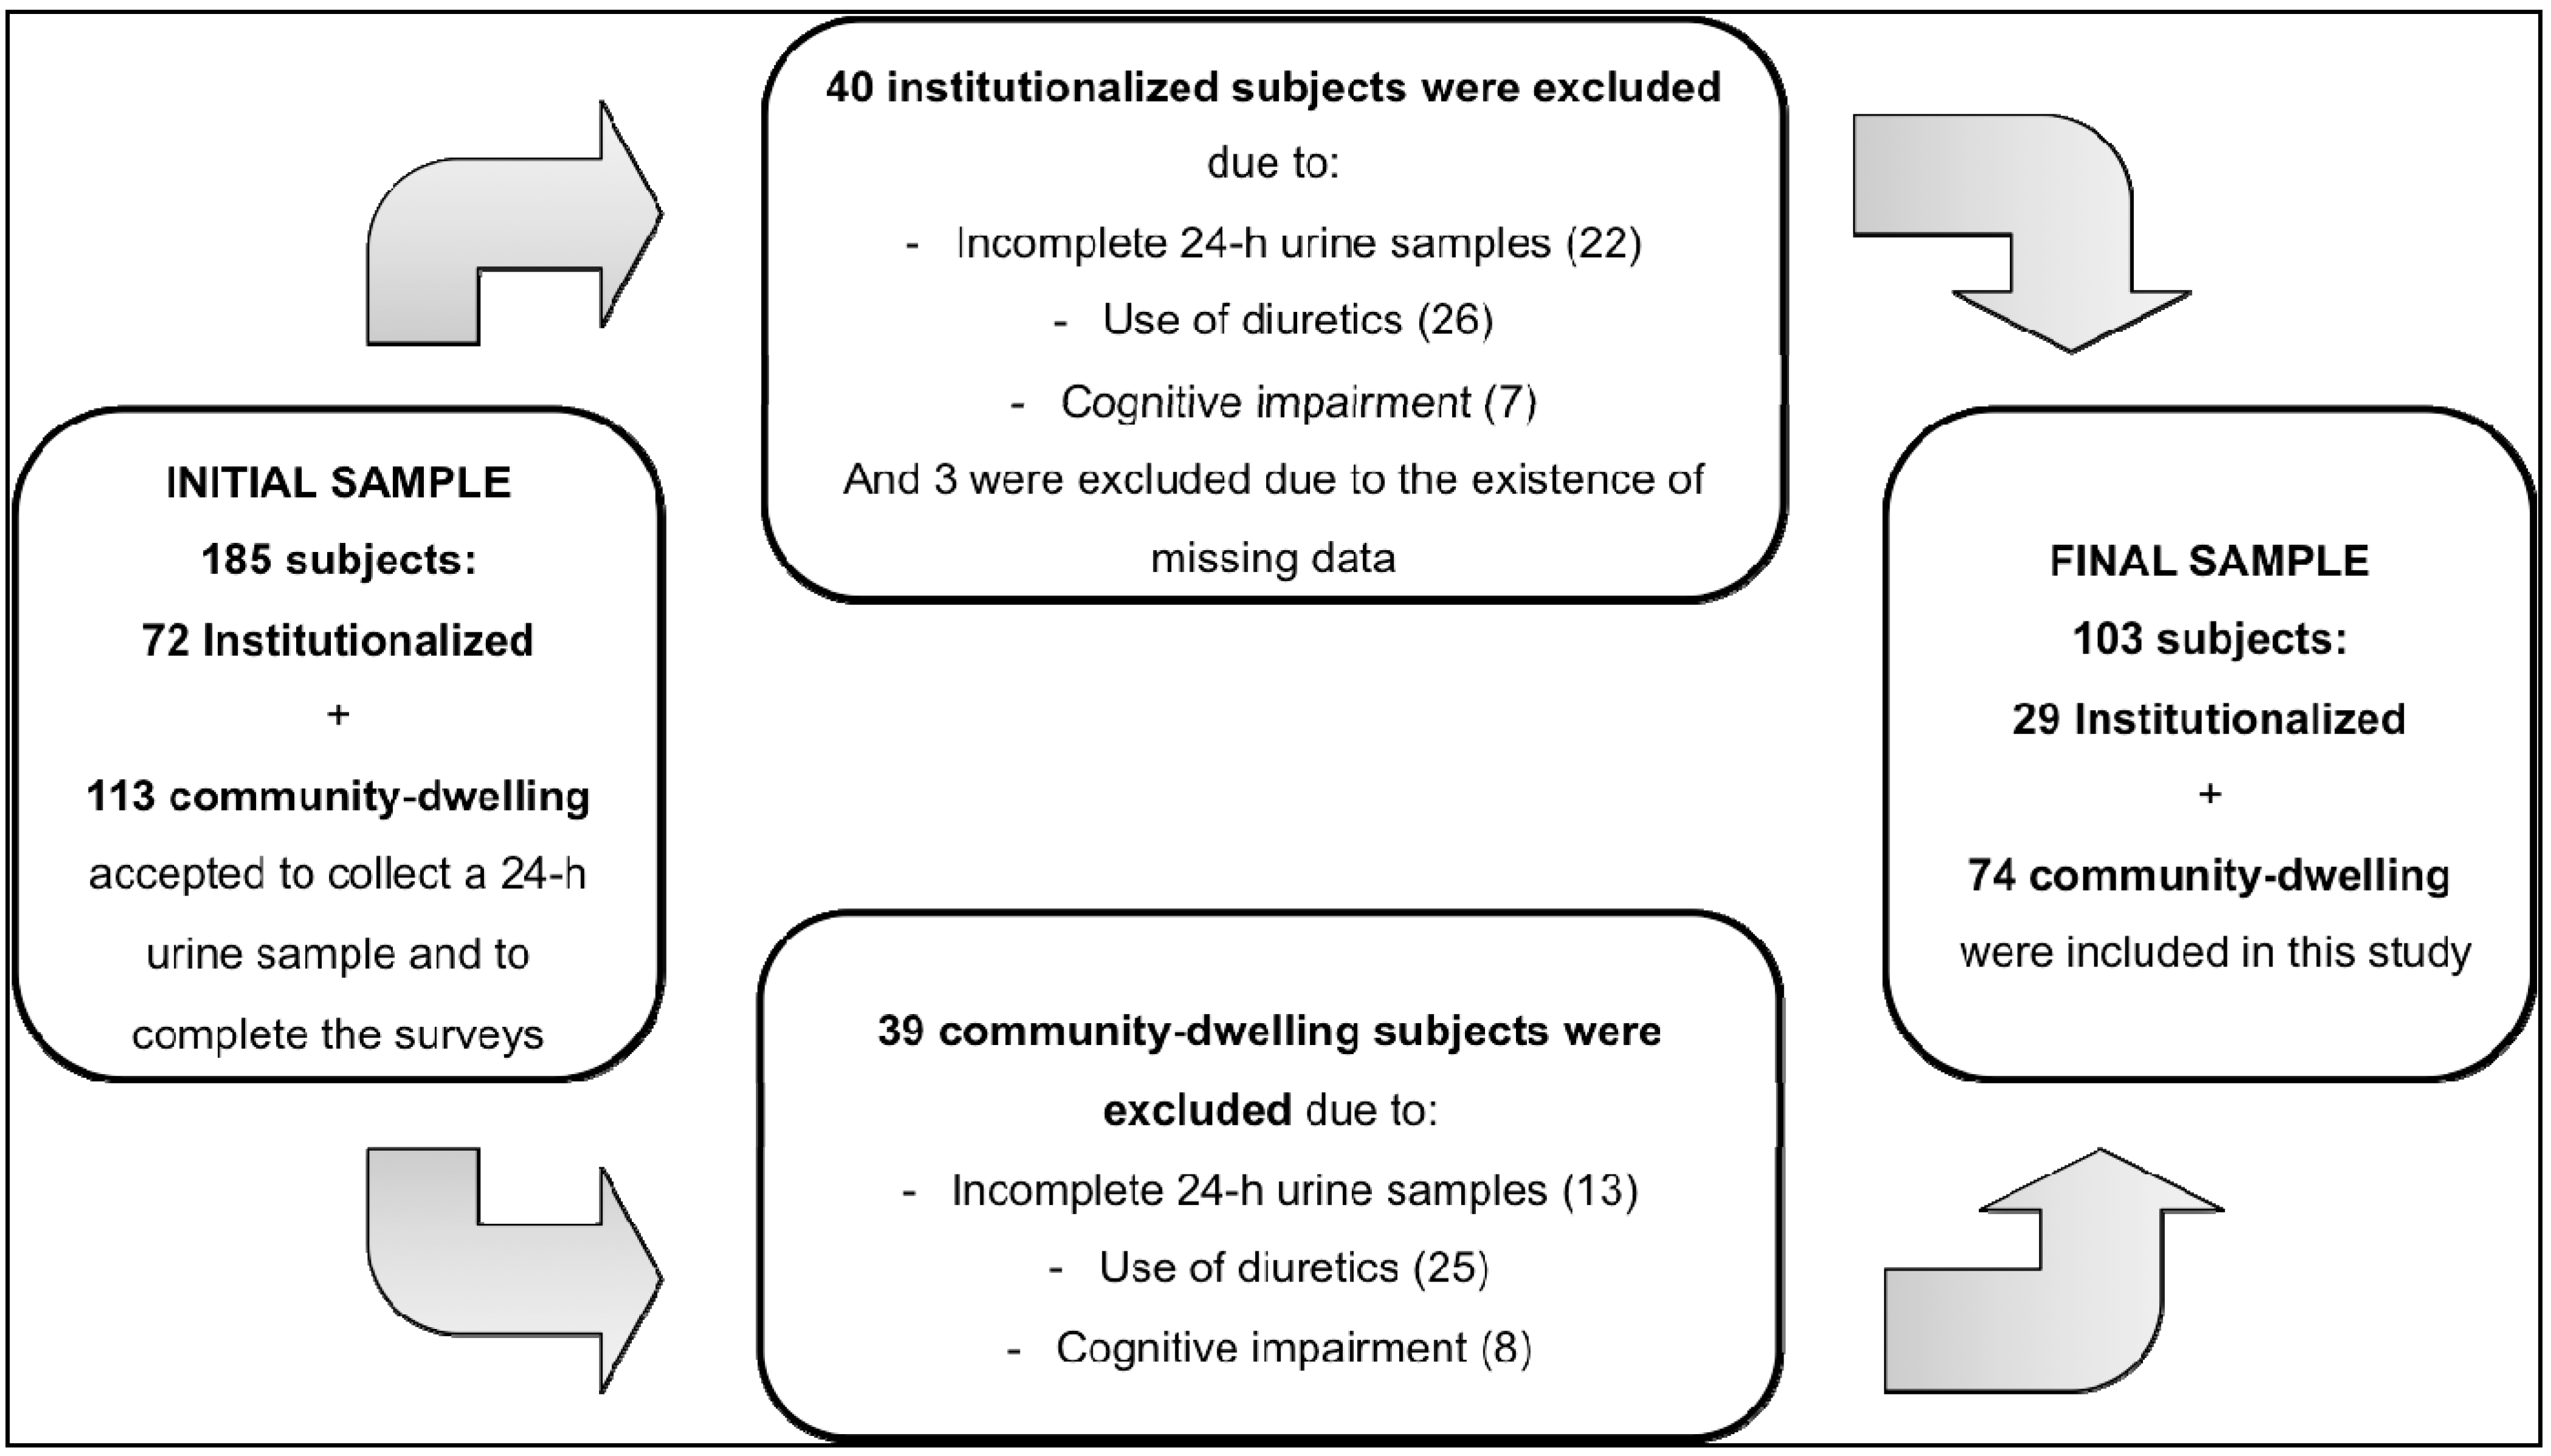
2.1. Study Design and Sample

2.2. Data Collection
2.3. Urine Collection and Hydration Markers
2.4. Dehydration Screening Tool
2.5. Statistical Analysis
3. Results and Discussion

| Characteristics | Institutionalized (n = 29) | Community-Dwelling (n = 74) | p-value | Total (n = 103) |
|---|---|---|---|---|
| Age (years), mean ± SD | 82.5 ± 7.2 | 70.2 ± 6.0 | <0.001 * | 73.7 ± 8.4 |
| 60–79 years | 8 (27.6%) | 67 (90.5%) | <0.001 ‡ | 75 (72.8%) |
| ≥80 years | 21 (72.4%) | 7 (9.5%) | -- | 28 (27.2%) |
| Sex, n (%) | ||||
| Male | 13 (44.8%) | 28 (37.8%) | 0.515 ‡ | 41 (39.8%) |
| Female | 16 (55.2%) | 46 (62.2%) | 62 (60.2%) | |
| Score MMSE, median (range) | 24 (22, 29) | 29 (22, 30) | <0.001 * | 28 (22, 30) |
| Education level, n (%) | ||||
| No schooling | 14 (48.3%) | 14 (18.9%) | 0.002 ‡ | 28 (27.2%) |
| Primary school | 15 (51.7%) | 29 (39.2%) | -- | 44 (42.7%) |
| Middle school | 0 (0.0%) | 19 (25.7%) | -- | 19 (18.4%) |
| Secondary school | 0 (0.0%) | 6 (8.1%) | -- | 6 (5.8%) |
| Higher school | 0 (0.0%) | 6 (8.1%) | -- | 6 (5.8%) |
| BMI (kg/m2), mean ± SD | 27.8 ± 4.0 | 27.1 ± 3.7 | 0.410 † | 27.3 ± 3.8 |
| Underweight (<18.5 kg/m2) | 1 (3.4%) | 2 (2.7%) | 0.644 ‡ | 3 (2.9%) |
| Normal weight (18.5–24.9 kg/m2) | 4 (13.8%) | 18 (24.3%) | -- | 22 (21.4%) |
| Overweight (25.0–29.9 kg/m2) | 15 (51.7%) | 37 (50.0%) | -- | 52 (50.5%) |
| Obesity (≥30 kg/m2) | 9 (31.0%) | 17 (23.0%) | -- | 26 (25.2%) |
| Total number of drugs, median (range) | 6 (1, 14) | 3 (0, 8) | < 0.001 * | 3 (0, 14) |
| Health condition, n (%) | ||||
| Hypertension | 23 (79.3%) | 39 (52.7%) | 0.010 ‡ | 62 (60.2%) |
| Dyslipidemias | 10 (34.5%) | 37 (50.5%) | 0.123 ‡ | 47 (45.6%) |
| Arthritis | 4 (13.8%) | 3 (4.1%) | 0.075 ‡ | 7 (6.8%) |
| Diabetes mellitus | 9 (31.0%) | 10 (13.5%) | 0.037 ‡ | 19 (18.4%) |
| Renal impairment | 0 (0.0%) | 4 (5.4%) | 0.206 ‡ | 4 (3.9%) |
| Alcoholic beverages consumption, n (%) | 4 (13.8%) | 28 (37.8%) | 0.014 ‡ | 32 (31.1%) |
| 24-h wine consumption (mL), median (range) § | 175 (100, 300) | 225 (40, 1250) | 0.931 * | 200 (40, 1250) |
| 24-h alcohol intake (g), median (range) § | 16.1 (9.2, 27.6) | 20.7 (3.7, 115.0) | 0.934 * | 18.4 (3.7, 115.0) |
| Urinary Parameters | Institutionalized (n = 29) | Community-dwelling (n = 74) | p-value | Total (n = 103) |
|---|---|---|---|---|
| Males | ||||
| 24-h urine volume, mL | 1750 (800, 2100) | 1835 (650, 3300) | 0.049 * | 1790 (650, 3300) |
| 24-h UOSM, mOsm/kg | 564 (391, 781) | 414 (225, 768) | 0.015 † | 462 (225, 781) |
| Renal solute excretion, mOsm/24-h | 880 (586, 1562) | 801 (499, 1262) | 0.195 * | 865 (499, 1562) |
| Free Water Reserve, mL/24-h | 134 (−537, 595) | 780 (−157, 1823) | <0.001 * | 461 (−537, 1823) |
| Females | ||||
| 24-h urine volume, mL | 1450 (750, 2800) | 1750 (760, 3450) | 0.927 * | 1625 (750, 3450) |
| 24-h UOSM, mOsm/kg | 380 (272, 620) | 377 (84, 799) | 0.129 * | 377 (84, 799) |
| Renal solute excretion, mOsm/24-h | 623 (257, 1056) | 619 (260, 1073) | 0.300 * | 621 (257, 1073) |
| Free Water Reserve, mL/24-h | 621 (−1, 1184) | 720 (−207, 2706) | 0.147 * | 706 (−207, 2706) |
| Dehydration Screening Tool (DST) Items | Pain Score (Factor 1) | Hydration Score (Factor 2) |
|---|---|---|
| 1—Do you ever feel thirsty? | 0.383 | 0.539 |
| 2—Did you feel thirsty yesterday? | 0.386 | 0.504 |
| 3—Do you have difficulty moving your shoulders, arms or hands? | −0.851 | −0.007 |
| 4— In the past 2 weeks, did pain interfere with your daily activities? | 0.987 | 0.161 |
| 5—In the past 2 weeks did you have problems with pain of any kind? | 0.785 | 0.044 |
| 6—In the last 2 weeks, did you drop something? | 0.466 | 0.037 |
| 7—How many times have you had a headache in the past week? | 0.569 | 0.278 |
| 8—Do you like to drink water? | 0.058 | −0.685 |
| 9—Do you usually drink at meals? | 0.064 | −0.189 |
| 10—If you have several beverages available, do you usually choose water? | 0.038 | −0.585 |
| 11—Are you concerned about being well hydrated? | 0.197 | −0.927 |
3.1. “Pain Score”, “Hydration Score” and Urinary Parameters
| Socio-Demographic Variables | n | Hydration Score | p-value * | Pain Score | p-value * |
|---|---|---|---|---|---|
| Settings | |||||
| Institutionalized | 29 | 3 (0, 5) | 0.013 | 3 (0, 5) | 0.003 |
| Community-dwelling | 74 | 2 (0, 5) | 1 (0, 5) | ||
| Age | |||||
| 60–79 years | 75 | 2 (0, 5) | 0.010 | 1 (0, 5) | 0.016 |
| ≥ 80 years | 28 | 3 (0, 5) | 3 (0, 5) | ||
| Sex | |||||
| Male | 41 | 2 (0, 5) | 0.989 | 1 (0, 4) | <0.001 |
| Female | 62 | 2 (0, 5) | 2 (0, 5) | ||
| Education level | |||||
| No schooling | 28 | 3 (0, 5) | 0.115 | 2 (0, 5) | 0.145 |
| At least primary level | 75 | 2 (0, 5) | 1 (0, 5) | ||
| BMI | |||||
| ≤27.0 kg/m2 | 52 | 2 (0, 5) | 0.793 | 1 (0, 5) | 0.774 |
| >27.0 kg/m2 | 51 | 2 (0, 5) | 1 (0, 5) |
| 24-h Urine Volume (mL) | ||||||
| Total Sample (n = 103) | Institutionalized (n = 29) | Community-Dwelling (n = 74) | ||||
| B (95% CI) | p value | B (95% CI) | p value | B (95% CI) | p value | |
| Model 1 * | ||||||
| Pain Score | −5.0 (−88.1, 78.2) | 0.906 | 124.0 (15.7, 232.3) | 0.026 | −32.7 (−146.7, 81.2) | 0.569 |
| Hydration Score | 61.9 (−39.1, 162.8) | 0.227 | 69.4 (−60.3, 199.1) | 0.282 | 123.8 (−20.9, 268.4) | 0.092 |
| Model 2 † | ||||||
| Pain Score | 25.1 (−65.9, 116.1) | 0.060 | 155.6 (39.6, 271.6) | 0.011 | −11.4 (−138.4, 115.6) | 0.858 |
| Hydration Score | 69.5 (−31.5, −170.5) | 0.135 | 75.9 (−62.5, 214.2) | 0.270 | 119.8 (−26.7, 266.3) | 0.107 |
| 24-h Urine Osmolality (mOsm/kg) | ||||||
| Total Sample (n = 103) | Institutionalized (n = 29) | Community-dwelling (n = 74) | ||||
| B (95% CI) | p value | B (95% CI) | p value | B (95% CI) | p value | |
| Model 1 * | ||||||
| Pain Score | −13.0 (−33.4, 7.4) | 0.208 | −45.9 (−77.2, −14.6) | 0.006 | −6.0 (−32.8, 20.8) | 0.658 |
| Hydration Score | −19.3 (−44.1, 5.5) | 0.126 | −15.4 (−55.3, 24.4) | 0.435 | −37.4 (−70.9, −3.8) | 0.029 |
| Model 2 † | ||||||
| Pain Score | −1.1 (−22.9, 20.7) | 0.921 | −29.6 (−59.4, 0.1) | 0.051 | 1.3 (−27.2, 29.7) | 0.929 |
| Hydration Score | −19.6 (−43.7, 4.5) | 0.109 | −10.3 (−44.5, 23.8) | 0.539 | −40.9 (−72.9, −9.0) | 0.013 |
| Free Water Reserve (mL/24-h) | ||||||
| Total Sample (n = 103) | Institutionalized (n = 29) | Community-dwelling (n = 74) | ||||
| B (95% CI) | p value | B (95% CI) | p value | B (95% CI) | p value | |
| Model 1 * | ||||||
| Pain Score | 17.4 (−62.8, 97.7) | 0.668 | 144.6 (60.4, 228.8) | 0.002 | 11.2 (−98.0, 120.5) | 0.838 |
| Hydration Score | 67.0 (−30.3, 164.4) | 0.175 | 72.2 (−37.7, 182.0) | 0.189 | 154.7 (18.3, 291.1) | 0.027 |
| Model 2 † | ||||||
| Pain Score | 7.5 (−79.0, 93.9) | 0.864 | 110.1 (26.6, 193.6) | 0.012 | −1.3 (−122.9, 120.3) | 0.983 |
| Hydration Score | 79.6 (−15.8, 175.0) | 0.101 | 45.8 (−54.1, 145.7) | 0.354 | 160.8 (23.1, 298.4) | 0.023 |
| Scores | Euhydrated | Hypohydrated | p-value |
|---|---|---|---|
| Total Sample, n | 91 | 12 | -- |
| Pain Score | 1 (0, 5) | 1 (0,3) | 0.280 † |
| Hydration Score | 2 (0, 5) | 2 (0, 5) | 0.290 † |
| Institutionalized, n | 23 | 6 | -- |
| Pain Score | 3 (0, 5) | 1.5 (0, 3) | 0.065 * |
| Hydration Score | 3 (0, 5) | 2.5 (0, 5) | 0.670 * |
| Community-dwelling, n | 68 | 6 | -- |
| Pain Score | 1 (0, 5) | 1 (0, 3) | 0.623 † |
| Hydration Score | 2 (0, 5) | 1.5 (1, 2) | 0.065 † |
3.2. Discussion
4. Conclusions
Acknowledgments
Author Contributions
Conflicts of Interest
References
- Maughan, R.J. Hydration, morbidity, and mortality in vulnerable populations. Nutr. Rev. 2012, 70, S152–S155. [Google Scholar] [CrossRef] [PubMed]
- Manz, F. Hydration and disease. J. Amer. Coll. Nutr. 2007, 26, S535–S541. [Google Scholar] [CrossRef]
- Vivanti, A.; Harvey, K.; Ash, S.; Battistutta, D. Clinical assessment of dehydration in older people admitted to hospital: What are the strongest indicators? Arch. Gerontol. Geriatr. 2008, 47, 340–355. [Google Scholar] [CrossRef] [PubMed]
- Bunn, D.; Jimoh, F.; Wilsher, S.H.; Hooper, L. Increasing fluid intake and reducing dehydration risk in older people living in long-term care: A systematic review. J. Amer. Med. Dir. Assn. 2015, 16, 101–113. [Google Scholar] [CrossRef]
- Vivanti, A.; Harvey, K.; Ash, S. Developing a quick and practical screen to improve the identification of poor hydration in geriatric and rehabilitative care. Arch. Gerontol. Geriatr. 2010, 50, 156–164. [Google Scholar] [CrossRef] [PubMed] [Green Version]
- Baron, S.; Courbebaisse, M.; Lepicard, E.M.; Friedlander, G. Assessment of hydration status in a large population. Brit. J. Nutr. 2015, 113, 147–158. [Google Scholar] [CrossRef]
- Shirreffs, S.M. Markers of hydration status. Eur. J. Clin. Nutr. 2003, 57, S6–S9. [Google Scholar] [CrossRef] [PubMed]
- Goldberg, L.R.; Heiss, C.J.; Parsons, S.D.; Foley, A.S.; Mefferd, A.S.; Hollinger, D.; Parham, D.F.; Patterson, J. Hydration in older adults: The contribution of bioelectrical impedance analysis. Int. J. Speech lang. Pathol. 2014, 16, 273–281. [Google Scholar] [CrossRef] [PubMed]
- Manz, F.; Wentz, A. 24-h hydration status: parameters, epidemiology and recommendations. Eur. J. Clin. Nutr. 2003, 57, S10–S18. [Google Scholar] [CrossRef] [PubMed]
- Lancaster, K.J.; Smiciklas-Wright, H.; Heller, D.A.; Ahern, F.M.; Jensen, G. Dehydration in Black and White older adults using diuretics. Ann. Epidemiol. 2003, 13, 525–529. [Google Scholar] [CrossRef] [PubMed]
- Wotton, K.; Crannitch, K.; Munt, R. Prevalence, risk factors and strategies to prevent dehydration in older adults. Contemp. Nurse 2008, 31, 44–56. [Google Scholar] [CrossRef] [PubMed]
- Morgado, J.; Rocha, C.S.; Maruta, C.; Guerreiro, M.; Martins, I.P. New normative values of Mini-mental state examination. Sinapse 2009, 9, 10–16. [Google Scholar]
- Folstein, M.F.; Folstein, S.E.; McHugh, P.R. “Mini-mental state”. A practical method for grading the cognitive state of patients for the clinician. J. Psychiatr. Res. 1975, 12, 189–198. [Google Scholar] [CrossRef] [PubMed]
- Liu, L.; Ikeda, K.; Yamori, Y. Inverse relationship between urinary markers of animal protein intake and blood pressure in Chinese: Results from the WHO cardiovascular diseases and alimentary comparison (CARDIAC) study. Int. J. Epidemiol. 2002, 31, 227–233. [Google Scholar] [CrossRef] [PubMed]
- Vivanti, A. Screening and Identification of Dehydration in Older People Admitted to a Geriatric and Rehabilitation Unit. Ph.D. Dissertation/Thesis, Queensland University of Technology, Queensland, Australia, 2007. [Google Scholar]
- Sanchez-Garcia, S.; Garcia-Pena, C.; Duque-Lopez, M.X.; Juarez-Cedillo, T.; Cortes-Nunez, A.R.; Reyes-Beaman, S. Anthropometric measures and nutritional status in a healthy elderly population. BMC Public Health 2007, 7. [Google Scholar] [CrossRef]
- Obesity: Preventing and Managing the Global Epidemic. Report of a WHO Consultation; World Health Organization: Geneva, Switzerland, 2000; Volume 894, pp. 1–253.
- Physical Status: The Use and Interpretation of Anthropometry. Report of a WHO Expert Committee; Health Organization: Geneva, Switzerland, 1995; Volume 854, pp. 1–452.
- Shirreffs, S.M.; Maughan, R.J. Restoration of fluid balance after exercise-induced dehydration: Effects of alcohol consumption. J. Appl. Physiol. 1997, 83, 1152–1158. [Google Scholar] [PubMed]
- Hobson, R.M.; Maughan, R.J. Hydration status and the diuretic action of a small dose of alcohol. Alcohol Alcohol. 2010, 45, 366–373. [Google Scholar] [CrossRef] [PubMed]
- Rombo, M.M.; Silveira, D.; Martins, I.; Cruz, A. Modelos Fotográficos para Inquéritos Alimentares; Centro de Estudos de Nutrição do Instituto Nacional de Saúde Dr. Ricardo Jorge: Lisbon, Portugal, 1996. (In Portuguese) [Google Scholar]
- INSA: Tabela da Composição dos Alimentos; Instituto Nacional de Saúde Dr. Ricardo Jorge: Lisbon, Portugal, 2006. (In Portuguese)
- Armstrong, L.E. Assessing hydration status: the elusive gold standard. J. Amer. Coll. Nutr. 2007, 26, S575–S584. [Google Scholar] [CrossRef]
- Manz, F.; Wentz, A. Hydration status in the United States and Germany. Nutr. Rev. 2005, 63, S55–S62. [Google Scholar] [CrossRef] [PubMed]
- Manz, F.; Johner, S.A.; Wentz, A.; Boeing, H.; Remer, T. Water balance throughout the adult life span in a German population. Brit. J. Nutr. 2012, 107, 1673–1681. [Google Scholar] [CrossRef] [PubMed]
- Stevens, J. Applied Multivariate Statistics for the Social Sciences, 2nd ed.; Hillsdale, N.J., Ed.; Lawrence Erlbaum Associates: London, UK, 1992. [Google Scholar]
- Basic Item Analysis for Multiple-Choice Tests; ERIC Clearinghouse on Assessment and Evaluation. Available online: http://ericae.net/digests/tm9511.htm (accessed on 27 February 2015).
- Phillips, P.A.; Rolls, B.J.; Ledingham, J.G.; Forsling, M.L.; Morton, J.J.; Crowe, M.J.; Wollner, L. Reduced thirst after water deprivation in healthy elderly men. N. Engl. J. Med. 1984, 311, 753–759. [Google Scholar] [CrossRef] [PubMed]
- Gross, C.R.; Lindquist, R.D.; Woolley, A.C.; Granieri, R.; Allard, K.; Webster, B. Clinical indicators of dehydration severity in elderly patients. J. Emerg. Med. 1992, 10, 267–274. [Google Scholar] [CrossRef] [PubMed]
- Kenney, W.L.; Chiu, P. Influence of age on thirst and fluid intake. Med. Sci. Sport. Exerc. 2001, 33, 1524–1532. [Google Scholar] [CrossRef]
- Rosler, A.; Lehmann, F.; Krause, T.; Wirth, R.; von Renteln-Kruse, W. Nutritional and hydration status in elderly subjects: Clinical rating vs. bioimpedance analysis. Arch. Gerontol. Geriatr. 2010, 50, 81–85. [Google Scholar] [CrossRef]
- Popkin, B.M.; D’Anci, K.E.; Rosenberg, I.H. Water, hydration, and health. Nutr. Rev. 2010, 68, 439–458. [Google Scholar] [CrossRef] [PubMed]
- Millard-Stafford, M.; Wendland, D.M.; O’Dea, N.K.; Norman, T.L. Thirst and hydration status in everyday life. Nutr. Rev. 2012, 70, S147–S151. [Google Scholar] [CrossRef] [PubMed]
- Gaspar, P.M. Comparison of four standards for determining adequate water intake of nursing home residents. Res. Theory Nurs. Pract. 2011, 25, 11–22. [Google Scholar] [CrossRef] [PubMed]
- Lavizzo-Mourey, R.; Johnson, J.; Stolley, P. Risk factors for dehydration among elderly nursing home residents. J. Amer. Geriatr. Soc. 1988, 36, 213–218. [Google Scholar]
- Leiper, J.B.; Seonaid Primrose, C.; Primrose, W.R.; Phillimore, J.; Maughan, R.J. A comparison of water turnover in older people in community and institutional settings. J. Nutr. Health Aging 2005, 9, 189–193. [Google Scholar] [PubMed]
- Kayser-Jones, J.; Schell, E.S.; Porter, C.; Barbaccia, J.C.; Shaw, H. Factors contributing to dehydration in nursing homes: inadequate staffing and lack of professional supervision. J. Amer. Geriatr. Soc. 1999, 47, 1187–1194. [Google Scholar]
- Spangler, A.A.; Chidester, J.C. Age, dependency and other factors influencing fluid intake by long term care residents. J. Nutr. Elder. 1999, 18, 21–35. [Google Scholar] [CrossRef]
- Gaspar, P.M. Water intake of nursing home residents. J. Gerontol. Nurs. 1999, 25, 23–29. [Google Scholar] [CrossRef] [PubMed]
- Mentes, J.C.; Culp, K. Reducing hydration-linked events in nursing home residents. Clin. Nurs. Res. 2003, 12, 210–225. [Google Scholar] [CrossRef] [PubMed]
- Mentes, J. Oral hydration in older adults: Greater awareness is needed in preventing, recognizing, and treating dehydration. Amer. J. Nurs. 2006, 106, 40–49. [Google Scholar] [CrossRef]
- Luppa, M.; Luck, T.; Weyerer, S.; Konig, H.H.; Brahler, E.; Riedel-Heller, S.G. Prediction of institutionalization in the elderly: A systematic review. Age Ageing 2010, 39, 31–38. [Google Scholar] [CrossRef] [PubMed]
- Luppa, M.; Riedel-Heller, S.G.; Luck, T.; Wiese, B.; van den Bussche, H.; Haller, F.; Sauder, M.; Mosch, E.; Pentzek, M.; Wollny, A.; et al. Age-related predictors of institutionalization: Results of the German study on ageing, cognition and dementia in primary care patients (AgeCoDe). Soc. Psychiat. Psychiatr. Epidemiol. 2012, 47, 263–270. [Google Scholar] [CrossRef]
- Wu, S.J.; Wang, H.H.; Yeh, S.H.; Wang, Y.H.; Yang, Y.M. Hydration status of nursing home residents in Taiwan: A cross-sectional study. J. Adv. Nurs. 2011, 67, 583–590. [Google Scholar] [CrossRef] [PubMed]
- Chidester, J.C.; Spangler, A.A. Fluid intake in the institutionalized elderly. J. Amer. Diet. Assn. 1997, 97, 23–28. [Google Scholar] [CrossRef]
- Presse, N.; Ferland, G. Risk factors contributing to insufficient water intake in elderly living in nursing homes and long-term care units: a review of the literature. Can. J. Diet. Pract. Res. 2010, 71, 94–99. [Google Scholar] [CrossRef]
- Mentes, J.C. A typology of oral hydration problems exhibited by frail nursing home residents. J. Gerontol. Nurs. 2006, 32, 13–19. [Google Scholar] [CrossRef] [PubMed]
- Shimizu, M.; Kinoshita, K.; Hattori, K.; Ota, Y.; Kanai, T.; Kobayashi, H.; Tokuda, Y. Physical signs of dehydration in the elderly. Intern. Med. 2012, 51, 1207–1210. [Google Scholar] [CrossRef] [PubMed]
- Kinoshita, K.; Hattori, K.; Ota, Y.; Kanai, T.; Shimizu, M.; Kobayashi, H.; Tokuda, Y. The measurement of axillary moisture for the assessment of dehydration among older patients: A pilot study. Exp. Gerontol. 2013, 48, 255–258. [Google Scholar] [CrossRef] [PubMed] [Green Version]
- Weinberg, A.D.; Minaker, K.L. Dehydration. Evaluation and management in older adults. Council on Scientific Affairs, American Medical Association. JAMA 1995, 274, 1552–1556. [Google Scholar] [CrossRef] [PubMed]
- Bennett, J.A.; Thomas, V.; Riegel, B. Unrecognized chronic dehydration in older adults: Examining prevalence rate and risk factors. J. Gerontol. Nurs. 2004, 30, 22–28. [Google Scholar] [CrossRef] [PubMed]
© 2015 by the authors; licensee MDPI, Basel, Switzerland. This article is an open access article distributed under the terms and conditions of the Creative Commons Attribution license (http://creativecommons.org/licenses/by/4.0/).
Share and Cite
Rodrigues, S.; Silva, J.; Severo, M.; Inácio, C.; Padrão, P.; Lopes, C.; Carvalho, J.; Carmo, I.D.; Moreira, P. Validation Analysis of a Geriatric Dehydration Screening Tool in Community-Dwelling and Institutionalized Elderly People. Int. J. Environ. Res. Public Health 2015, 12, 2700-2717. https://doi.org/10.3390/ijerph120302700
Rodrigues S, Silva J, Severo M, Inácio C, Padrão P, Lopes C, Carvalho J, Carmo ID, Moreira P. Validation Analysis of a Geriatric Dehydration Screening Tool in Community-Dwelling and Institutionalized Elderly People. International Journal of Environmental Research and Public Health. 2015; 12(3):2700-2717. https://doi.org/10.3390/ijerph120302700
Chicago/Turabian StyleRodrigues, Susana, Joana Silva, Milton Severo, Cátia Inácio, Patrícia Padrão, Carla Lopes, Joana Carvalho, Isabel Do Carmo, and Pedro Moreira. 2015. "Validation Analysis of a Geriatric Dehydration Screening Tool in Community-Dwelling and Institutionalized Elderly People" International Journal of Environmental Research and Public Health 12, no. 3: 2700-2717. https://doi.org/10.3390/ijerph120302700
APA StyleRodrigues, S., Silva, J., Severo, M., Inácio, C., Padrão, P., Lopes, C., Carvalho, J., Carmo, I. D., & Moreira, P. (2015). Validation Analysis of a Geriatric Dehydration Screening Tool in Community-Dwelling and Institutionalized Elderly People. International Journal of Environmental Research and Public Health, 12(3), 2700-2717. https://doi.org/10.3390/ijerph120302700