1. Introduction
Traditionally, the hygienic quality of raw water used for drinking water production is monitored by weekly or monthly samples, which are analyzed for fecal indicator bacteria. When results from several years are available, these routine samples provide a good indication of the level of fecal contamination in the raw water and of seasonal and annual variation. Such information, combined with microbial risk assessment, is important for determining sufficient water treatment and disinfection to ensure safe drinking water. Weekly samples, however, do not necessarily reflect the deterioration of the raw water quality during acute pollution episodes, e.g., caused by heavy rainfall [
1]. Such information may be important for the optimization and daily control of the drinking water treatment plant.
An “ideal” method for monitoring hygienic drinking water quality is simple, but also sensitive, e.g., detects low levels of pathogens, and specific,
i.e., does not detect non-target/harmless substances, including non-viable cells. The method is fully automated, and the measured data is available continuously without delay, preferably in “real time” or within a timeframe that allows corrective actions to be taken. Such an “ideal” method does not exist; all methods seem to compromise one or more of the criteria above. Standard methods for detection of fecal contamination in drinking water, which are based on growth of fecal indicator bacteria on selective media, are done manually in laboratories and require 18–72 h before the result is available. Methods based on molecular detection are being continuously improved and are now reported to be sensitive enough for routine monitoring of drinking water quality [
2], but the development of on-line sensors based on molecular detection is difficult, as well as the differentiation between viable and non-viable microbes. Measurement of surrogate parameters, like spectral absorption coefficients or Adenosine triphosphate (ATP), has been suggested [
3,
4], but is not specific for fecal contamination.
Escherichia coli (
E. coli) is still the preferred indicator of fecal pollution in drinking water sources, although there is increased focus on the shortcomings of
E. coli as indicator organism for enteric viruses and protozoa, in particular in treated drinking water [
5]. Automated methods for detection of
E. coli exist, but still need up to 14 h for detection of 1
E. coli/100 mL [
6]. The main advantage of using fully automated methods is there is no need for manual water collection and analysis; water samples may be taken during the nights and on the weekends as well. In this paper, results are presented from two years with daily monitoring of
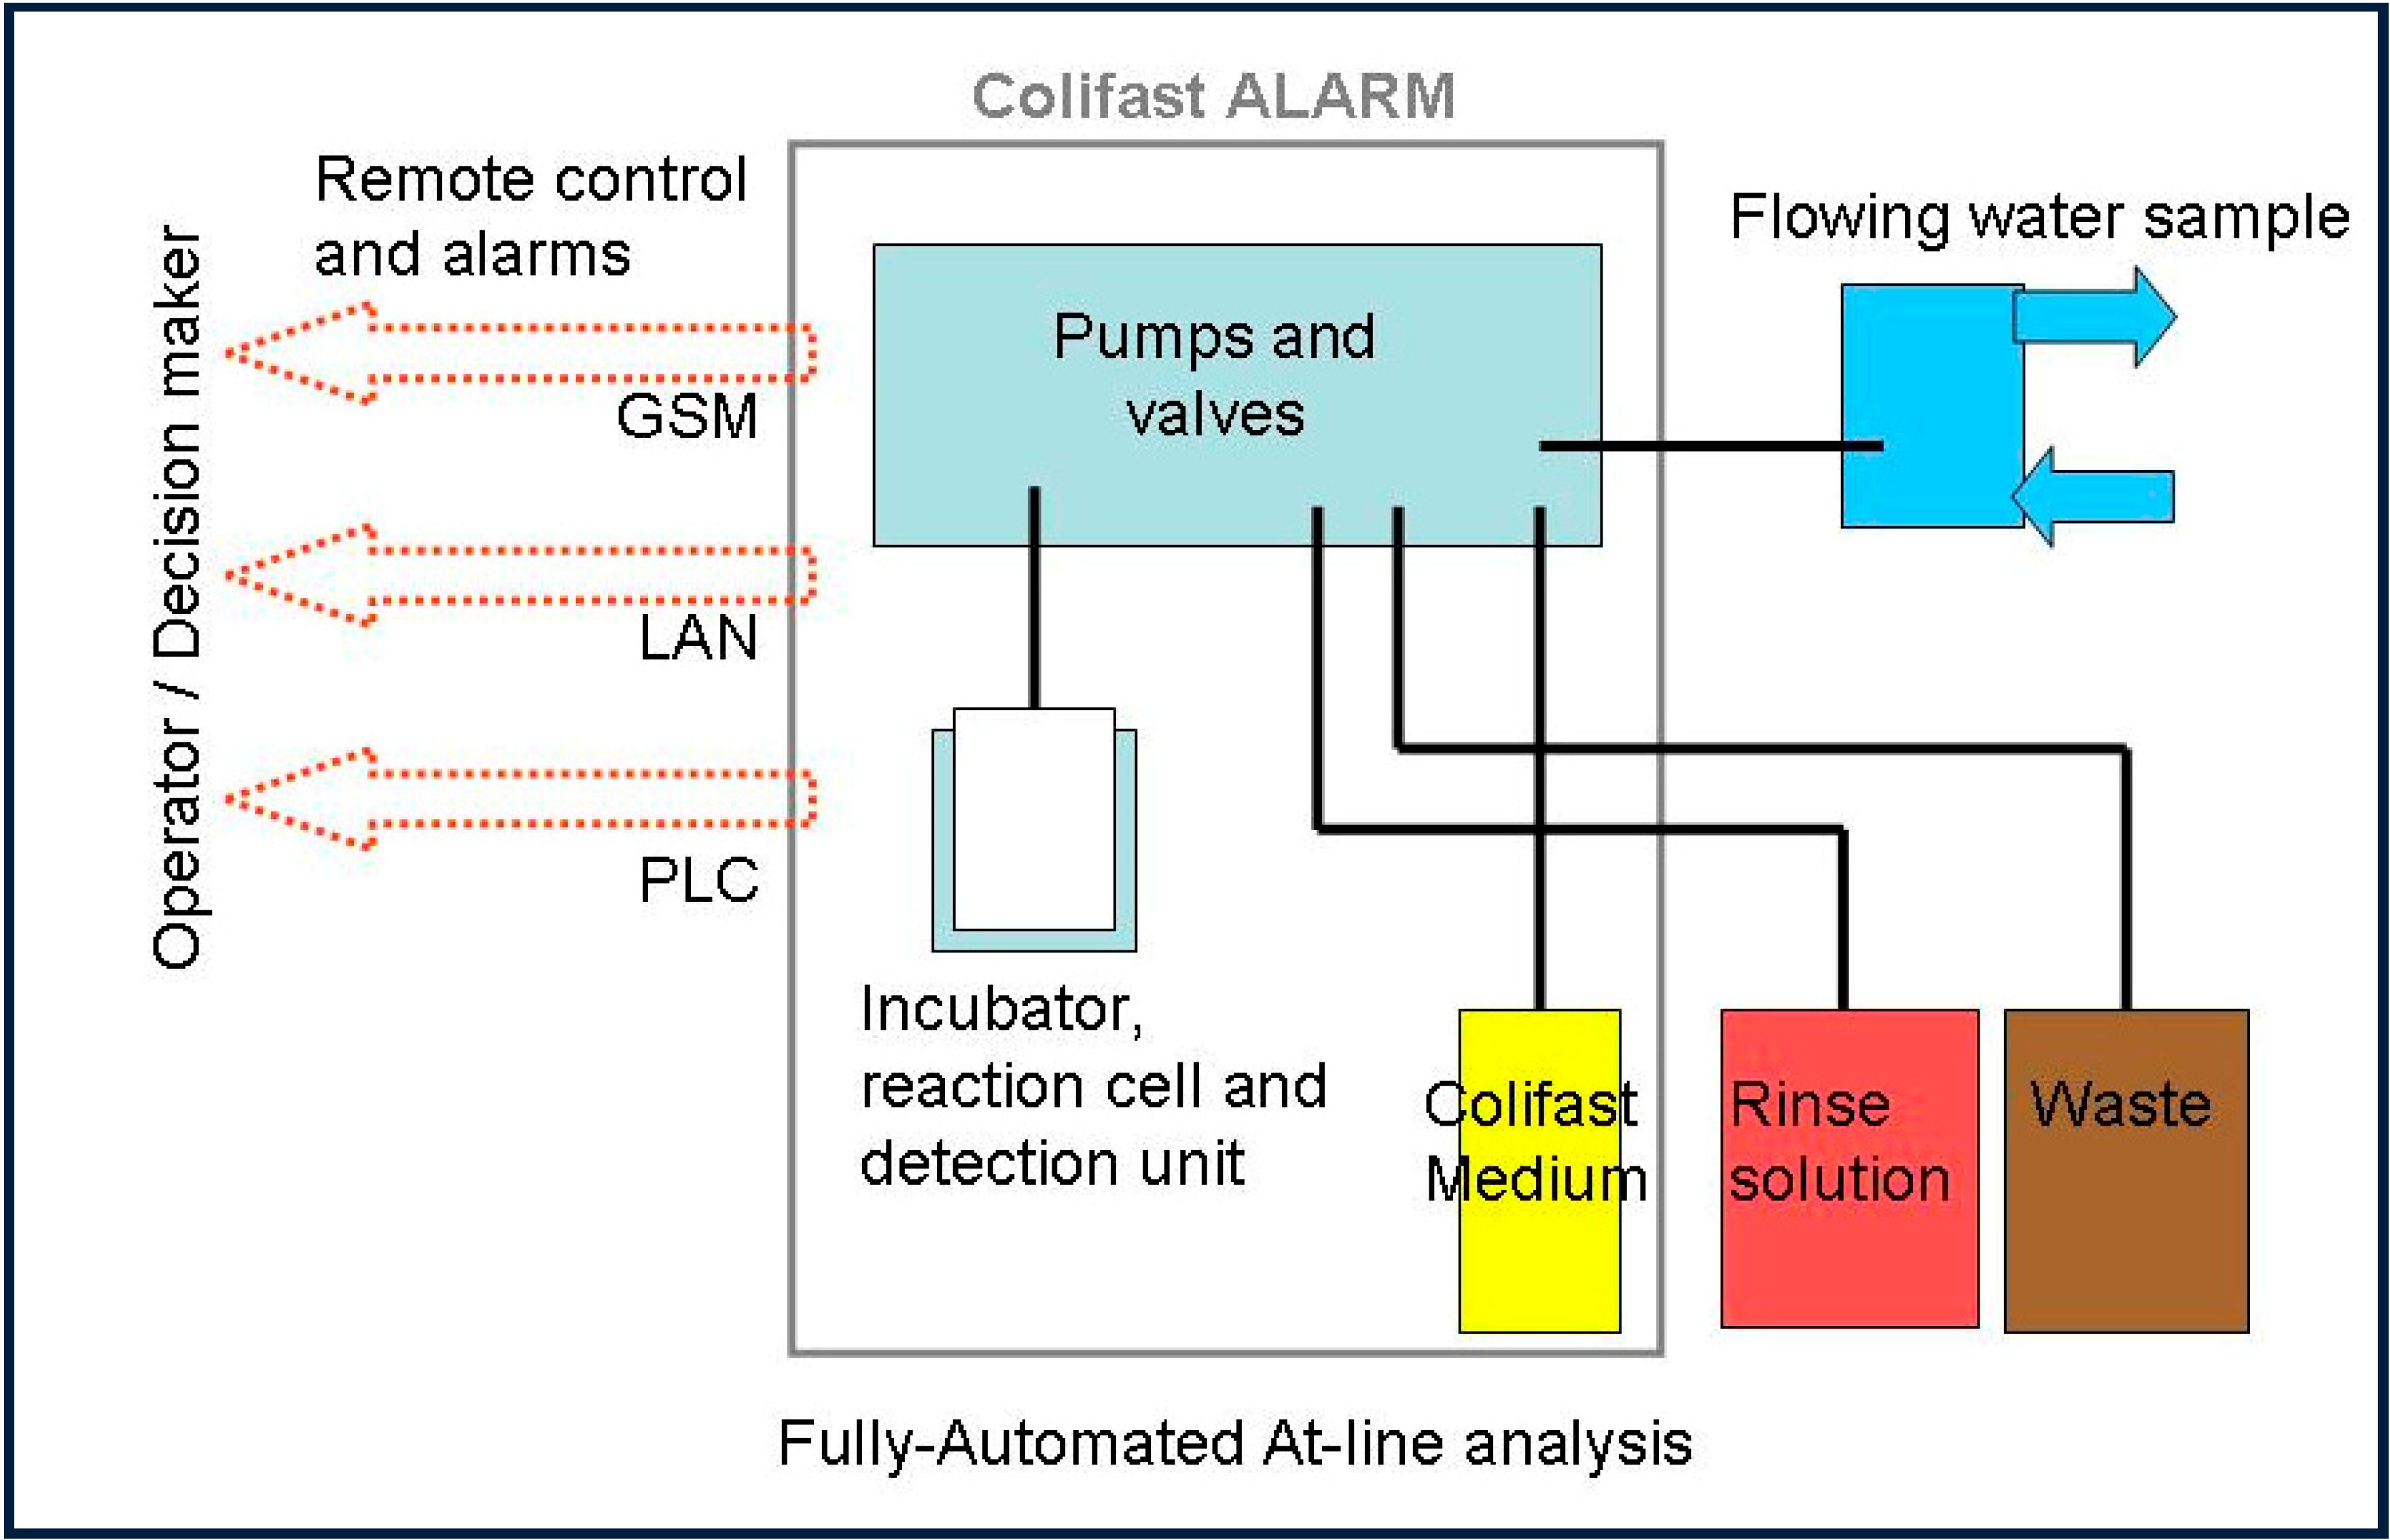
E. coli in the raw water of Oset drinking water treatment plant, using the fully automated Colifast ALARM
TM instrument The purpose of the study was to evaluate the usefulness of daily automated monitoring compared with weekly manual monitoring, as well as to obtain more information about factors that may influence the transport of
E. coli from fecal sources in the catchment area to the raw water intake at 35 m depth in Lake Maridalsvannet,
i.e., investigate the hygienic barrier efficiency of the drinking water source under different weather conditions and seasons.
3. Results and Discussion
Historical data from weekly samples from the last 10 years, monitored by the WTP, showed that the hygienic quality of the raw water taken from Lake Maridalsvannet in general has been good, with low prevalence of
E. coli (
Figure 3 and
Figure 4). This was also supported by the weekly monitoring of
Giardia and
Cryptosporidium in the raw water from the years 2013–2014, where
Cryptosporidium oocysts were not detected and
Giardia cysts were detected in 4 of 81 weekly samples (1
Giardia cyst per 10 L the three days 14 October 2013, 1 September 2014 and 22 September 2014 and 2
Giardia cysts per 10 L in the sample taken 21 October 2013).
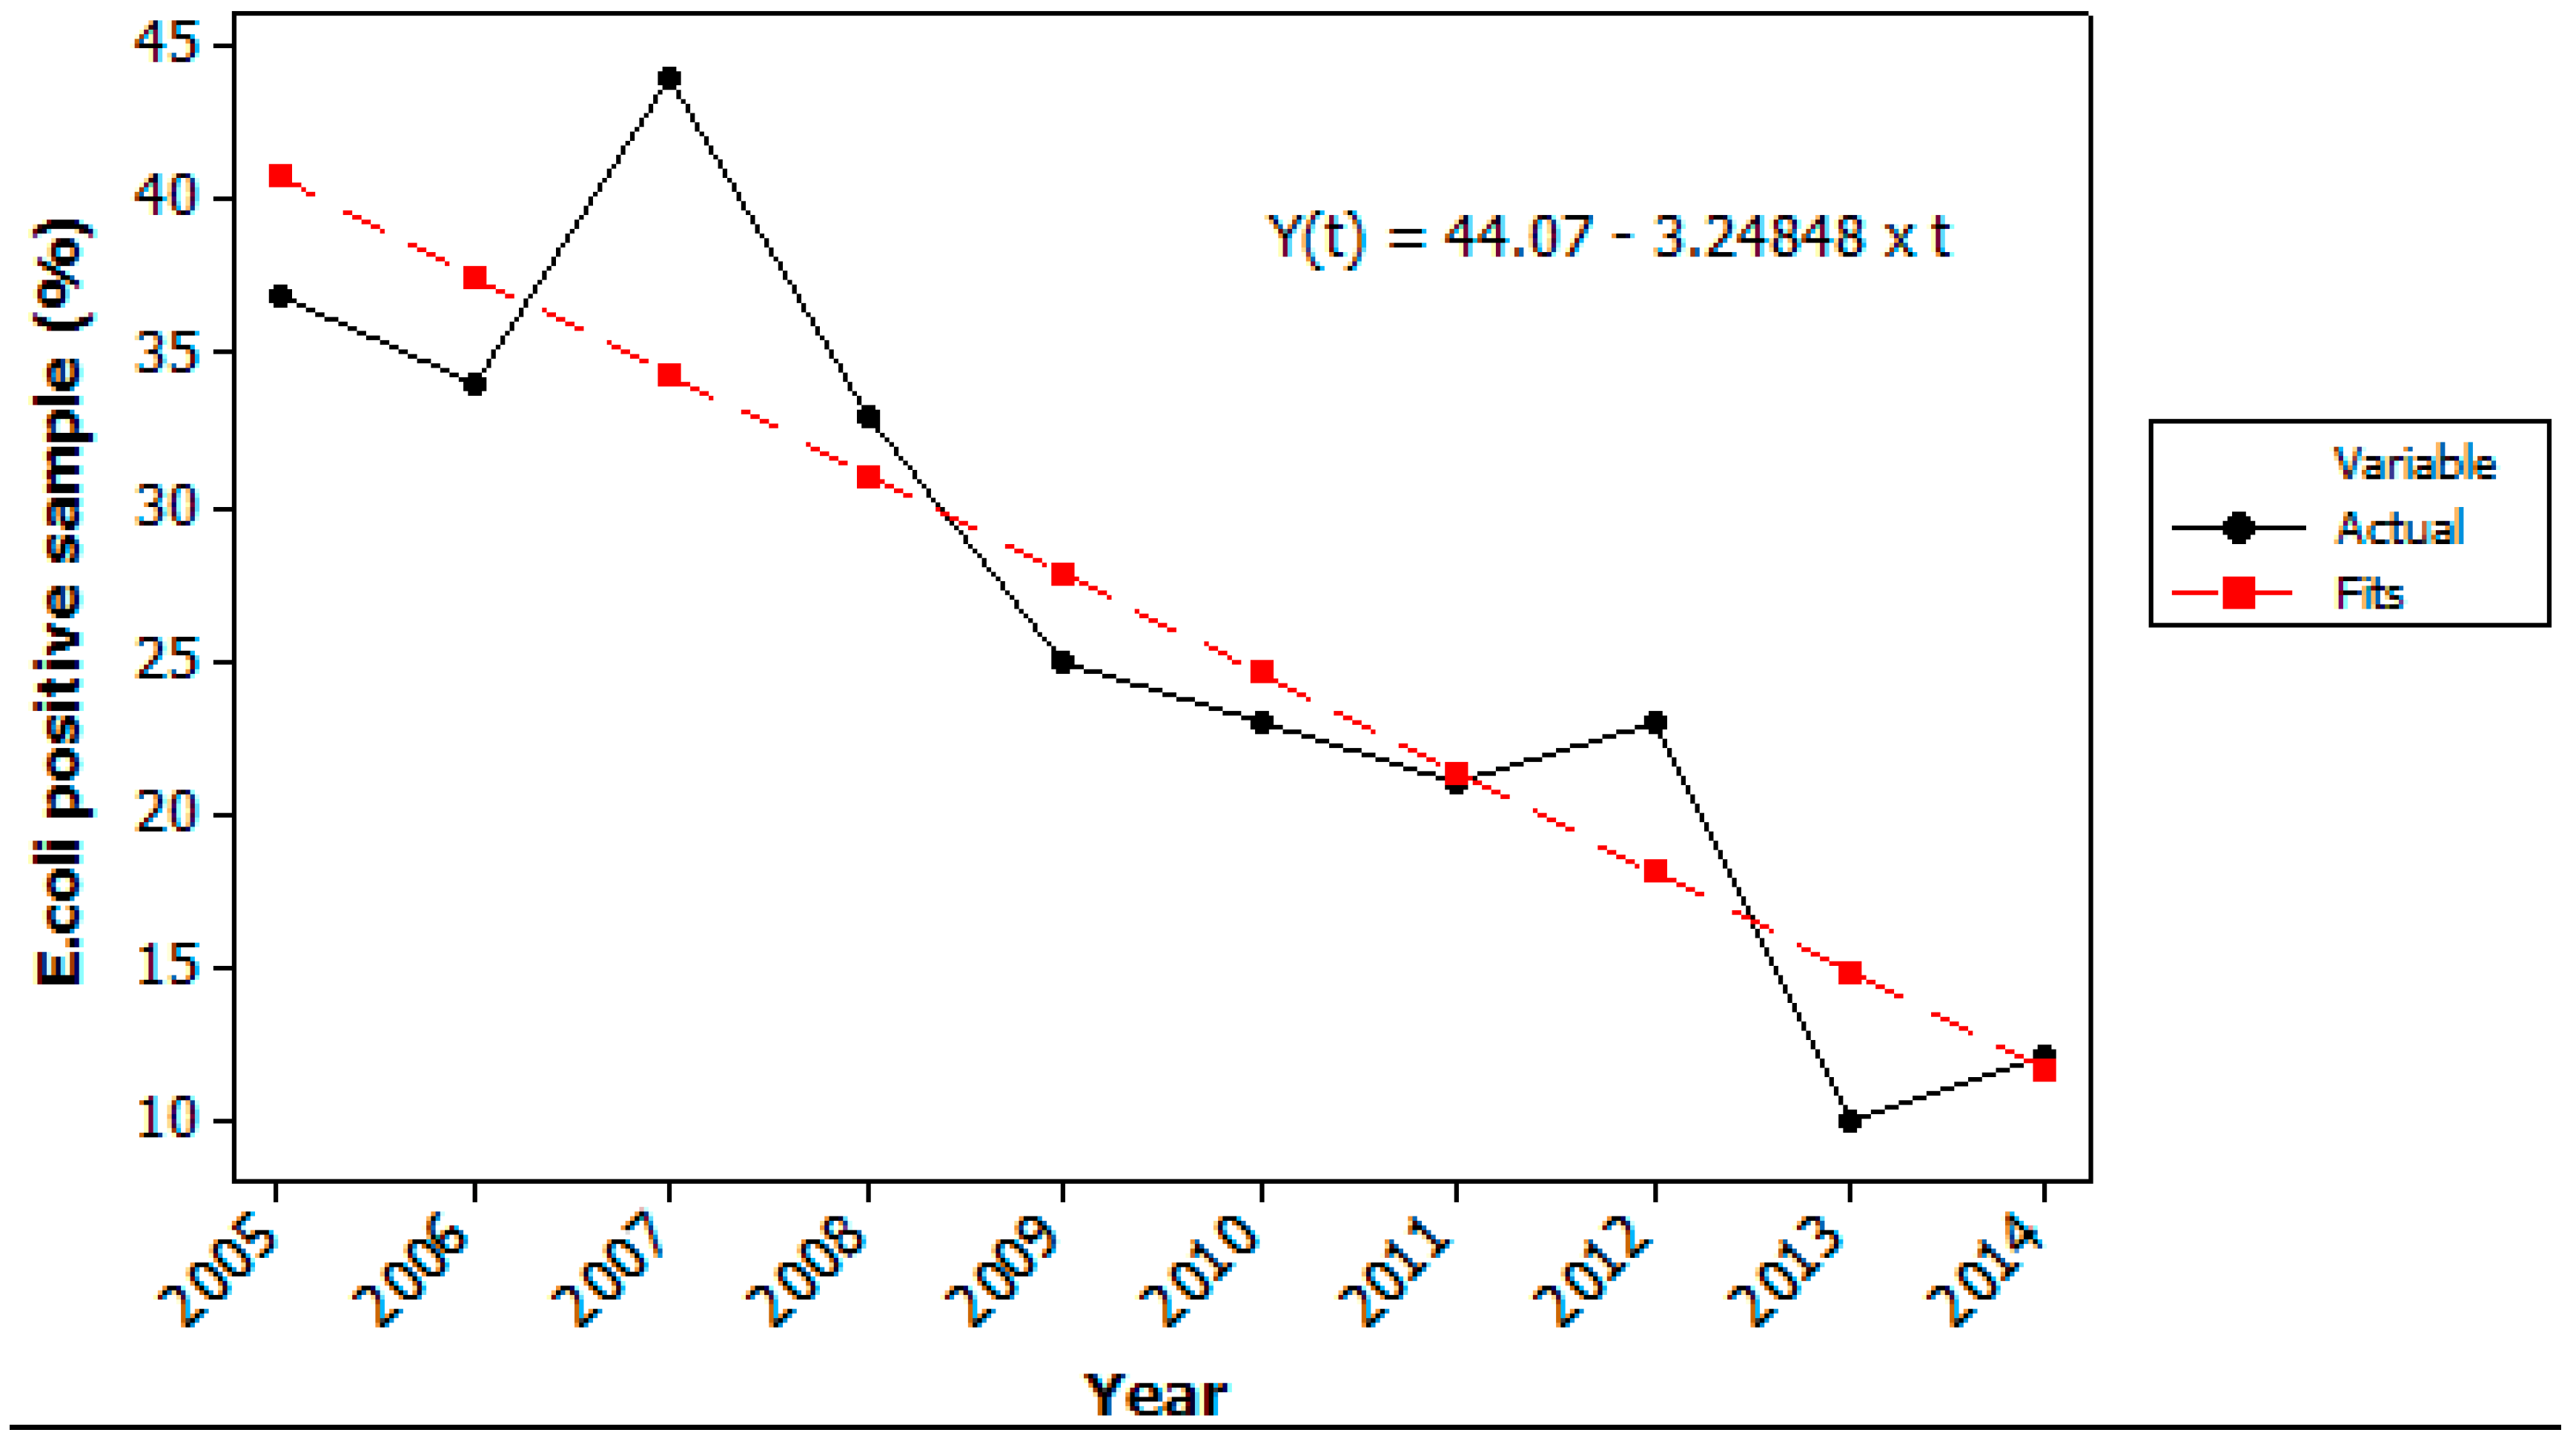
Figure 3.
Detection of Escherichia coli in the raw water at Oset water treatment plant by weekly routine samples. The figure shows % of the 52 ± 2 weekly samples where E. coli was detected each year from 2005–2014.
Figure 3.
Detection of Escherichia coli in the raw water at Oset water treatment plant by weekly routine samples. The figure shows % of the 52 ± 2 weekly samples where E. coli was detected each year from 2005–2014.
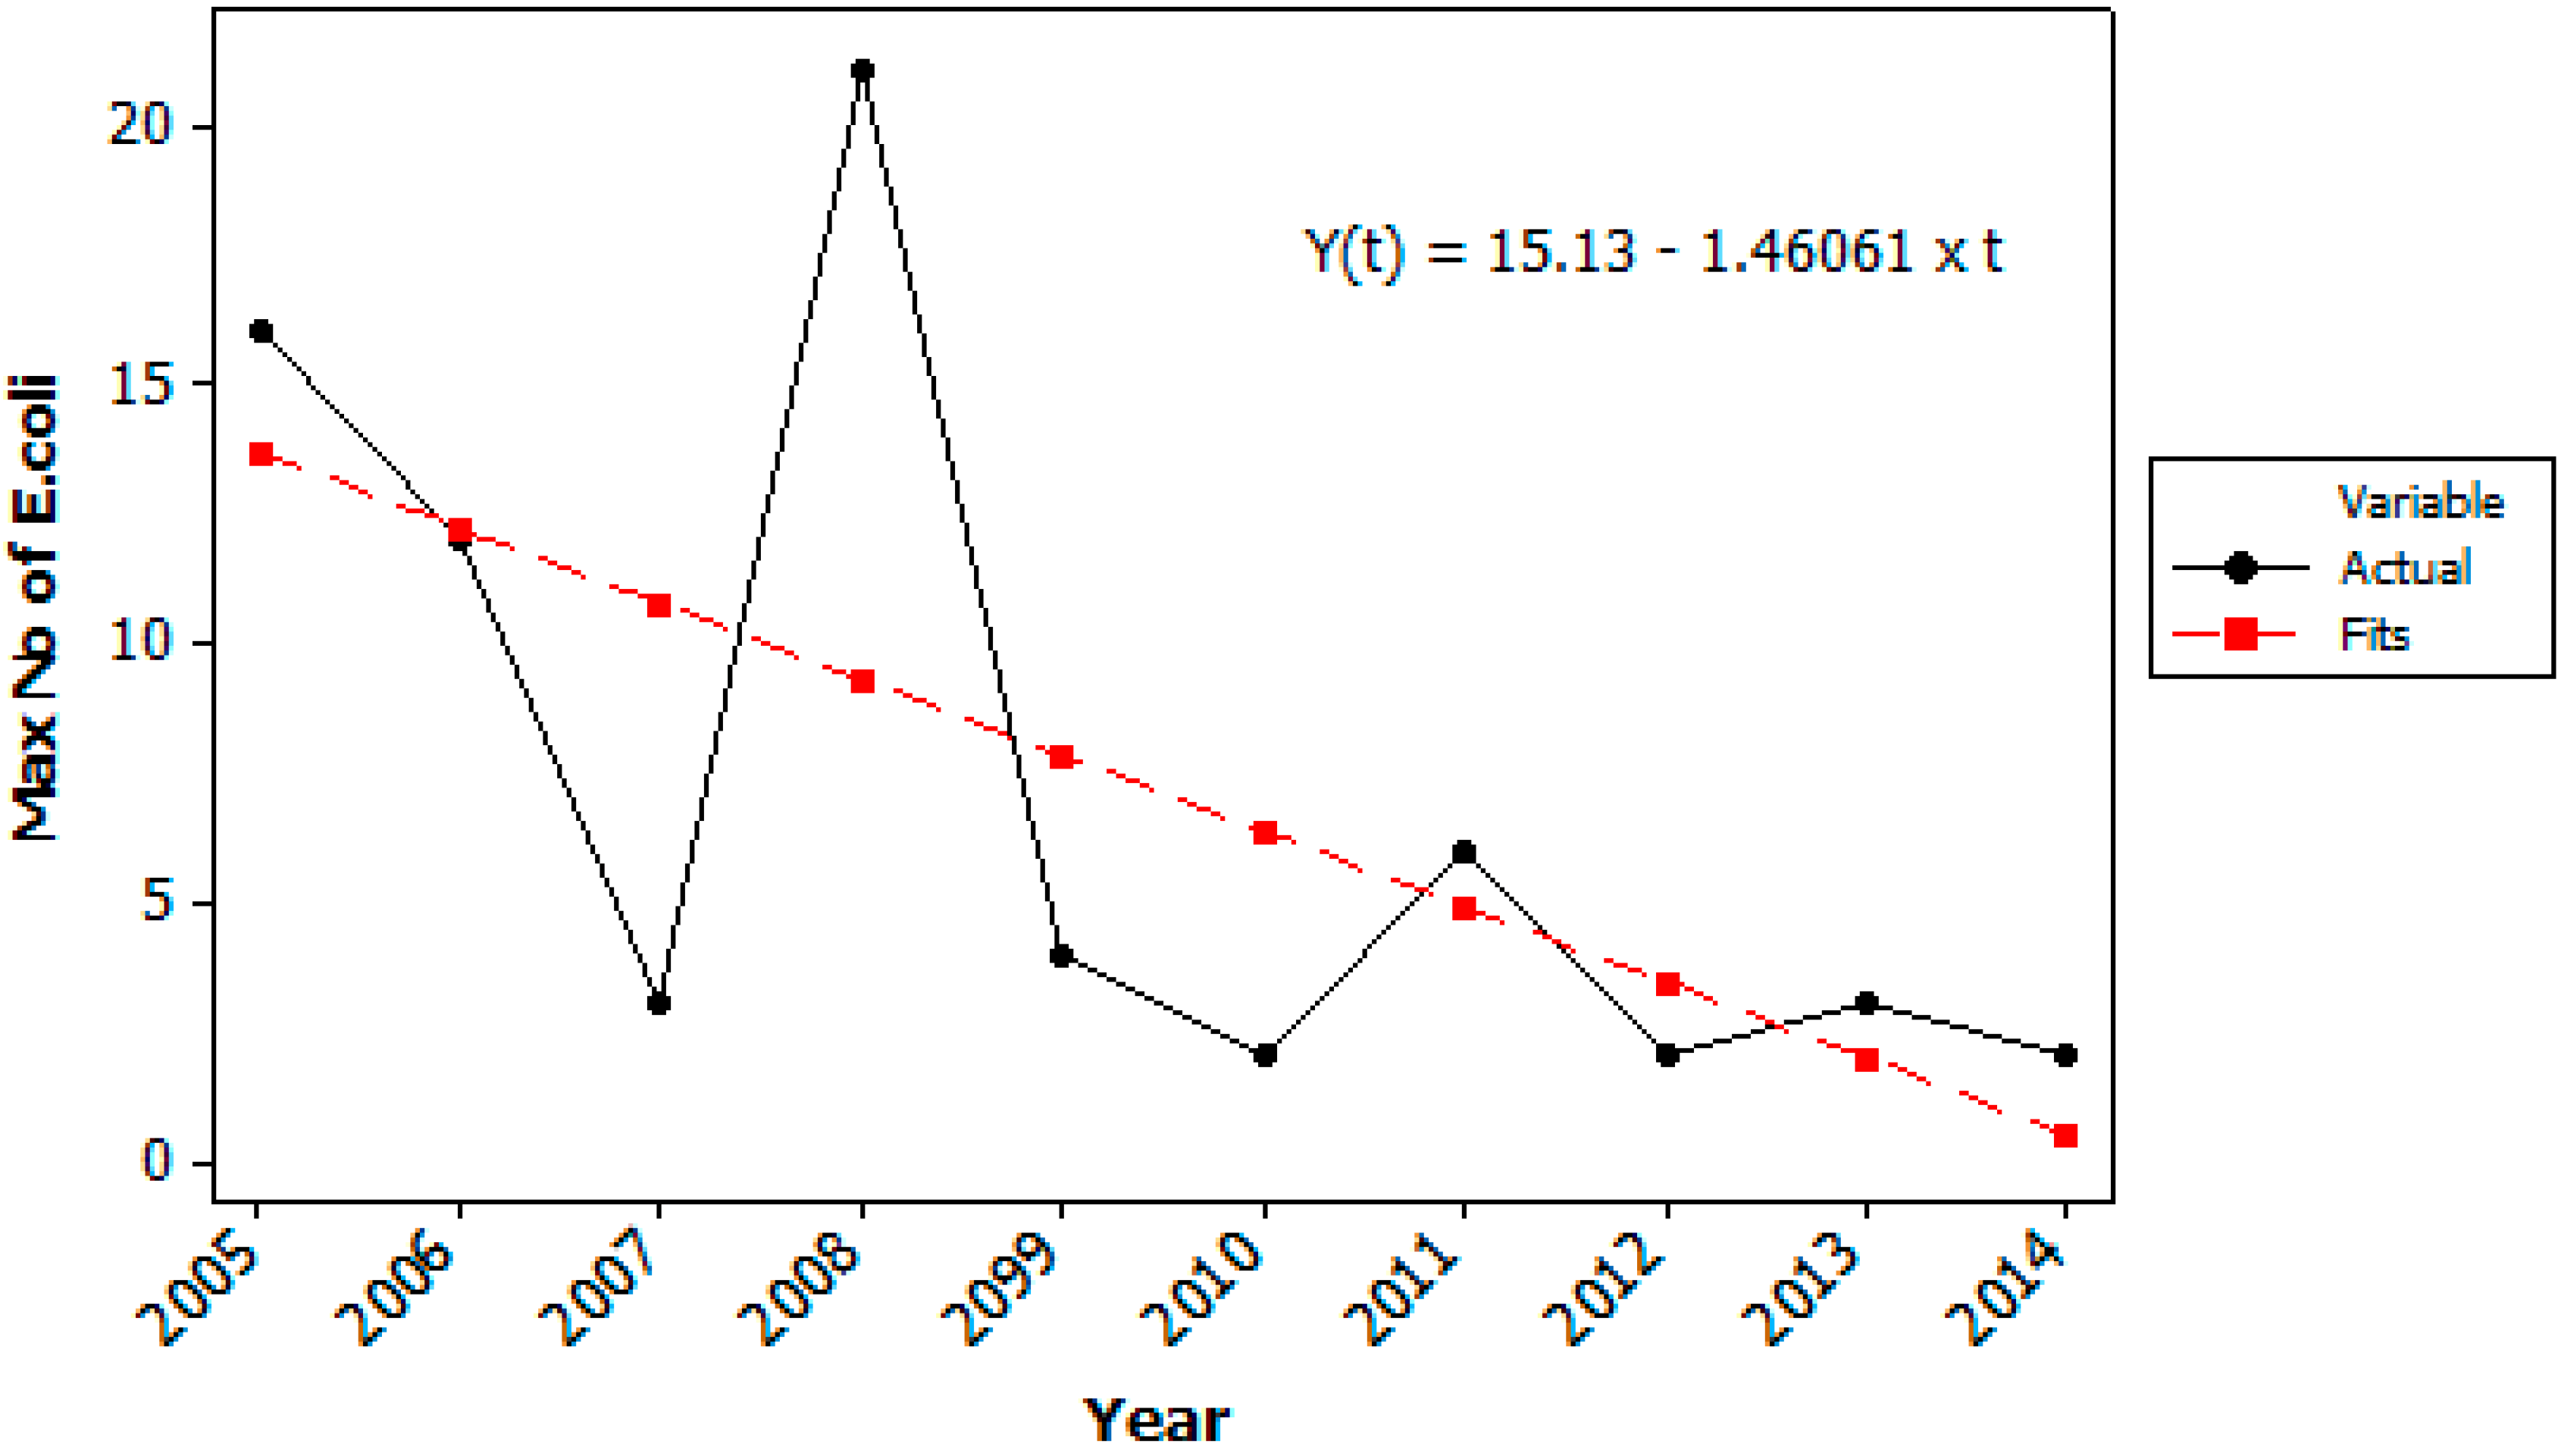
Figure 4.
Maximum number of Escherichia coli (cfu/100 mL) detected in the raw water at Oset water treatment plant each year from 2005–2014. Data from the weekly routine samples (52 ± 2 samples each year).
Figure 4.
Maximum number of Escherichia coli (cfu/100 mL) detected in the raw water at Oset water treatment plant each year from 2005–2014. Data from the weekly routine samples (52 ± 2 samples each year).
The decrease in number of samples positive for
E. coli (
Figure 3) and in the maximum number of
E. coli detected by routine testing last 10 years (
Figure 4) also indicate that the hygienic raw water quality has further been improved last years due to continuous measures in the catchment area, for example less farm animals, less runoff of fecal deposits to tributaries, less gulls and control of on-site grey water treatment systems. In Norway there are no specific water quality requirements for raw water used for drinking water production, but the water treatment processes must be adapted according to the raw water quality.
In the two years test period of the fully automated ALARM™, i.e., 1 December 2012 until 30 November 2014, the ALARM instrument provided results of E. coli (presence/absence in 100 mL), from 649 daily samples, i.e., 89% of all days in the 730 days period. The ALARM instrument required maintenance, i.e., change of reagents and restart every 20th day. Sometimes this manual work was not performed immediately after a run was completed, which caused several days/periods without sampling. Data from totally 81 days in the 730 days period were therefore not generated.
In the 649 daily raw water samples analyzed by ALARM, E. coli was overall detected in 118 (18%) of the samples. In this two years test period, 104 weekly routine samples were analyzed and E. coli was detected in 11 (11%) of the routine samples, with a maximum of 3 E. coli/100 mL.
The ALARM samples and the weekly samples were not taken at the same time and a direct comparison of the data is therefore difficult. At a total of 92 days, weekly samples and ALARM samples were taken at the same day (although, a difference in time up to 8 h). A comparison of the detection of
E. coli by the weekly method (ISO 9308-1) and the ALARM method based on these days showed no significant difference between the two methods (
Table 1).
Table 1.
Statistical comparison of the detection of Escherichia coli in raw water at Oset water treatment plant by the weekly routine method and Colifast ALARM based on the total of 92 sample-days where weekly samples and ALARM samples were taken within a time difference of less than 8 h.
Table 1.
Statistical comparison of the detection of Escherichia coli in raw water at Oset water treatment plant by the weekly routine method and Colifast ALARM based on the total of 92 sample-days where weekly samples and ALARM samples were taken within a time difference of less than 8 h.
| Weekly analysis | Colifast ALARM |
|---|
| Positive | Negative | Total |
|---|
| Positive | 1 | 9 | 10 |
| Negative | 10 | 72 | 82 |
| Total | 11 | 81 | 92 |
| Phi-coefficient (Φ) = −0.02 |
The calculated phi coefficient (ɸ) was −0.02, which corresponds to the value (chi-square) X2 = 0.04. The calculated X2 = 0.04 was less than the table value of 3.841 (at 1 degree of freedom and an alpha level of 0.05). This means that the p-value was greater than the accepted significance level of 0.05 (i.e. 0.66 > 0.05) and failed to reject the null hypothesis, which indicated no statistically significant difference in the proportion of E. coli detection between the two methods.
The average time-to-detect (TTD) of all samples where
E. coli was detected by ALARM was 13.5 h, median 14 h. Only two of the samples showed a TTD less than 11 h, but as much as 23% a TTD of 15 h. It has been suggested that TTD may be used to quantify the level of
E. coli [
11,
16,
17]. The relatively long TTD indicated very low numbers of
E. coli in the raw water, which was supported by the weekly samples showing maximum 3
E. coli/100 mL.
Large variations in number of positive samples were observed in the different months and in the two winters (
Figure 5).
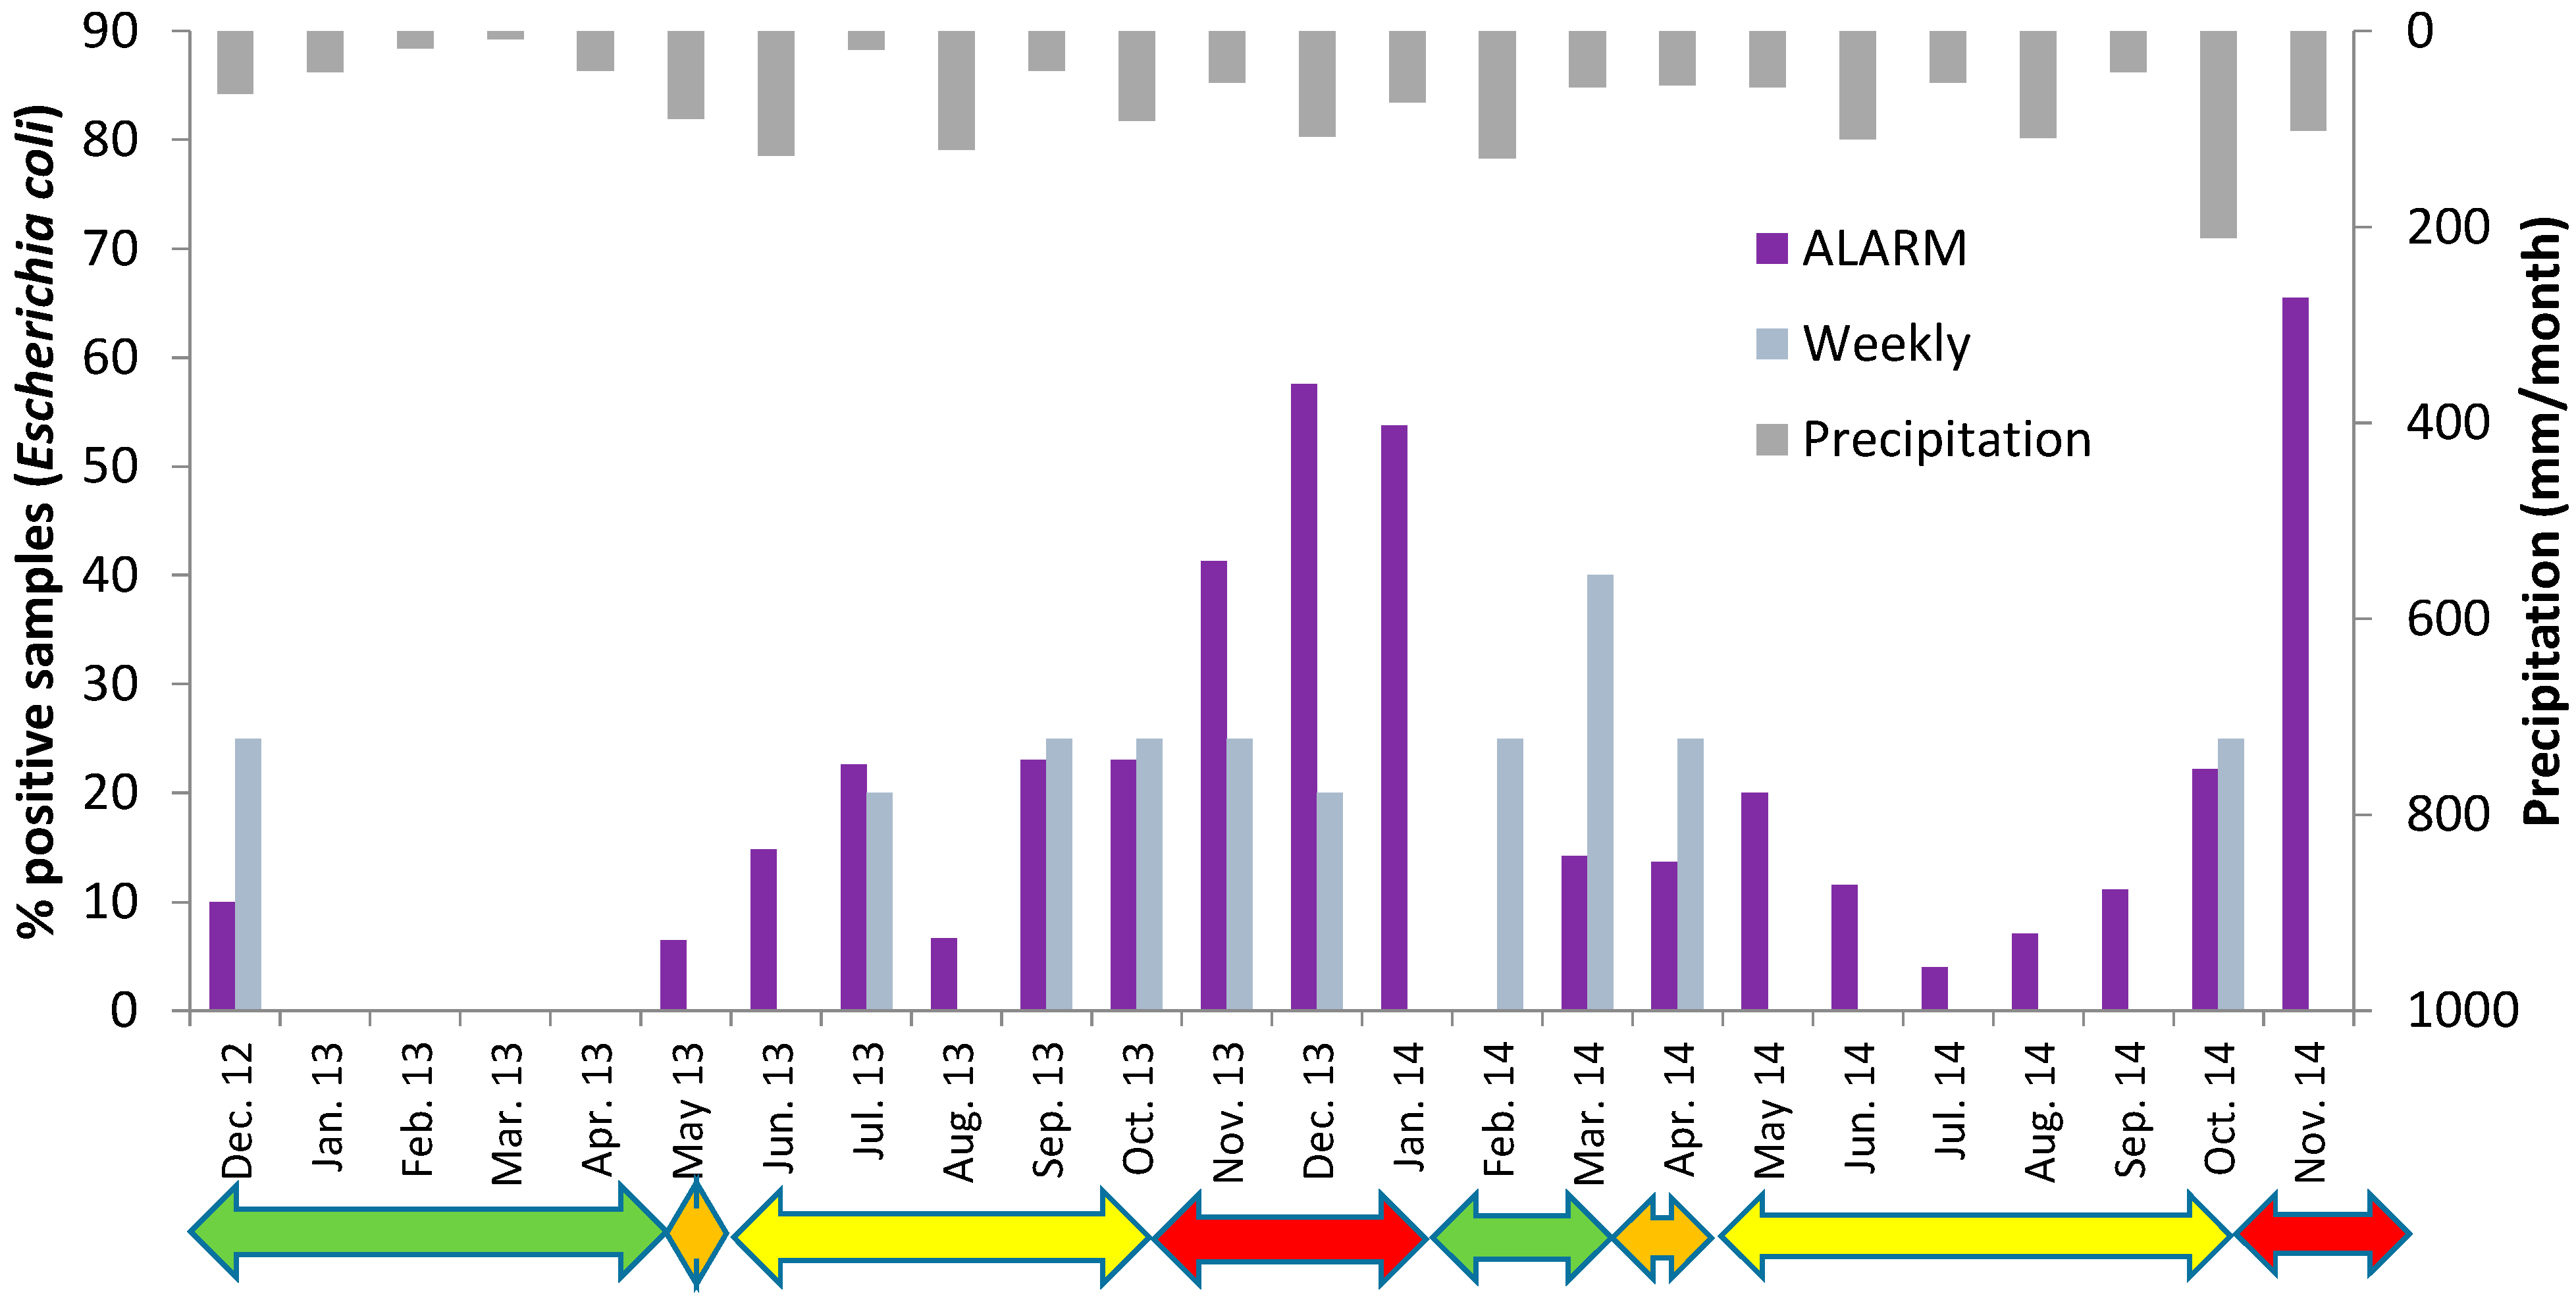
Figure 5.
Detection of Escherichia coli in the raw water at Oset water treatment plant by the fully automated Colifast ALARM (daily samples) and the weekly routine samples in the period December 2012 to November 2014. Green arrows indicate periods with ice cover, orange arrows: Spring turnover, yellow arrows: summer stagnation and red arrows: autumn turnover. Monthly precipitation is also shown.
The winter 2012/2013 was cold and Lake Maridalsvannet was covered with ice from the end of November 2012 and until 7 May 2013.
E. coli was detected in one of the routine weekly samples and in 3 of the daily samples in December 2012, but no
E. coli was detected in the period January–April 2013, neither by the routine weekly samples or with the daily samples analyzed by the ALARM instrument (
Figure 5). The results may indicate that a few weeks after Lake Maridalsvannet is covered by ice and during the following period with ice cover, the water source may act as a hygienic barrier against pathogens with similar or higher decay rate as
E. coli, for example
Salmonella [
18]. The weekly routine testing, however, detected
Clostridium perfringens in 6 of 18 weekly samples in this period [
7], indicating that pathogens with high persistence potentially still may be present in the raw water, although weekly samples analyzed for
Cryptosporidium and
Giardia showed no oocysts/cysts in 10 L [
7].
The temperature measurements of raw water and surface water indicated spring turnover in the lake from 7 May until 17 May 2013 (
Figure 6). The ALARM instrument detected
E. coli on 16 May and on 18 May, but no
E. coli was detected by the routine weekly samples during the spring 2013.
During the summer 2013, E. coli was detected once by the routine testing, 1 E. coli/100 mL on the 15 July. The ALARM instrument confirmed that this was not an isolated incident, i.e., E. coli was detected 7 times during the warm and dry days in July, with stable temperature stratification in the lake. It is assumed that birds (mainly gulls, ducks and geese) located near the water intake were the sources of E. coli in the raw water during the dry summer days.
Temperature measurements indicated autumn turnover in the lake from about 27 October 2013 until the lake was covered by ice 11 January 2014 (
Figure 6). In this period ALARM detected
E. coli in about 50% of the samples. The weekly routine testing detected
E. coli in about 25% of the samples. Also 1
Giardia cyst/10 L was detected on 14th of October and 2
Giardia cysts/10 L was detected on 21 October 2013,
i.e., 1–2 weeks before the temperature measurements indicated autumn turnover and not exactly at the same days as
E. coli was detected. The raw water temperature increased during the summer, with a more rapid increase last two weeks before the raw water and surface water temperature became equal in the end of October (
Figure 6). Equal temperature in raw water and surface water indicate complete mixing in the lake, but also in the weeks before complete mixing, some contaminated surface water may be transported to the raw water intake due to a weak stratification, deep thermocline, wind [
12] and currents caused by extraction of large amounts of raw water for drinking water production (about 2.6 m
3/s).
The winter 2013/2014 was much warmer than the winter 2012/2013. The lake was not covered by ice before in the middle of January and the ice disappeared already 7 March 2014,
i.e., 2 months earlier than in 2013. Temperature measurements indicated spring turnover until 20 April (
Figure 6). Contrary to 2013 when no
E. coli was detected during the first 4 months,
E. coli was detected by ALARM in >50% of the samples in January 2014 and in about 15% of the samples in March and April (
Figure 5). Also 1
E. coli/100 mL was detected by the weekly routine sampling in one sample in February and two samples in March. The results from the two different winters support the hypothesis that warmer winters with shorter periods with ice cover on lakes, which may be a consequence of climate changes, may reduce the hygienic barrier efficiency in deep lakes used as drinking water sources [
1].
During the summer 2014 no
E. coli was detected by the routine weekly samples, but ALARM detected
E. coli in 4%–20% of the daily samples taken in each of the months May–September 2014 (
Figure 5). This confirmed the results from the summer 2013 which showed that stable temperature stratification in the lake does not represent a complete hygienic barrier against intrusion of
E. coli to the raw water intake at 35 m depth. During the autumn, the temperature stratification in Lake Maridalsvannet became weaker and complete autumn turnover was again observed 24 October 2014. The increase in number of positive samples in November 2014, during autumn turnover, again suggested an increased risk of fecal pathogens in the raw water during the autumn turnover.
Statistical analysis (chi-squared statistics) confirmed that the presence of
E. coli was associated with the stratification/turnover conditions in the lake. As the chi-squared statistics 128.3 exceeded the critical values of 16.27 at 99.99% (
p < 0.001) significant level, the null hypothesis was rejected and a conclusion was made that the presence of
E. coli was associated with the seasons of the year (
Table 2). It was noted that more
E. coli positive raw water samples occurred during autumn turnover than expected and less occurred during winter/ice-cover. Therefore, periods with ice cover appeared to be the least affected by
E. coli and autumn the most affected (
Table 2).
Heavy rainfalls are often shown to increase the loads of fecal indicators to water sources, including Lake Maridalsvannet [
19], for example due to increased runoff of animal faeces [
1]. The occurrence of fecal microorganisms at the deep water intake of a lake does not only depend on the load, but also on the dilution, survival and transport in the water source. Previous hydrodynamic modelling in Lake Maridalsvannet indicated that the transport time of
E. coli from the outlet of a contaminated tributary to the raw water intake at 35 m depth may vary from <1 day to several days depending on for example the wind direction [
19]. Generally, more precipitation was observed during the autumn turnover periods than in the other periods (
Figure 5), but no significant correlation was found between the precipitation amount 1–2–3 days before sampling and the detection of
E. coli in the deep water (
Table 3). This may be explained by generally low levels of
E. coli in the lake, varying transport conditions (for example wind) in the lake after the different rainfall episodes and a relatively low decay rate of
E. coli in the cold water allowing
E. coli to survive in the lake for a few weeks [
18,
20]. Also, sources of fecal contamination in the catchment area, including bird dropping near the raw water intake, may vary occasionally.
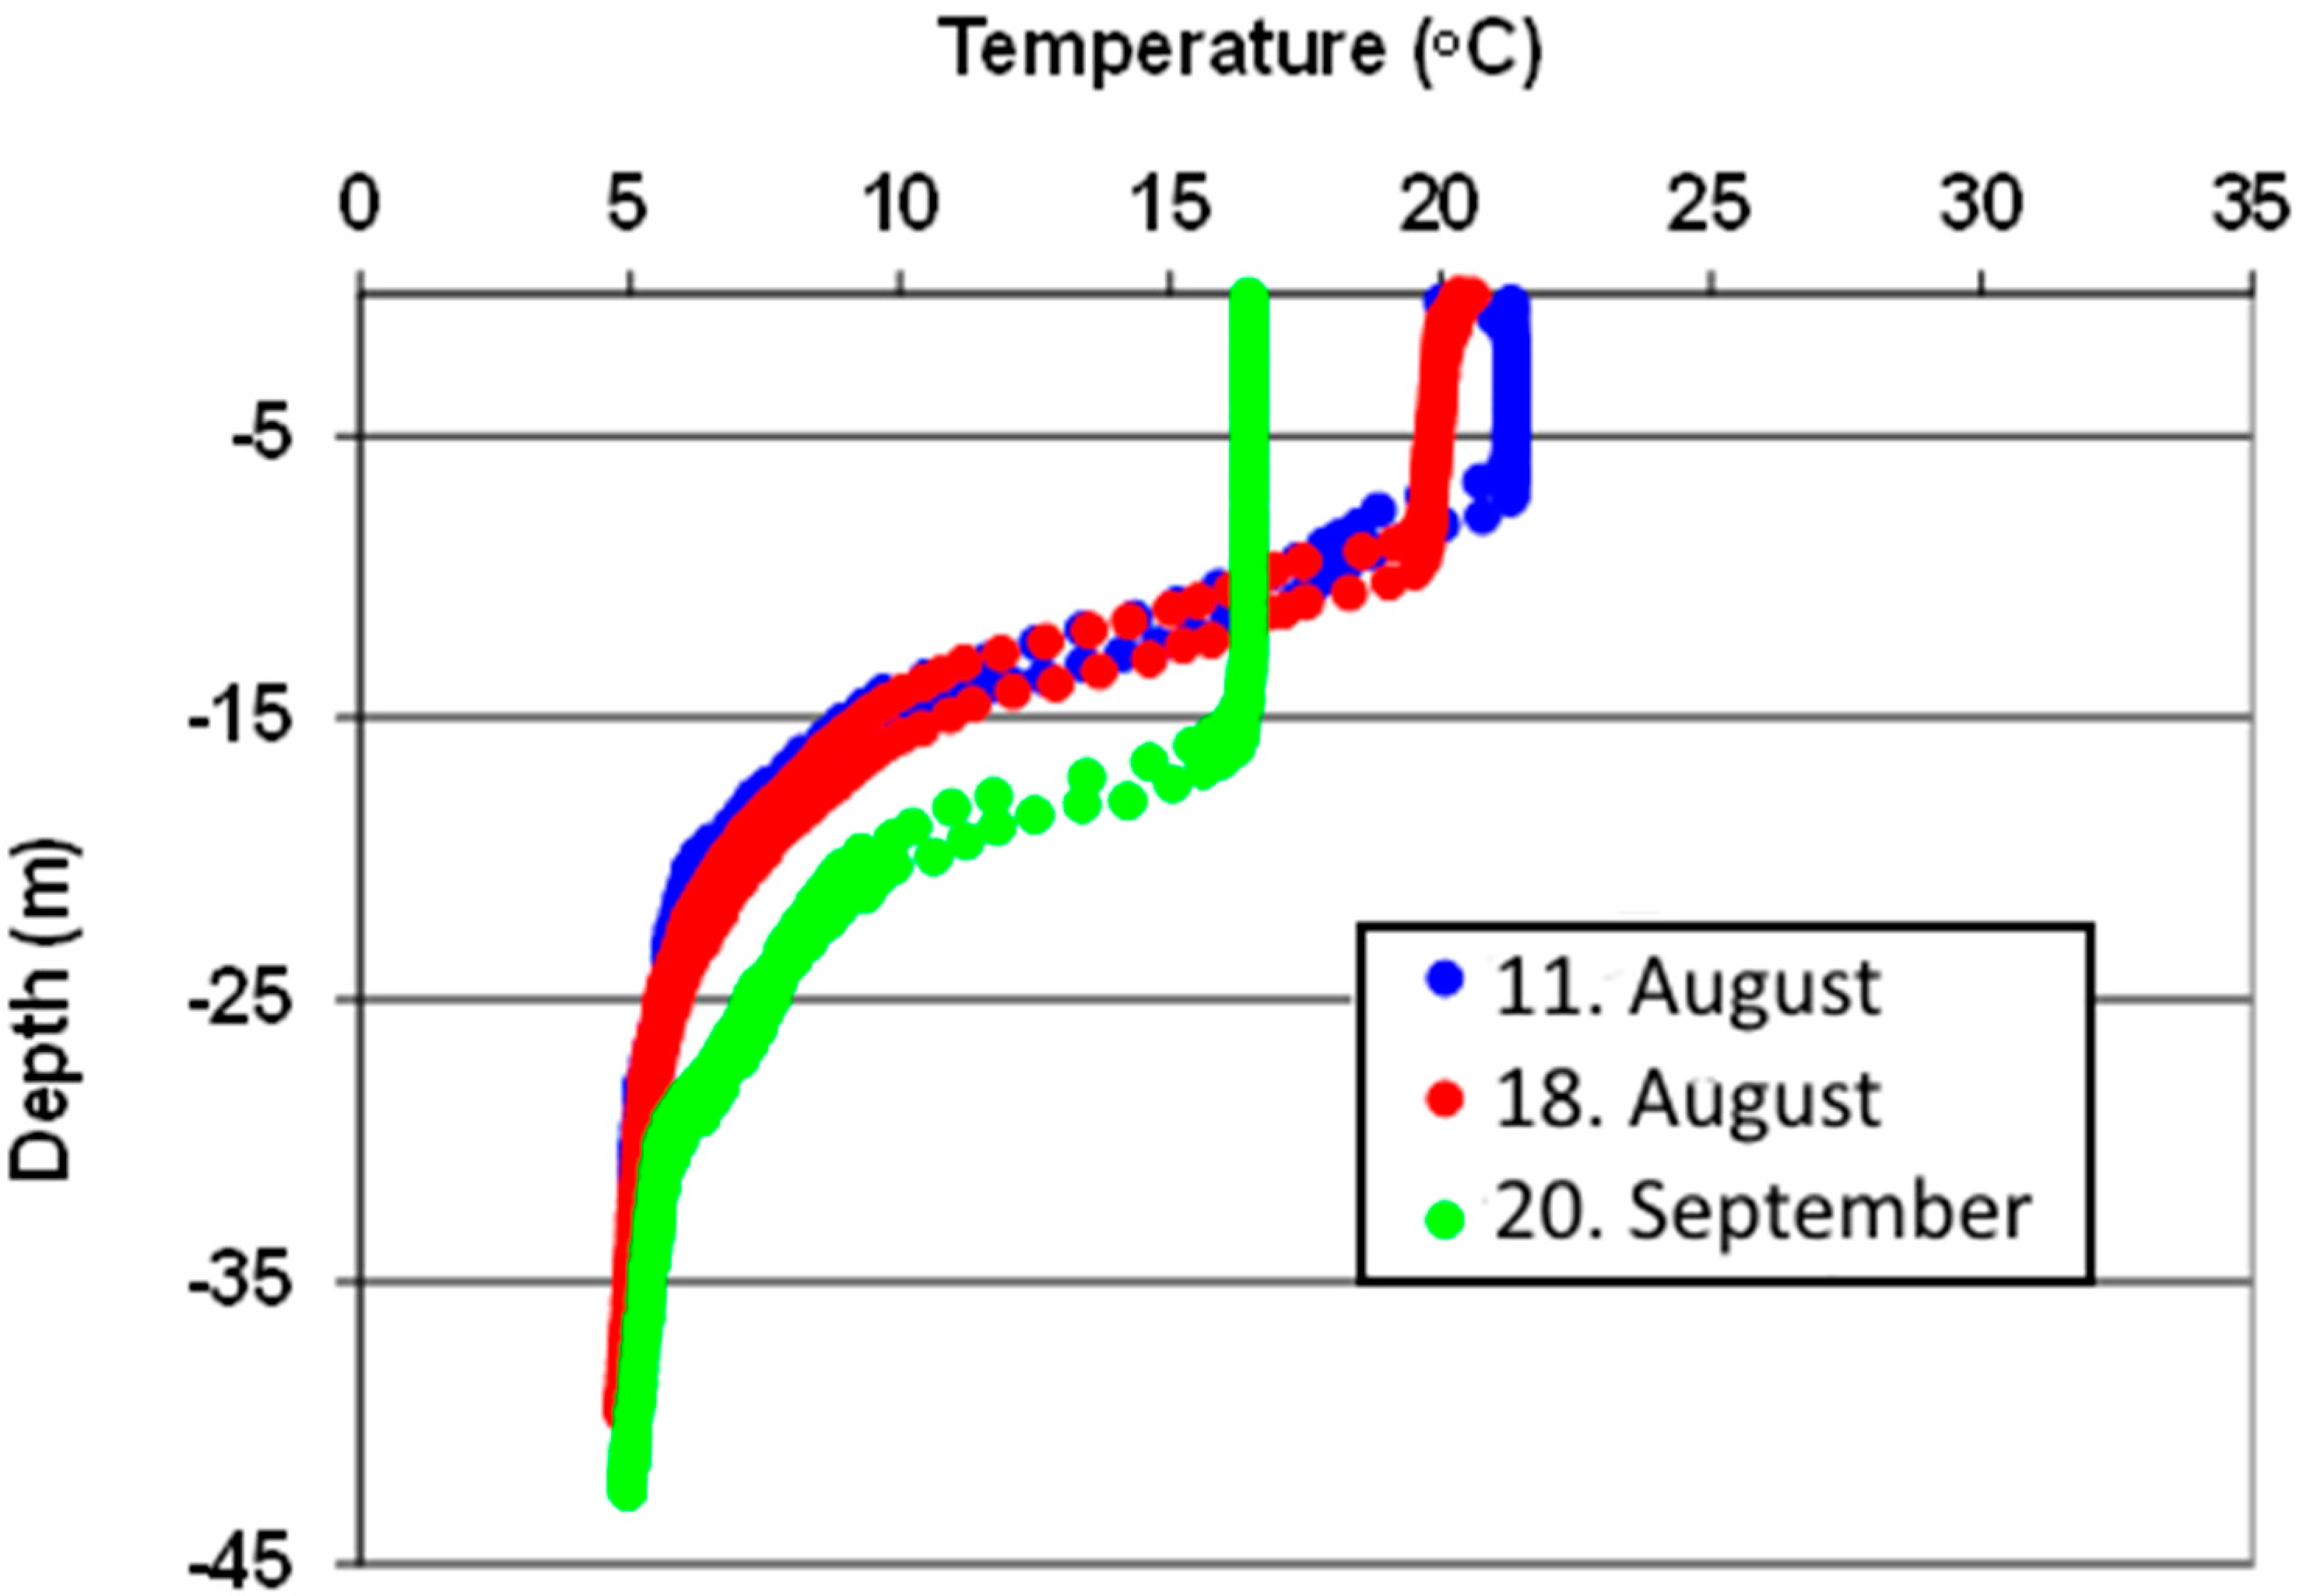
Figure 6.
Temperature of raw water from Lake Maridalsvannet (2 different raw water measurements for line north and line south), surface water (at locations 1 and 2) and air temperature for the years 2013 and 2014. The temperature measurements were performed by the Oset water treatment plant.
Figure 6.
Temperature of raw water from Lake Maridalsvannet (2 different raw water measurements for line north and line south), surface water (at locations 1 and 2) and air temperature for the years 2013 and 2014. The temperature measurements were performed by the Oset water treatment plant.
Table 2.
Contingency table for chi-square test of Colifast ALARM Escherichia coli detection and different seasons (temperature stratification/turnover in the lake).
Table 2.
Contingency table for chi-square test of Colifast ALARM Escherichia coli detection and different seasons (temperature stratification/turnover in the lake).
| Escherichia coli | Seasons |
|---|
| Winter Stratification (Ice Cover) | Spring Turnover | Summer Stratification | Autumn Turnover | Total |
|---|
| Positive samples | Observed | 8 | 7 | 46 | 57 | 118 |
| Expected | 33.6 | 9.1 | 57.1 | 18.2 |
| Negative Samples | Observed | 177 | 43 | 268 | 43 | 531 |
| Expected | 151.4 | 40.9 | 256.9 | 81.8 |
| Total | 185 | 50 | 314 | 100 | 649 |


 ,
, 

