
The Effect of Oxygen Supply on the Dual Growth Kinetics of Acidithiobacillus thiooxidans under Acidic Conditions for Biogas Desulfurization

Abstract
:1. Introduction
2. Experimental Section
2.1. Microorganisms
2.2. Bubble-Column Bioreactor
2.3. Bioreactor Experiments
2.4. Analytical Methods
3. Model Development
3.1. Mass Balance Equations for the Liquid Phase
3.2. Mass Balance Equations for the Gas Phase
3.3. Model Parameter Estimation and Prediction
4. Results and Discussion
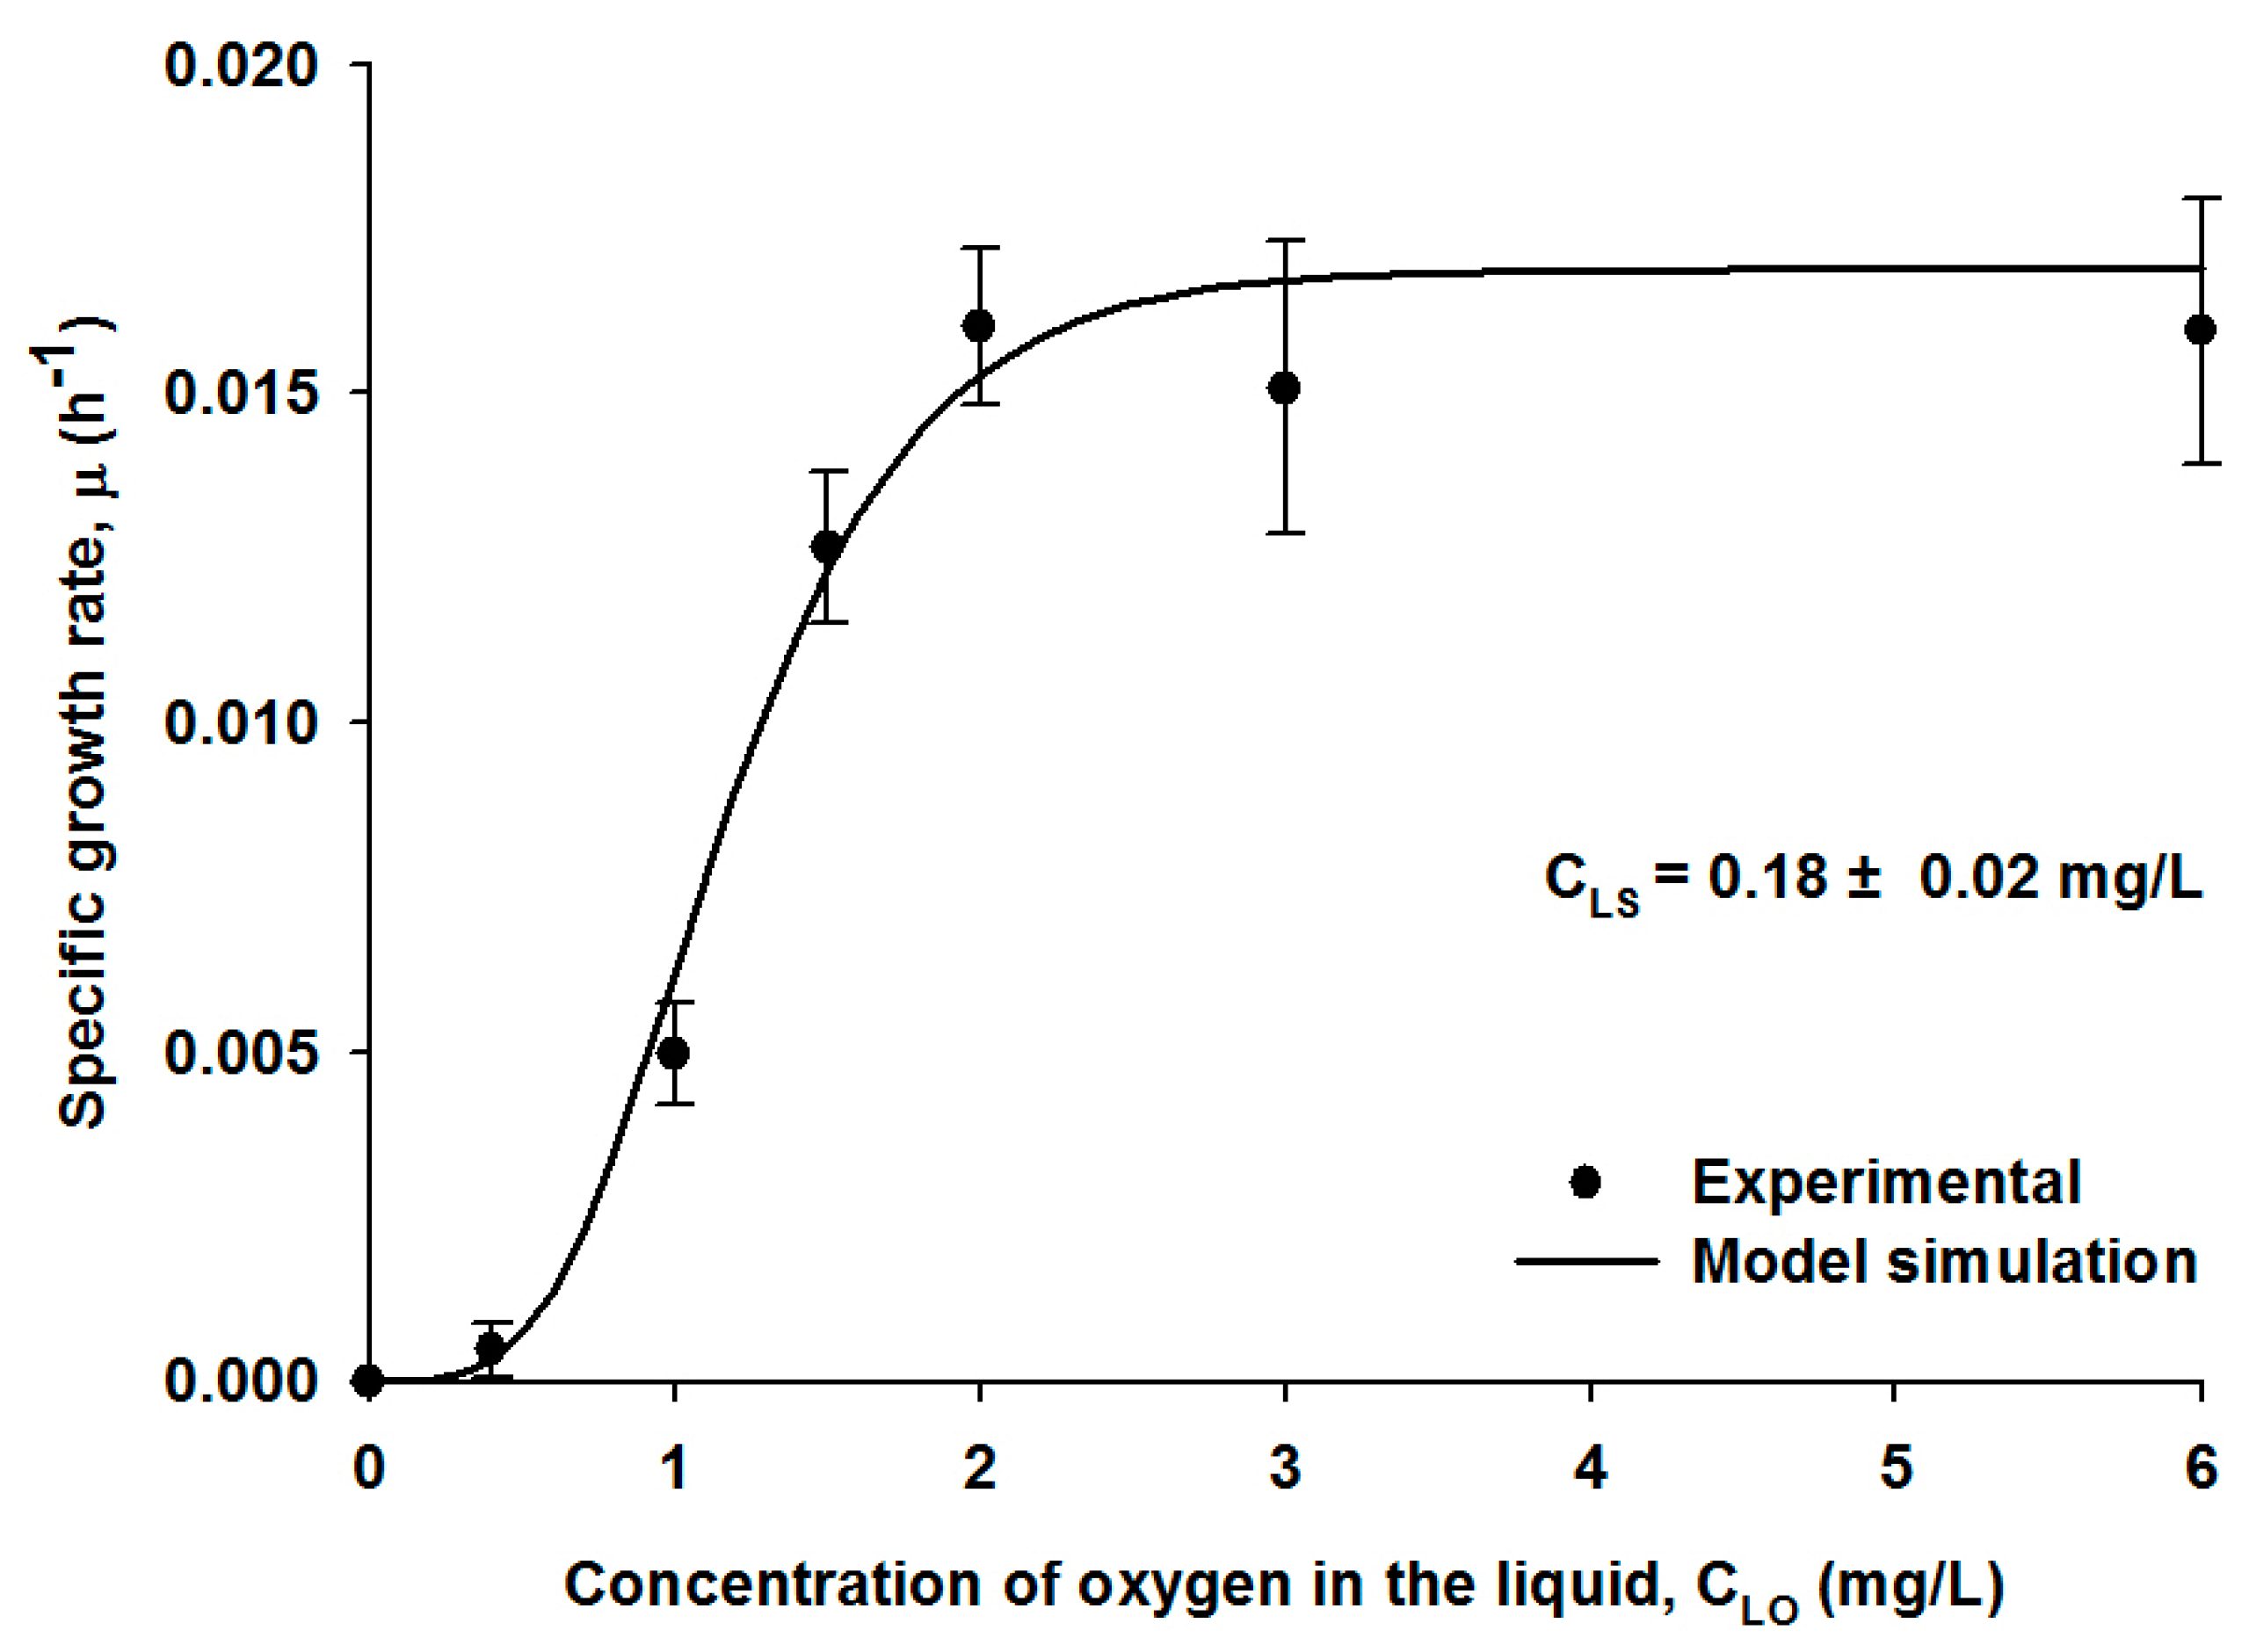
4.1. Growth Kinetic Model and Parameter Estimation


| Parameters | Values | Bioreactors | Reference | |
|---|---|---|---|---|
| Estimated | μmax | 0.037 | 1/h | this study |
| KS | 0.15 | mg-S/L | this study | |
| KO | 1.10 | mg-O/L | this study | |
| YX/S | 0.093 | mg-dry weight/mg-S | this study | |
| YX/O | 0.732 | mg-dry weight/mg-O | this study | |
| Known | HS | 0.427 | - | [30] |
| HO | 32.3 | - | [30] | |
| DS | 0.0000161 | cm2/s | [30] | |
| DO | 0.0000240 | cm2/s | [30] | |
| KLaO | 1.42 | 1/min | [24] | |
4.2. Model Validation and Simulation
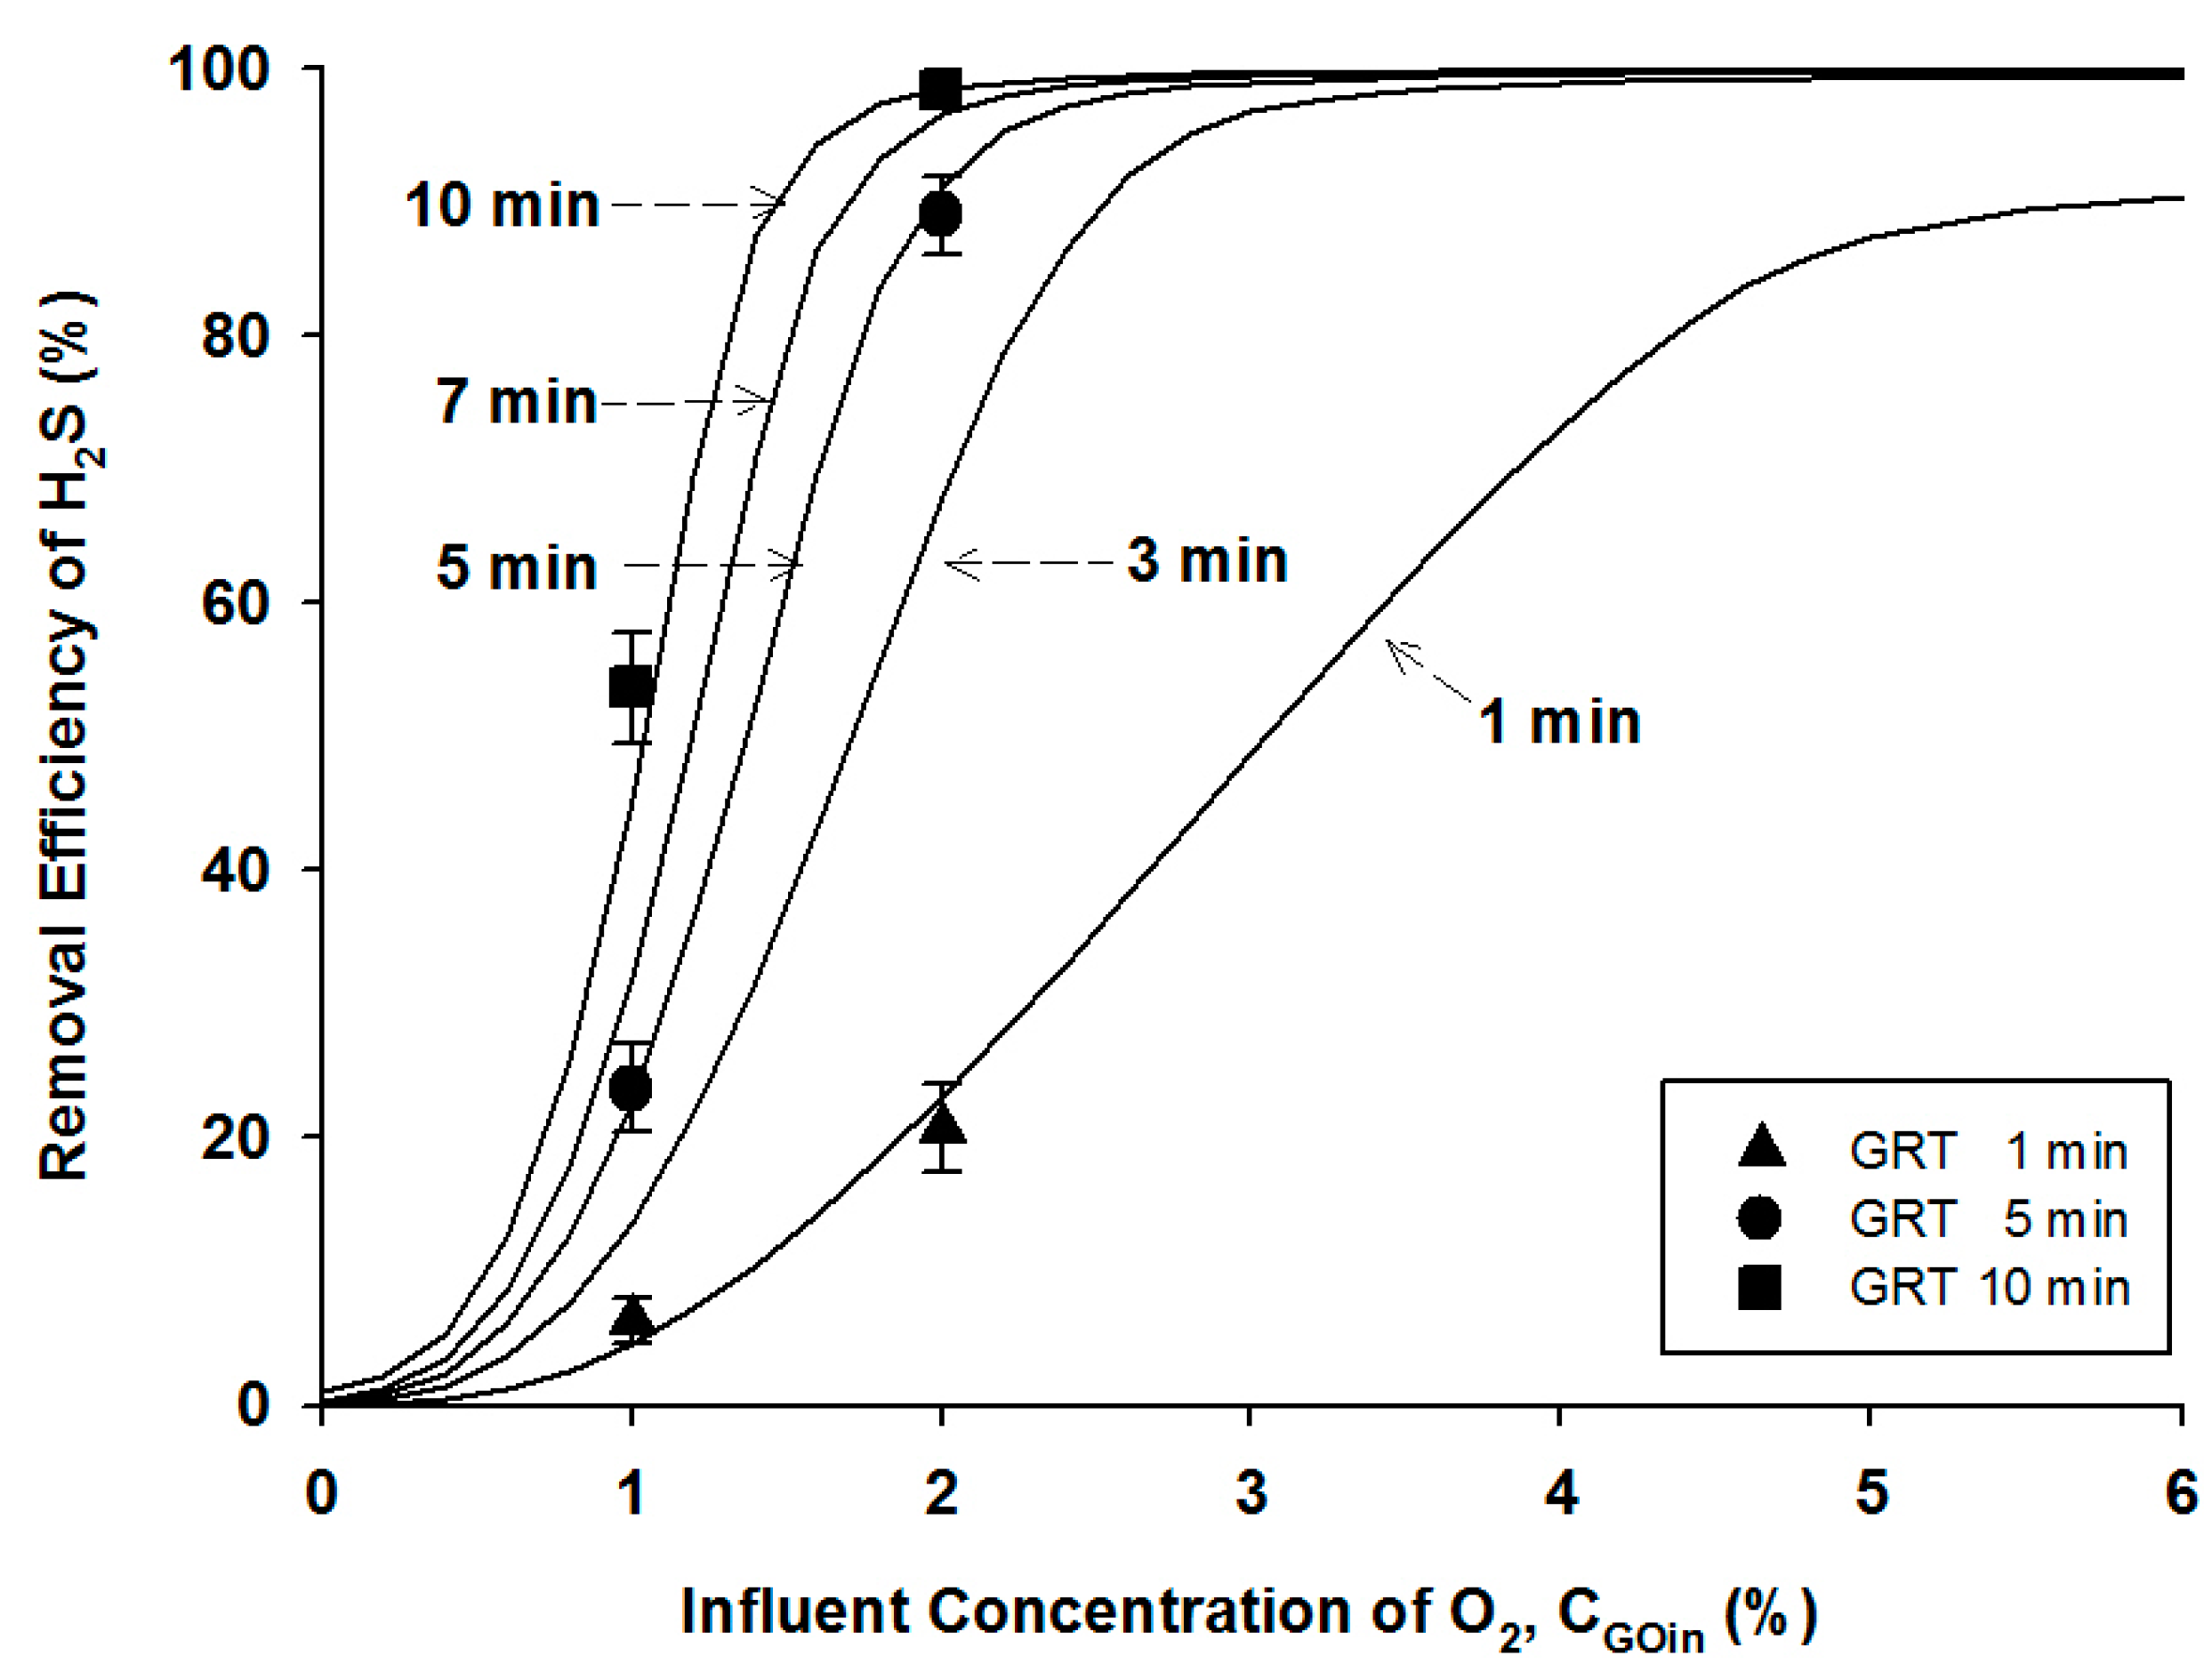
4.2.1. Effects of Gas Retention Times (GRTs)

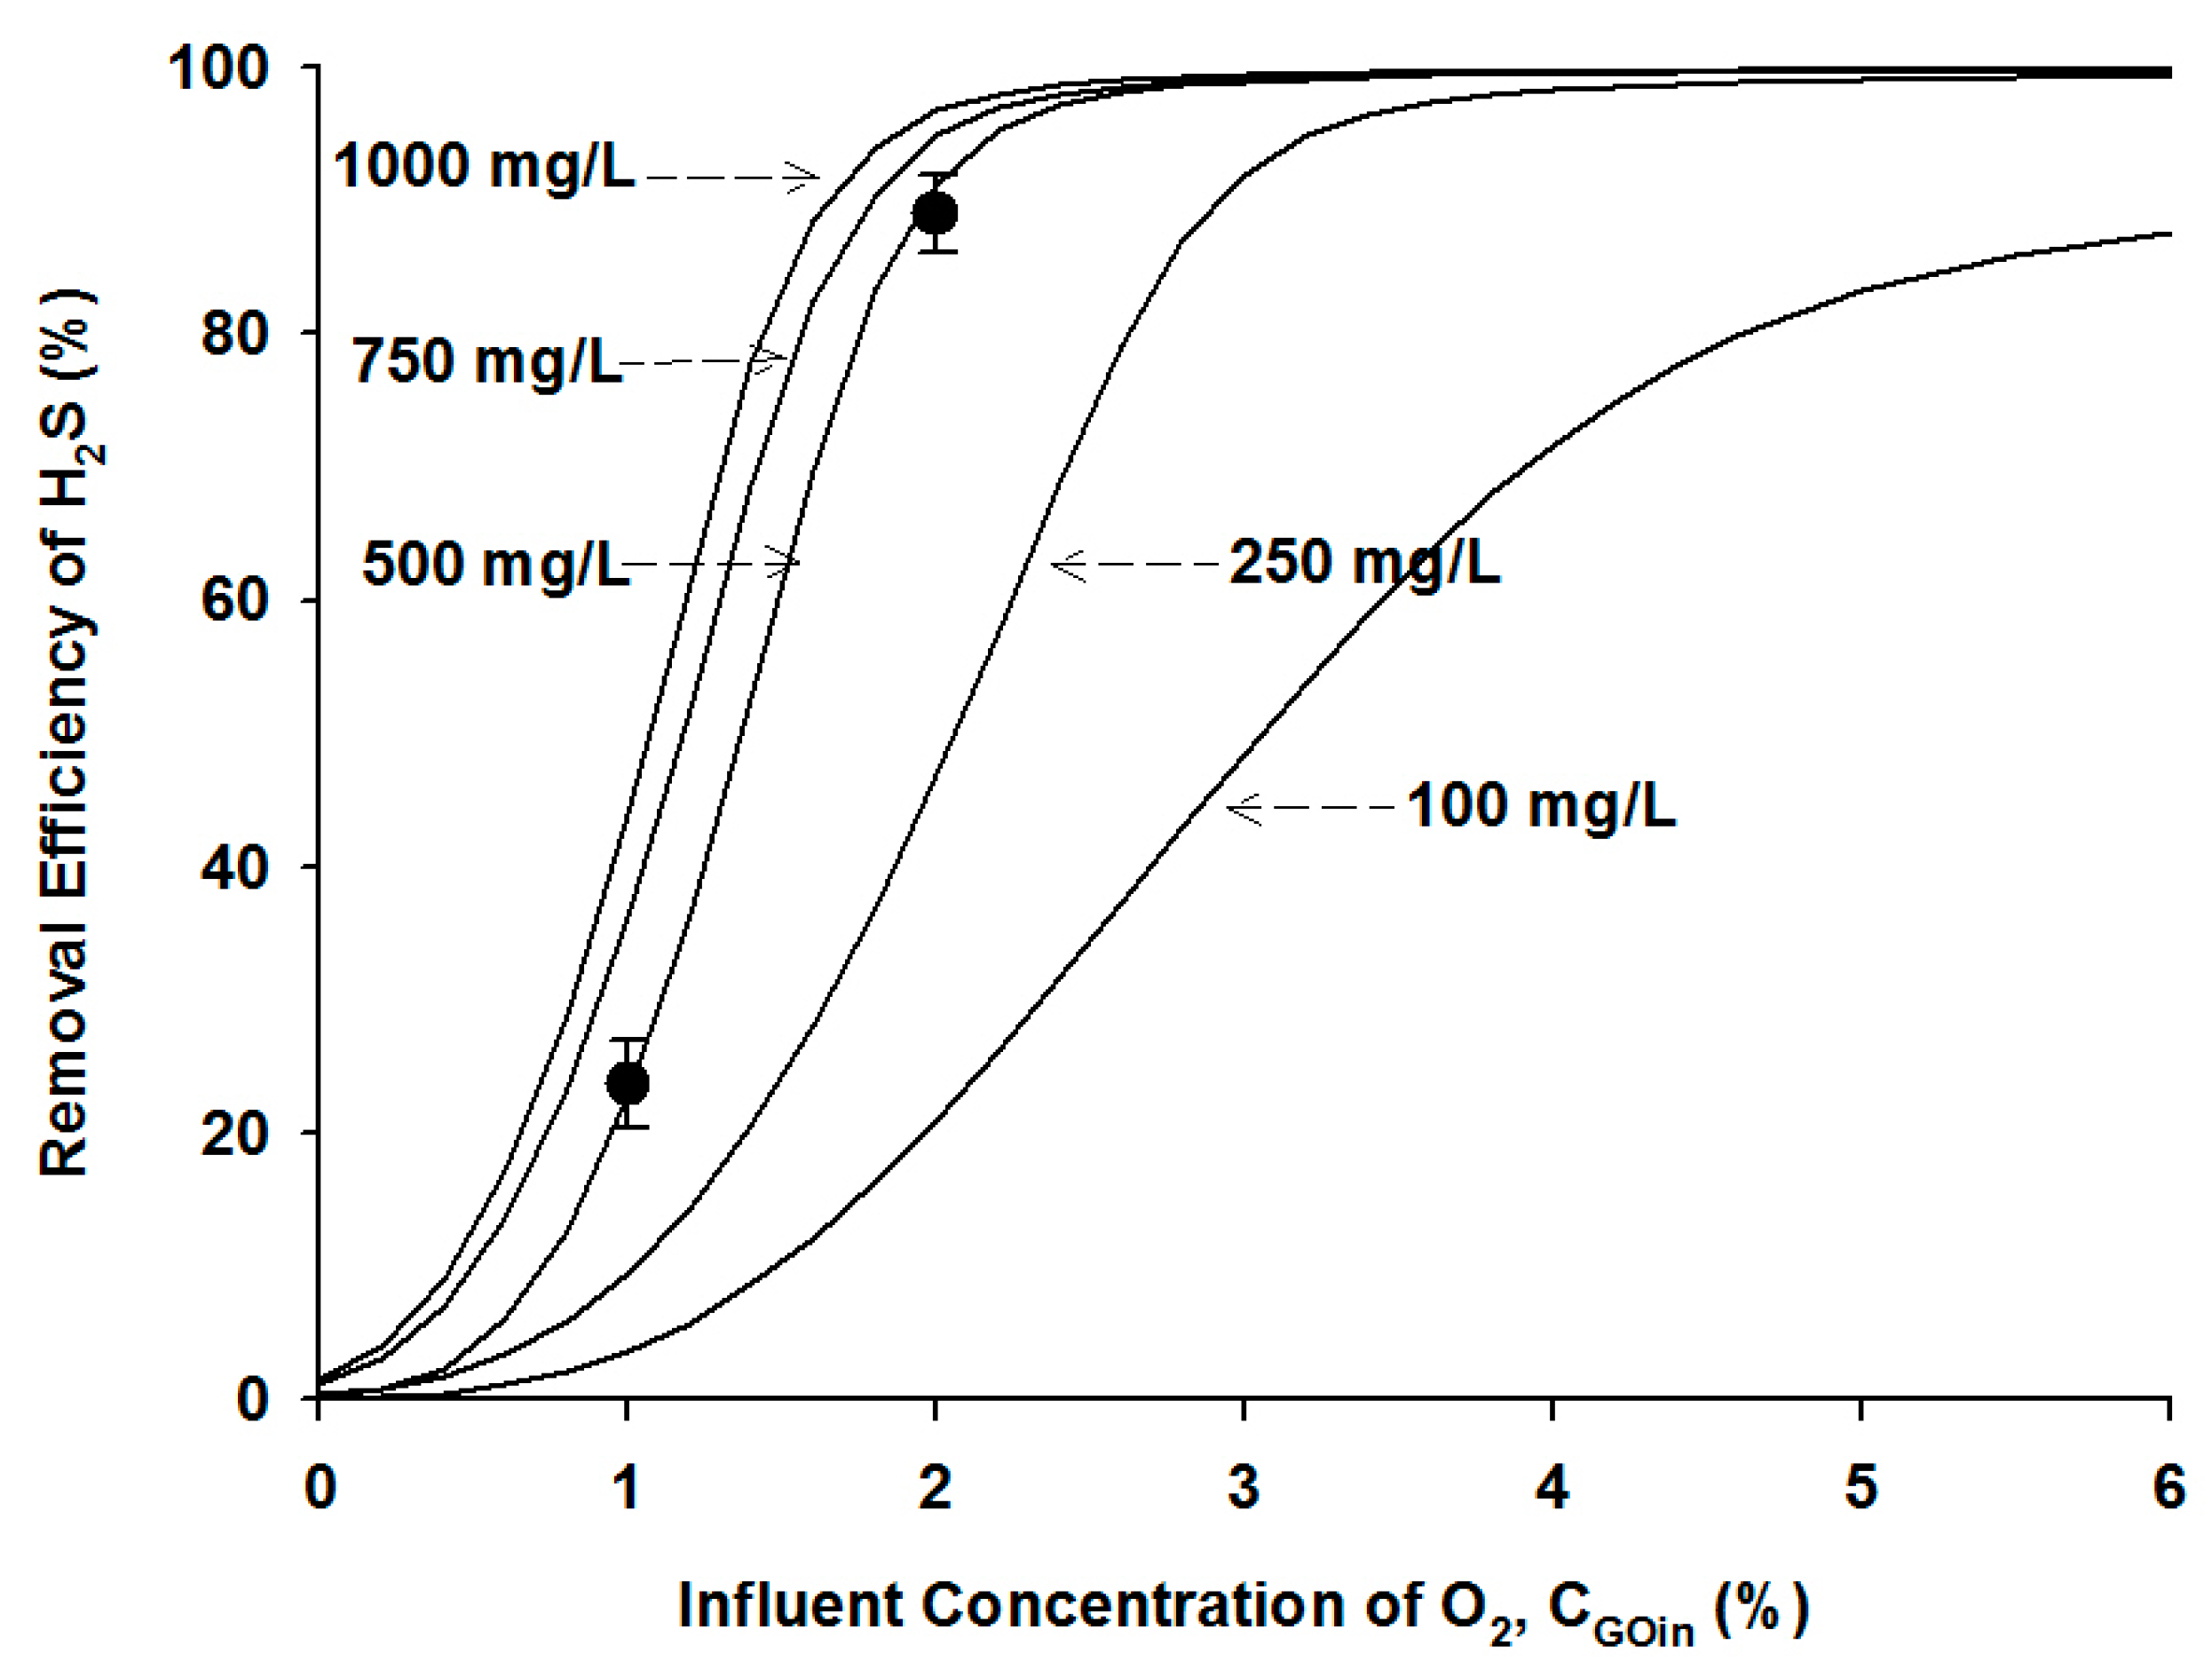
4.2.2. Effects of Microbial Density
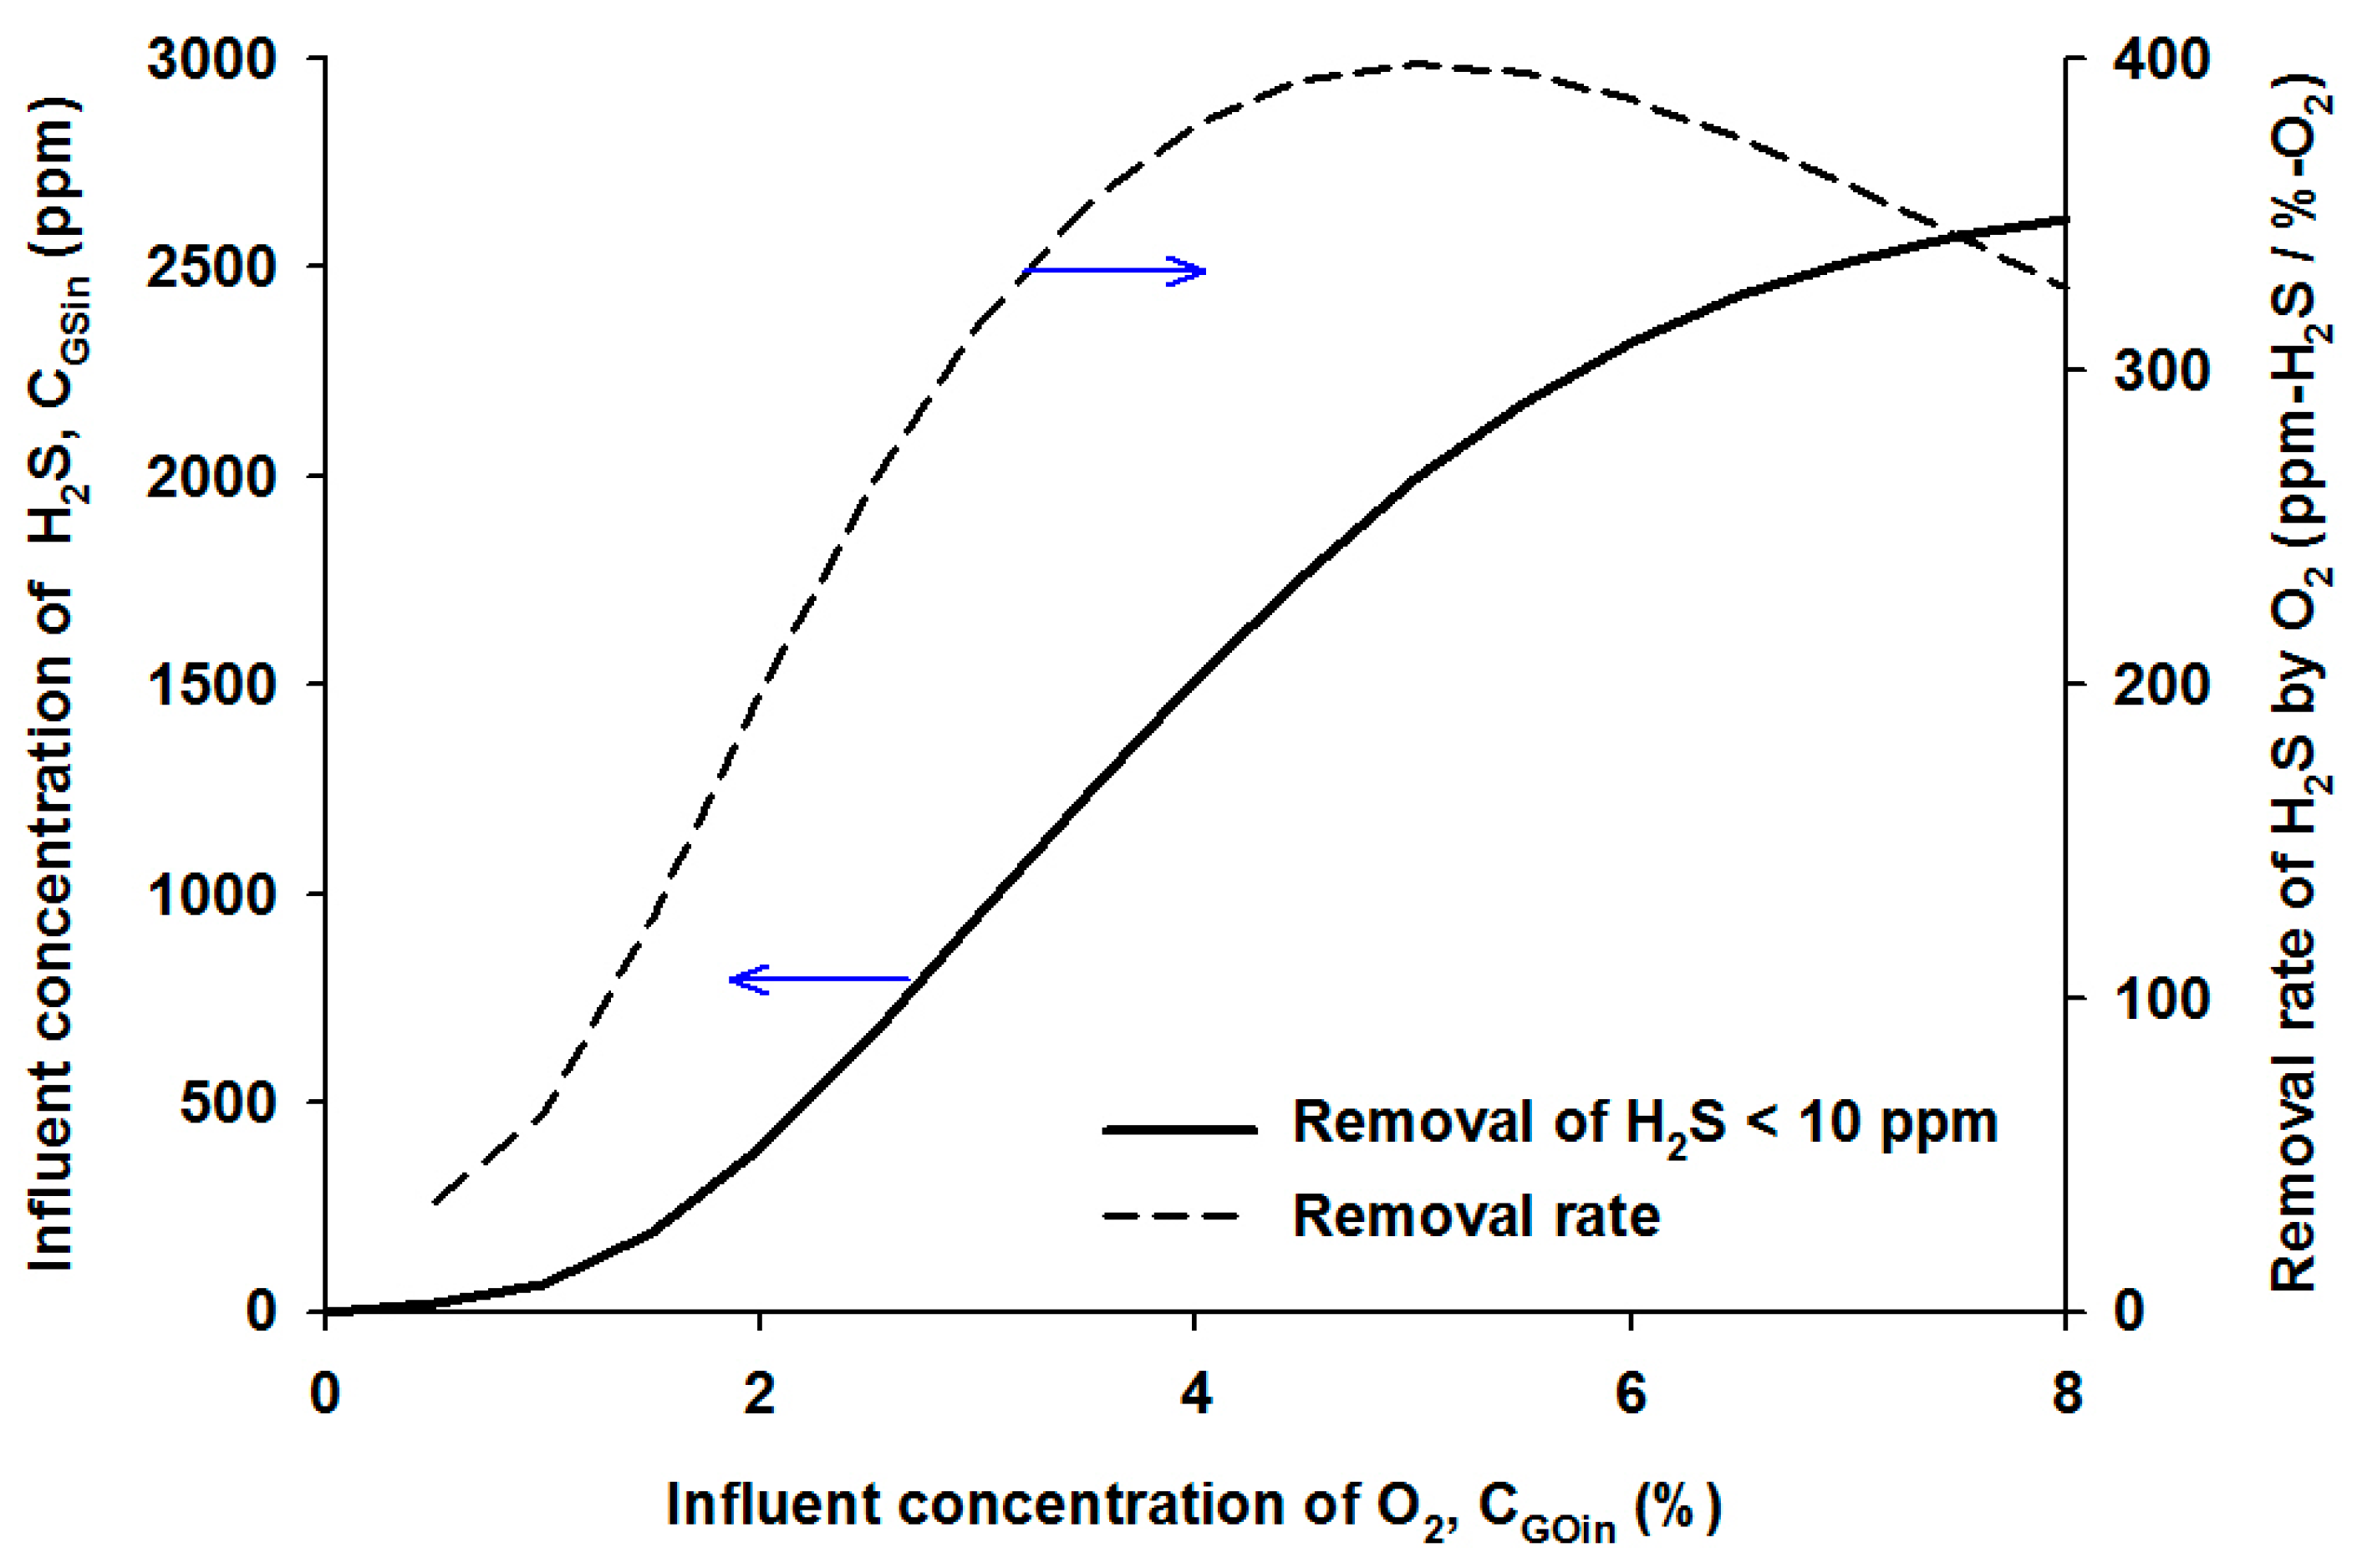
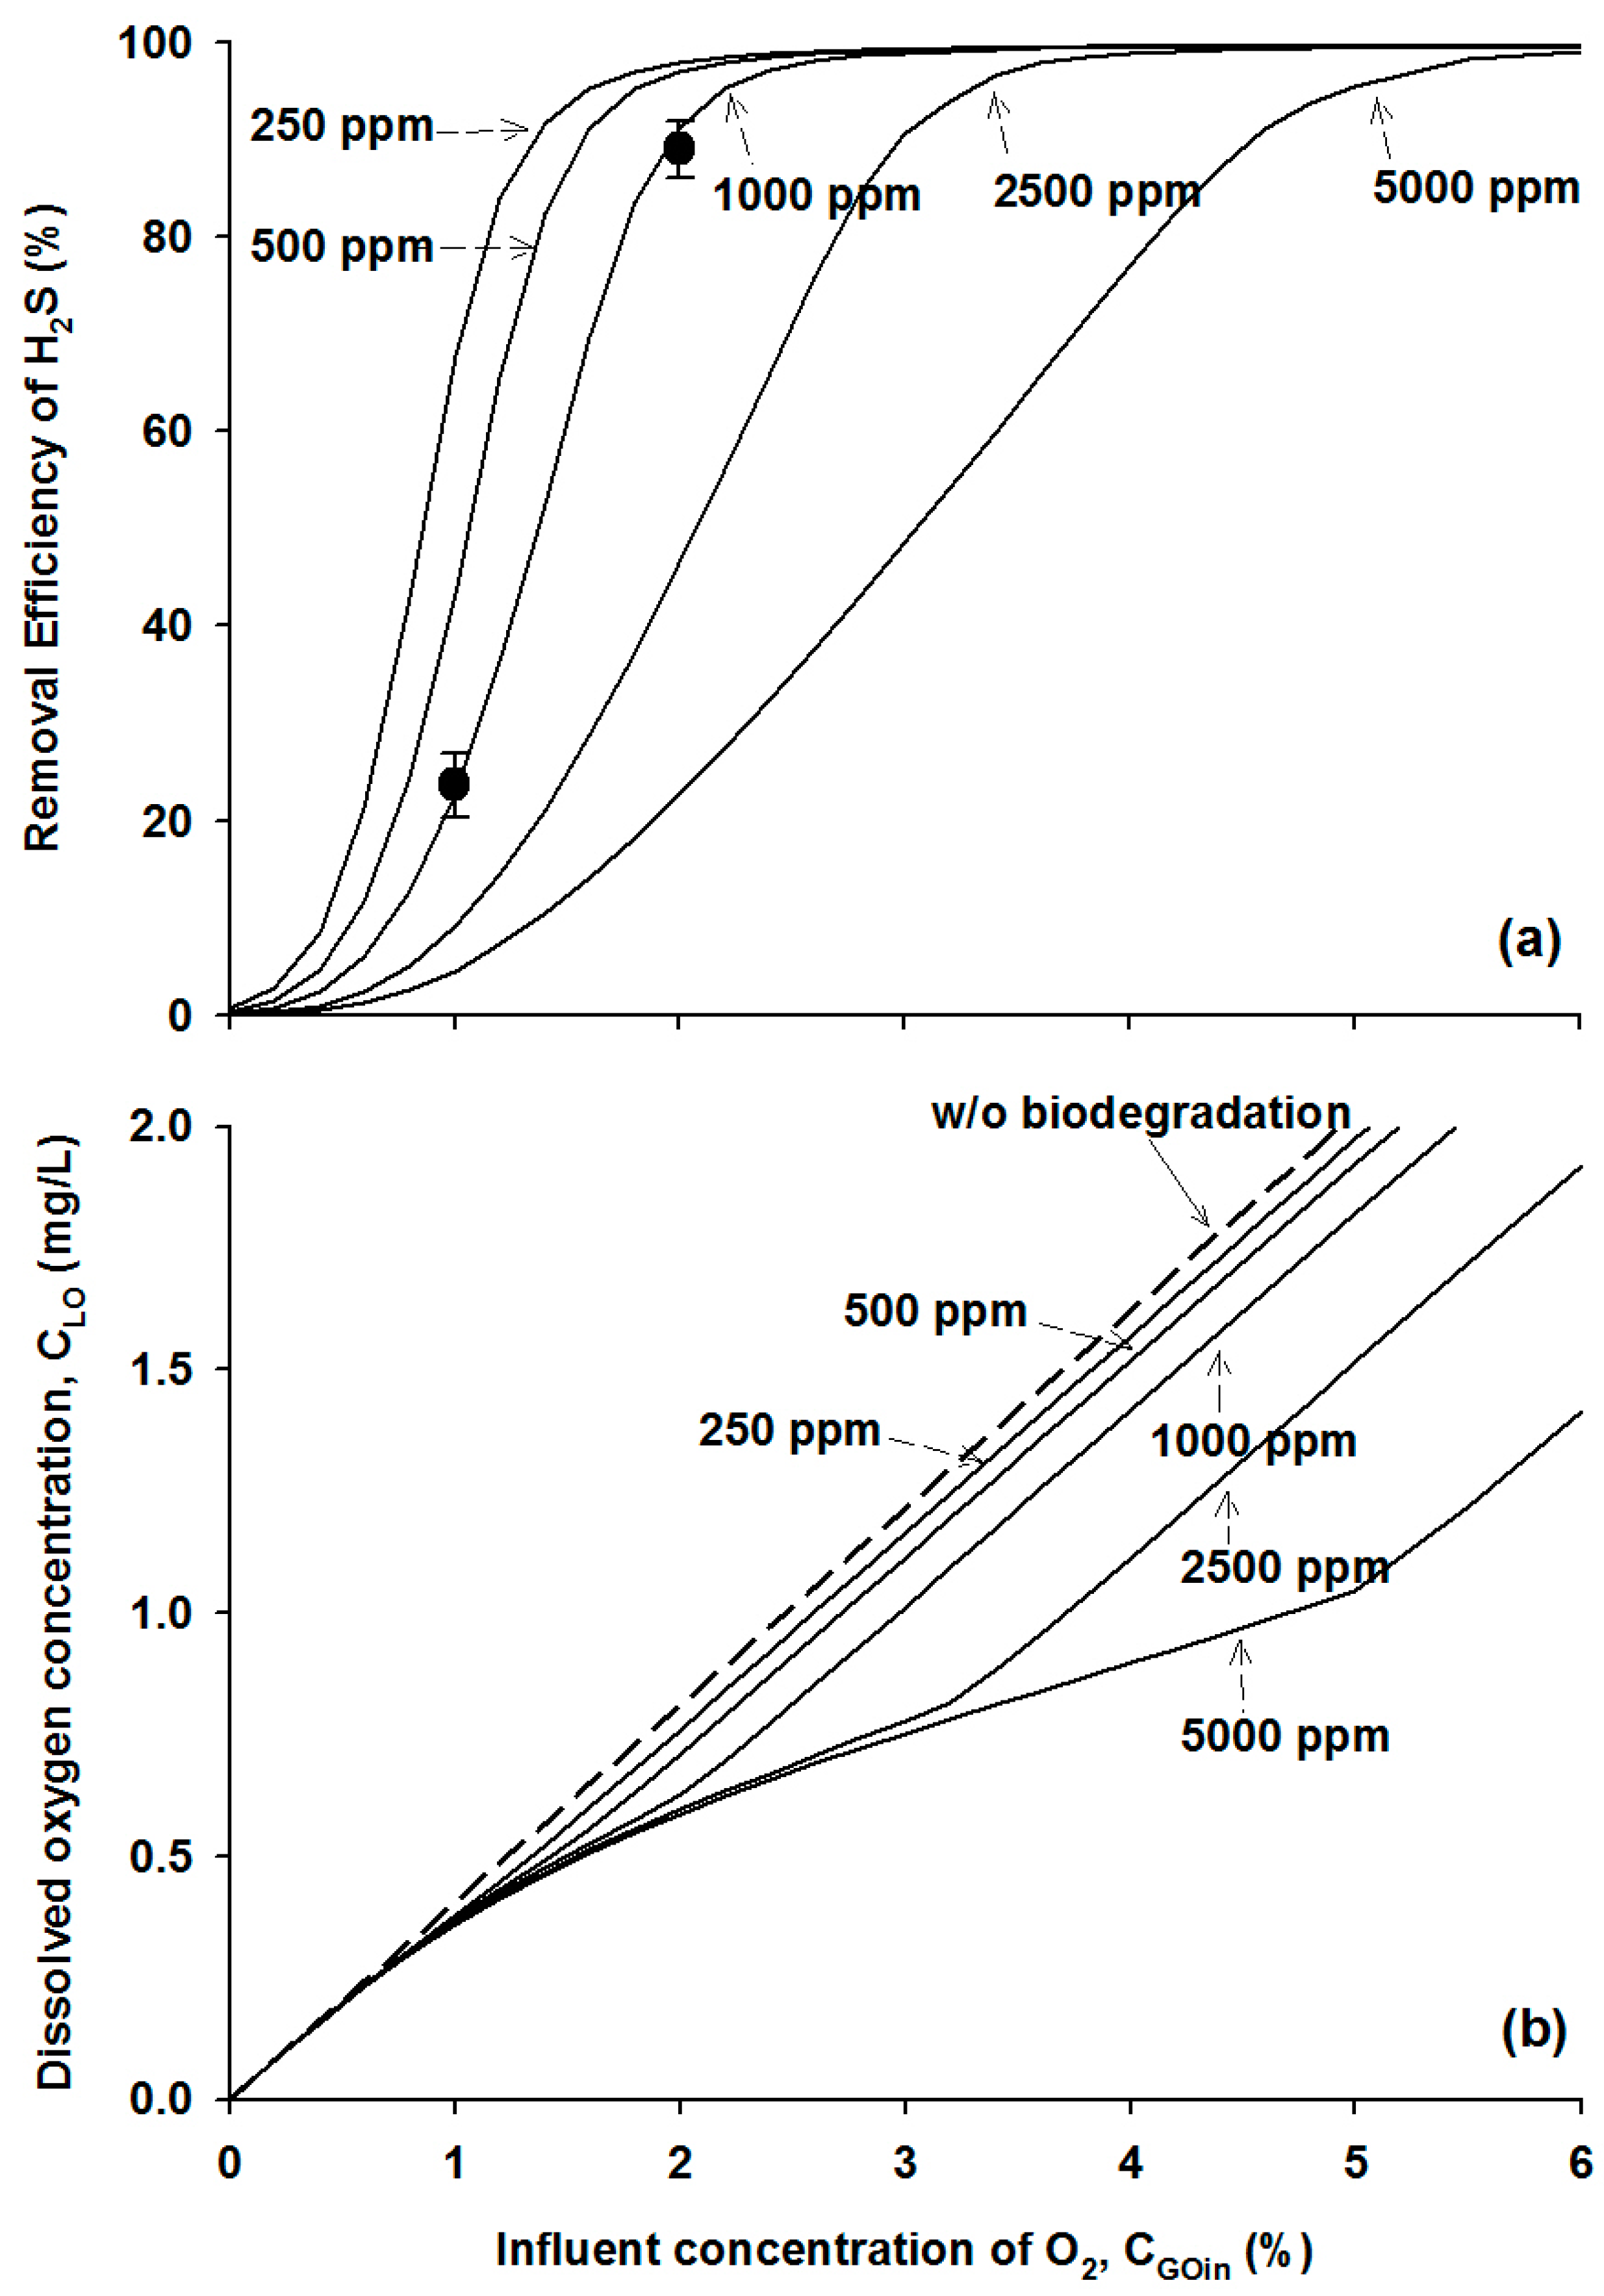
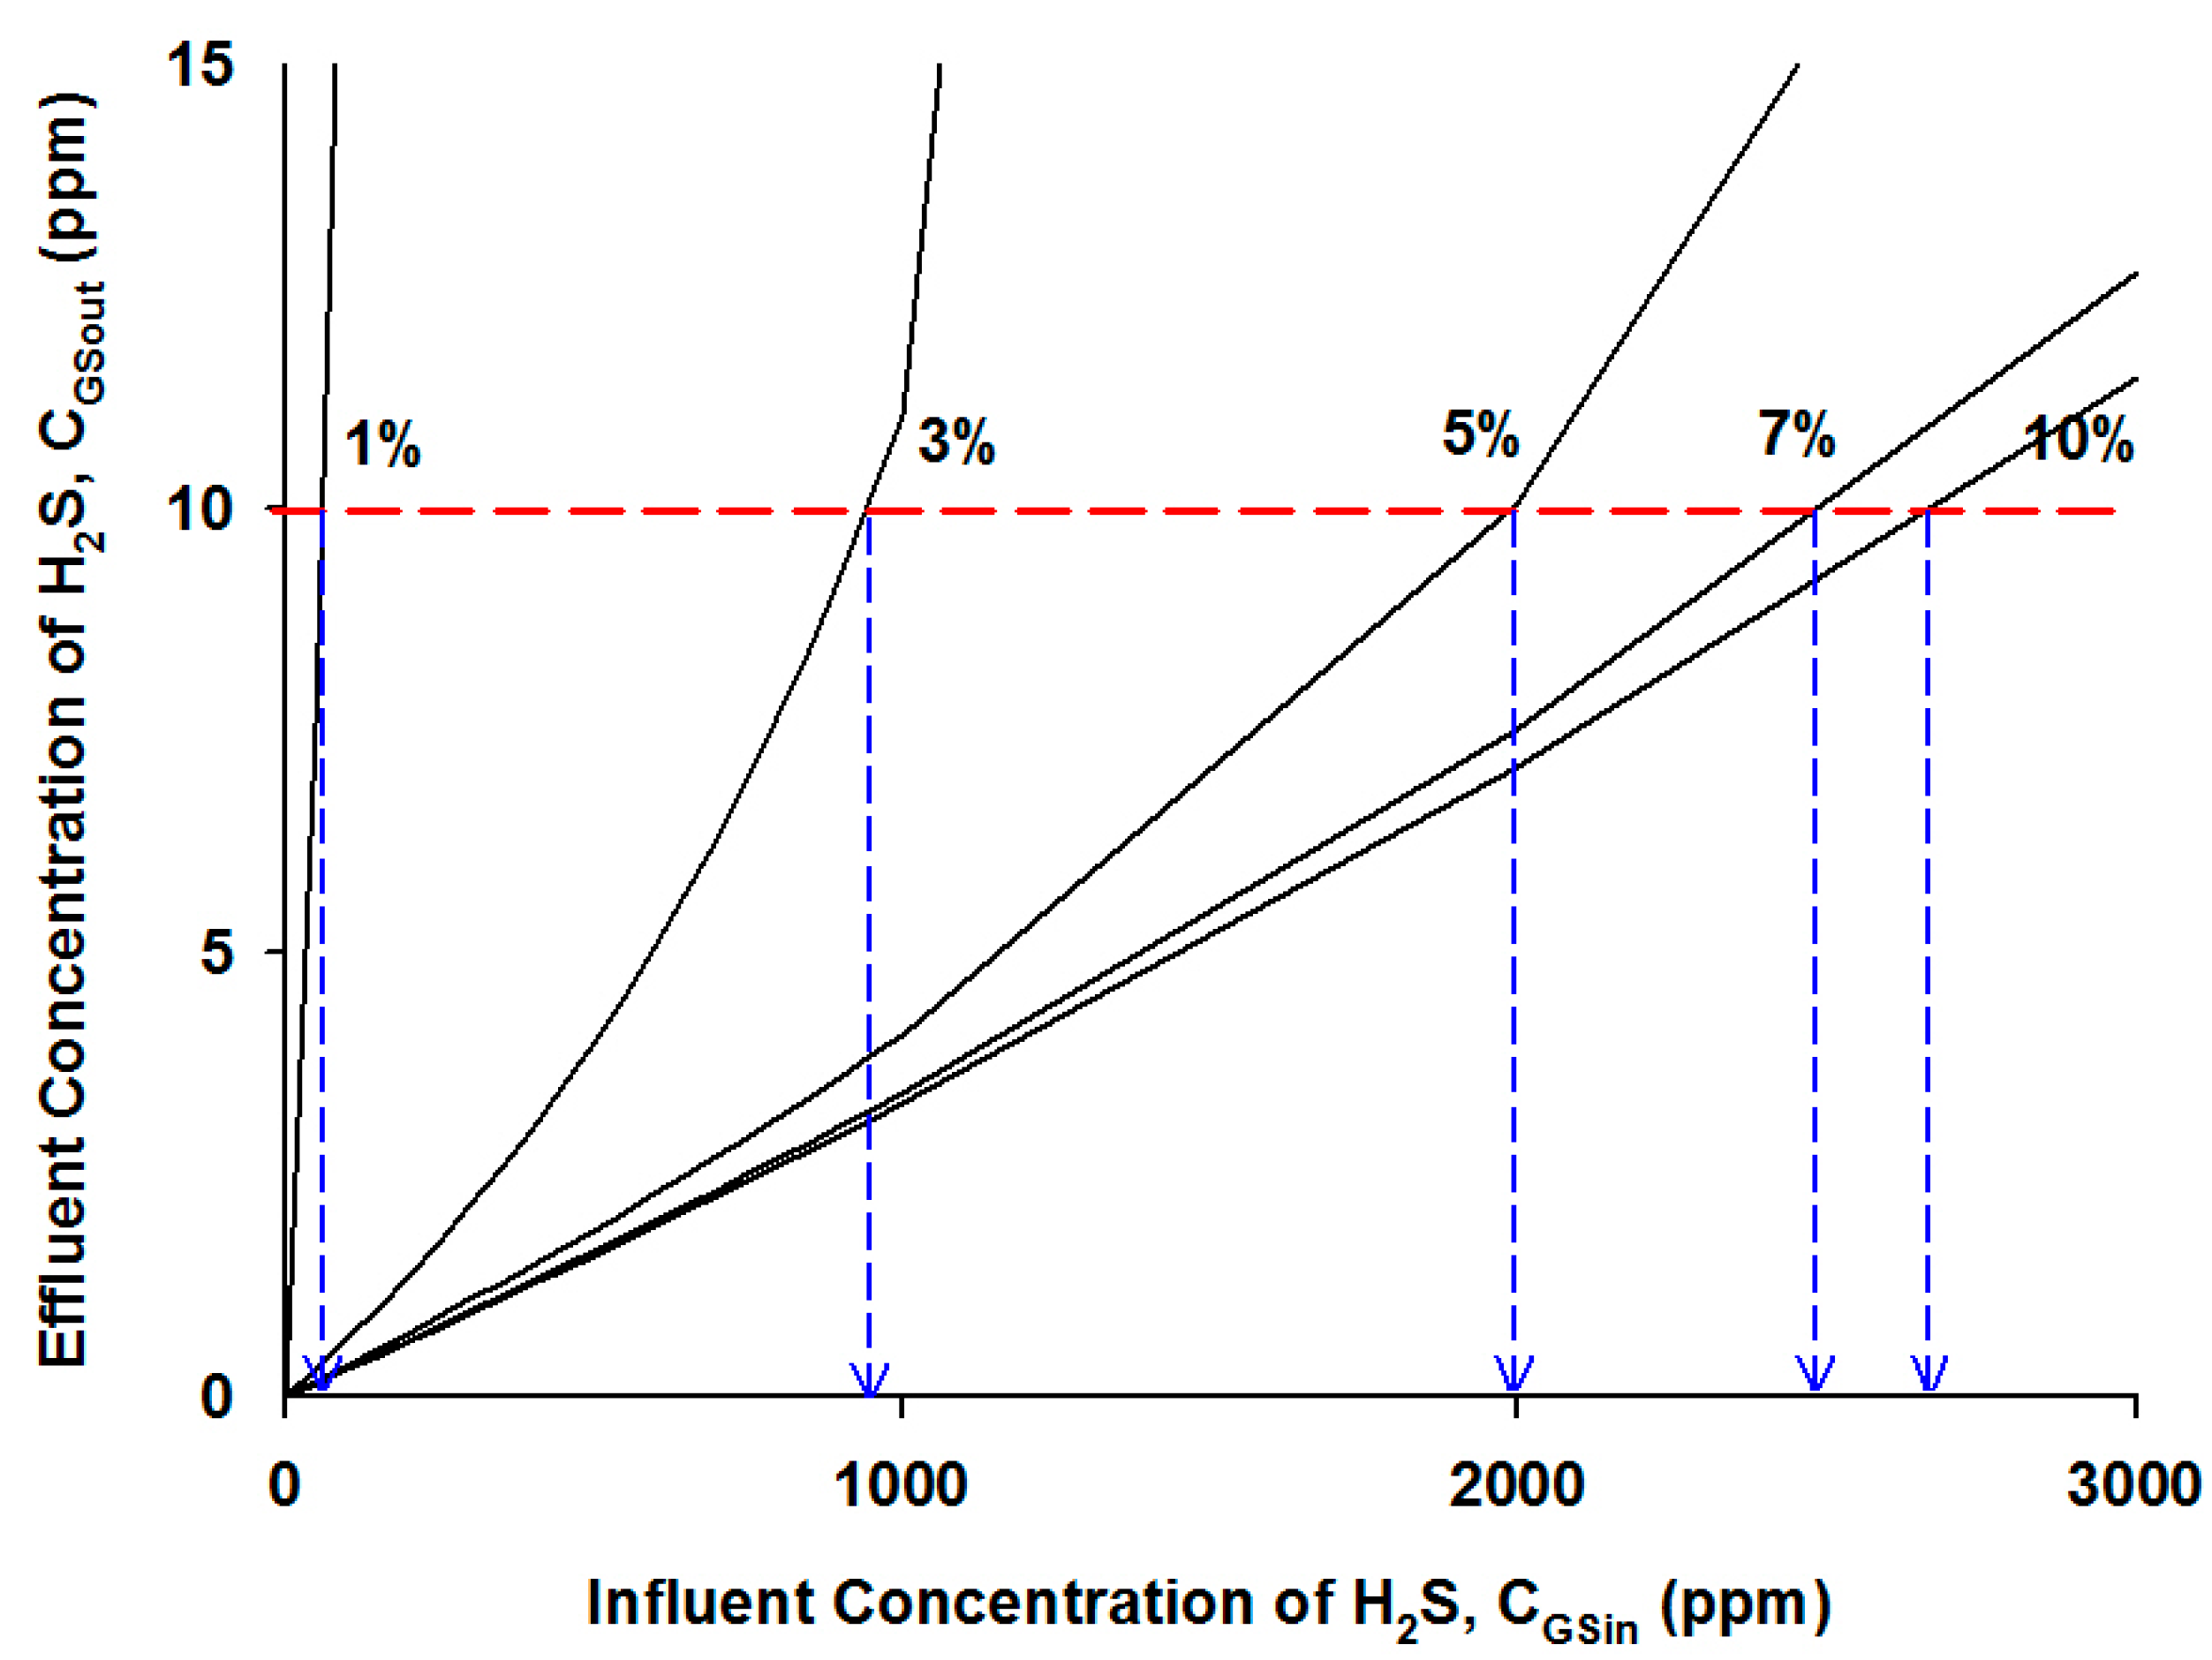
4.2.3. Effects of Influent H2S Concentration

5. Conclusions
Nomenclature
| Cin | the concentration of the compound introduced to the bioreactor (mg/L) |
| CGin | the concentration of the compound entering the bioreactor in the gas stream (mg/L) |
| CGSin | the influent concentration of H2S entering the bioreactor in the gas stream (mg/L) |
| CGOin | the influent concentration of oxygen in the gas stream (mg/L) |
| CGSout | the effluent concentration of H2S exiting the bioreactor in the gas stream (mg/L) |
| CGOout | the effluent concentration of oxygen in the gas stream (mg/L) |
| CL | the concentration of the compound in the liquid phase (mg/L) |
| CLS | the H2S concentration in the liquid phase (mg/L) |
| CLO | the oxygen concentration in the liquid Phase (mg/L) |
| DS | the diffusion coefficient of H2S in the liquid (cm2/sec) |
| DO | the diffusion coefficient of oxygen in the liquid (cm2/sec) |
| H | the Henry’s law constant (-) |
| HS | the Henry’s law constant of H2S (-) |
| HO | the Henry’s law constant of oxygen (-) |
| KLa | the mass transfer coefficient (min-1) |
| KLaS | the mass transfer coefficient of H2S (min-1) |
| KLaO | the mass transfer coefficient of oxygen (min-1) |
| KS | the half saturation constant of H2S (mg-S/L) |
| KO | the kinetic constant of oxygen (mg-O/L) |
| μ | the specific growth rate (min-1) |
| μmax | the maximum specific growth rate (min-1) |
| Q | the gas flow rate (L/min) |
| Rab | the compound removal rate by absorption (mg/min) |
| Rbio | the compound removal rate by biodegradation (mg/min) |
| γbio | the biomass growth kinetic (-) |
| VG | the volume of the gas in the liquid (L) |
| VL | the effective liquid volume (L) |
| X | the biomass density in the liquid (mg-dry weight/L) |
| YX/S | the yield coefficient of the biomass depending on H2S (mg-dry weight/mg-S) |
| YX/O | the yield coefficient of the biomass depending on oxygen (mg-dry weight/mg-O) |
Acknowledgments
Author Contributions
Conflicts of Interest
References
- Kim, Y.S.; Yoon, Y.M.; Kim, C.H.; Giersdorf, J. Status of biogas technologies and policies in South Korea. Renew. Sustain. Energy Rev. 2012, 16, 3430–3438. [Google Scholar] [CrossRef]
- Nizami, A.S.; Murphy, J.D. What type of digester configurations should be employed to produce biomethane from grass silage? Renew. Sustain. Energy Rev. 2010, 14, 1558–1568. [Google Scholar] [CrossRef]
- Takuwa, Y.; Matsumoto, T.; Oshita, K. Characterization of trace constituents in landfill gas and a comparison of sites in Asia. J. Mater. Cycles Waste Manag. 2009, 11, 305–311. [Google Scholar] [CrossRef]
- Rasi, S.; Lantela, J.; Rintala, J. Trace compounds affection biogas energy utilisation—A review. Energy Convers. Manag. 2011, 52, 3369–3375. [Google Scholar] [CrossRef]
- Ryckebosch, E.; Drouillon, M.; Vervaeren, H. Techniques for transformation of biogas to biomethane. Biomass Bioenergy 2011, 35, 1633–1645. [Google Scholar] [CrossRef]
- Peu, P.; Picard, S.; Diara, A.; Girault, R.; Beline, F.; Bridoux, G.; Dabert, P. Prediction of hydrogen sulphide production during anaerobic digestion. Bioresour. Technol. 2012, 121, 419–424. [Google Scholar] [CrossRef] [PubMed]
- Persson, M; Jonsson, O.; Wellinger, A. Biogas Upgrading to Vehicle Fuel Standards and Grid Injection; Task 37; IEA Bioenergy: Paris, France, 2007. [Google Scholar]
- Lin, W.C.; Chen, Y.P.; Tseng, C.P. Pilot-scale chemical-biological system for efficient H2S removal from biogas. Bioresour. Technol. 2013, 135, 283–291. [Google Scholar] [CrossRef] [PubMed]
- Petersson, A.; Wellinger, A. Biogas Upgrading Technologies Developments and Innovations; Task 37; IEA Bioenergy: Paris, France, 2007. [Google Scholar]
- Panza, D.; Belgiorno, V. Hydrogen sulphide removal from landfill gas. Process Saf. Environ. Prot. 2010, 88, 420–424. [Google Scholar] [CrossRef]
- Zhang, L.; Schryver, P.D.; Gusseme, B.D.; Muynck, W.D.; Boon, N.; Verstraete, W. Chemical and biological technologies for hydrogen sulfide emission control in sewer systems: A review. Water Res. 2008, 42, 1–12. [Google Scholar] [CrossRef] [PubMed]
- Elias, A.; Barona, A.; Arreguy, A.; Rios, J.; Aranguiz, I.; Penas, J. Evaluation of a packing material for the biodegradation of H2S and product analysis. Process Biochem. 2002, 37, 813–820. [Google Scholar] [CrossRef]
- Ramirez, M.; Fernandez, M.; Granada, C.; Borgne, S.L.; Gomez, J.M.; Cantero, D. Biofiltration of reduced sulphur compounds and community analysis of sulphur-oxidizing bacteria. Bioresour. Technol. 2011, 102, 4047–4053. [Google Scholar] [CrossRef] [PubMed]
- Kim, S.; Deshusses, M.A. Understanding the limits of H2S degrading biotrickling filters using a differential biotrickling filter. Chem. Eng. Sci. 2005, 113, 119–126. [Google Scholar] [CrossRef]
- Chaiprapat, S.; Mardthing, R.; Kantachote, D.; Karnchanawong, S. Removal of hydrogen sulfide by complete aerobic oxidation in acidic biofiltration. Process Biochem. 2011, 46, 344–352. [Google Scholar] [CrossRef]
- Oyarzun, P.; Arancibia, F.; Canales, C.; Aroca, G.E. Biofiltration of high concentration of hydrogen sulphide using Thiobacillus thioparus. Process Biochem. 2003, 39, 165–170. [Google Scholar] [CrossRef]
- Montebello, A.M.; Fernández, M.; Almenglo, F.; Ramírez, M.; Cantero, D.; Baeza, M.; Gabriel, D. Simultaneous methylmercaptan and hydrogen sulfide removal in the desulfurization of biogas in aerobic and anoxic biotrickling filters. Chem. Eng. J. 2012, 200–202, 237–246. [Google Scholar]
- Soreanu, G.; Beland, M.; Falletta, P.; Edmonson, K.; Seto, P. Laboratory pilot scale study for H2S removal from biogas in an anoxic biotrickling filter. Water Sci. Technol. 2008, 57, 201–207. [Google Scholar] [CrossRef] [PubMed]
- Alcantara, S.; Velasco, A.; Munoz, A.; Cid, J.; Revah, S.; Razo-Flores, E. Hydrogen sulfide oxidation by a microbial consortium in a recirculation reactor system: Sulfur formation under oxygen limitation and removal of phenols. Environ. Sci. Technol. 2004, 38, 918–923. [Google Scholar] [CrossRef] [PubMed]
- Potivichayanon, S.; Pokethitiyook, P.; Kruatrachue, M. Hydrogen sulfide removal by a novel fixed-film bioscrubber system. Process Biochem. 2006, 41, 708–715. [Google Scholar] [CrossRef]
- Montebello, A.M.; Bezerra, T.; Rovira, R.; Rago, L.; Lafuente, J.; Gamisans, X.; Campoy, S.; Baeza, M.; Gabriel, D. Operation aspects, pH transition and microbial shifts of a H2S desulfurizing biotrickling filter with random packing material. Chemosphere 2013, 93, 2675–2682. [Google Scholar] [CrossRef] [PubMed]
- Lee, E.Y.; Lee, N.Y.; Cho, K.S.; Ryu, H.W. Removal of hydrogen sulfide by sulfate-resistant Acidithiobacillus. thiooxidans AZ11. J. Biosci. Bioeng. 2006, 101, 309–314. [Google Scholar] [CrossRef]
- Takano, B.; Koshida, M.; Fujiwara, Y.; Sugimori, K.; Takayanagi, S. Influence of sulfur-oxidizing bacteria on the budget of sulfate in Yugama crater lake, Kusatsu-Shirane volcano, Japan. Biogeochemistry 1997, 38, 227–253. [Google Scholar] [CrossRef]
- Namgung, H.K.; Song, J.H. Effects of mass transfer in a two-stage bioreactor for desulfurization of biogas. In Biotechniques for Air Pollution Control & Bioenergy; Presses des Mines: Nimes, France, 2013. [Google Scholar]
- Insel, G; Hocaoglu, S.M.; Cokgor, E.U.; Orhon, D. Modelling the effect of biomass induced oxygen transfer limitations on the nitrogen removal performance of membrane bioreactor. J. Membr. Sci. 2011, 368, 54–63. [Google Scholar] [CrossRef]
- Xu, X.; Chen, C.; Lee, D.J.; Wang, A.; Guo, W.; Zhou, X.; Guo, H.; Yuan, Y.; Ren, N.; Chang, J.S. Sulfate-reduction, sulfide-oxidation and elemental sulfur bioreduction process: Modeling and experimental validation. Bioresour. Technol. 2013, 147, 202–211. [Google Scholar] [CrossRef] [PubMed]
- Omar, R.; Abdullah, M.A.; Hasan, M.A.; Rosfarizan, M.; Marziah, M. Kinetics and modelling of cell growth and substrate uptake in Centella asiatica cell culture. Biotechnol. Bioprocess Eng. 2006, 11, 223–229. [Google Scholar] [CrossRef]
- Kappeler, J.; Gujer, W. Estimation of kinetic parameters of heterotrophic biomass under aerobic conditions and characterization of wastewater for activated sludge modelling. Water Sci. Technol. 1992, 25, 125–139. [Google Scholar]
- Gourdon, R.; Funtowicz, N. Kinetic model of elemental sulfur oxidation by Thiobacillus thiooxidans in batch slurry reactors. Bioprocess Eng. 1998, 18, 241–249. [Google Scholar]
- Benjamin, M.M.; lawler, D.F. Water Quality Engineering: Phsyical/Chemical Treatment Processes; WILEY: New Jersey, NJ, USA, 2013; Volume Chapter 5. [Google Scholar]
© 2015 by the authors; licensee MDPI, Basel, Switzerland. This article is an open access article distributed under the terms and conditions of the Creative Commons Attribution license (http://creativecommons.org/licenses/by/4.0/).
Share and Cite
Namgung, H.-K.; Song, J. The Effect of Oxygen Supply on the Dual Growth Kinetics of Acidithiobacillus thiooxidans under Acidic Conditions for Biogas Desulfurization. Int. J. Environ. Res. Public Health 2015, 12, 1368-1386. https://doi.org/10.3390/ijerph120201368
Namgung H-K, Song J. The Effect of Oxygen Supply on the Dual Growth Kinetics of Acidithiobacillus thiooxidans under Acidic Conditions for Biogas Desulfurization. International Journal of Environmental Research and Public Health. 2015; 12(2):1368-1386. https://doi.org/10.3390/ijerph120201368
Chicago/Turabian StyleNamgung, Hyeong-Kyu, and JiHyeon Song. 2015. "The Effect of Oxygen Supply on the Dual Growth Kinetics of Acidithiobacillus thiooxidans under Acidic Conditions for Biogas Desulfurization" International Journal of Environmental Research and Public Health 12, no. 2: 1368-1386. https://doi.org/10.3390/ijerph120201368
APA StyleNamgung, H.-K., & Song, J. (2015). The Effect of Oxygen Supply on the Dual Growth Kinetics of Acidithiobacillus thiooxidans under Acidic Conditions for Biogas Desulfurization. International Journal of Environmental Research and Public Health, 12(2), 1368-1386. https://doi.org/10.3390/ijerph120201368