
A Predictive Risk Model for A(H7N9) Human Infections Based on Spatial-Temporal Autocorrelation and Risk Factors: China, 2013–2014


Abstract
:1. Introduction
2. Materials and Methods
2.1. Data Collection and Processing
2.2. Spatial Autocorrelation Analysis
2.3. Temporal Cluster Analysis
2.4. Spatial-Temporal Factor Based on Descriptive Spatial-Temporal Statistics
2.4.1. Descriptive Spatial-Temporal Statistics

2.4.2. Spatial Factor, Temporal Factor and Spatial-Temporal Factor
2.5. Spatio-Temporal Sampling and Extracting Risk Factors
2.6. Logistic Regression Analysis and Modelling
2.6.1. Logistic Regression Analysis
2.6.2. Model Validation
3. Results
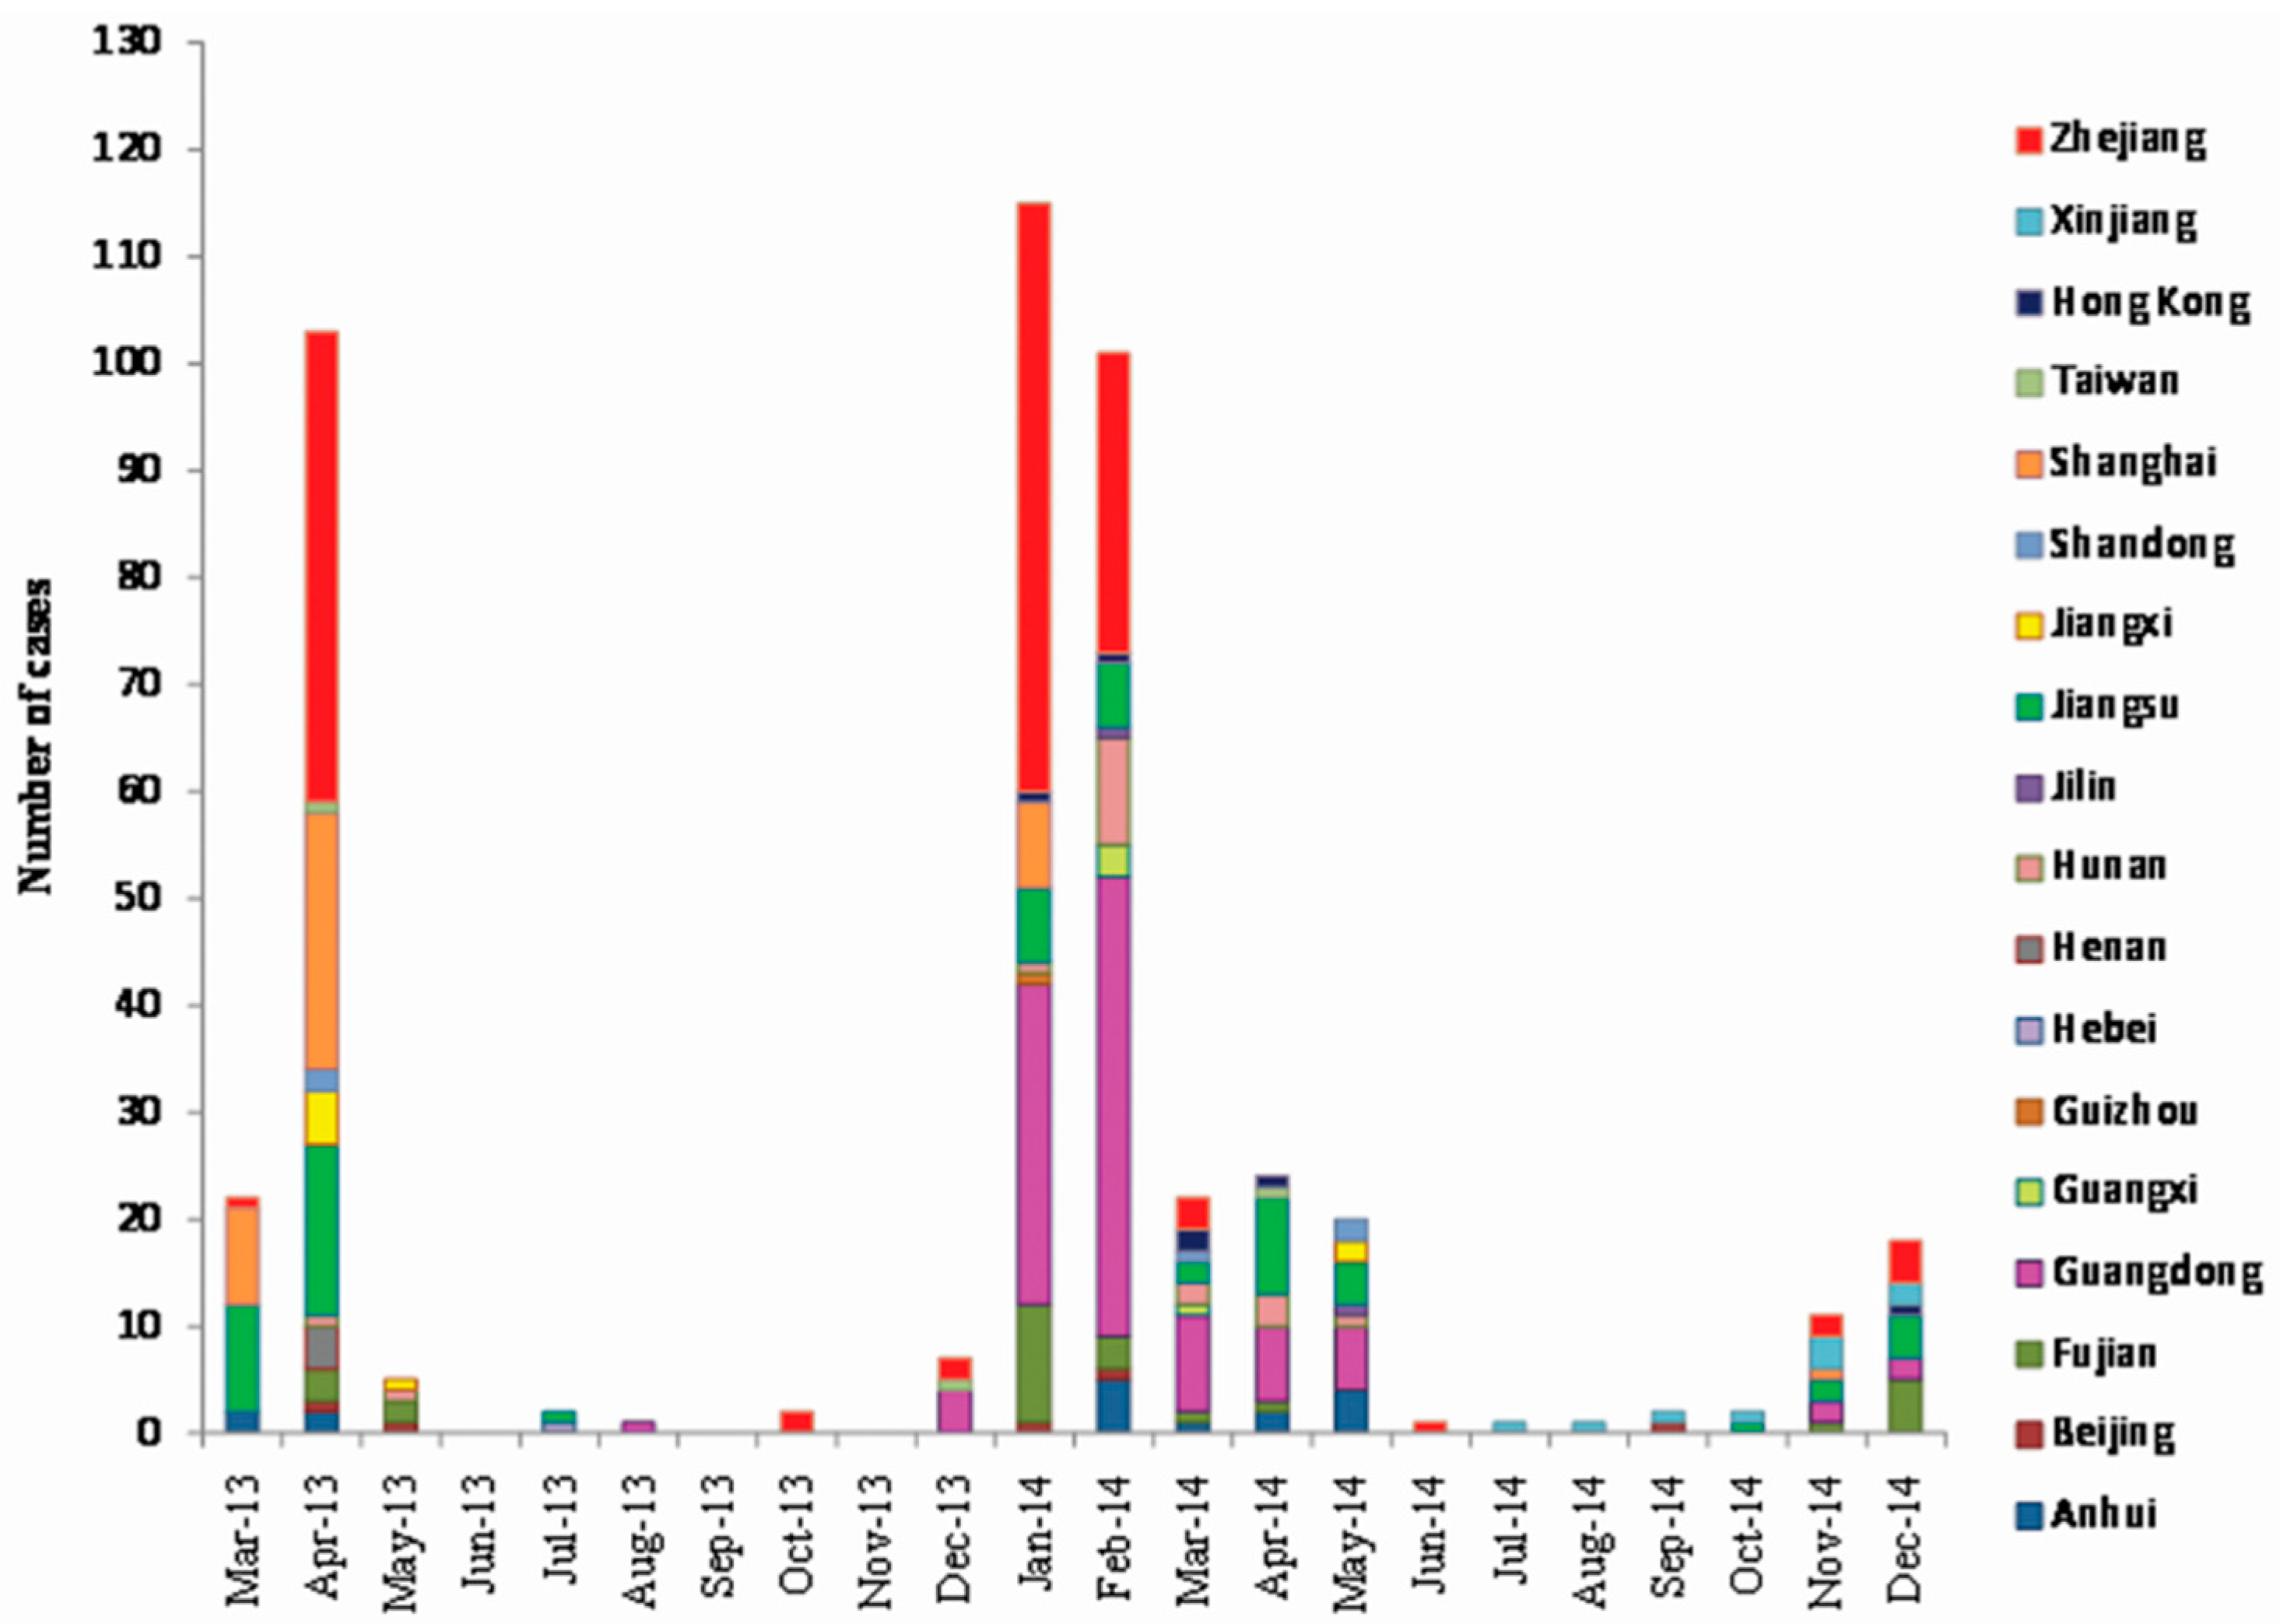
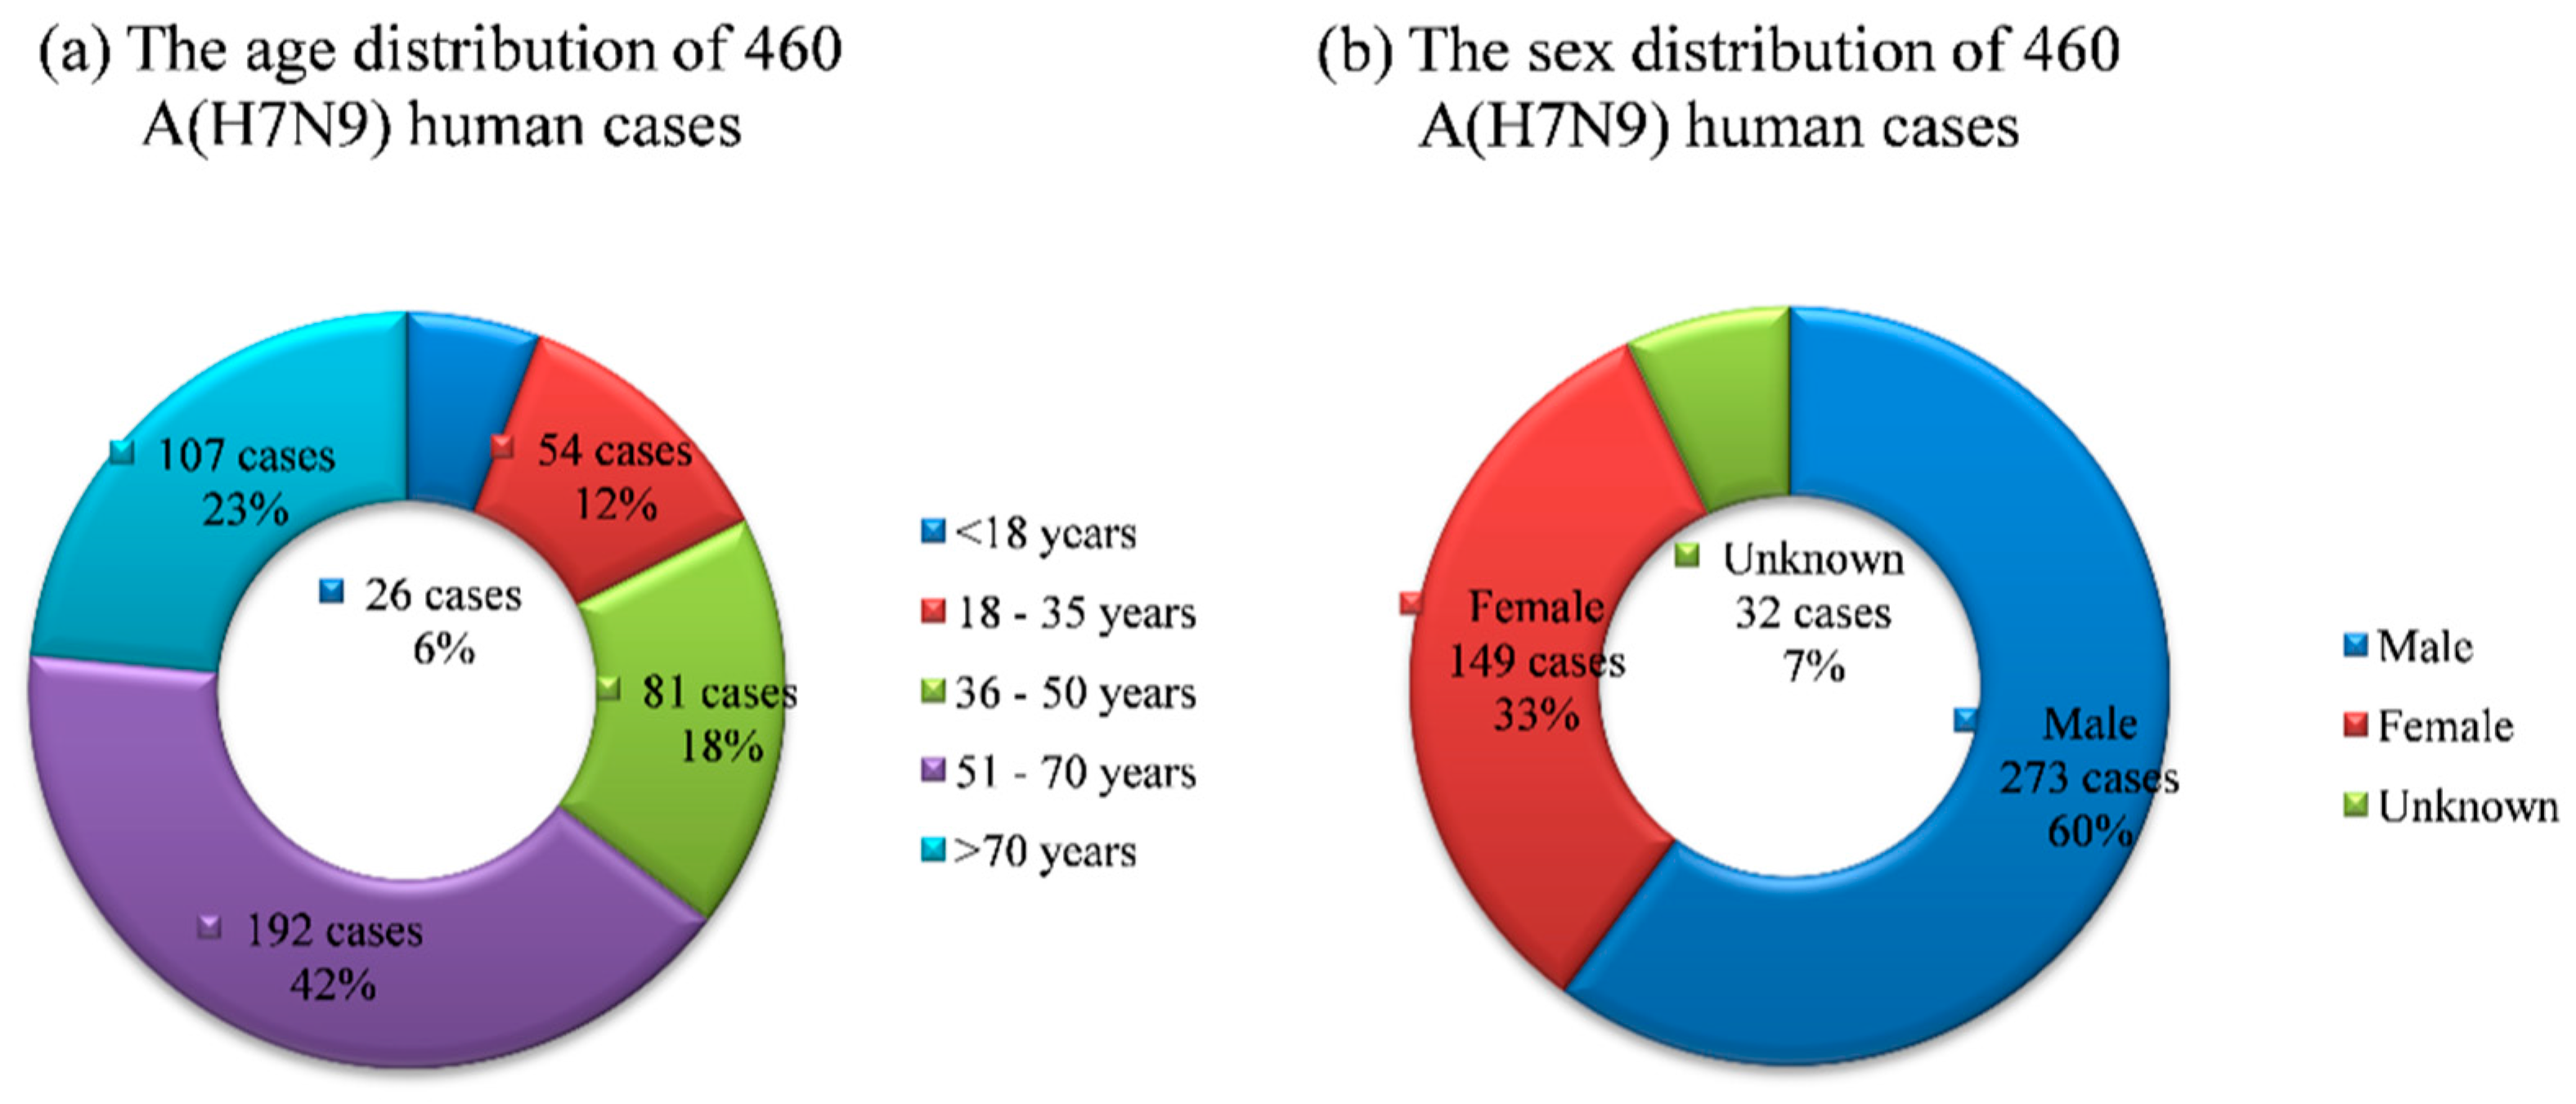
3.1. Case Analysis

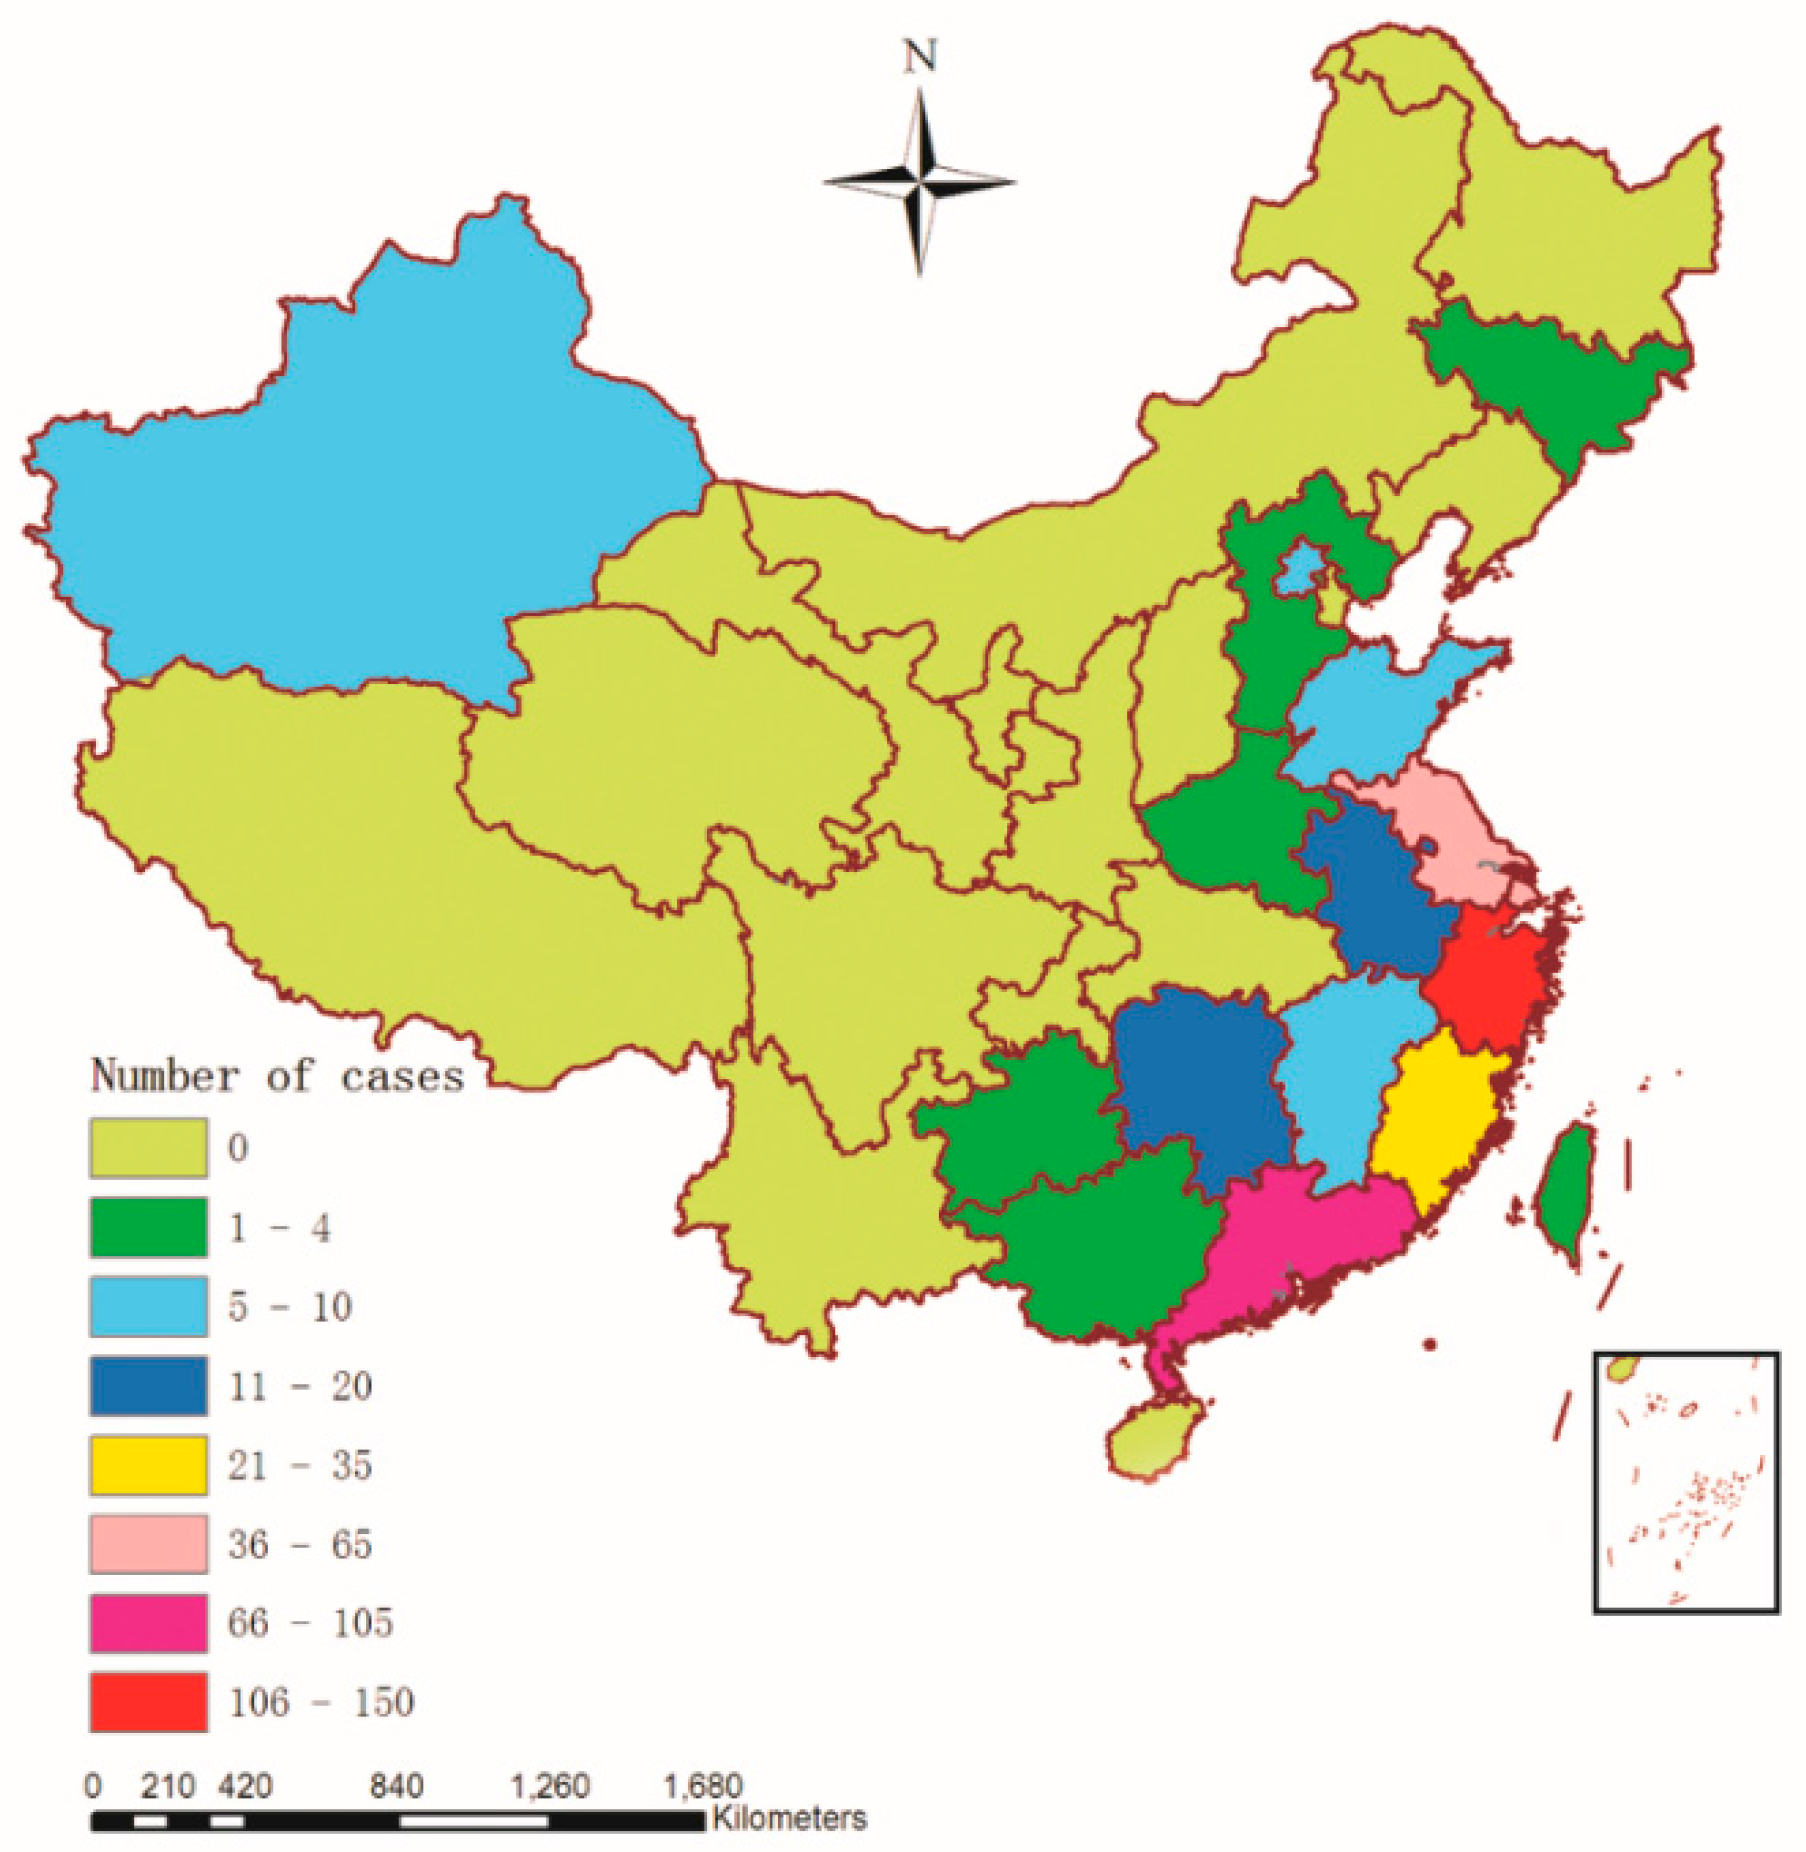
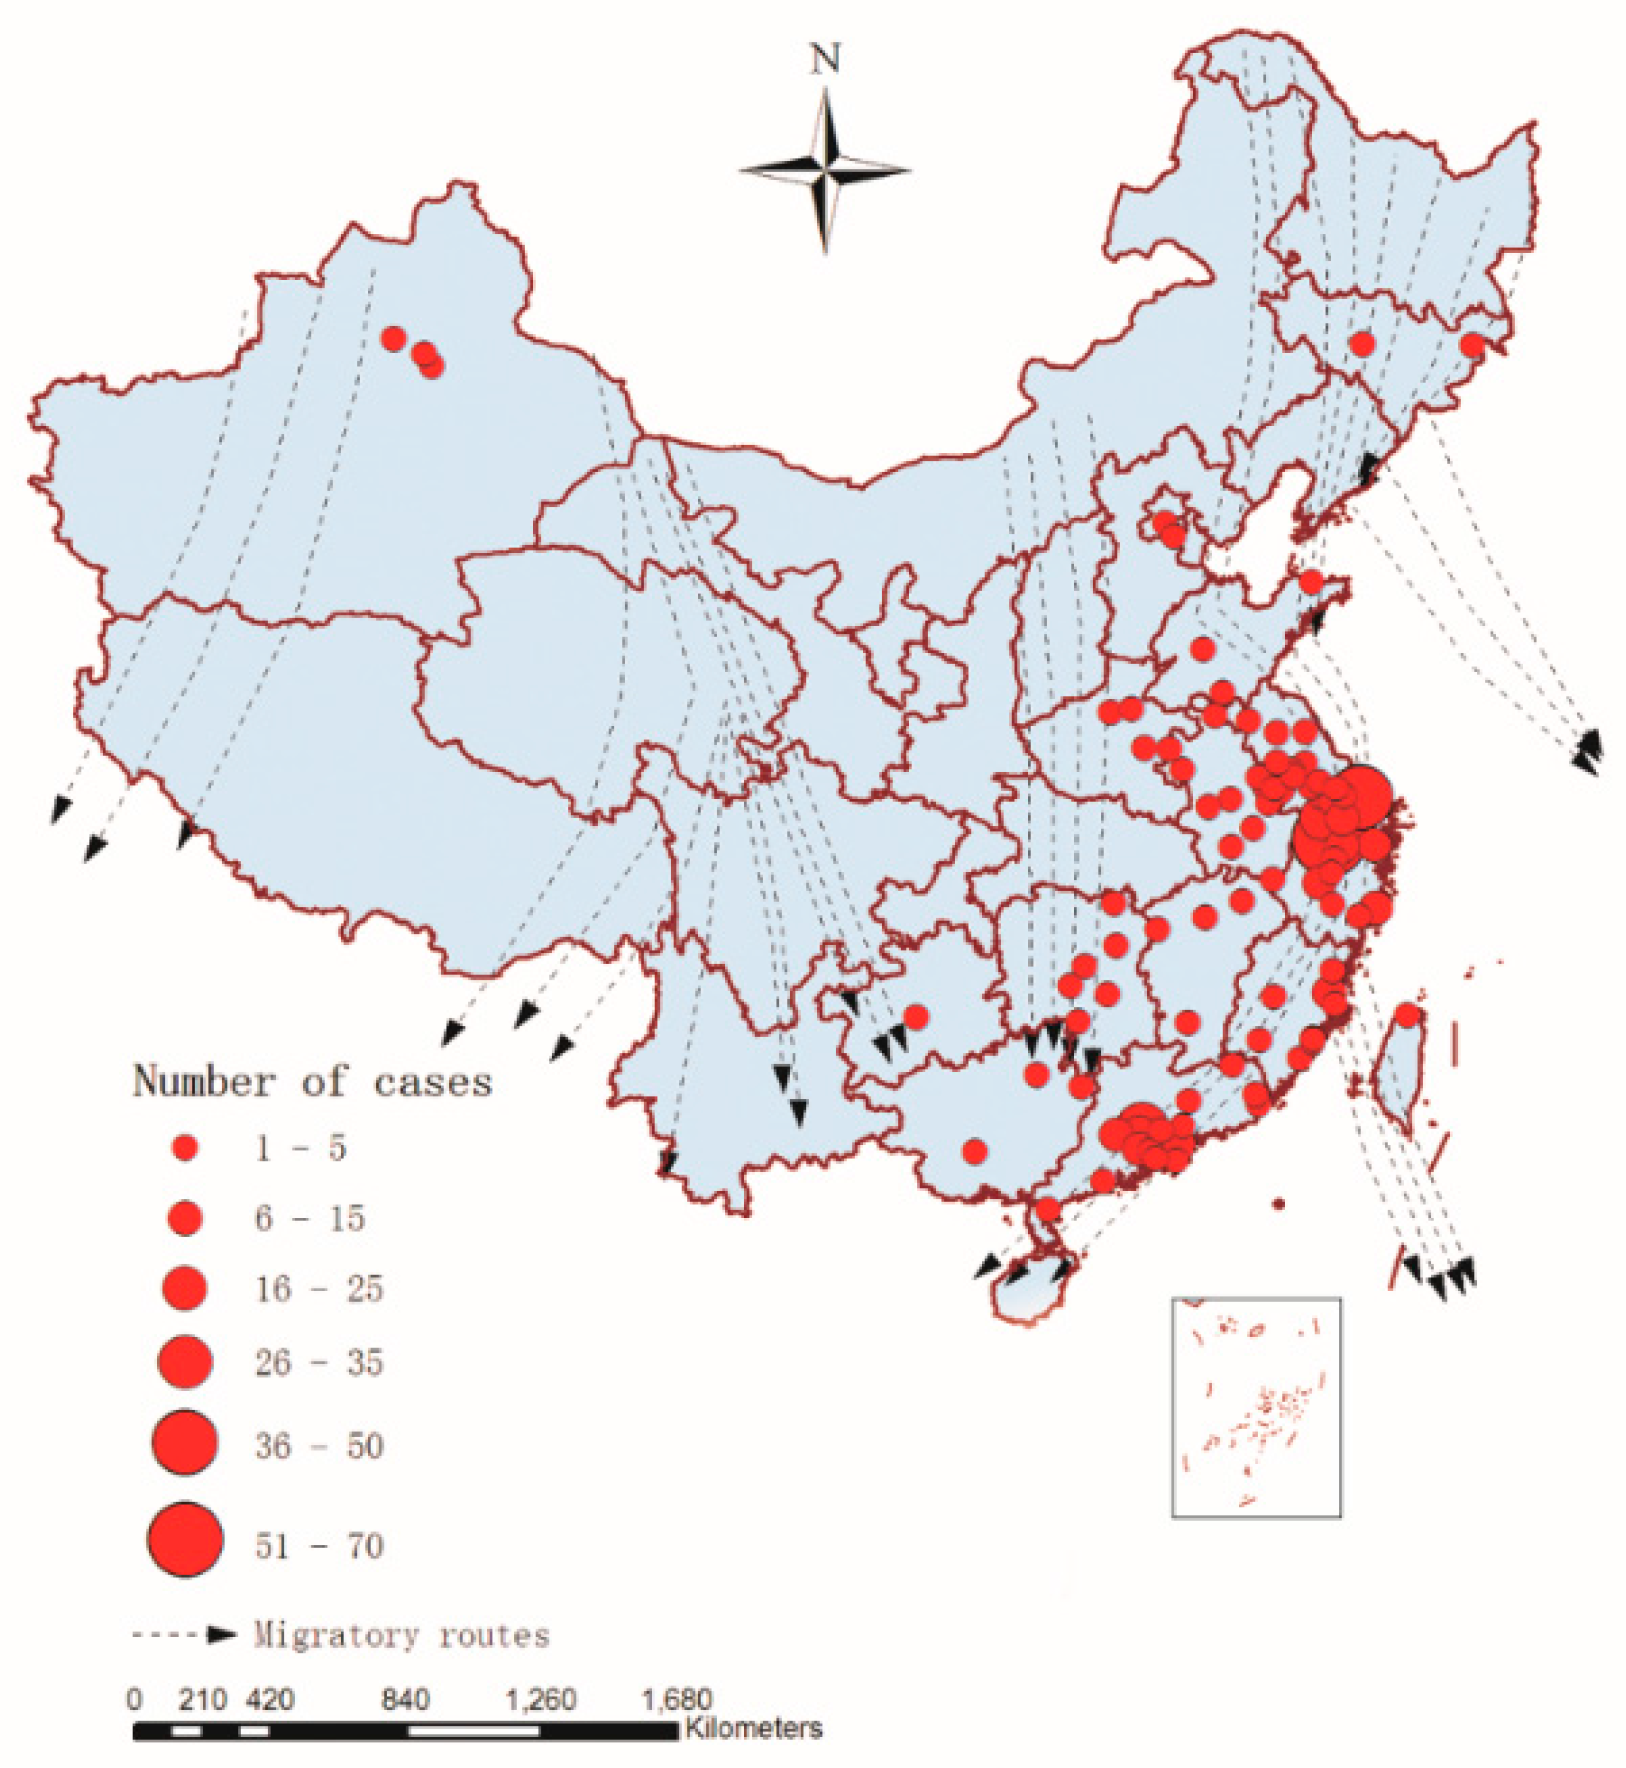
3.2. Spatial Distribution of A(H7N9) Human Infections

3.3. Spatial Autocorrelation Analysis

| Year | Moran’ I | Expected Index | Variance | Z Score | p-Value | Result |
|---|---|---|---|---|---|---|
| 2013 | 0.256836 | −0.030303 | 0.004767 | 4.158882 | 0.000032 | Clustered |
| 2014 | 0.073536 | −0.030303 | 0.001984 | 2.331500 | 0.019727 | Clustered |
3.4. Temporal Cluster Analysis
| Type | Year | Time Frame | Obs | Exp | LLR | RR | p Value |
|---|---|---|---|---|---|---|---|
| Most likely | 2013 | 2013/3/1 to 2013/4/30 | 125 | 62.70 | 60.065300 | 9.30 | 0.001 |
| Most likely | 2014 | 2014/1/1 to 2014/5/31 | 282 | 247.27 | 12.751988 | 2.24 | 0.001 |
| Secondary | - | - | - | - | - | - | - |
3.5. Modelling and Analysis
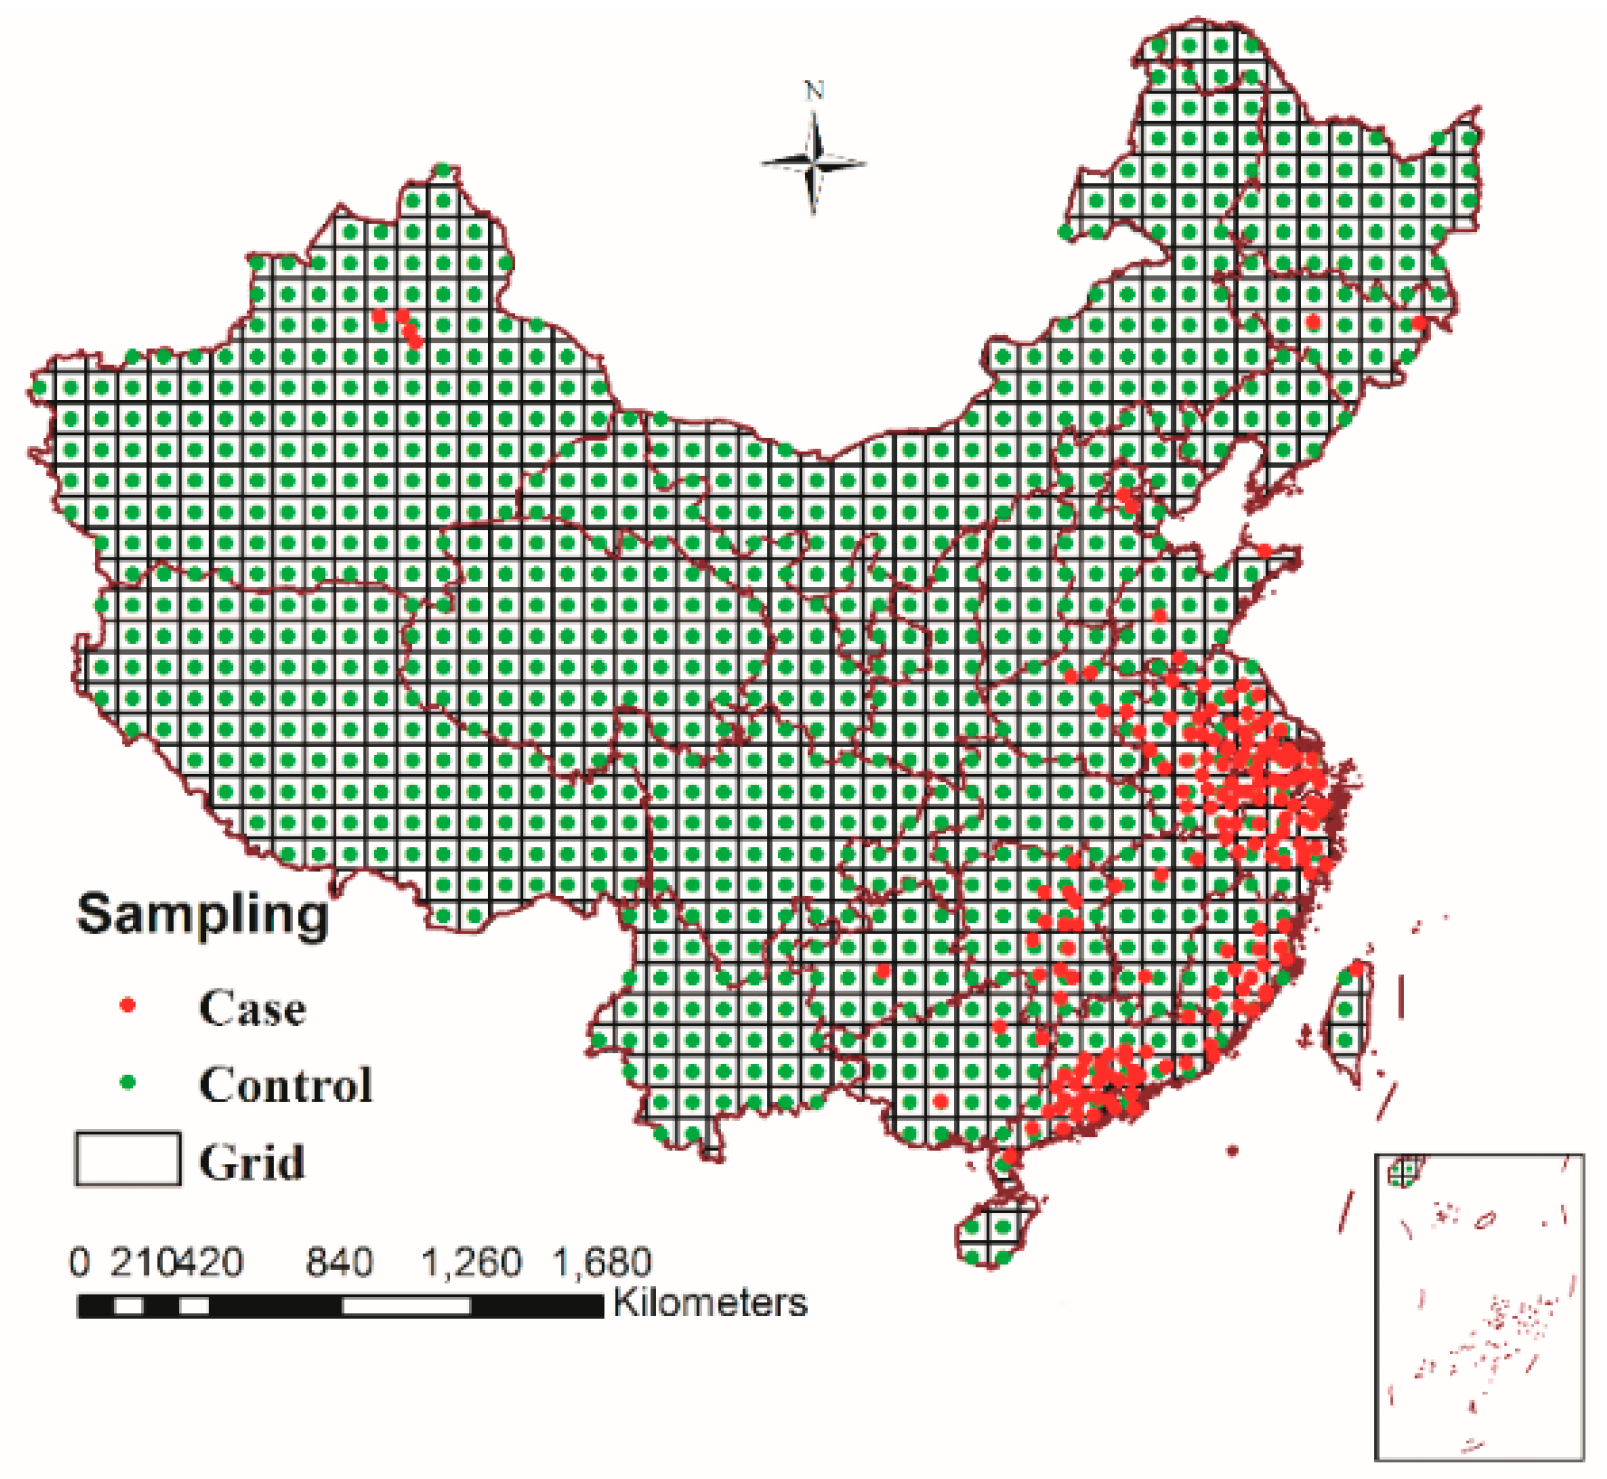
3.5.1. Spatio-Temporal Sampling and Extracting Risk Factors

3.5.2. Univariable Logistic Regression Analysis
| Risk Factors | Abbreviation | Description of Factors | Unit |
|---|---|---|---|
| railway | rw | Distance to the nearest railway | km |
| migration route | mig | Distance to the nearest migration route | km |
| spatial-temporal factor | φ | Spatial-temporal factor | No unit |
| wetland | w | Minimal distance to the nearest wetland | km |
| temperature | tem | Mean monthly temperature | °C |
| NDVI | vi | Normalized differential vegetation index | No unit |
| river | r | Minimal distance to the nearest river | km |
| lake | l | Minimal distance to the nearest lake | km |
| road | ro | Distance to the nearest main road | km |
| relative humidity | rh | Mean monthly relative humidity | % |
| precipitation | prec | Mean monthly precipitation | cm |
| Risk Factors | B | OR (95% CI) | p-Value |
|---|---|---|---|
| r | −0.275 | 0.759 (0.708–0.815) | <0.001 |
| l | −0.010 | 0.990 (0.987–0.993) | <0.001 |
| ro | −0.264 | 0.768 (0.717–0.822) | <0.001 |
| rw | −0.052 | 0.949 (0.935–0.964) | <0.001 |
| w | −0.005 | 0.995 (0.993–0.996) | 0.001 |
| tem | 0.103 | 1.109 (1.070–1.149) | <0.001 |
| vi | 1.519 | 4.568 (1.807–11.549) | 0.003 |
| rh | 0.259 | 1.295 (1.197–1.402) | <0.001 |
| prec | 0.103 | 1.108 (1.029–1.193) | 0.001 |
| mig | −0.033 | 0.967 (0.962–0.973) | <0.001 |
| φ | 27.698 | 1.070E12 (3.070E9–3.728E14) | <0.001 |
3.5.3. Multivariable Logistic Regression Analysis
| Risk Factors | Traditional Multivariate Analysis | Improved Multivariate Analysis | ||||
|---|---|---|---|---|---|---|
| B | OR (95% CI) | p-Value | B | OR (95% CI) | p-Value | |
| r | −0.138 | 0.872 (0.803–0.946) | <0.001 | −0.150 | 0.861 (0.798–0.929) | <0.001 |
| l | −0.009 | 0.991 (0.987–0.995) | 0.001 | −0.008 | 0.992 (0.989–0.996) | <0.001 |
| ro | −0.080 | 0.923 (0.887–0.961) | <0.001 | −0.099 | 0.906 (0.868–0.946) | <0.001 |
| rw | −0.040 | 0.961 (0.933–0.989) | 0.001 | −0.020 | 0.980 (0.970–0.991) | <0.001 |
| tem | 0.109 | 1.116 (1.026–1.213) | <0.001 | 0.157 | 1.170 (1.099–1.245) | 0.001 |
| rh | 0.274 | 1.316 (1.110–1.560) | <0.001 | 0.291 | 1.337 (1.211–1.477) | <0.001 |
| prec | −0.401 | 0.669 (0.531–0.844) | <0.001 | −0.487 | 0.615 (0.502–0.752) | <0.001 |
| mig | −0.016 | 0.984 (0.978–0.990) | <0.001 | −0.007 | 0.993 (0.990–0.997) | 0.001 |
| φ | - | - | - | 14.750 | 2,546,669.382 (220,444.087–29,420,271.688) | <0.001 |
| Constant | −20.838 | 0.000 | <0.001 | −20.096 | 0.000 | <0.001 |
| Observed | Predicted Results from Traditional Logistic Regression Model | Predicted Results from Improved Logistic Regression Model | ||||
|---|---|---|---|---|---|---|
| 0 | 1 | Percentage Correct | 0 | 1 | Percentage Correct | |
| 0 (917) | 828 | 89 | 90.3 | 851 | 66 | 92.8 |
| 1 (460) | 102 | 358 | 77.8 | 50 | 410 | 89.1 |
| Overall Percentage | 86.1 | 91.6 | ||||
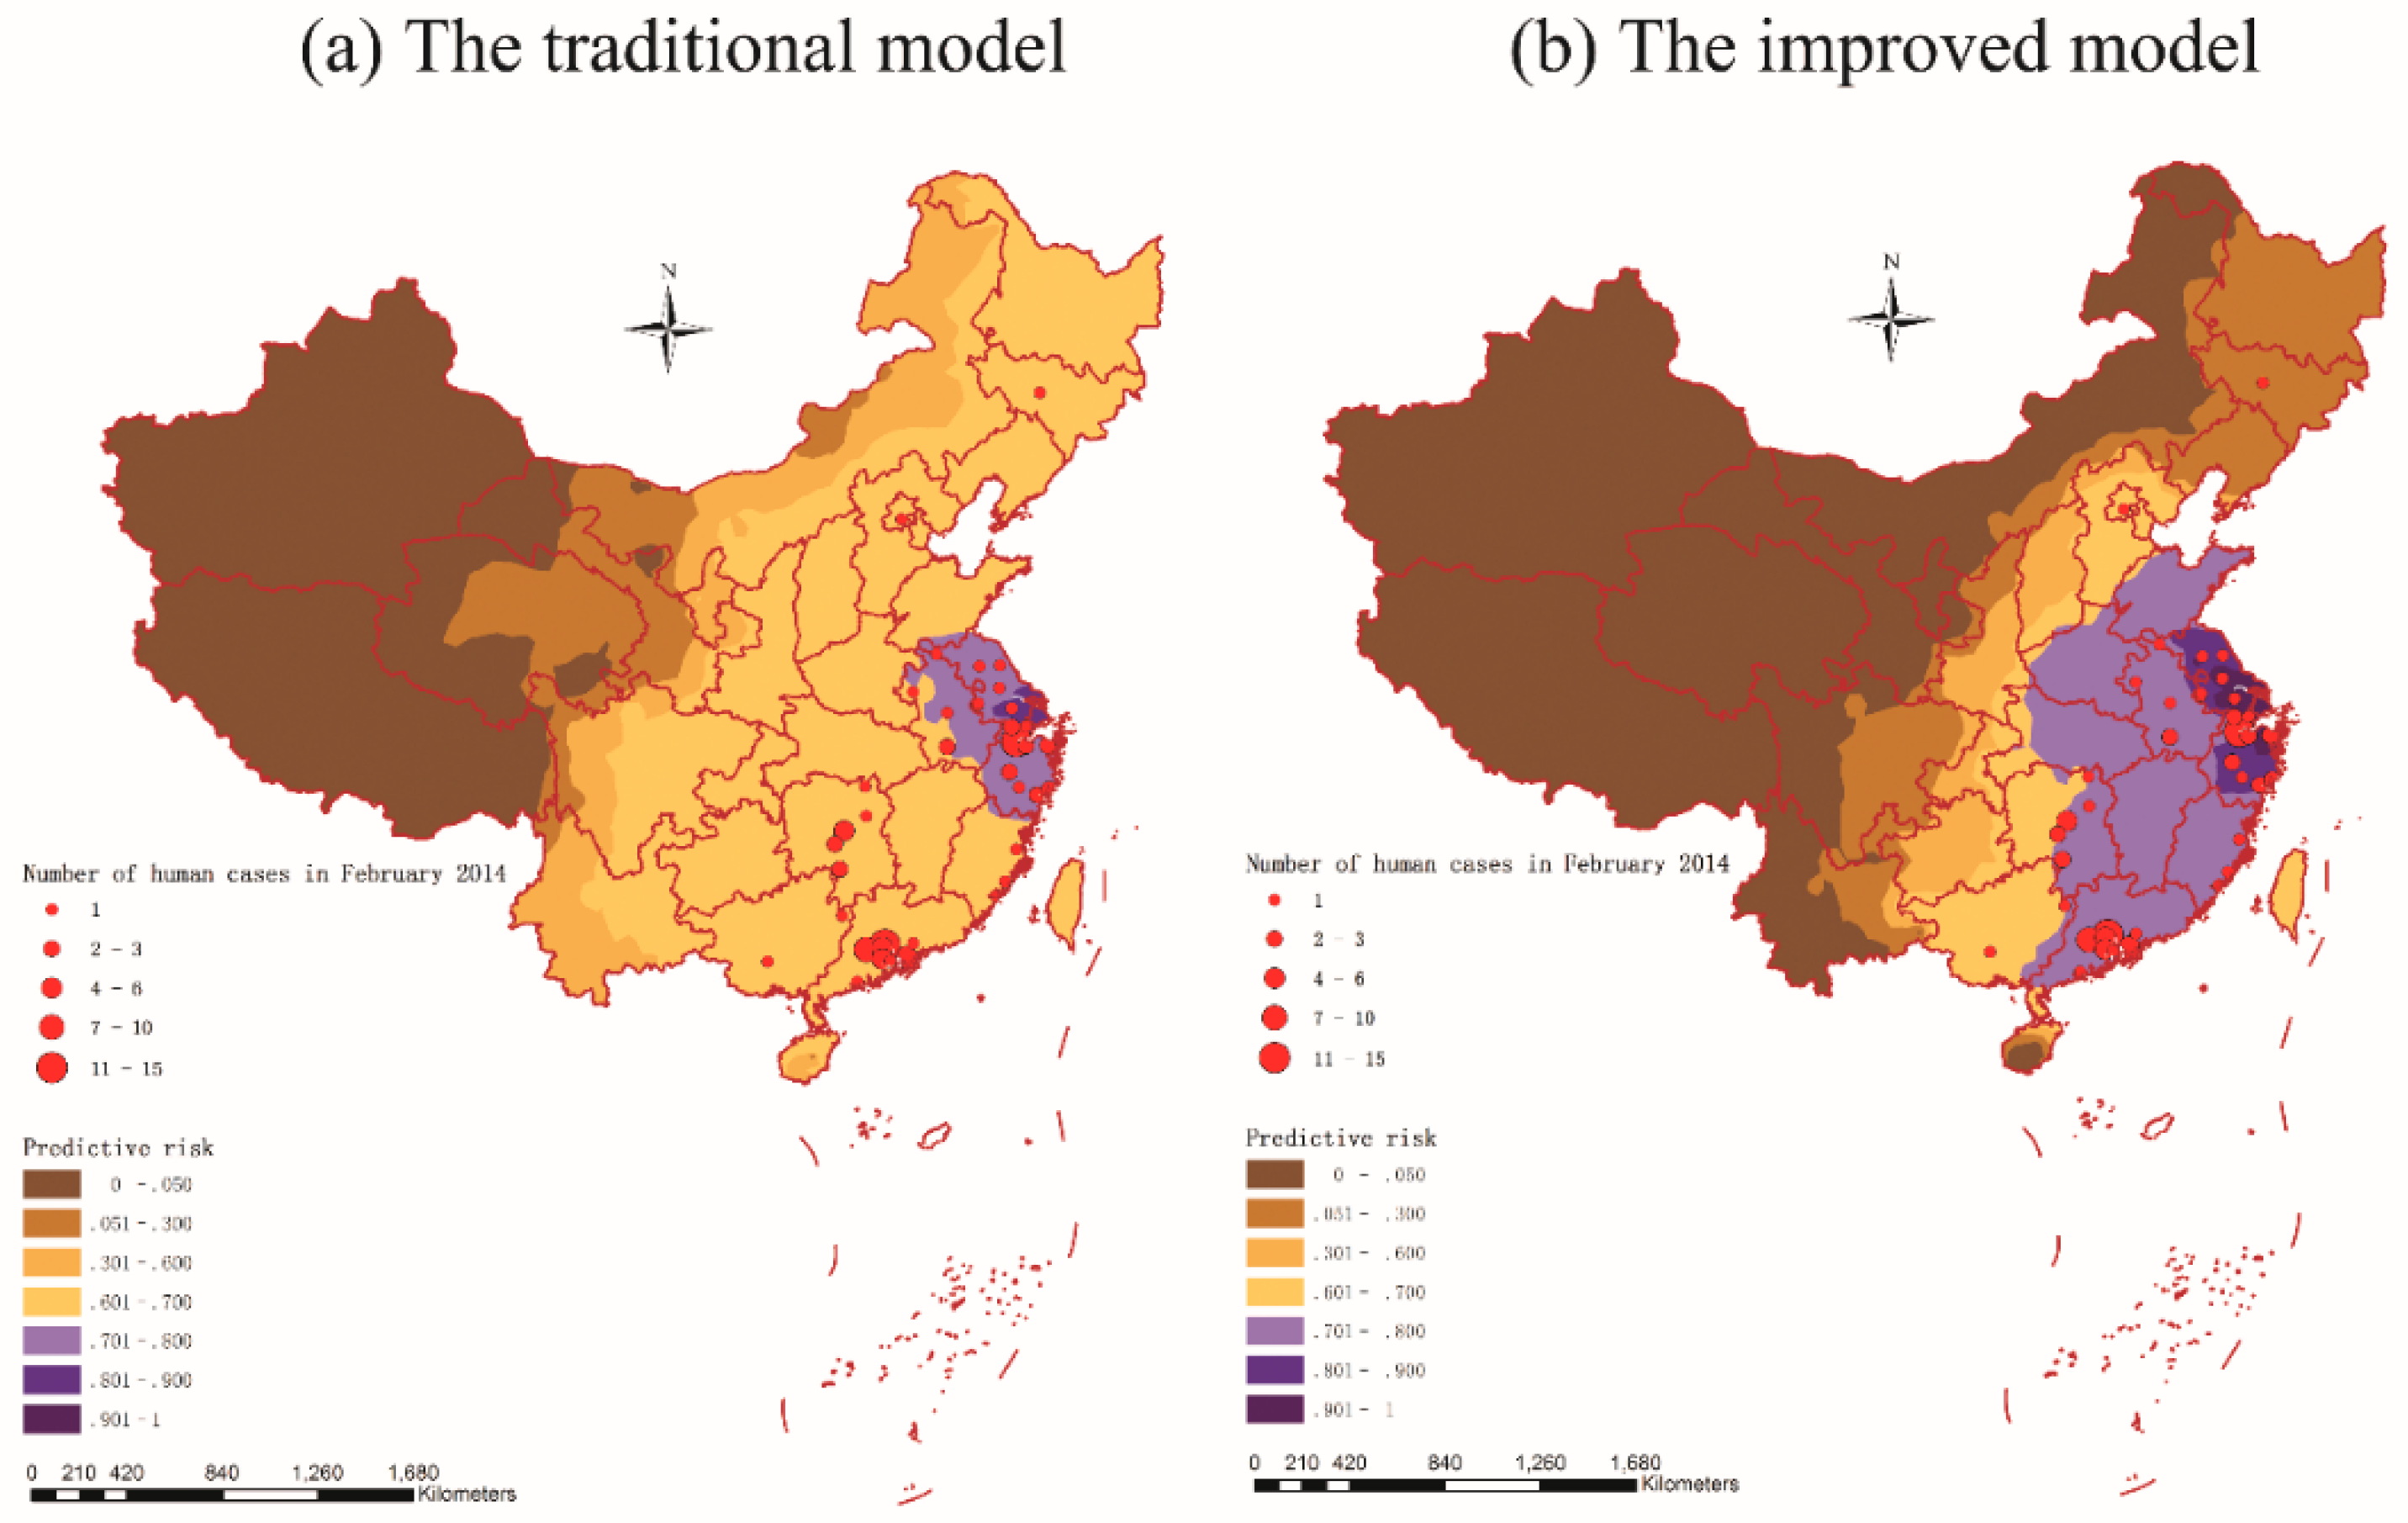
3.6. Prediction and Validation

4. Discussion
5. Conclusions
Acknowledgments
Author Contributions
Conflicts of Interest
References
- Cohen, J. New flu virus in China worries and confuses. Science 2013, 340, 129–130. [Google Scholar] [CrossRef] [PubMed]
- Huang, Y.; Xu, K.; Ren, D.F.; Ai, J.; Ji, H.; Ge, A.H.; Bao, C.J.; Shi, G.Q.; Shen, T.; Tang, F.Y.; et al. Probable longer incubation period for human infection with avian influenza A(H7N9) virus in Jiangsu province, China, 2013. Epidemiol. Infect. 2014, 142, 2647–2653. [Google Scholar] [CrossRef] [PubMed]
- Chen, L.; Zhu, F.; Xiong, C.L.; Zhang, Z.J.; Jiang, L.F.; Chen, Y.; Zhao, G.M.; Jiang, Q.W. Could a deletion in neuraminidase stalk strengthen human tropism of the novel avian influenza virus H7N9 in China, 2013? Int. J. Environ. Res. Public Health 2015, 12, 1020–1028. [Google Scholar] [CrossRef] [PubMed]
- World Health Organization. Global Alert and Response about H7N9 in World Health Organization (WHO) Website. The World Health Organization Website. Available online: http://www.who.int/csr/don/archive/country/chn/en/ (accessed on 15 January 2015).
- Liu, D.; Shi, W.; Shi, Y.; Wang, D.; Xiao, H.; Li, W.; Bi, Y.; Wu, Y.; Li, X.; Yan, J. Origin and diversity of novel avian influenza a H7N9 viruses causing human infection: Phylogenetic, structural, and coalescent analyses. Lancet 2013, 381, 1926–1932. [Google Scholar] [CrossRef]
- Gao, R.; Cao, B.; Hu, Y.; Feng, Z.; Wang, D.; Hu, W.; Chen, J.; Jie, Z.; Qiu, H.; Xu, K. Human infection with a novel avian-origin influenza A(H7N9) virus. N. Engl. J. Med. 2013, 368, 1888–1897. [Google Scholar] [CrossRef] [PubMed]
- Chen, Y.; Liang, W.; Yang, S.; Wu, N.; Gao, H.; Sheng, J.; Yao, H.; Wo, J.; Fang, Q.; Cui, D. Human infections with the emerging avian influenza a H7N9 virus from wet market poultry: Clinical analysis and characterisation of viral genome. Lancet 2013, 381, 1916–1925. [Google Scholar] [CrossRef]
- Li, X.-L.; Liu, K.; Yao, H.-W.; Sun, Y.; Chen, W.-J.; Sun, R.-X.; de Vlas, S.J.; Fang, L.-Q.; Cao, W.-C. Highly pathogenic avian influenza H5N1 in mainland China. Int. J. Environ. Res. Public Health 2015, 12, 5026–5045. [Google Scholar] [CrossRef] [PubMed]
- Pan, Y.-N.; Lou, J.-J.; Han, X.-P. Outbreak patterns of the novel avian influenza (H7N9). Phys. A Stat. Mech. Appl. 2014, 401, 265–270. [Google Scholar] [CrossRef]
- Chen, E.; Chen, Y.; Fu, L.; Chen, Z.; Gong, Z.; Mao, H.; Wang, D.; Ni, M.; Wu, P.; Yu, Z.; et al. Human infection with avian influenza A(H7N9) virus re-emerges in China in winter 2013. Euro. Surveill. 2013, 18, pii/20629. [Google Scholar] [CrossRef]
- Fang, L.-Q.; Li, X.-L.; Liu, K.; Li, Y.-J.; Yao, H.-W.; Liang, S.; Yang, Y.; Feng, Z.-J.; Gray, G.C.; Cao, W.-C. Mapping spread and risk of avian influenza A(H7N9) in China. Sci. Rep. 2013, 3, 2722. [Google Scholar] [CrossRef] [PubMed]
- Abdelwhab, E.M.; Veits, J.; Mettenleiter, T.C. Prevalence and control of H7 avian influenza viruses in birds and humans. Epidemiol. Infect. 2014, 142, 896–920. [Google Scholar] [CrossRef] [PubMed]
- Yu, H.; Wu, J.T.; Cowling, B.J.; Liao, Q.; Fang, V.J.; Zhou, S.; Wu, P.; Zhou, H.; Lau, E.H.; Guo, D. Effect of closure of live poultry markets on poultry-to-person transmission of avian influenza a H7N9 virus: An ecological study. Lancet 2014, 383, 541–548. [Google Scholar] [CrossRef]
- Xinhua News. Expert Review: The Clinical Symptoms between the Father and the Son with H7N9 Virus Infection in Shandong Province were Obviously Different, Difficult to Support the Probability of Human-to-Human Transmission of H7N9 Virus. The Xinhua News Website. Available online: http://news.xinhuanet.com/health/2013-04/29/c_115594440.htm (accessed on 11 August 2013).
- Nishiura, H.; Mizumoto, K.; Ejima, K. How to interpret the transmissibility of novel influenza A(H7N9): An analysis of initial epidemiological data of human cases from China. Theor. Biol. Med. Model. 2013, 10. [Google Scholar] [CrossRef] [PubMed]
- Cowling, B.J.; Jin, L.; Lau, E.H.; Liao, Q.; Wu, P.; Jiang, H.; Tsang, T.K.; Zheng, J.; Fang, V.J.; Chang, Z. Comparative epidemiology of human infections with avian influenza a H7N9 and H5N1 viruses in China: A population-based study of laboratory-confirmed cases. Lancet 2013, 382, 129–137. [Google Scholar] [CrossRef]
- Parry, J. H7N9 avian flu kills seven and infects 23 in China. BMJ 2013, 346. [Google Scholar] [CrossRef] [PubMed]
- Liao, Q.H.; Ip, D.K.M.; Tsang, T.K.; Cao, B.; Jiang, H.; Liu, F.F.; Zheng, J.D.; Peng, Z.B.; Wu, P.; Huai, Y.; et al. A clinical prediction rule for diagnosing human infections with avian influenza A(H7N9) in a hospital emergency department setting. BMC Med. 2014, 12. [Google Scholar] [CrossRef] [PubMed]
- Ai, J.; Huang, Y.; Xu, K.; Ren, D.; Qi, X.; Ji, H.; Ge, A.; Dai, Q.; Li, J.; Bao, C. Case-control study of risk factors for human infection with influenza A(H7N9) virus in Jiangsu province, China, 2013. Euro. Surveill. 2013, 18, 20510. [Google Scholar] [CrossRef] [PubMed][Green Version]
- Zhang, A.; Huang, Y.; Tian, D.; Lau, E.; Wan, Y.; Liu, X.; Dong, Y.; Song, Z.; Zhang, X.; Zhang, J. Kinetics of serological responses in influenza A(H7N9)-infected patients correlate with clinical outcome in China, 2013. Euro. Surveill. 2013, 18, 20657. [Google Scholar] [CrossRef] [PubMed]
- Gong, Z.Y.; Lv, H.K.; Ding, H.; Han, J.K.; Sun, J.M.; Chai, C.L.; Cai, J.; Yu, Z.; Chen, E.F. Epidemiology of the avian influenza A(H7N9) outbreak in zhejiang province, China. BMC Infect. Dis. 2014, 14. [Google Scholar] [CrossRef] [PubMed]
- He, F.; Zhang, M.; Wang, X.Y.; Wu, H.C.; Shang, X.P.; Li, F.D.; Wu, C.; Lin, J.F.; Zhu, B.P. Distinct risk profiles for human infections with the influenza A(H7N9) virus among rural and urban residents: Zhejiang province, China, 2013. PLoS ONE 2014, 9, e95015. [Google Scholar] [CrossRef] [PubMed][Green Version]
- Wang, C.; Yu, H.J.; Horby, P.W.; Cao, B.; Wu, P.; Yang, S.G.; Gao, H.N.; Li, H.; Tsang, T.K.; Liao, Q.H.; et al. Comparison of patients hospitalized with influenza a subtypes H7N9, H5N1, and 2009 pandemic H1N1. Clin. Infect. Dis. 2014, 58, 1095–1103. [Google Scholar] [CrossRef] [PubMed]
- Chen, X.R.; Yang, Z.G.; Lu, Y.F.; Xu, Q.N.; Wang, Q.; Chen, L. Clinical features and factors associated with outcomes of patients infected with a novel influenza A(H7N9) virus: A preliminary study. PLoS ONE 2013, 8, e73362. [Google Scholar] [CrossRef] [PubMed]
- Qiu, J.; Li, R.D.; Xu, X.J.; Hong, X.C.; Xia, X.; Yu, C.H. Spatiotemporal pattern and risk factors of the reported novel avian-origin influenza A(H7N9) cases in China. Prev. Vet. Med. 2014, 115, 229–237. [Google Scholar] [CrossRef] [PubMed]
- Martin, R.L.; Oeppen, J. The identification of regional forecasting models using space: Time correlation functions. Trans. Inst. Br. Geogr. 1975, 66, 95–118. [Google Scholar] [CrossRef]
- State Forestry Administration of the People’s Republic of China. The State Forestry Administration of the People’s Republic of China Website. Available online: http://www.forestry.gov.cn/ (accessed on 11 January 2015).
- National Fundamental Geographic Information System (China). The National Fundamental Geographic Information System (China) Website. Available online: http://nfgis.nsdi.gov.cn (accessed on 5 January 2015).
- Geospatial Data Cloud. The Geospatial Data Cloud Website. Available online: http://www.gscloud.cn/ (accessed on 3 February 2015).
- Data Sharing Infrastructure of Earth System Science (China). The Data Sharing Infrastructure of Earth System Science (China) Website. Available online: http://www.geodata.cn/Portal/index.jsp (accessed on 9 February 2015).
- Kanai, Y.; Ueta, M.; Germogenov, N.; Nagendran, M.; Mita, N.; Higuchi, H. Migration routes and important resting areas of Siberian cranes (Grus leucogeranus) between northeastern Siberia and China as revealed by satellite tracking. Biol. Conserv. 2002, 106, 339–346. [Google Scholar] [CrossRef]
- Prosser, D.J.; Takekawa, J.Y.; Newman, S.H.; Yan, B.; Douglas, D.C.; Hou, Y.; Xing, Z.; Zhang, D.; Li, T.; Li, Y. Satellite-marked waterfowl reveal migratory connection between H5N1 outbreak areas in China and mongolia. Ibis 2009, 151, 568–576. [Google Scholar] [CrossRef]
- Liu, J.; Xiao, H.; Lei, F.; Zhu, Q.; Qin, K.; Zhang, X.-W.; Zhang, X.-L.; Zhao, D.; Wang, G.; Feng, Y. Highly pathogenic H5N1 influenza virus infection in migratory birds. Science 2005, 309, 1206–1206. [Google Scholar] [CrossRef] [PubMed]
- Fang, L.Q.; de Vlas, S.J.; Liang, S.; Looman, C.W.N.; Gong, P.; Xu, B.; Yan, L.; Yang, H.; Richardus, J.H.; Cao, W.C. Environmental factors contributing to the spread of H5N1 avian influenza in mainland China. PLoS ONE 2008, 3, e2268. [Google Scholar] [CrossRef] [PubMed]
- National Bureau of Statistics of the People’s Republic of China. The National Bureau of Statistics of the People’s Republic of China Website. Available online: http://www.stats.gov.cn/tjsj/ (accessed on 22 August 2015).
- Wu, W.; Guo, J.-Q.; Yin, Z.-H.; Wang, P.; Zhou, B.-S. Gis-based spatial, temporal, and space-time analysis of haemorrhagic fever with renal syndrome. Epidemiol. Infect. 2009, 137, 1766–1775. [Google Scholar] [CrossRef] [PubMed]
- Moran, P.A. Notes on continuous stochastic phenomena. Biometrika 1950, 37, 17–23. [Google Scholar] [CrossRef] [PubMed]
- Kulldorff, M. SaTScan User Guide for Version 9.0. 2010. Available online: http://www.satscan.org/ (accessed on 25 November 2015).
- Kulldorff, M.; Heffernan, R.; Hartman, J.; Assuncao, R.; Mostashari, F. A space-time permutation scan statistic for disease outbreak detection. PLoS Med. 2005, 2, 216–224. [Google Scholar] [CrossRef] [PubMed]
- Zhang, W.Y. Spatiotemporal transmission dynamics of hemorrhagic fever with renal syndrome in China, 2005–2012. PLoS Negl. Trop. Dis. 2014, 8, e3344. [Google Scholar] [CrossRef] [PubMed]
- Tranmer, M.; Elliot, M. Binary Logistic Regression. Available online: http://link.springer.com/chapter/10.1007/978-1-4757-3462-1_10 (accessed on 25 November 2015).
- Gomez-Barroso, D.; Martinez-Beneito, M.; Flores, V.; Amorós, R.; Delgado, C.; Botella, P.; Zurriaga, O.; Larrauri, A. Geographical spread of influenza incidence in Spain during the 2009 a (H1N1) pandemic wave and the two succeeding influenza seasons. Epidemiol. Infect. 2014, 142, 2629–2641. [Google Scholar] [CrossRef] [PubMed]
- Zhang, Y.; Shen, Z.X.; Ma, C.N.; Jiang, C.S.; Feng, C.; Shankar, N.; Yang, P.; Sun, W.J.; Wang, Q.Y. Cluster of human infections with avian influenza a (H7N9) cases: A temporal and spatial analysis. Int. J. Environ. Res. Public Health 2015, 12, 816–828. [Google Scholar] [CrossRef] [PubMed]
- Hu, W.; Zhang, W.; Huang, X.; Clements, A.; Mengersen, K.; Tong, S. Weather variability and influenza A(H7N9) transmission in Shanghai, China: A bayesian spatial analysis. Environ. Res. 2015, 136, 405–412. [Google Scholar] [CrossRef] [PubMed]
- Abbas, T.; Wilking, H.; Staubach, C.; Ziller, M.; Conraths, F.J. Priority areas for surveillance and prevention of avian influenza during the water-bird migration season in Pakistan. Geosp. Health 2011, 6, 107–116. [Google Scholar] [CrossRef] [PubMed]
© 2015 by the authors; licensee MDPI, Basel, Switzerland. This article is an open access article distributed under the terms and conditions of the Creative Commons by Attribution (CC-BY) license (http://creativecommons.org/licenses/by/4.0/).
Share and Cite
Dong, W.; Yang, K.; Xu, Q.-L.; Yang, Y.-L. A Predictive Risk Model for A(H7N9) Human Infections Based on Spatial-Temporal Autocorrelation and Risk Factors: China, 2013–2014. Int. J. Environ. Res. Public Health 2015, 12, 15204-15221. https://doi.org/10.3390/ijerph121214981
Dong W, Yang K, Xu Q-L, Yang Y-L. A Predictive Risk Model for A(H7N9) Human Infections Based on Spatial-Temporal Autocorrelation and Risk Factors: China, 2013–2014. International Journal of Environmental Research and Public Health. 2015; 12(12):15204-15221. https://doi.org/10.3390/ijerph121214981
Chicago/Turabian StyleDong, Wen, Kun Yang, Quan-Li Xu, and Yu-Lian Yang. 2015. "A Predictive Risk Model for A(H7N9) Human Infections Based on Spatial-Temporal Autocorrelation and Risk Factors: China, 2013–2014" International Journal of Environmental Research and Public Health 12, no. 12: 15204-15221. https://doi.org/10.3390/ijerph121214981
APA StyleDong, W., Yang, K., Xu, Q.-L., & Yang, Y.-L. (2015). A Predictive Risk Model for A(H7N9) Human Infections Based on Spatial-Temporal Autocorrelation and Risk Factors: China, 2013–2014. International Journal of Environmental Research and Public Health, 12(12), 15204-15221. https://doi.org/10.3390/ijerph121214981