
The Effect of PM10 on Allergy Symptoms in Allergic Rhinitis Patients During Spring Season

 ,
,
Abstract
:1. Introduction
2. Patients
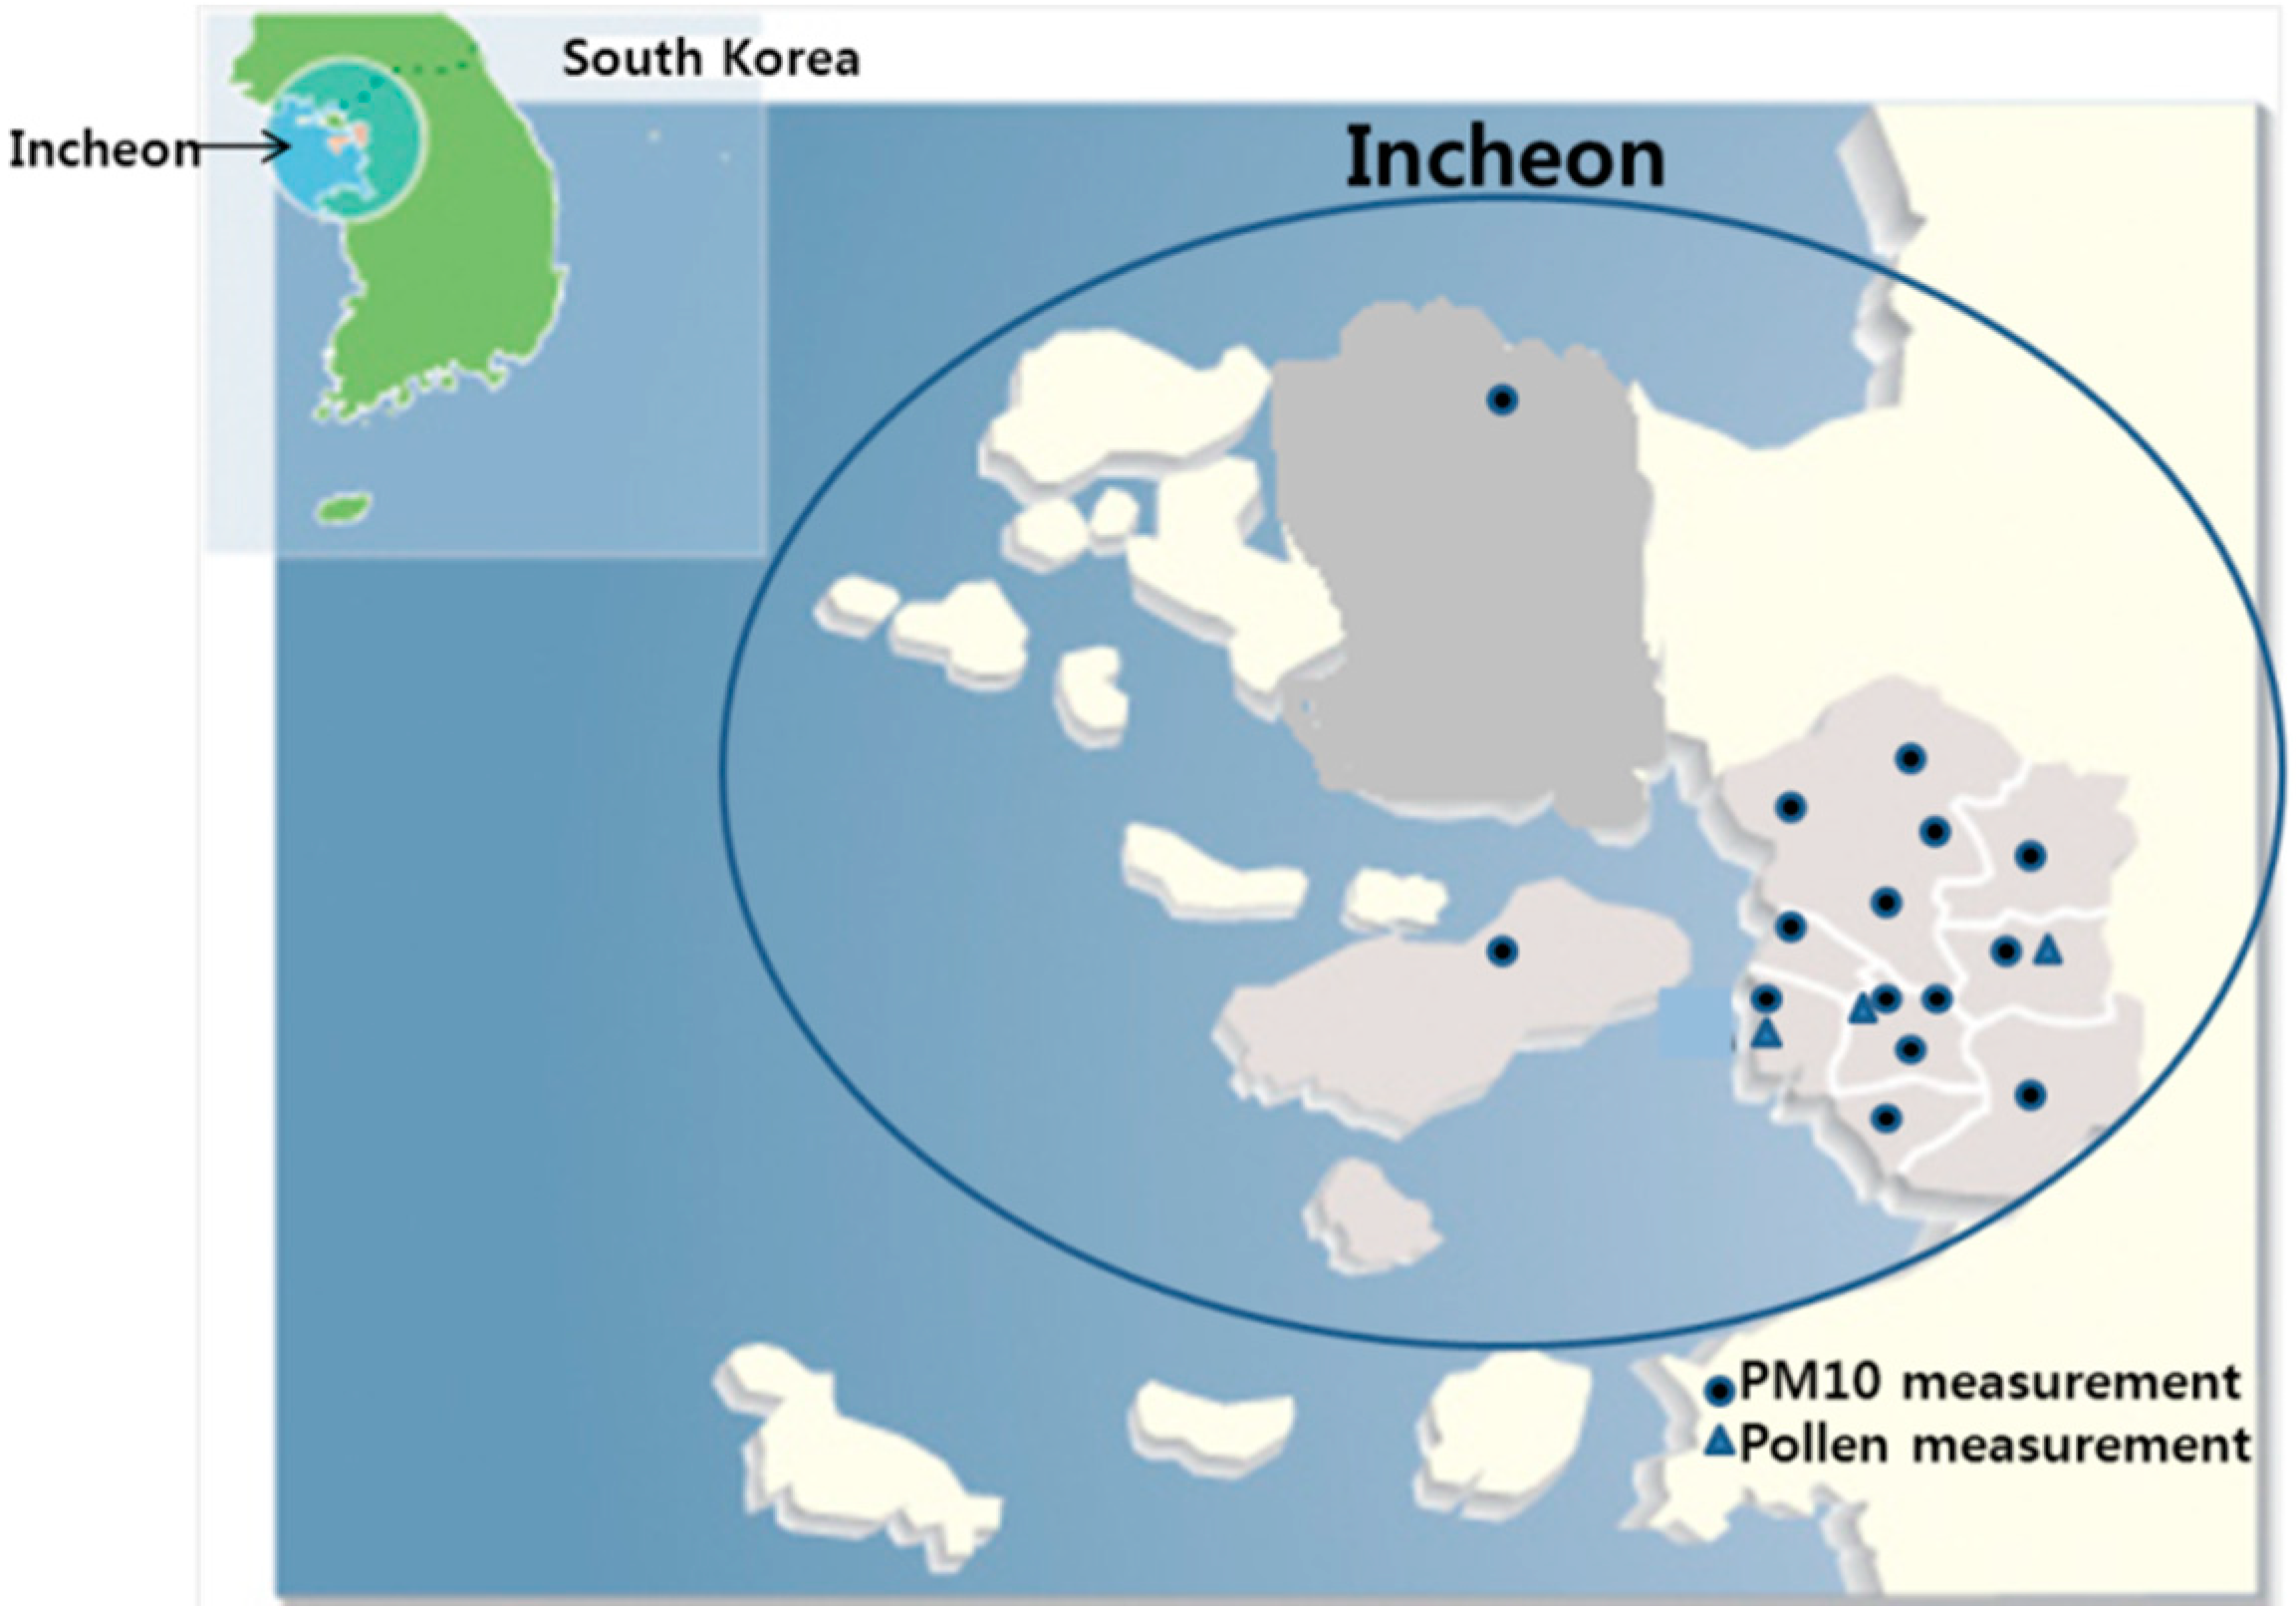
3. Methods

| Mar Day | 1 | 2 | 3 | 4 | 5 | 6 | 7 | 8 | 9 | 10 | 11 | 12 | 13 | 14 | 15 |
|---|---|---|---|---|---|---|---|---|---|---|---|---|---|---|---|
| 25 | 64 | 63 | 62 | 79 | 52 | 55 | 59 | 66 | 76 | 55 | 58 | 60 | 78 | 73 | 68 |
| 26 | 46 | 49 | 50 | 52 | 38 | 39 | 43 | 43 | 61 | 50 | 42 | 32 | 41 | 47 | 42 |
| 27 | 56 | 56 | 55 | 56 | 49 | 46 | 47 | 48 | 69 | 59 | 49 | 43 | 45 | 54 | 50 |
| 28 | 157 | 159 | 151 | 144 | 129 | 143 | 116 | 115 | 188 | 146 | 141 | 109 | 126 | 138 | 135 |
| 29 | 159 | 146 | 127 | 113 | 126 | 125 | 105 | 89 | 171 | 152 | 129 | 87 | 99 | 106 | 109 |
| 30 | 56 | 63 | 60 | 49 | 45 | 55 | 53 | 56 | 73 | 60 | 55 | 40 | 40 | 49 | 39 |
| 31 | 78 | 74 | 81 | 107 | 70 | 69 | 80 | 89 | 92 | 77 | 71 | 59 | 98 | 56 | 47 |

Statistical Analyses
4. Results
4.1. Patient Characteristics
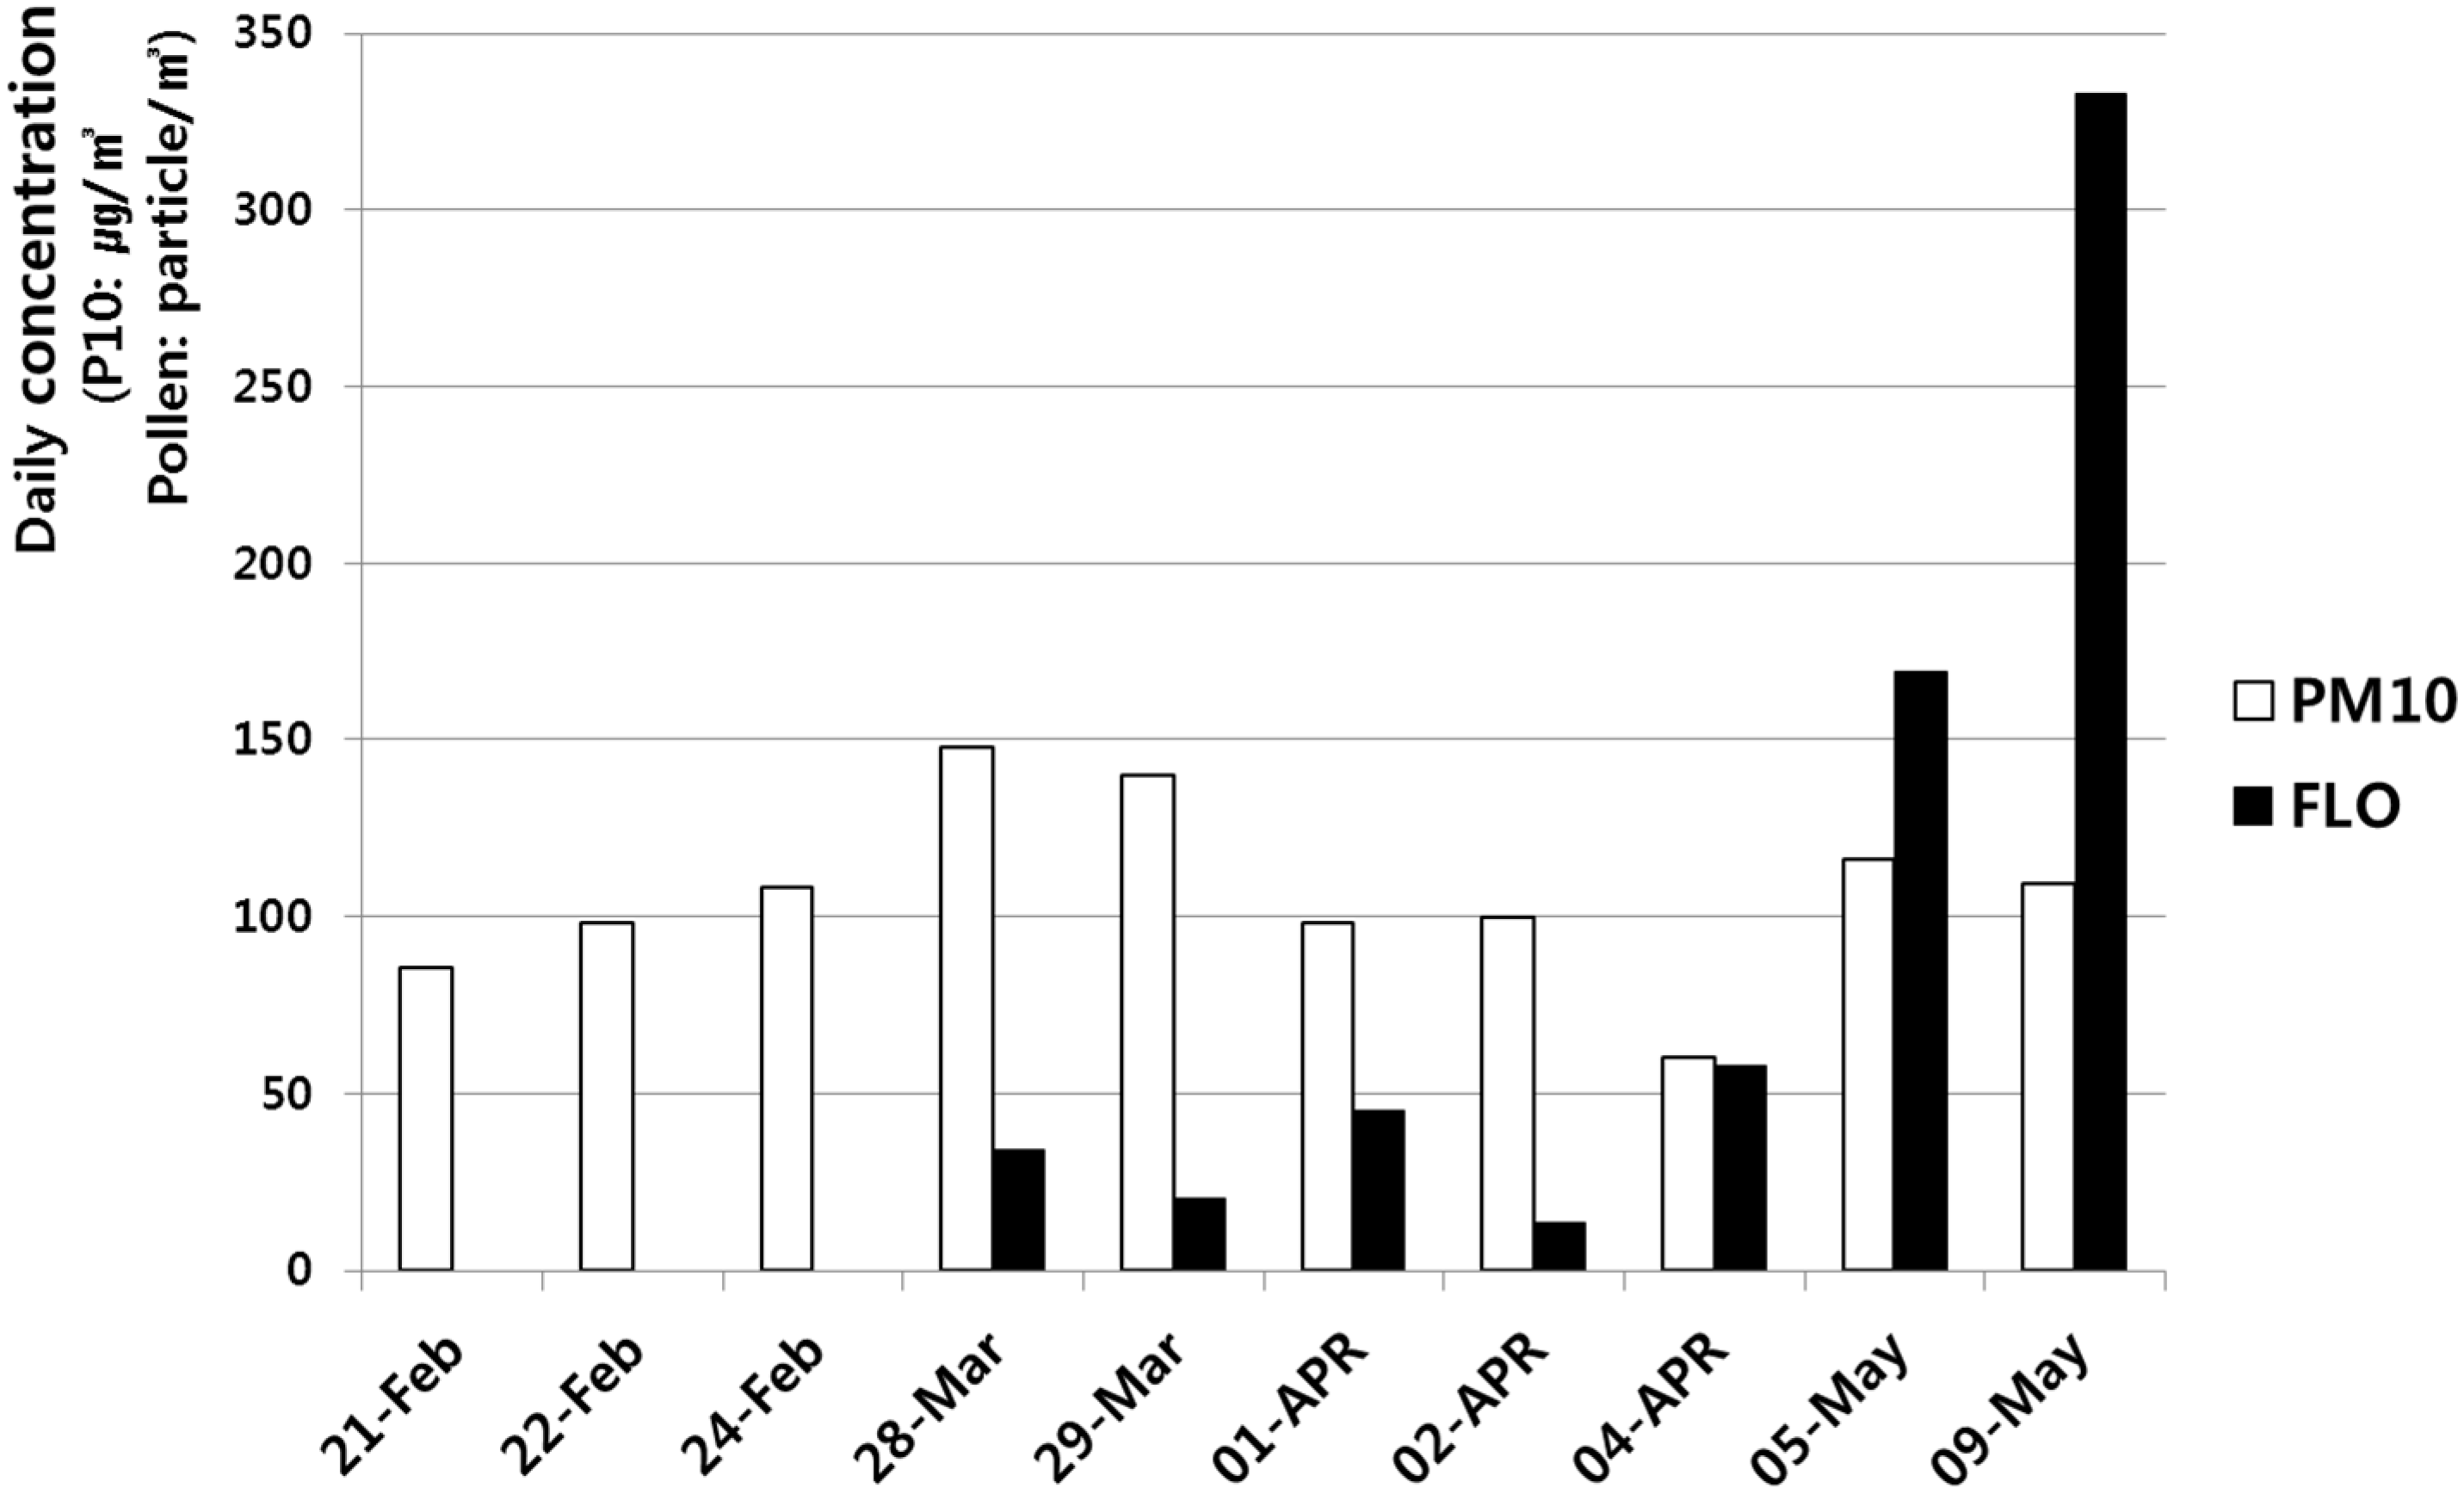
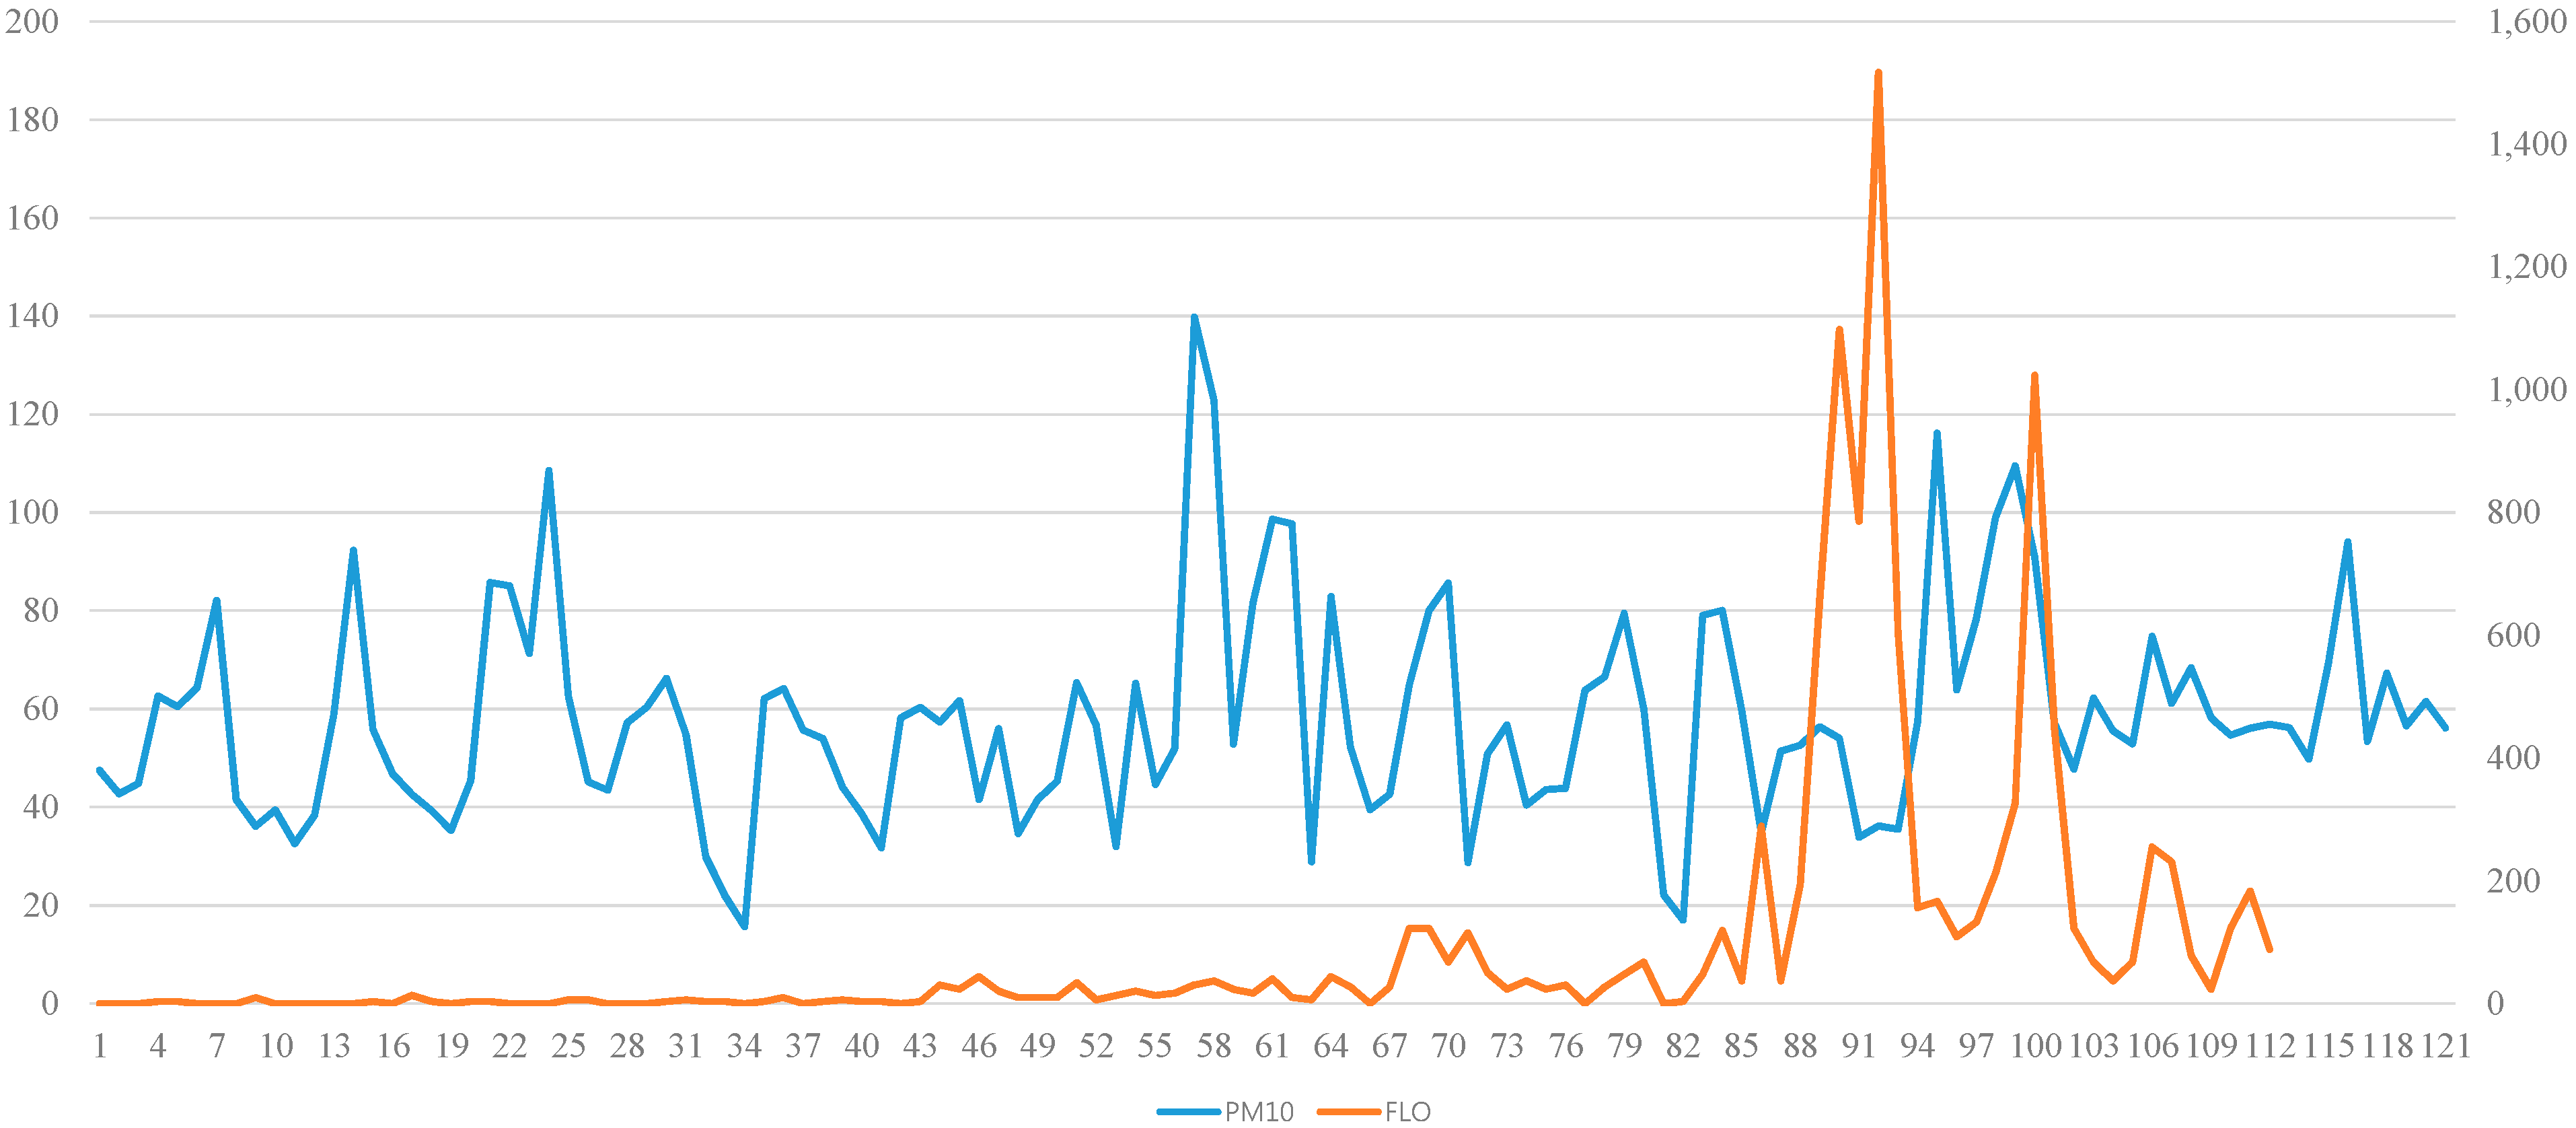
4.2. PM10 and Pollen Count Measurements
| Characteristics | Allergic Rhinitis Patients |
|---|---|
| Male/Female | 58/50 |
| Age | 6–12: 28.7% |
| 13–18: 17.7% | |
| 20–29: 22.5% | |
| 30–39: 14% | |
| ≥40: 17.1% | |
| ARIA class | I: 9.4% , II: 14.1%, III: 69.5%, IV: 7% |
| Associated disease | Atopic dermatitis: 28.8% |
| Asthma: 11.1% | |
| Sinusitis: 29.6% | |
| Allergy-related familial history | 54.4% |

4.3. The Effect of PM10 on Allergy Symptoms
| Pollen | Scientific Name | Genus Name |
|---|---|---|
| Tree | Abies | Needle Fir |
| Acer | Japanese Maple | |
| Castanea | Japanese Chestnut | |
| Euonymus | Wind Spindle Tree | |
| Myrica | Chinese Bayberry | |
| Pinus | Japanese Red Pine | |
| Quercus | Oak | |
| Salix | Korean Willow | |
| Ambrosia | Ragweed | |
| Herb | Artemisia | Wormwood |
| Gramineae | Rice | |
| Lilyaceae | Trumpet Lily |
| Effect | Estimate | Standard Error | p-value | |
|---|---|---|---|---|
| Rhinorrhea | allergy group | −0.00041 | 0.000306 | 0.1787 |
| control group | −0.000018 | 0.000254 | 0.9425 | |
| Itching | allergy group | −0.00037 | 0.000294 | 0.1201 |
| control group | 0.00010 | 0.000163 | 0.5210 | |
| Nasal Obstruction | allergy group | −0.00008 | 0.000320 | 0.7948 |
| control group | −0.00023 | 0.000340 | 0.4951 | |
| Sneezing | allergy group | −0.00033 | 0.000311 | 0.2240 |
| control group | −0.00005 | 0.000276 | 0.8623 | |
| Sleep disturbance | allergy group | −0.00037 | 0.000213 | 0.0809 |
| control group | 0.000047 | 0.000111 | 0.6729 | |
| Total symptom score | allergy group | −0.00160 | 0.000884 | 0.0694 |
| control group | −0.00069 | 0.000724 | 0.3377 | |
| Effect | Allergy Group | Control Group | ||||
|---|---|---|---|---|---|---|
| Estimate | Standard error | p-value | Estimate | Standard error | p-value | |
| FLO | −0.00028 | 0.000172 | 0.1015 | −0.00004 | 0.000083 | 0.6335 |
| OUT | 0.1243 | 0.007797 | <0.001 | 0.05990 | 0.007874 | <0.0001 |
| HUMID | −0.00055 | 0.001404 | 0.6973 | −0.00114 | 0.001249 | 0.3620 |
| TEMP | −0.00575 | 0.007319 | 0.4318 | −0.01008 | 0.006282 | 0.1087 |
| Effect | 24 February | 29 March | 5 May |
|---|---|---|---|
| Rhinorrhea | 0.88 | 0.41 | 0.72 |
| Itching | 0.88 | 0.67 | 0.24 |
| Nasal obstruction | 0.19 | 0.65 | 0.52 |
| Sneezing | 0.19 | 0.66 | 0.19 |
| Sleep disturbance | 0.67 | 0.72 | 0.48 |
| Total nasal score | 0.53 | 0.95 | 0.15 |
| Drug use | 0.49 | 0.53 | 0.49 |
| Days | Rhinorrhea | Sneezing | Nasal Obstruction | Itching | Sleep Disturbance | Total Score |
|---|---|---|---|---|---|---|
| Lag0 | ||||||
| p-value | 0.744 | 0.704 | 0.747 | 0.578 | 0.603 | 0.888 |
| Correlation | 0.030 | 0.035 | −0.030 | −0.051 | −0.048 | −0.013 |
| Lag1 | ||||||
| p-value | 0.937 | 0.567 | 0.642 | 0.924 | 0.979 | 0.717 |
| Correlation | −0.007 | −0.053 | −0.043 | −0.009 | −0.002 | −0.033 |
| Lag2 | ||||||
| p-value | 0.902 | 0.482 | 0.432 | 0.837 | 0.793 | 0.658 |
| Correlation | 0.011 | −0.065 | −0.073 | 0.019 | −0.024 | −0.041 |
| Effect | Estimate | Standard Error | p-value |
|---|---|---|---|
| PM10 | −0.00217 | 0.001398 | 0.1198 |
| Age | 0.01169 | 0.2142 | 0.9567 |
| Sex | 0.05494 | 0.8565 | 0.9492 |
5. Discussion
6. Conclusions
Acknowledgments
Author Contributions
Conflicts of Interest
References
- Kim, Y.K.; Song, S.K.; Lee, H.W.; Kim, C.H.; Oh, I.B.; Moon, Y.S.; Shon, Z.H. Characteristics of Asian dust transport based on synoptic meteorological analysis over Korea. J. Air Waste Manag. Assoc. 2006, 56, 306–316. [Google Scholar] [CrossRef] [PubMed]
- Kang, J.; Choi, M.S.; Lee, C.B. Atmospheric metal and phosphorus concentrations, inputs, and their biogeochemical significances in the Japan/East Sea. Sci. Total Environ. 2009, 15, 2270–2284. [Google Scholar] [CrossRef]
- Park, S.H.; Song, C.B.; Kim, M.C.; Kwon, S.B.; Lee, K.W. Study on size distribution of total aerosol and water-soluble ions during an Asian dust storm event at Jeju Island, Korea. Environ. Monit. Assess. 2004, 93, 157–183. [Google Scholar] [CrossRef] [PubMed]
- Han, J.S.; Moon, K.J.; Ahn, J.Y.; Hong, Y.D.; Kim, Y.J.; Ryu, S.Y.; Cliff, S.S.; Cahill, T.A. Characteristics of ion components and trace elements of fine particles at Gosan, Korea in spring time from 2001 to 2002. Environ. Monit. Assess. 2004, 92, 73–93. [Google Scholar] [CrossRef] [PubMed]
- Lei, Y.C.; Chan, C.C.; Wang, P.Y.; Lee, C.T.; Cheng, T.J. Effects of Asian dust event particles on inflammation markers in peripheral blood and bronchoalveolar lavage in pulmonary hypertensive rats. Envrion. Res. 2004, 95, 71–76. [Google Scholar] [CrossRef]
- Song, H.I. Effect of air pollution on childhood asthma living in Seoul. J. Asthma Allergy Clin. Immunol. 2001, 21, 28–39. [Google Scholar]
- Takizawa, H. Impact of air pollution on allergic diseases. Korean J. Intern. Med. 2011, 26, 262–273. [Google Scholar] [CrossRef] [PubMed]
- Chen, Y.S.; Sheen, P.C.; Chen, E.R.; Liu, Y.K.; Wu, T.N.; Yang, C.Y. Effects of Asian dust storm events on daily mortality in Taipei, Taiwan. Environ. Res. 2004, 95, 151–155. [Google Scholar] [CrossRef] [PubMed]
- Lee, J.T.; Son, J.Y.; Cho, Y.S. A comparison of mortality related to urban air particles between periods with Asian dust days and without Asian dust days in Seoul, Korea, 2000–2004. Environ. Res. 2007, 105, 409–413. [Google Scholar] [CrossRef] [PubMed]
- Kwon, H.J.; Cho, S.H.; Chun, Y.; Lagarde, F.; Pershagen, G. Effects of Asian dust storm events on daily mortality in Seoul, Korea. Environ. Res. 2002, 90, 1–5. [Google Scholar] [CrossRef] [PubMed]
- Park, J.W.; Lim, Y.H.; Kyung, S.Y.; An, C.H.; Lee, S.P.; Jeong, S.H.; Ju, Y.S. Effects of ambient particulate matter on peak expiratory flow rates and respiratory symptoms of asthmatics during Asian dust periods in Korea. Respirology 2005, 10, 470–476. [Google Scholar] [CrossRef] [PubMed]
- Tecer, L.H.; Alagha, O.; Karaca, F.; Tuncel, G.; Eldes, N. Particulate matter PM(2.5), PM(10–2.5), and PM(10)) and children’s hospital admissions for asthma and respiratory diseases: A bidirectional case-crossover study. J. Toxicol. Environ. Health. A 2008, 71, 512–520. [Google Scholar] [CrossRef] [PubMed]
- Kang, I.G.; Jung, J.H.; Kim, S.T. Asian sand dust enhances allergen-induced th2 allergic inflammatory changes and mucin production in BALB/c mouse lungs. Allergy Asthma Immunol. Res. 2012, 4, 206–213. [Google Scholar] [CrossRef] [PubMed]
- Jung, J.H.; Kang, I.G.; Cha, H.E.; Choe, S.H.; Kim, S.T. Effect of Asian sand dust on mucin production in NCI-H292 cells and allergic murine model. Otolaryngol. Head Neck Surg. 2012, 146, 887–894. [Google Scholar] [CrossRef] [PubMed]
- Kim, S.T.; Ye, M.K.; Shin, S.H. Effects of Asian sand dust on mucin gene expression and activation of nasal polyp epithelial cells. Am. J. Rhinol. Allergy 2011, 25, 303–306. [Google Scholar] [CrossRef] [PubMed]
- Ichinose, T.; Yoshida, S.; Sadakane, K.; Takano, H.; Yanagisawa, R.; Inoue, K.; Nishikawa, M.; Mori, I.; Kawazato, H.; Yasuda, A.; et al. Effects of Asian sand dust, Arizona sand dust, amorphous silica and aluminum oxide on allergic inflammation in the murine lung. Inhal. Toxicol. 2008, 20, 685–694. [Google Scholar] [CrossRef] [PubMed]
- Ichinose, T.; Hiyoshi, K.; Yoshida, S.; Takano, H.; Inoue, K.; Nishikawa, M.; Mori, I.; Kawazato, H.; Yasuda, A.; Shibamoto, T. Asian sand dust aggravates allergic rhinitis in guinea pigs induced by Japanese cedar pollen. Inhal. Toxicol. 2009, 21, 985–993. [Google Scholar] [CrossRef] [PubMed]
- Annesi-Maesano, I.; Moreau, D.; Caillaud, D.; Lavaud, F.; le Moullec, Y.; Taytard, A.; Pauli, G.; Charpin, D. Residential proximity fine particles related to allergic sensitization and asthma in primary school children. Respir. Med. 2007, 101, 1721–1729. [Google Scholar] [CrossRef] [PubMed]
- Nikasinovic, L.; Just, J.; Sahraoui, F.; Seta, N.; Grimfeld, A.; Momas, I. Nasal inflammation and personal exposure to fine particles PM2.5 in asthmatic children. J. Allergy Clin. Immunol. 2006, 117, 1382–1388. [Google Scholar] [CrossRef] [PubMed]
- Chang, C.C.; Lee, I.M.; Tsai, S.S.; Yang, C.Y. Correlation of Asian dust storm events with daily clinic visits for allergic rhinitis in Taipei, Taiwan. J. Toxicol. Environ. Health A 2006, 69, 229–235. [Google Scholar] [CrossRef] [PubMed]
- Hwang, B.F.; Jaakkola, J.J.; Lee, Y.L.; Lin, Y.C.; Guo, Y.L. Relation between air pollution and allergic rhinitis in Taiwanese school children. Respir. Res. 2006, 9. [Google Scholar] [CrossRef]
- Watanabe, M.; Yamasaki, A.; Burioka, N.; Kurai, J.; Yoneda, K.; Yoshida, A.; Igishi, T.; Fukuoka, Y.; Nakamoto, M.; Takeuchi, H.; et al. Correlation between Asian dust storms and worsening asthma in Western Japan. Allergol. Int. 2011, 60, 267–275. [Google Scholar] [CrossRef] [PubMed]
- Song, S.; Lee, K.; Lee, Y.M.; Lee, J.H.; Lee, S.I.; Yu, S.D.; Paek, D. Acute health effects of urban fine and ultrafine particles on children with atopic dermatitis. Environ. Res. 2011, 111, 394–399. [Google Scholar] [CrossRef] [PubMed]
- Yoo, Y.; Choung, J.T.; Yu, J.; Kim do, K.; Koh, Y.Y. Acute effects of Asian dust events on respiratory symptoms and peak expiratory flow in children with mild asthma. J. Korean Med. Sci. 2008, 23, 66–71. [Google Scholar] [CrossRef] [PubMed]
- Shima, M.; Nitta, Y.; Ando, M.; Adachi, M. Effects of air pollution on the prevalence and incidence of asthma in children. Arch. Environ. Health 2002, 57, 529–535. [Google Scholar] [CrossRef] [PubMed]
- Anderson, H.R.; Ruggles, R.; Pandey, K.D.; Kapetanakis, V.; Brunekreef, B.; Lai, C.K.; Strachan, D.P.; Weiland, S.K.; ISAAC Phase One Study Group. Ambient particulate pollution and the world-wide prevalence of asthma, rhinoconjunctivitis and eczema in children: Phase One of the International Study of Asthma and Allergies in Childhood (ISAAC). Occup. Environ. Med. 2010, 67, 293–300. [Google Scholar] [PubMed]
- Yang, C.Y.; Tsai, S.S.; Chang, C.C.; Ho, S.C. Effects of Asian dust storm events on daily admissions for asthma in Taipei, Taiwan. Inhal. Toxicol. 2005, 15, 817–821. [Google Scholar] [CrossRef]
© 2015 by the authors; licensee MDPI, Basel, Switzerland. This article is an open access article distributed under the terms and conditions of the Creative Commons Attribution license (http://creativecommons.org/licenses/by/4.0/).
Share and Cite
Kang, I.G.; Ju, Y.H.; Jung, J.H.; Ko, K.P.; Oh, D.K.; Kim, J.H.; Lim, D.H.; Kim, Y.H.; Jang, T.Y.; Kim, S.T. The Effect of PM10 on Allergy Symptoms in Allergic Rhinitis Patients During Spring Season. Int. J. Environ. Res. Public Health 2015, 12, 735-745. https://doi.org/10.3390/ijerph120100735
Kang IG, Ju YH, Jung JH, Ko KP, Oh DK, Kim JH, Lim DH, Kim YH, Jang TY, Kim ST. The Effect of PM10 on Allergy Symptoms in Allergic Rhinitis Patients During Spring Season. International Journal of Environmental Research and Public Health. 2015; 12(1):735-745. https://doi.org/10.3390/ijerph120100735
Chicago/Turabian StyleKang, Il Gyu, Youn Hee Ju, Joo Hyun Jung, Kwang Pil Ko, Dae Kyu Oh, Jeong Hee Kim, Dae Hyun Lim, Young Hyo Kim, Tae Young Jang, and Seon Tae Kim. 2015. "The Effect of PM10 on Allergy Symptoms in Allergic Rhinitis Patients During Spring Season" International Journal of Environmental Research and Public Health 12, no. 1: 735-745. https://doi.org/10.3390/ijerph120100735
APA StyleKang, I. G., Ju, Y. H., Jung, J. H., Ko, K. P., Oh, D. K., Kim, J. H., Lim, D. H., Kim, Y. H., Jang, T. Y., & Kim, S. T. (2015). The Effect of PM10 on Allergy Symptoms in Allergic Rhinitis Patients During Spring Season. International Journal of Environmental Research and Public Health, 12(1), 735-745. https://doi.org/10.3390/ijerph120100735